
Impact of Compression and Small Cell Deployment on NB-IoT Devices Coverage and Energy Consumption with a Realistic Simulation Model


Abstract
1. Introduction
2. System Modeling
2.1. Path Loss
- The user Equipment (UE) such as a smart meter is inside the same house as a small cell (Femto cell or Pico-cell) Base Station (BS);
- The UE is outside of the building;
- The UE is inside a different house which will add and to the path-loss model for the wall attenuation in buildings one and two, respectively.
2.2. Shadow Fading
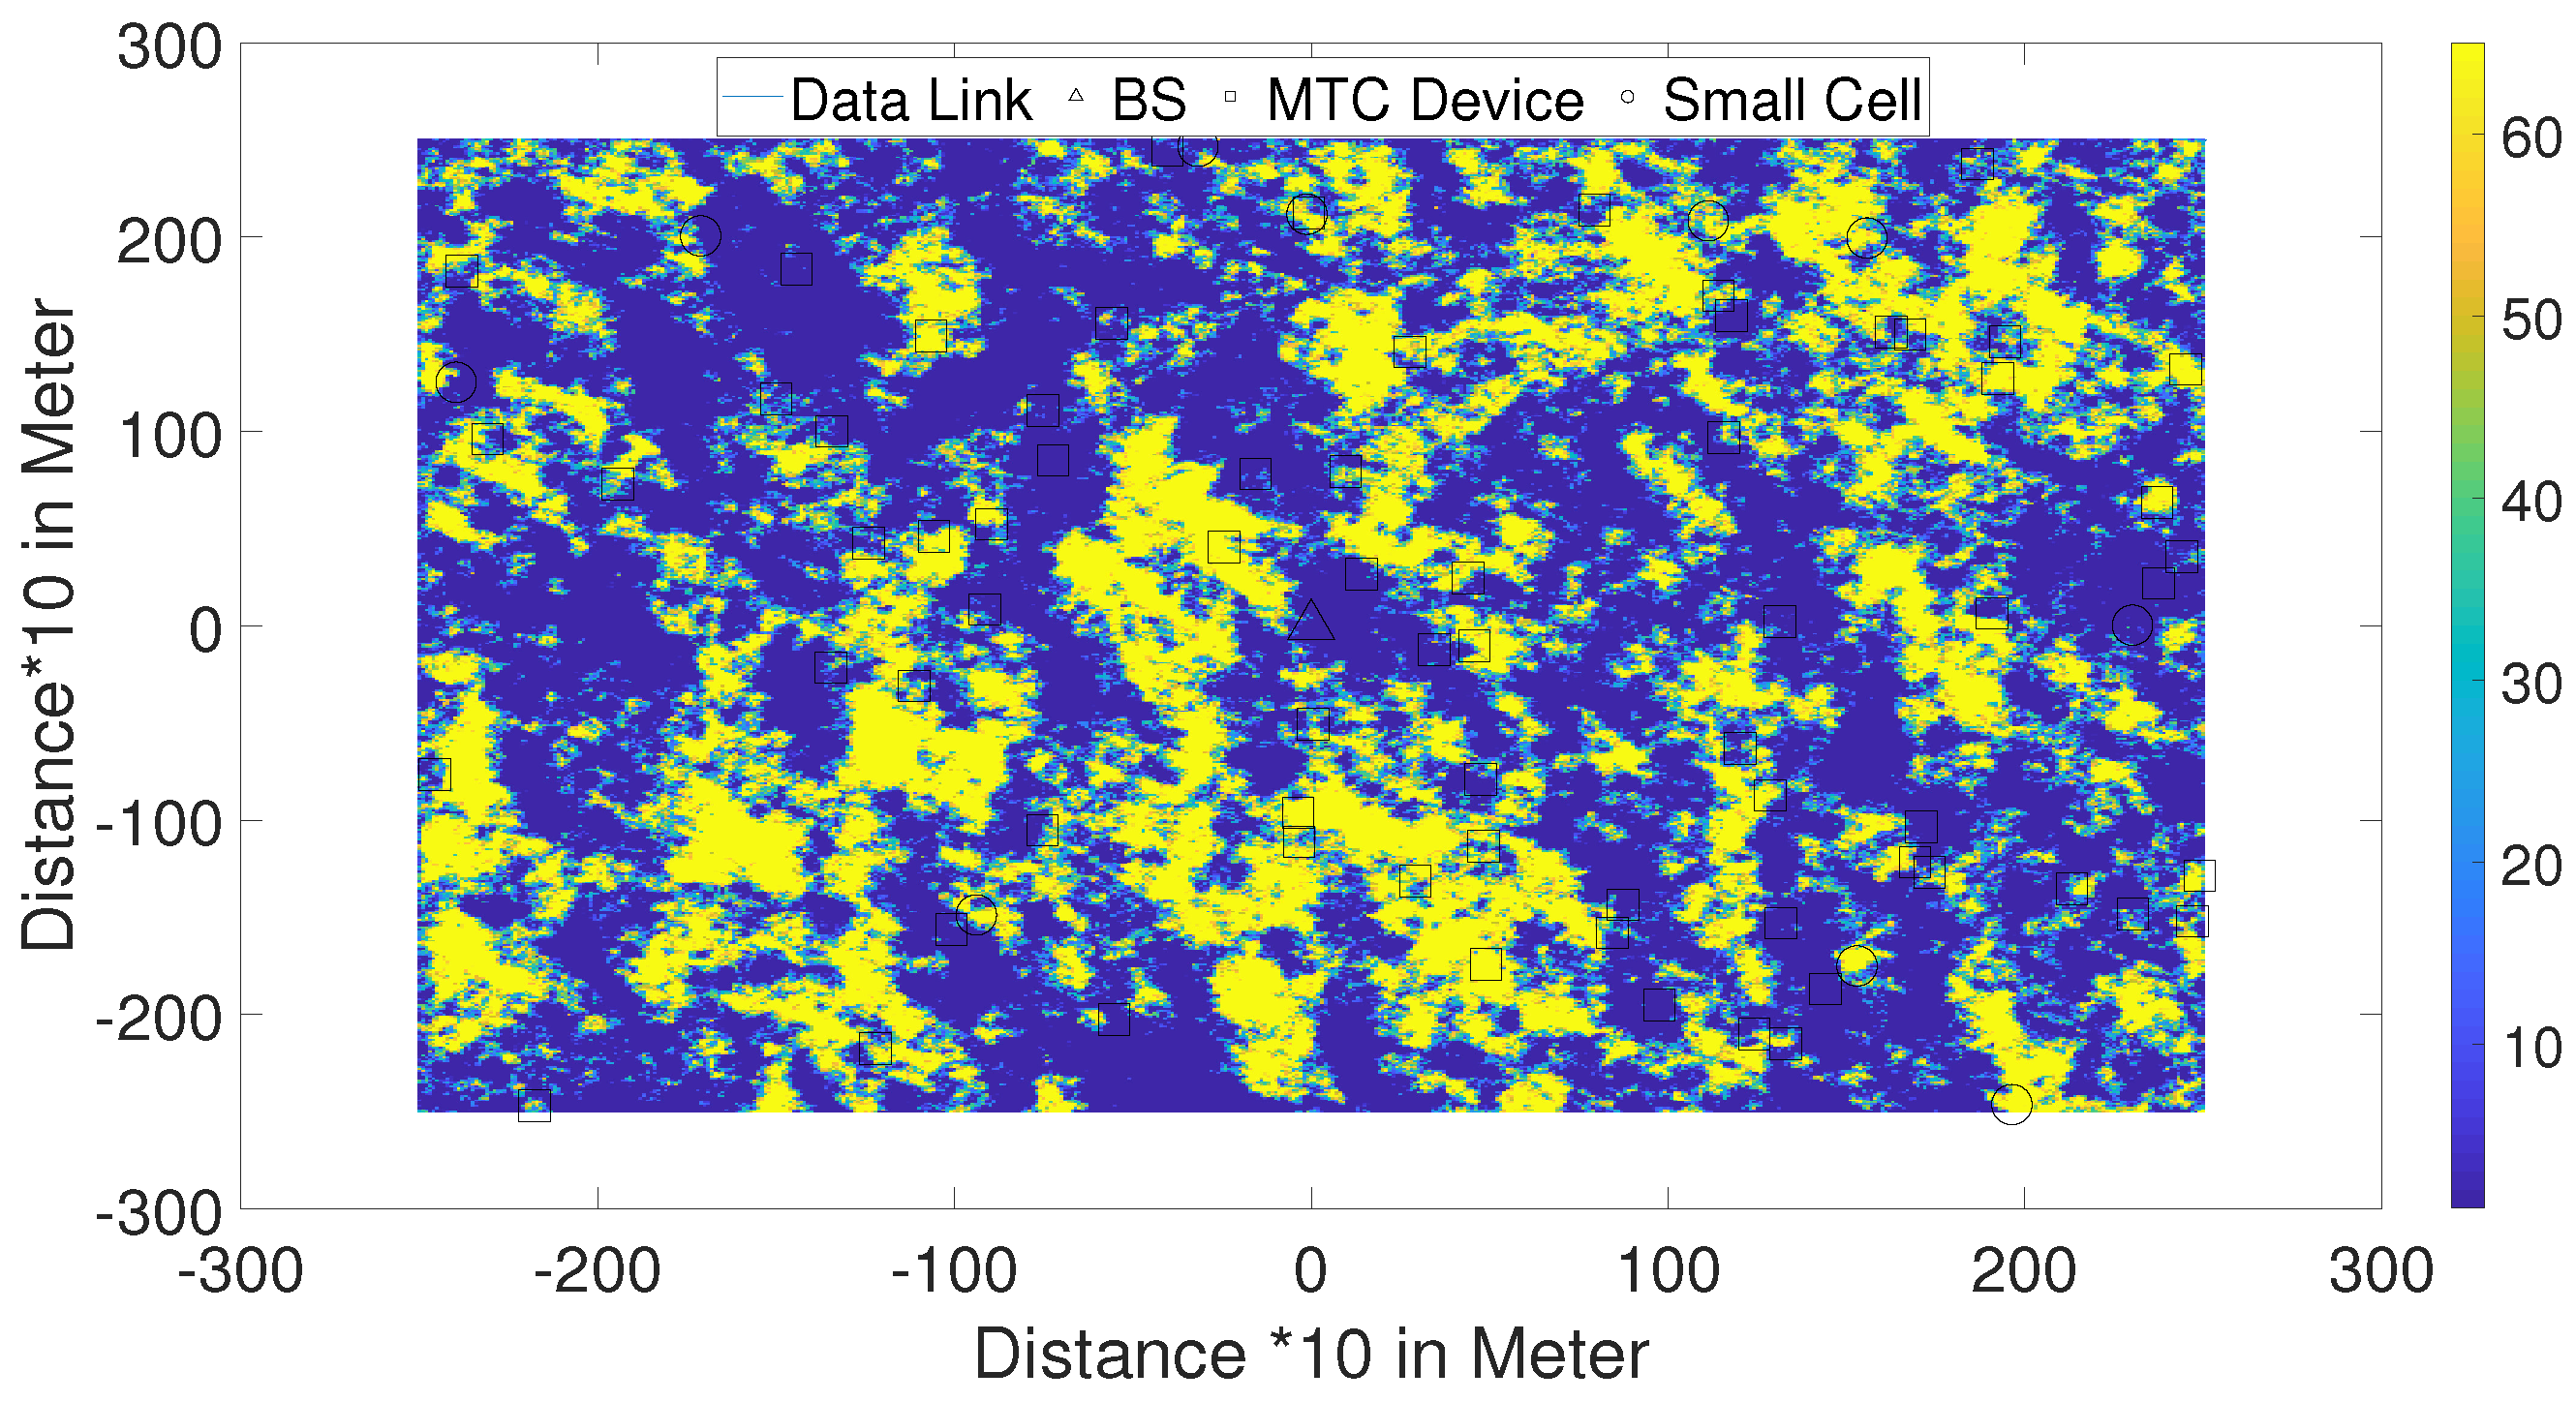
- According to the geometry of the UE and BS and the path-loss model, we measured the received signal power level in the location of the UE devices.
- Finally, we calculate the percentage of UE devices in outage. Then we implement the D2D communication scenario or add small cells randomly to the map. Again, we calculate the received signal level from nearby UE devices for the D2D communication scenario or the small cell assisted scenario. Using the data provided below in Section 3, the MCL can be computed for the D2D/small cell wireless links to identify the improvement of outage for UE devices.
2.3. NB-IoT Energy Consumption Modeling Based on 3GPP Standards
- Energy consumption measurement of each circuit in the building;
- Applying compression techniques to the collected data to reduce the size of data using smart meter hardware
- Updating the Energy Data Center (EDC) information by transmitting the compressed data or detecting an unusual situation to activate an alarm, by creating a data packet of duration Message .
2.4. Network Power Consumption Modeling
- The Packet Repetition Factor
- The Radio Power
- The Number of Retransmissions
2.5. Power Consumption Modeling for Data Processing
2.6. Power Consumption Modeling of Data Acquisition
- Monitoring regularly the power system which can happen periodically with a fixed time interval in between;
- Monitoring power systems in an event-driven way, observing exceptional cases that happen randomly or due to alarms.
2.7. Modeling of Energy Consumption for NB-IoT according to 3GPP Standards
3. Simulation Results
4. Testbed Results
Impact of Compression on Cellular Communications Latency
5. Conclusions
Author Contributions
Funding
Institutional Review Board Statement
Informed Consent Statement
Data Availability Statement
Acknowledgments
Conflicts of Interest
References
- Shariatmadari, H.; Ratasuk, R.; Iraji, S.; Laya, A.; Taleb, T.; Jäntti, R.; Ghosh, A. Machine-type communications: Current status and future perspectives toward 5G systems. IEEE Commun. Mag. 2015, 53, 10–17. [Google Scholar] [CrossRef]
- Raza, U.; Kulkarni, P.; Sooriyabandara, M. Low power wide area networks: An overview. IEEE Commun. Surv. Tutor. 2017, 19, 855–873. [Google Scholar] [CrossRef]
- Zeinali, M.; Thompson, J.; Khirallah, C.; Gupta, N. Evolution of Home Energy Management and Smart Metering Communications towards 5G. In Proceedings of the Network of the Future (NoF) Conference, London, UK, 22–24 November 2017. [Google Scholar]
- Mekki, K.; Bajic, E.; Chaxel, F.; Meyer, F. A comparative study of LPWAN technologies for large-scale IoT deployment. ICT Express 2019, 5, 1–7. [Google Scholar] [CrossRef]
- Cellular System Support for Ultra Low Complexity and Low Throughput Internet of Things. 3GPP, Sophia Antipolis, France, Rep. TR 45.820. Available online: https://tinyurl.com/3d6fkvcr (accessed on 1 May 2017).
- Bima, I.W.K.; Suryani, V.; Wardana, A.A. A Performance Analysis of General Packet Radio Service (GPRS) and Narrowband Internet of Things (NB-IoT) in Indonesia. Kinet. Game Technol. Inf. Syst. Comput. Netw. Comput. Electron. Control 2020, 5, 11–20. [Google Scholar] [CrossRef]
- Chen, J.; Hu, K.; Wang, Q.; Sun, Y.; Shi, Z.; He, S. Narrowband Internet of Things: Implementations and applications. IEEE Internet Things J. 2017, 4, 2309–2314. [Google Scholar] [CrossRef]
- Lauridsen, M.; Kovacs, I.Z.; Mogensen, P.; Sorensen, M.; Holst, S. Coverage and Capacity Analysis of LTE-M and NB-IoT in a Rural Area. In Proceedings of the 2016 IEEE 84th Vehicular Technology Conference (VTC-Fall), Montreal, QC, Canada, 18–21 September 2016. [Google Scholar]
- Wan, L.; Zhang, Z.; Huang, Y.; Yan, Y.; Wang, J. Performance Analysis of NB-IoT Technology for Indoor IoT Applications. In Proceedings of the 2017 International Conference on Computer Technology, Electronics and Communication (ICCTEC), Dalian, China, 19–21 December 2017; pp. 1365–1369. [Google Scholar]
- Vieira, R.D.; Paiva, R.C.D.; Hulkkonen, J.; Jarvela, R.; Iida, R.F.; Saily, M.; Tavares, F.M.; Niemela, K. GSM evolution importance in re-farming 900 MHz band, Vehicular Technology Conference 2010. In Proceedings of the 2010 IEEE 72nd Vehicular Technology Conference—Fall, Ottawa, ON, Canada, 6–9 September 2010. [Google Scholar]
- Series, P. (ITU-R) 2012, Propagation Data and Prediction Methods for the Planning of Indoor Radio Communications Systems and Radio Local Area Networks in the Frequency Range 900 MHz to 100 GHz, Recommendation ITU-R P. 1238-7 (02/2012), Geneva, viewed 1 February 2013. Available online: https://www.itu.int/rec/R-REC-P.1238 (accessed on 1 September 2017).
- 3GPP. Evolved Universal Terrestrial Radio Access (E-UTRA); Further Advancements for E-UTRA Physical Layer Aspects. Tech. Rep. 36.814. Available online: https://tinyurl.com/4rprwp78 (accessed on 1 July 2017).
- Claussen, H. Efficient modelling of channel maps with correlated shadow fading in mobile radio systems. In Proceedings of the 2005 IEEE 16th International Symposium on Personal, Indoor and Mobile Radio Communications, Berlin, Germany, 11–14 September 2005; pp. 512–516. [Google Scholar]
- Nechibvute, A.; Chawanda, A.; Luhanga, P. Piezoelectric Energy Harvesting Devices: An Alternative Energy Source for Wireless Sensors. HINDAWI, Volume 2012. Available online: https://tinyurl.com/36uwma4j (accessed on 1 July 2017).
- Martinez, B.; Montón, M.; Vilajosana, I.; Prades, J.D. The power of models: Modeling power consumption for IoT devices. IEEE Sens. 2015, 15, 5777–5789. [Google Scholar] [CrossRef]
- Vilajosana, X.; Wang, Q.; Chraim, F.; Watteyne, T.; Chang, T.; Pister, K.S.J. A realistic energy consumption model for TSCH networks. IEEE Sens. 2014, 14, 482489. [Google Scholar] [CrossRef]
- Zeinali, M.; Thompson, J. Impact of compression and aggregation in wireless networks on smart meter data. In Proceedings of the IEEE International Workshop on Signal Processing Advances in Wireless Communications, Edinburgh, UK, 3–6 July 2016. [Google Scholar]
- Zordan, D.; Martinez, B.; Vilajosana, I.; Rossi, M. On the performance of lossycompression schemes for energy constrained sensor networking. ACM Trans. Sens. Netw. 2014, 11, 1–34. [Google Scholar] [CrossRef]
- Lauridsen, M.; Krigslund, R.; Rohr, M.; Madueno, G. An Empirical NB-IoT Power Consumption Model for Battery Lifetime Estimation. In Proceedings of the 2018 IEEE 87th Vehicular Technology Conference (VTC Spring), Porto, Portugal, 3–6 June 2018; pp. 1–5. [Google Scholar]
- Welch, T. A technique for high-performance data compression. Computer 1984, 17, 819. [Google Scholar] [CrossRef]
- Huffman, D. A method for the construction of minimum-redundancy codes. Proc. IRE 1952, 40, 10981101. [Google Scholar] [CrossRef]
- Kolter, J.Z.; Johnson, M.J. Redd: A public data set for energy disaggregation research. In Proceedings of the SustKDD Workshop on Data Mining Applications in Sustainability, San Diego, CA, USA, 21 August 2011; p. 16. [Google Scholar]
- Zeinali, M.; Thompson, J. Comprehensive practical evaluation of wired and wireless internet base smart grid communication. IET Smart Grid J. 2021, 2515–2947. [Google Scholar]
- Jambek, A.B.; Khairi, N.A. Performance comparison of Huffman and Lempel-Ziv Welch data compression for wireless sensor node application. Am. J. Appl. Sci. 2014, 11, 119–126. [Google Scholar] [CrossRef][Green Version]
- Zeinali, M.; Thompson, J.S. Implementation of Highly Accurate Test-Bed for Practical Evaluation of Wired and Wireless Internet Based Smart Grid Communications. In Proceedings of the 2019 UK/China Emerging Technologies (UCET), Glasgow, UK, 21–22 August 2019; pp. 1–4. [Google Scholar]
- Zeinali, M.; Bayram, I.S.; Thompson, J. Performance Assessment of UK’s Cellular Network for Vehicle to Grid Energy Trading: Opportunities for 5G and Beyond. In Proceedings of the 2020 IEEE International Conference on Communications Workshops (ICC Workshops), Dublin, Ireland, 7–11 June 2020; pp. 1–6. [Google Scholar]
- Matz, A.P.; Fernandez-Prieto, J.A.; Birkel, U. A Systematic Analysis of Narrowband IoT Quality of Service. Sensors 2020, 20, 1636. [Google Scholar] [CrossRef]
- Heron, J.W.; Jiang, J.; Sun, H.; Gezerlis, V.; Doukoglou, T. Demand-Response Round-Trip Latency of IoT SmartGrid Network Topologies. IEEE Access 2018, 6, 22930–22937. [Google Scholar] [CrossRef]
- Malik, H.; Alam, M.M.; Moullec, Y.L.; Kuusik, A. NarrowBand-IoT Performance Analysis for Healthcare Applications. Procedia Comput. Sci. 2018, 130, 1077–1083. [Google Scholar] [CrossRef]
- Ratasuk, R.; Vejlgaard, B.; Mangalvedhe, N.; Ghosh, A. NB-IoT system for M2M communication. In Proceedings of the 2016 IEEE Wireless Communications and Networking Conference, Doha, Qatar, 3–6 April 2016; pp. 1–5. [Google Scholar]


| NB-IoT | 3GPP Model [5] | Actual Devices [19] |
|---|---|---|
| Standby | 0.015 mW | 0.013–0.035 mW |
| Sleep | 3 mW | 21–23 mW |
| Transmit | 480 mW | 716–840 mW |
| Receive | 75 mW | 213–240 mW |
| Parameters | Values |
|---|---|
| NB-IoT Macro-cell Radius | 6 km |
| Path-loss model Base Station-IoT Device distance: d(km) | Equations (3) and (4) |
| Log-normal fading standard deviation | from shadow-fading map |
| Femto eNB EIRP | 20 dBm |
| Pico eNB EIRP | 35 dBm |
| Maximum Transmit Power of MTC device | 23 dBm |
| Maximum Transmit Power of Main BS | 46 dBm |
| Number of Small Cells | Up to 200 |
| Number of MTC Devices | 300 and up to 1000 for the D2D scenario |
| for NB-IoT | 900 MHz |
| Communication Technology | Percentage of Users in Outage |
|---|---|
| LTE | 71 |
| NB-IoT | 28.6 |
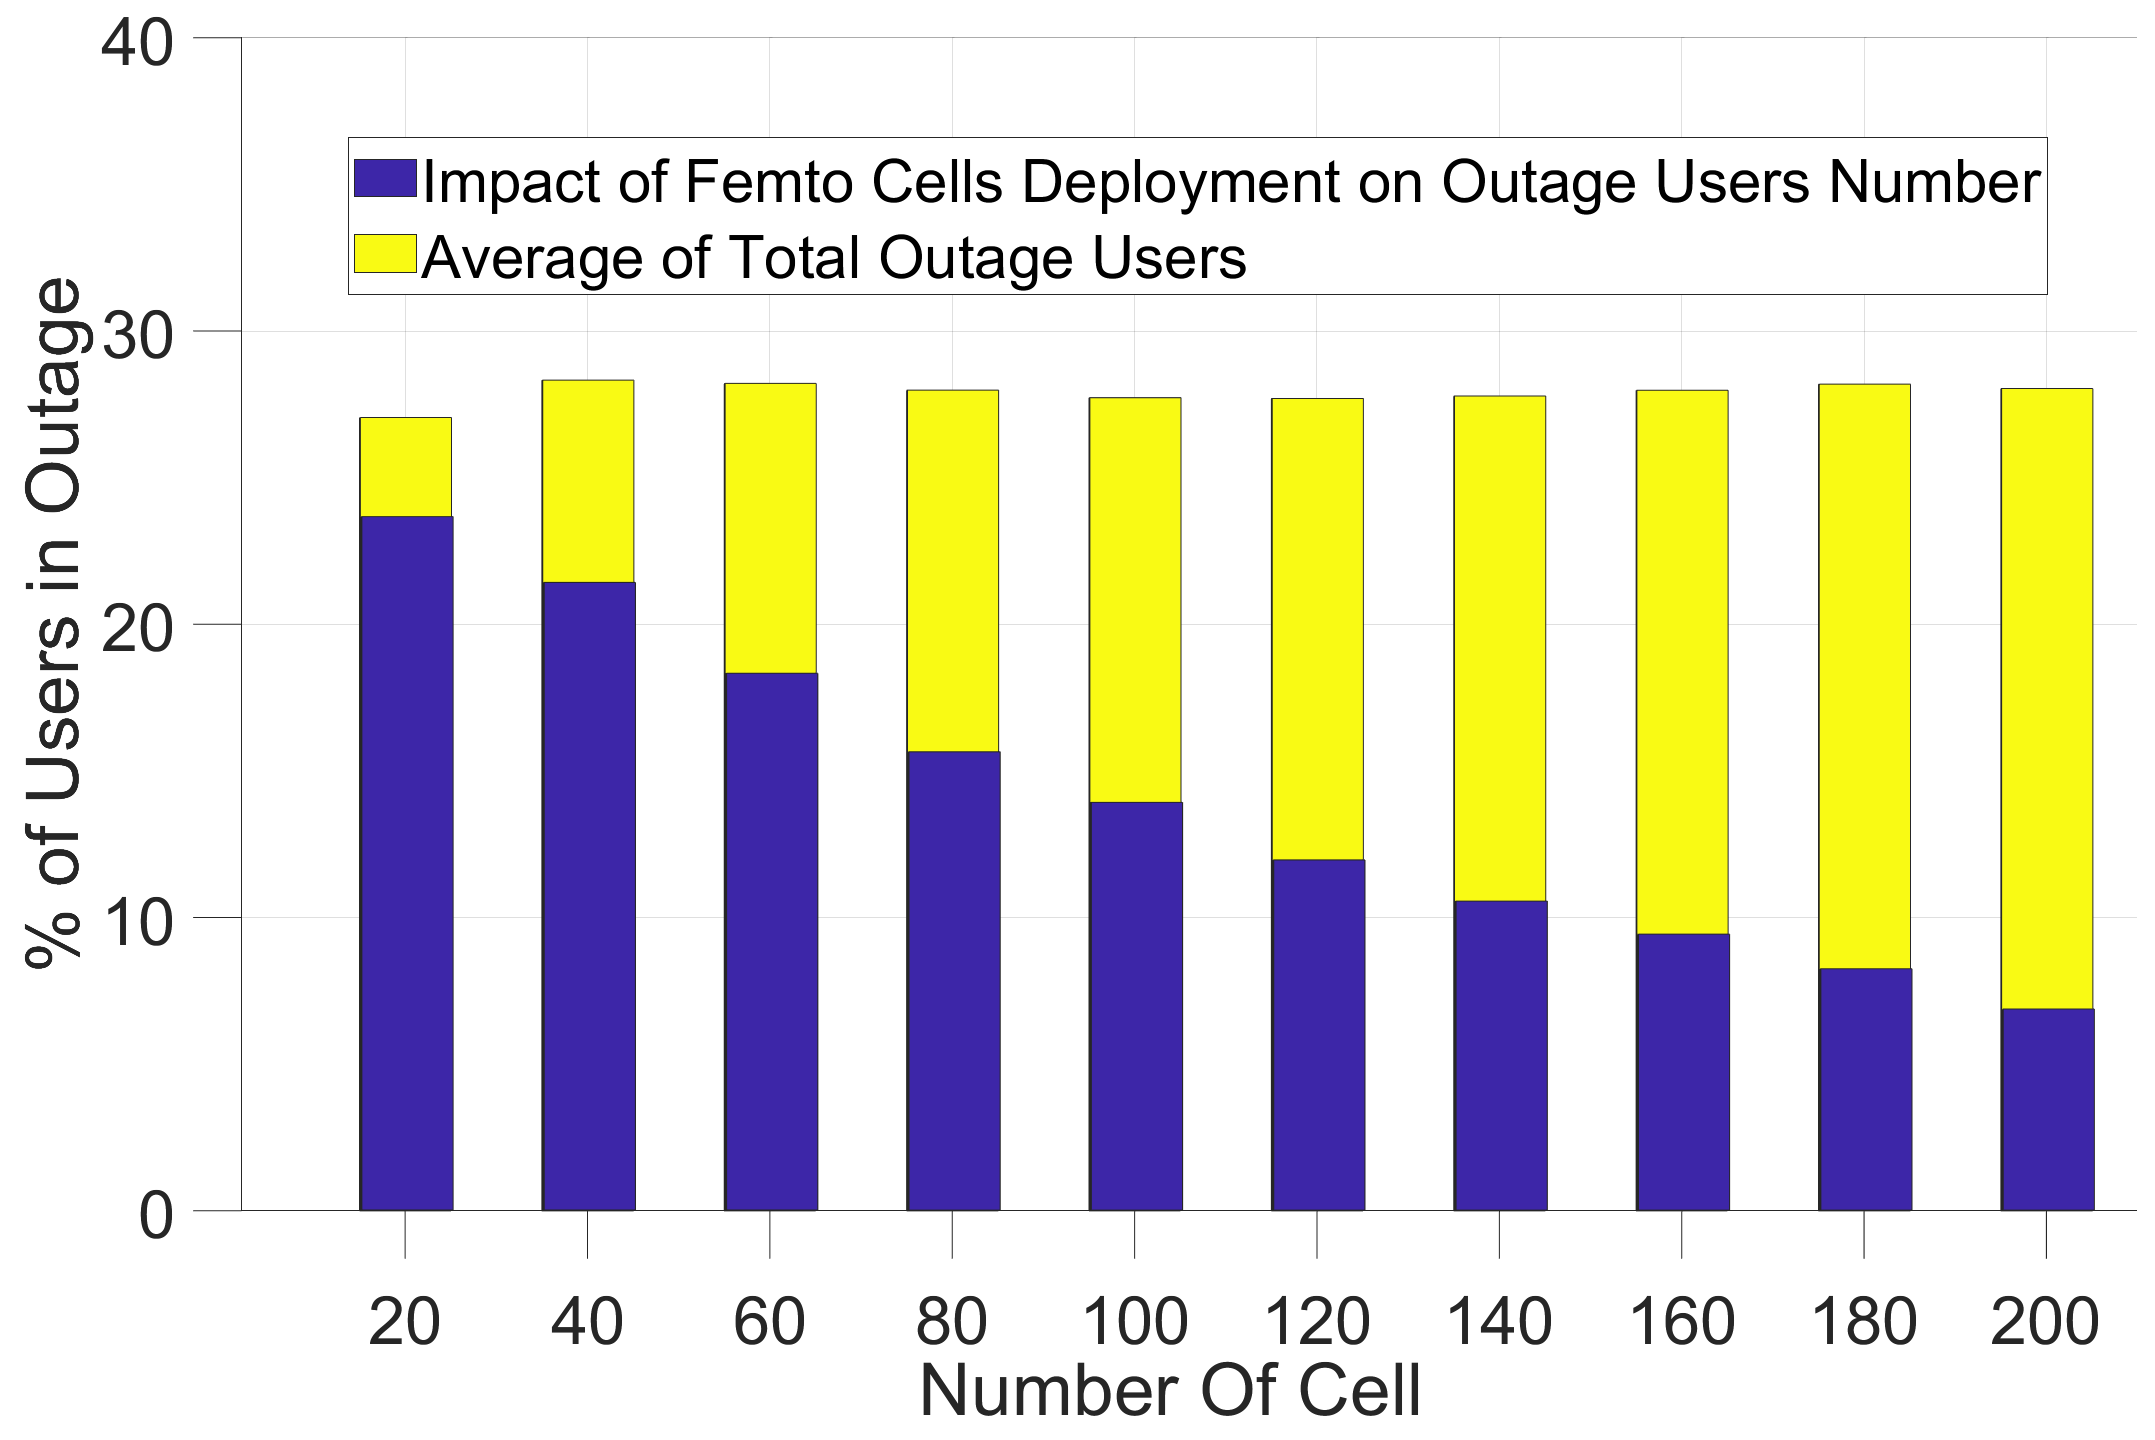
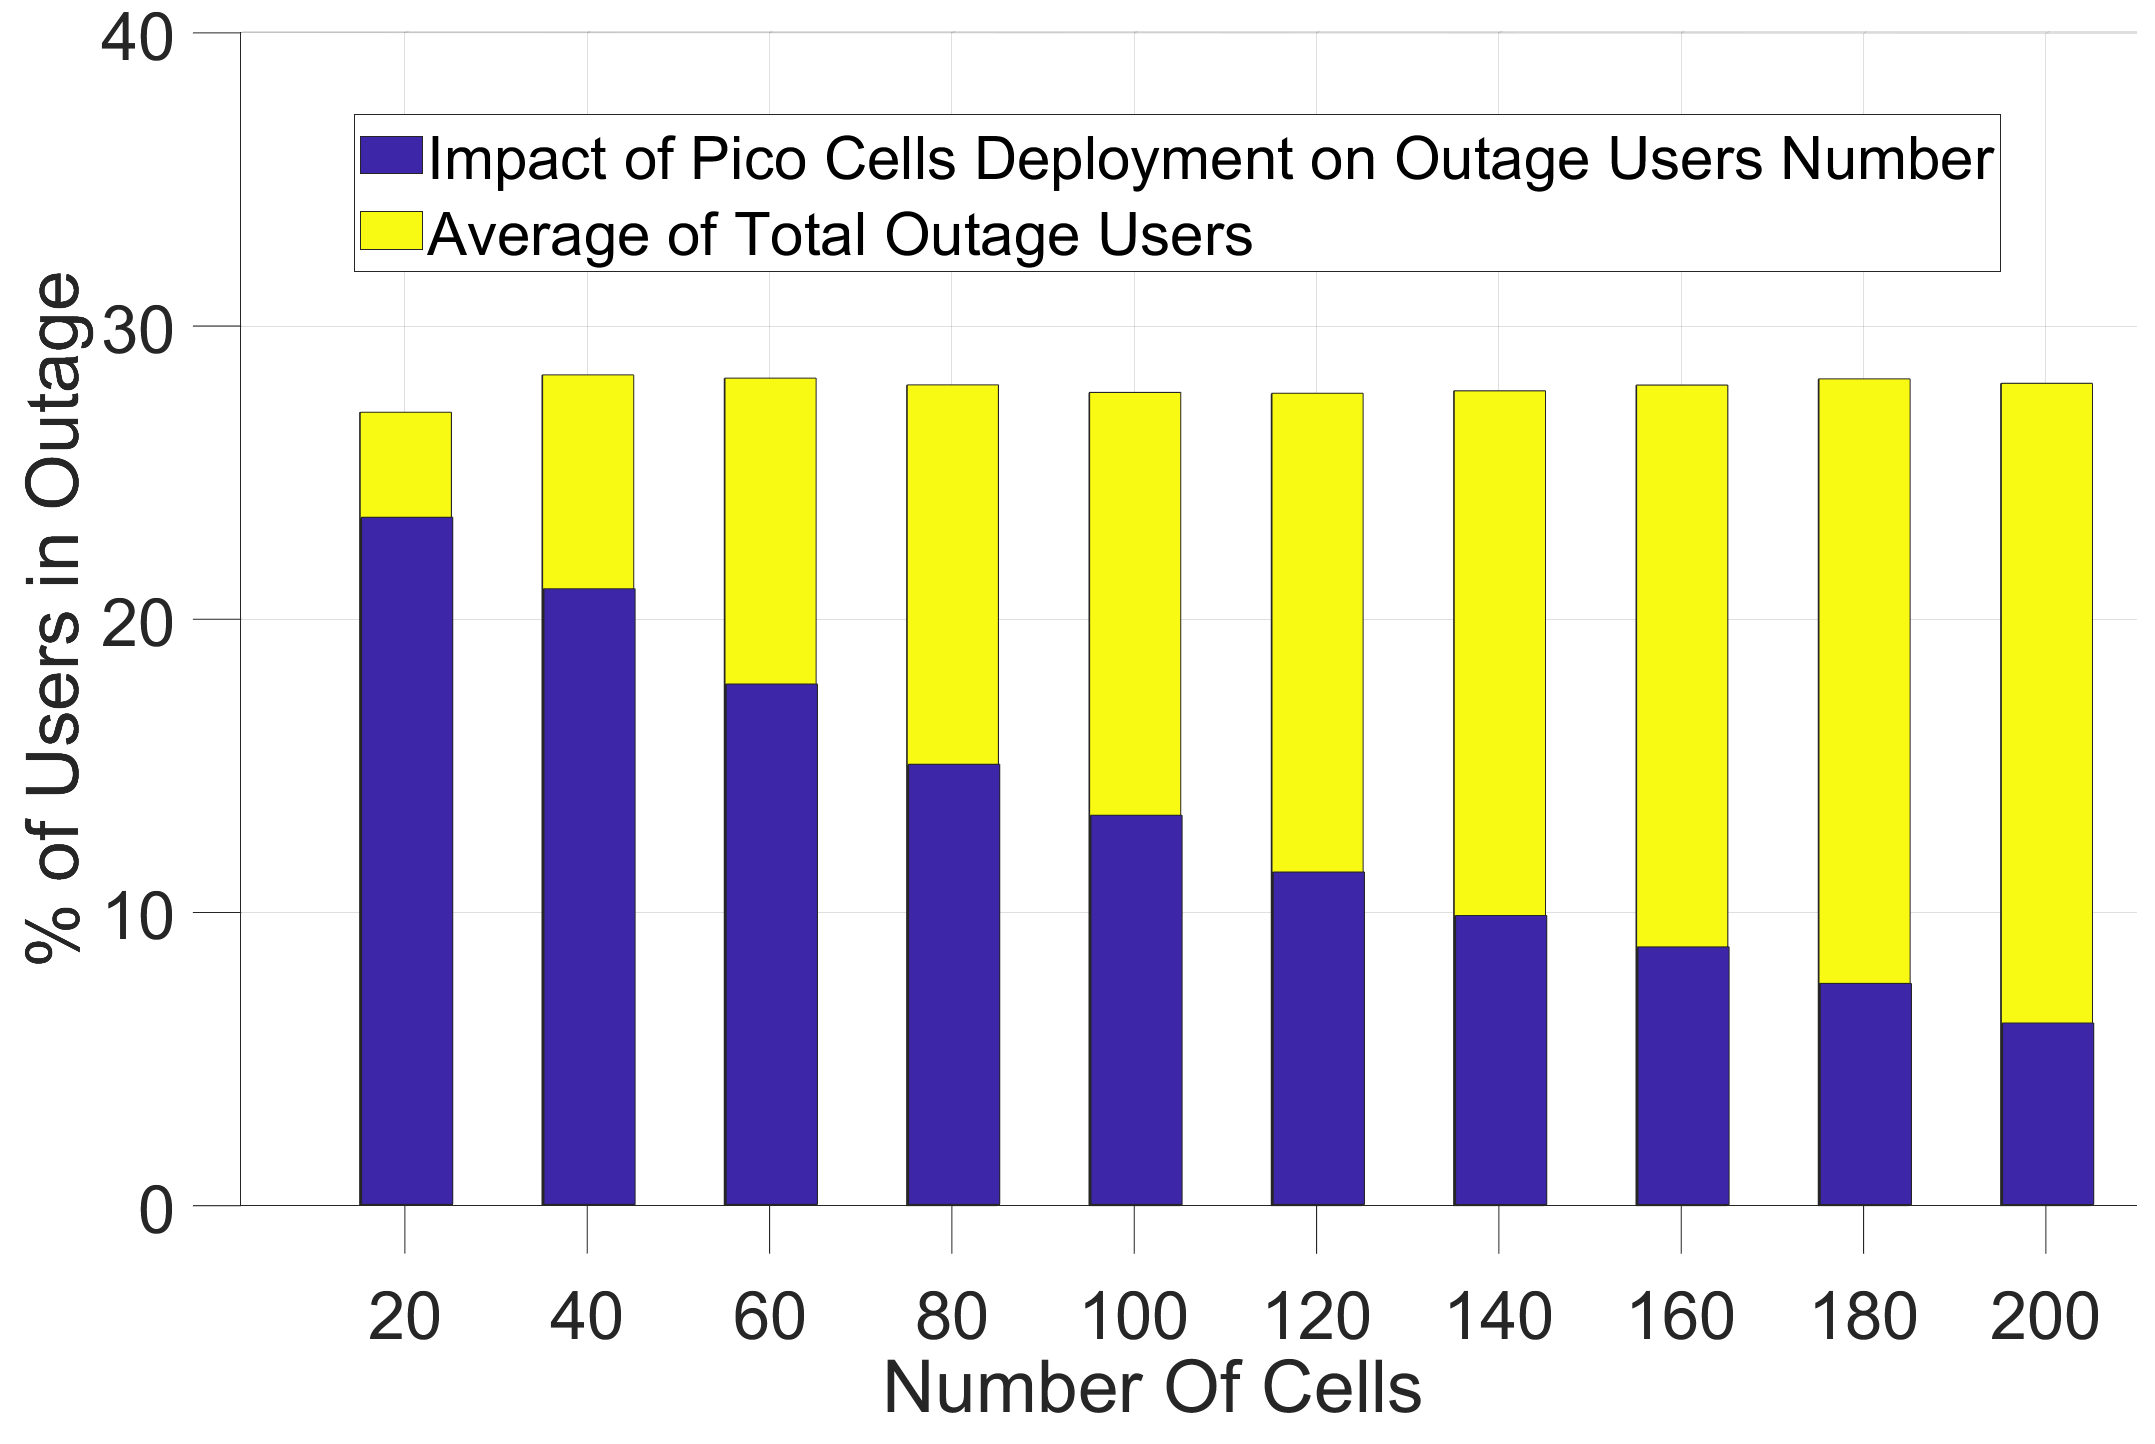
| No. of Small Cells | 20 | 60 | 100 | 140 | 180 | 200 |
|---|---|---|---|---|---|---|
| % Average Outage Users | 28 | 28 | 28 | 28 | 28 | 28 |
| Equation (3) Femto Cell | 24.6 | 18.7 | 14.41 | 11.2 | 8.4 | 7.3 |
| Equation (3) Pico-Cell | 23.7 | 18.4 | 14.1 | 10.7 | 8.4 | 7 |
| Equation (4) Femto Cell | 23.6 | 18.3 | 13.9 | 10.5 | 8.2 | 6.8 |
| Equation (4) Pico-Cell | 23.4 | 17.7 | 13.2 | 9.8 | 7.5 | 6.1 |
| Platform/Data Size | 50 B | 100 B | 500 B | 1 KB | 2 KB | 4 KB | 6 KB | 8 KB | 10 KB |
|---|---|---|---|---|---|---|---|---|---|
| Huffman | 55 | 65 | 77 | 79 | 80 | 80 | 80 | 80 | 80 |
| LZW | −91 | −46 | −3 | 22 | 32 | 50 | 57 | 59 | 62 |
| Platform/Data Size | 50 B | 100 B | 500 B | 1 KB | 2 KB | 4 KB | 6 KB | 8 KB | 10 KB |
|---|---|---|---|---|---|---|---|---|---|
| RPi (LZW-DeComT) | 2 | 2 | 6 | 9 | 13 | 16 | 14 | 17 | 20 |
| RPi (LZW-ComT) | 3 | 5 | 13 | 24 | 42 | 75 | 91 | 100 | 106 |
| RPi (Huff-DeComT) | 2 | 2 | 11 | 24 | 47 | 78 | 89 | 101 | 116 |
| RPi (Huff-ComT) | 1 | 1 | 2 | 5 | 12 | 23 | 34 | 40 | 39 |
Publisher’s Note: MDPI stays neutral with regard to jurisdictional claims in published maps and institutional affiliations. |
© 2021 by the authors. Licensee MDPI, Basel, Switzerland. This article is an open access article distributed under the terms and conditions of the Creative Commons Attribution (CC BY) license (https://creativecommons.org/licenses/by/4.0/).
Share and Cite
Zeinali, M.; Thompson, J.S. Impact of Compression and Small Cell Deployment on NB-IoT Devices Coverage and Energy Consumption with a Realistic Simulation Model. Sensors 2021, 21, 6534. https://doi.org/10.3390/s21196534
Zeinali M, Thompson JS. Impact of Compression and Small Cell Deployment on NB-IoT Devices Coverage and Energy Consumption with a Realistic Simulation Model. Sensors. 2021; 21(19):6534. https://doi.org/10.3390/s21196534
Chicago/Turabian StyleZeinali, Mehdi, and John S. Thompson. 2021. "Impact of Compression and Small Cell Deployment on NB-IoT Devices Coverage and Energy Consumption with a Realistic Simulation Model" Sensors 21, no. 19: 6534. https://doi.org/10.3390/s21196534
APA StyleZeinali, M., & Thompson, J. S. (2021). Impact of Compression and Small Cell Deployment on NB-IoT Devices Coverage and Energy Consumption with a Realistic Simulation Model. Sensors, 21(19), 6534. https://doi.org/10.3390/s21196534