
Advanced Bioelectrical Signal Processing Methods: Past, Present and Future Approach—Part II: Brain Signals

 ,
,  , , , , and
Abstract
1. Introduction
2. Electroencephalography
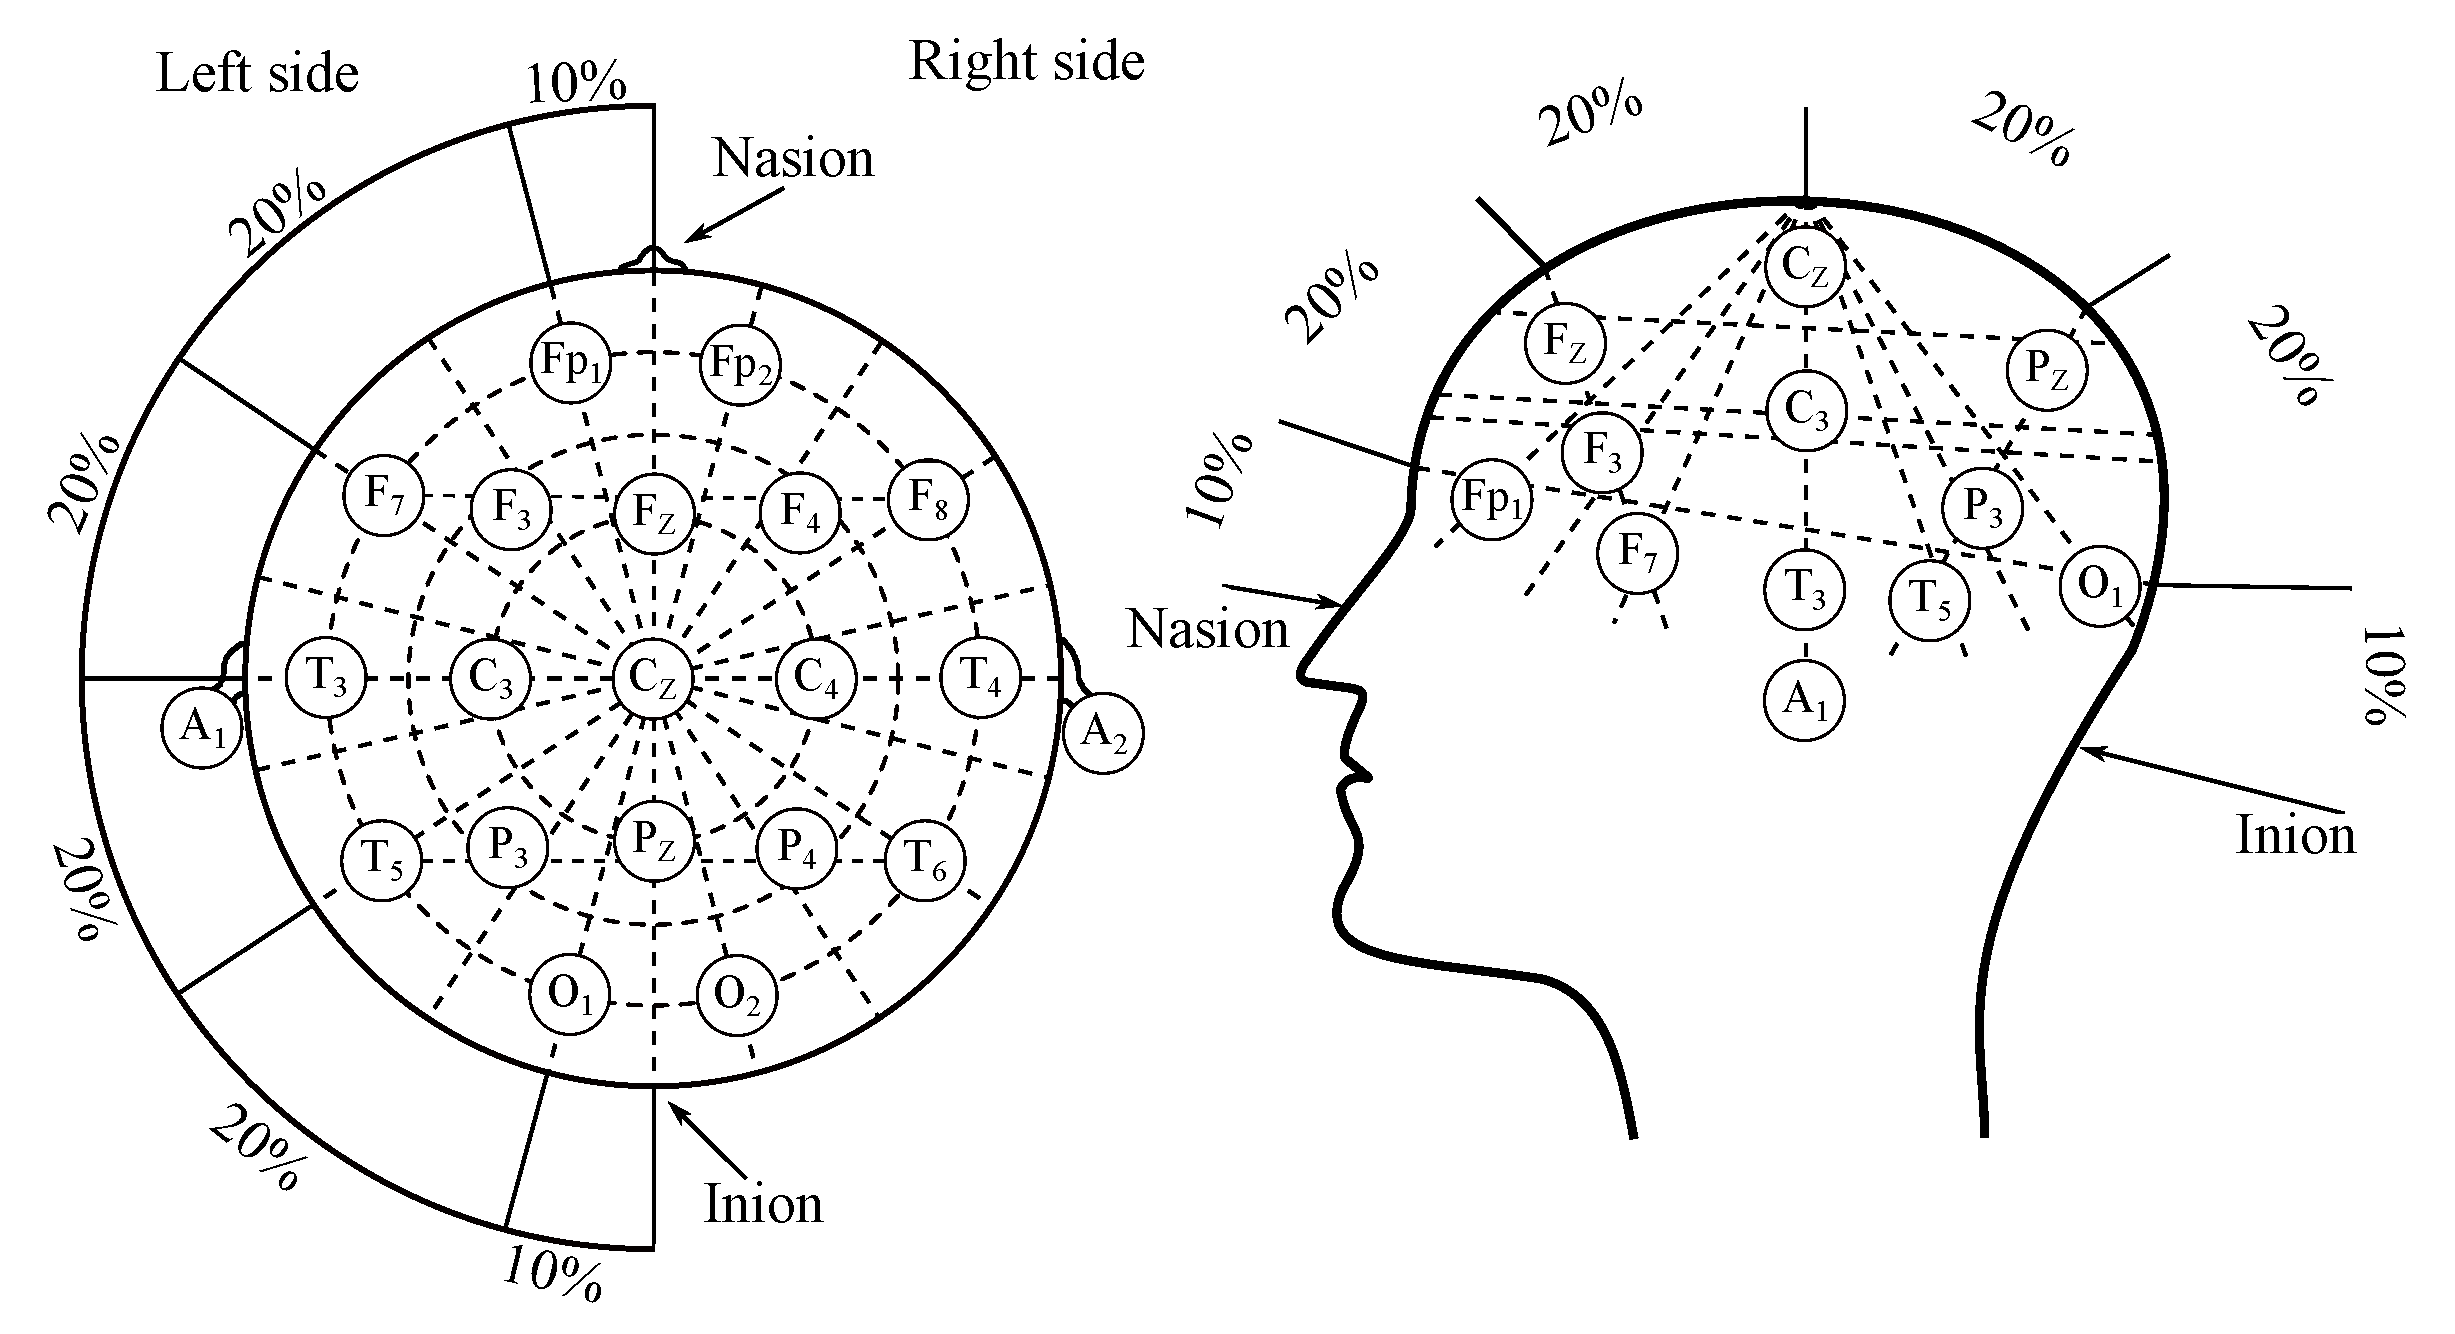
2.1. EEG Recordings
- Delta rhythm with a frequency of Hz is a symptom of deeper stages of sleep. Its occurrence can also be observed in the newborn EEG recordings;
- Theta rhythm with a frequency of Hz is found in the initial stages of sleep;
- Alpha rhythm with a frequency of Hz is the main manifestation of the resting brain activity. The highest values are obtained when during the so-called relaxed alertness;
- Beta rhythm with a frequency of Hz is present in nervous or anxious subjects. The amplitude does not exceed 20 V. It is associated with higher cognitive functions;
- Gamma rhythm with a frequency of Hz is associated with high cognitive functions as a response to various stimuli.
2.2. Clinical Applications
2.3. Artifacts Present in the EEG Recordings
2.4. EEG Signal Processing Methods
2.4.1. Filtering Methods
2.4.2. Wavelet Transform
2.4.3. Independent Component Analysis
2.4.4. Empirical Mode Decomposition
2.4.5. Time-Frequency Image Dimensionality Reduction
2.4.6. Neural Networks
2.4.7. Adaptive Neuro-Fuzzy Inference System
2.4.8. Hybrid Methods
2.5. Summary of the EEG Signals’ Processing Methods
- Overall performance combines other used criteria (SNR improvement, computational cost, real-time and implementation complexity) and gives overall evaluation which reflects the robustness of the method in three categories:
- -
- Low: enables to remove some specific types of interference but the original signal is quite distorted.
- -
- Medium: the signal can be preserved when using the proper parameters for noise removal, which are difficult to choose.
- -
- High: the signal is processed with a preservation of its original shape, so the detailed evaluation of all signal parameters is possible.
- SNR improvement classifies the efficiency of the method with regards to the reference in three categories:
- -
- Low: these methods are suitable primarily for signal preprocessing (reducing baseline wandering, power line interference, etc.) and improvement is ≤5 dB (based on experiments with synthetic records).
- -
- Medium: these methods are suitable primarily for signal preprocessing (power-line interference, myopotentials, and electromyographic interference, isoelectric line fluctuations, motion artifacts, etc.) and improvement is ≤20 dB (based on experiments with synthetic records).
- -
- High: these methods are the most powerful comprehensive processing methods that provide very important information that other methods do not allow. Improvement is ≥20 dB (based on experiments with synthetic records).
- Computational cost determines the demands of the methods in terms of computational complexity in three categories:
- -
- Low: suitable for use in real-time applications. Provide a good compromise between computational cost on the device’s memory and carries out the calculation faster.
- -
- Medium: real-time application is possible but only with advanced technology, such as powerful computers or circuits with field-programmable gate array (FPGA).
- -
- High: the design is too complex and thus not suitable for real-time and/or low-cost applications.
- Real-time is a parameter defining whether the method can be used in online mode, which is very desirable for usability in clinical practice.
- -
- Yes: these methods are suitable for real-time applications.
- -
- No: these methods are not suitable for real-time applications or applications where a small delay is critical.
- Implementation complexity classifies the overall complexity in terms of the deployment in clinical practice to evaluate the economic availability of hardware and software to all patients.
- -
- Simple: these methods are composed of well-known functions and basic mathematical operations, so it is simple to implement them
- -
- Medium: these methods contain advanced signal processing algorithms that are not commonly available and thus harder to implement.
- -
- Complex: these methods contain advanced signal processing methods and complex algorithms making it very challenging to design and implement them.
2.6. Other Methods—Brief Summary
3. Evoked Potentials
3.1. EP Recordings
- Auditory evoked potentials (AEP)— follow audio stimulation. For this method, components are numbered according to their polarity in sequence, e.g., N1, N2, N3 (see Figure 7).
3.1.1. Somatosensory EP
3.1.2. Auditory EP
3.1.3. Visual EP
3.1.4. Event-Related Potentials (ERPs)
3.2. Clinical Applications
3.3. EP Processing Methods
3.3.1. Wavelet Transform
3.3.2. Independent Component Analysis
3.3.3. Principal Component Analysis
3.3.4. Hybrid Methods
4. Electrocorticography
4.1. ECoG Recordings
4.2. Clinical Applications
- Flexible placement of recording and stimulation electrodes;
- It can be performed at any stage before, during and after surgery;
- It allows direct electrical stimulation of the brain and identification of critical areas of the cortex, which must be avoided during surgery;
- It provides greater accuracy and sensitivity than the scalp EEG recordings, as the spatial resolution is higher and the signal-to-noise ratio is better due to closer proximity to the neural activity.
- Limited sampling times recording may be impossible;
- Electrodes’ placement is limited with the area of the exposed cortex and the time of surgery, which causes limited view field and sampling errors’ occurrence;
- The recording is influenced by the anesthetics, analgesics, and the surgery itself.
4.3. ECoG Processing Methods
5. Discussion
5.1. Current Challenges
5.2. Future of Brain Signals’ Analysis
- Big Data: Another future direction is related with big data area, as the big data enable to provide a lot of knowledge and data, necessary for advance methods such as neural networks and deep learning to extract features representing brain functions, mechanisms, or even various disorders or diseases [5,20,277]. Data integration in this field is a very challenging task, as it is necessary for the neuroscientists to measure, share and integrate data [278]. Firstly, it is necessary to have a unified data-set with the same category of subjects, measuring techniques, and protocols applied in it. It is also important to mention the development of other measurement techniques, which provide brain data of better quality, however, techniques such as functional near-infrared spectroscopy (fNIRS) and functional magnetic resonance imaging (fMRI) are expensive and more difficult to operate, and also to analyze. On the other hand, the EEG monitoring provides advantages, such as non-invasiveness, easiness-to-operate, and cost-efficiency [20,279], which makes the EEG particularly suitable for this task [276,280].
- Machine learning (ML): ML- and pattern-recognition-based methods have been widely applied in neurological signals analysis. They provide new approaches in decoding and enable the characterization of task-related brain states and their extraction from non-informative high-dimensional EEG data. There has been growing interest in the use of ML techniques to analyze EEG [281,282,283]. Multiple studies provided evidence that ML enables efficient extraction of meaningful information even from noisy or contaminated data. The emerging methods of ML, such as transfer learning, reinforcement learning, and ensemble learning, have been gradually used in neuroscience. For example, some new deep neural networks, such as generative adversarial networks and spiking neural networks, have already been applied as powerful tools for EEG decoding, and transfer learning is often adopted by researchers in the area of BCI to increase the accuracy of cross-individual prediction. Also, the BCIs have been widely used to predict behavioral variables and psycho-physiological states from neurological data (particularly EEG) [20,280].
- Multi-modality: Multi-modal neuroimaging can provide a more complimentary picture of the brain and its interaction with other organs. There are many ways to create such a multi-modal system [284]. One of the most commonly applied methods is EEG monitoring, which can be combined with other measurement methods [28,285,286,287,288,289,290,291]:
- brain imaging techniques, such as MRI and fNIRS;
- biological signals, such as ECG and EMG;
- brain stimulation techniques, such as trans-cranial magnetic stimulation (TMS) and trans-cranial direct current stimulation (tDCS).
Nevertheless, the multi-modal neurological imaging and/or monitoring is associated with specific signal processing and data analyses challenges, such as inter alia [20,292,293,294,295,296,297]:- the EEG may obtain artifacts from other biological signals (such as EMG) or be distorted by the noise produced by accompanied devices for imaging (such as MRI) or stimulation (such as TMS). Therefore, signal processing and noise removal techniques play a particularly important role in this field;
- in terms of data analyses, fusing different neurological modalities to provide complimentary information poses a great issue. Data-driven multivariate methods and machine learning methods can play a role in the analyses of multi-modal brain imaging data.
6. Conclusions
Author Contributions
Funding
Institutional Review Board Statement
Conflicts of Interest
References
- Von Neumann, J. The Computer and the Brain; Yale University Press: New Haven, CT, USA, 2012. [Google Scholar]
- Gao, S.; Wang, Y.; Gao, X.; Hong, B. Visual and auditory brain–computer interfaces. IEEE Trans. Biomed. Eng. 2014, 61, 1436–1447. [Google Scholar]
- Chandra, P. A Survey on Deep Learning its Architecture and Various Applications. Asia Pac. J. Neural Netw. Appl. 2017, 1, 7–12. [Google Scholar] [CrossRef]
- Swanson, L.W. Brain Architecture: Understanding the Basic Plan; Oxford University Press: Oxford, UK, 2012. [Google Scholar]
- Kawala-Janik, A. Efficiency Evaluation of External Environments Control Using Bio-Signals. Ph.D. Thesis, University of Greenwich, London, UK, 2013. [Google Scholar]
- Gao, X.; Xu, D.; Cheng, M.; Gao, S. A BCI-based environmental controller for the motion-disabled. IEEE Trans. Neural Syst. Rehabil. Eng. 2003, 11, 137–140. [Google Scholar] [PubMed]
- Kiloh, L.G.; McComas, A.J.; Osselton, J.W. Clinical Electroencephalography, 3rd ed.; Butterworths: London, UK, 1972. [Google Scholar]
- Millett, D. Hans Berger: From Psychic Energy to the EEG. Perspect. Biol. Med. 2001, 44, 522–542. [Google Scholar] [CrossRef] [PubMed]
- Coenen, A.; Zayachkivska, O. Adolf Beck: A Pioneer in Electroencephalography in between Richard Caton and Hans Berger. Adv. Cogn. Psychol. 2013, 9, 216–221. [Google Scholar] [CrossRef] [PubMed]
- Jurcak, V.; Tsuzuki, D.; Dan, I. 10/20, 10/10, and 10/5 Systems Revisited: Their Validity as Relative Head-Surface-Based Positioning Systems. NeuroImage 2007, 34, 1600–1611. [Google Scholar] [CrossRef] [PubMed]
- Ball, T.; Kern, M.; Mutschler, I.; Aertsen, A.; Schulze-Bonhage, A. Signal Quality of Simultaneously Recorded Invasive and Non-Invasive EEG. NeuroImage 2009, 46, 708–716. [Google Scholar] [CrossRef]
- Acharya, J.N.; Acharya, V.J. Overview of EEG montages and principles of localization. J. Clin. Neurophysiol. 2019, 36, 325–329. [Google Scholar] [CrossRef] [PubMed]
- Sazgar, M.; Young, M.G. Overview of EEG, electrode placement, and montages. In Absolute Epilepsy and EEG Rotation Review; Springer: Berlin, Germany, 2019; pp. 117–125. [Google Scholar]
- Kutluay, E.; Kalamangalam, G.P. Montages for Noninvasive EEG Recording. J. Clin. Neurophysiol. Off. Publ. Am. Electroencephalogr. Soc. 2019, 36, 330. [Google Scholar] [CrossRef]
- Kawala-Janik, A.; Pelc, M.; Podpora, M. Method for EEG Signals Pattern Recognition in Embedded Systems. Elektron. Elektrotechnika 2015, 21, 3–9. [Google Scholar] [CrossRef]
- Kawala-Sterniuk, A.; Podpora, M.; Pelc, M.; Blaszczyszyn, M.; Gorzelanczyk, E.J.; Martinek, R.; Ozana, S. Comparison of Smoothing Filters in Analysis of EEG Data for the Medical Diagnostics Purposes. Sensors 2020, 20, 807. [Google Scholar] [CrossRef]
- Tomasz, R. Brain–Robot and Speller Interfaces Using Spatial Multisensory Brain-Computer Interface Paradigms. Front. Comput. Neurosci. 2015, 9. [Google Scholar] [CrossRef]
- Allison, B.Z.; Neuper, C. Could Anyone Use a BCI? In Brain-Computer Interfaces; Tan, D.S., Nijholt, A., Eds.; Springer: London, UK, 2010; pp. 35–54. [Google Scholar] [CrossRef]
- Cichocki, A.; Washizawa, Y.; Rutkowski, T.; Bakardjian, H.; Phan, A.H.; Choi, S.; Lee, H.; Zhao, Q.; Zhang, L.; Li, Y. Noninvasive BCIs: Multiway Signal-Processing Array Decompositions. Computer 2008, 41, 34–42. [Google Scholar] [CrossRef]
- Kawala-Sterniuk, A.; Browarska, N.; Al-Bakri, A.; Pelc, M.; Zygarlicki, J.; Sidikova, M.; Martinek, R.; Gorzelanczyk, E.J. Summary of over Fifty Years with Brain-Computer Interfaces—A Review. Brain Sci. 2021, 11, 43. [Google Scholar] [CrossRef] [PubMed]
- Miller, K.J.; Hermes, D.; Staff, N.P. The current state of electrocorticography-based brain–computer interfaces. Neurosurg. Focus 2020, 49, E2. [Google Scholar] [CrossRef] [PubMed]
- Oostenveld, R.; Praamstra, P. The Five Percent Electrode System for High-Resolution EEG and ERP Measurements. Clin. Neurophysiol. 2001, 112, 713–719. [Google Scholar] [CrossRef]
- Ferree, T.C.; Luu, P.; Russell, G.S.; Tucker, D.M. Scalp Electrode Impedance, Infection Risk, and EEG Data Quality. Clin. Neurophysiol. 2001, 112, 536–544. [Google Scholar] [CrossRef]
- Gopan, K.G.; Prabhu, S.S.; Sinha, N. Sleep EEG Analysis Utilizing Inter-Channel Covariance Matrices. Biocybern. Biomed. Eng. 2020, 40, 527–545. [Google Scholar] [CrossRef]
- Banville, H.; Chehab, O.; Hyvärinen, A.; Engemann, D.A.; Gramfort, A. Uncovering the Structure of Clinical EEG Signals with Self-Supervised Learning. arXiv 2020, arXiv:2007.16104. [Google Scholar] [CrossRef]
- Rangayyan, R.M. Biomedical Signal Analysis, 2nd ed.; IEEE Press Series in Biomedical Engineering; IEEE Press: Piscataway, NJ, USA; John Wiley & Sons, Inc: Hoboken, NJ, USA, 2015. [Google Scholar]
- Penhaker, M.; Augustynek, M. Zdravotnické Elektrické Přístroje 1; VSB—Technical University of Ostrava: Ostrava, Czechia, 2013. [Google Scholar]
- Nyni, K.; Vincent, L.K.; Varghese, L.; Liya, V.; Johny, A.N.; Yesudas, C. Wireless health monitoring system for ECG, EMG and EEG detecting. In Proceedings of the 2017 International Conference on Innovations in Information, Embedded and Communication Systems (ICIIECS), Coimbatore, India, 17–18 March 2017; IEEE: Piscataway, NJ, USA, 2017; pp. 1–5. [Google Scholar]
- Fink, A.; Grabner, R.; Neuper, C.; Neubauer, A. EEG Alpha Band Dissociation with Increasing Task Demands. Cogn. Brain Res. 2005, 24, 252–259. [Google Scholar] [CrossRef]
- Chervin, R.D.; Burns, J.W.; Subotic, N.S.; Roussi, C.; Thelen, B.; Ruzicka, D.L. Correlates of Respiratory Cycle-Related EEG Changes in Children with Sleep-Disordered Breathing. Sleep 2004, 27, 116–121. [Google Scholar] [CrossRef] [PubMed]
- van Albada, S.J.; Robinson, P.A. Relationships between Electroencephalographic Spectral Peaks Across Frequency Bands. Front. Hum. Neurosci. 2013, 7. [Google Scholar] [CrossRef]
- Bruce, E.N. Biomedical Signal Processing and Signal Modeling; Wiley Series in Telecommunications and Signal Processing; Wiley: New York, NY, USA, 2001. [Google Scholar]
- Sharma, M.; Patel, S.; Acharya, U.R. Automated Detection of Abnormal EEG Signals Using Localized Wavelet Filter Banks. Pattern Recognit. Lett. 2020, 133, 188–194. [Google Scholar] [CrossRef]
- Fernandez-Baca Vaca, G.; Park, J.T. Focal EEG Abnormalities and Focal Ictal Semiology in Generalized Epilepsy. Seizure 2020, 77, 7–14. [Google Scholar] [CrossRef]
- Harris, L.; Angus-Leppan, H. Epilepsy: Diagnosis, Classification and Management. Medicine 2020, 48, 522–528. [Google Scholar] [CrossRef]
- Dalle Ave, A.L.; Bernat, J.L. Inconsistencies Between the Criterion and Tests for Brain Death. J. Intensive Care Med. 2020, 35, 772–780. [Google Scholar] [CrossRef] [PubMed]
- Emmady, P.D.; Anilkumar, A.C. EEG, Abnormal Waveforms. In StatPearls; StatPearls Publishing: Treasure Island, FL, USA, 2020. [Google Scholar]
- Gurrala, V.; Yarlagadda, P.; Koppireddi, P. Detection of Sleep Apnea Based on the Analysis of Sleep Stages Data Using Single Channel EEG. Trait. du Signal 2021, 38, 431–436. [Google Scholar] [CrossRef]
- Jain, S.V.; Dye, T.; Kedia, P. Value of combined video EEG and polysomnography in clinical management of children with epilepsy and daytime or nocturnal spells. Seizure 2019, 65, 1–5. [Google Scholar] [CrossRef]
- Melia, U.; Guaita, M.; Vallverdú, M.; Embid, C.; Vilaseca, I.; Salamero, M.; Santamaria, J. Mutual information measures applied to EEG signals for sleepiness characterization. Med. Eng. Phys. 2015, 37, 297–308. [Google Scholar] [CrossRef]
- Buettner, R.; Fuhrmann, J.; Kolb, L. Towards high-performance differentiation between Narcolepsy and Idiopathic Hypersomnia in 10 minute EEG recordings using a Novel Machine Learning Approach. In Proceedings of the 2019 IEEE International Conference on E-health Networking, Application & Services (HealthCom), Bogota, Colombia, 14–16 October 2019; IEEE: Piscataway, NJ, USA, 2019; pp. 1–7. [Google Scholar]
- Sarilar, A.C.; Ismailogullari, S.; Yilmaz, R.; Erdogan, F.F.; Per, H. Electroencephalogram abnormalities in patients with NREM parasomnias. Sleep Med. 2019, 77, 256–260. [Google Scholar] [CrossRef]
- Mishra, S.; Birok, R. Literature review: Sleep stage classification based on EEG signals using artificial intelligence technique. In Recent Trends in Communication and Electronics; CRC Press: Boca Raton, FL, USA, 2021; pp. 241–244. [Google Scholar]
- Sunwoo, J.S.; Cha, K.S.; Byun, J.I.; Jun, J.S.; Kim, T.J.; Shin, J.W.; Lee, S.T.; Jung, K.H.; Park, K.I.; Chu, K.; et al. NREM sleep EEG oscillations in idiopathic REM sleep behavior disorder: A study of sleep spindles and slow oscillations. Sleep 2020, 44, zsaa160. [Google Scholar] [CrossRef]
- Nuwer, M.R.; Jordan, S.E.; Ahn, S.S. Evaluation of Stroke Using EEG Frequency Analysis and Topographic Mapping. Neurology 1987, 37, 1153. [Google Scholar] [CrossRef]
- Juhasz, Z. Quantitative Cost Comparison of On-Premise and Cloud Infrastructure Based EEG Data Processing. Clust. Comput. 2020, 24, 625–641. [Google Scholar] [CrossRef]
- Kapgate, D. Future of EEG Based Hybrid Visual Brain Computer Interface Systems in Rehabilitation of People with Neurological Disorders. Int. Res. J. Adv. Sci. Hub (IRJASH) 2020, 2, 15–20. [Google Scholar] [CrossRef]
- Asadzadeh, S.; Yousefi Rezaii, T.; Beheshti, S.; Delpak, A.; Meshgini, S. A Systematic Review of EEG Source Localization Techniques and Their Applications on Diagnosis of Brain Abnormalities. J. Neurosci. Methods 2020, 339, 108740. [Google Scholar] [CrossRef] [PubMed]
- Maidana Capitán, M.; Cámpora, N.; Sigvard, C.S.; Kochen, S.; Samengo, I. Time- and Frequency-Resolved Covariance Analysis for Detection and Characterization of Seizures from Intracraneal EEG Recordings. Biol. Cybern. 2020, 114, 461–471. [Google Scholar] [CrossRef] [PubMed]
- Giuliano, L.; Mainieri, G.; Cicero, C.E.; Battaglia, G.; Guccione, A.; Salomone, S.; Drago, F.; Nicoletti, A.; Sofia, V.; Zappia, M. Parasomnias, Sleep-Related Movement Disorders and Physiological Sleep Variants in Focal Epilepsy: A Polysomnographic Study. Seizure 2020, 81, 84–90. [Google Scholar] [CrossRef] [PubMed]
- Savadkoohi, M.; Oladunni, T.; Thompson, L. A Machine Learning Approach to Epileptic Seizure Prediction Using Electroencephalogram (EEG) Signal. Biocybern. Biomed. Eng. 2020, 40, 1328–1341. [Google Scholar] [CrossRef]
- Reus, E.E.; Visser, G.H.; Cox, F.M. Using Sampled Visual EEG Review in Combination with Automated Detection Software at the EMU. Seizure 2020, 80, 96–99. [Google Scholar] [CrossRef]
- Al-Bakri, A.F.; Villamar, M.F.; Haddix, C.; Bensalem-Owen, M.; Sunderam, S. Noninvasive seizure prediction using autonomic measurements in patients with refractory epilepsy. In Proceedings of the 2018 40th Annual International Conference of the IEEE Engineering in Medicine and Biology Society (EMBC), Honolulu, HI, USA, 18–21 July 2018; IEEE: Piscataway, NJ, USA, 2018; pp. 2422–2425. [Google Scholar]
- Cox, F.; Reus, E.; Widman, G.; Zwemmer, J.; Visser, G. Epilepsy Monitoring Units Can Be Safe Places; a Prospective Study in a Large Cohort. Epilepsy Behav. 2020, 102, 106718. [Google Scholar] [CrossRef]
- Duy, P.Q.; Krauss, G.L.; Crone, N.E.; Ma, M.; Johnson, E.L. Antiepileptic Drug Withdrawal and Seizure Severity in the Epilepsy Monitoring Unit. Epilepsy Behav. 2020, 109, 107128. [Google Scholar] [CrossRef] [PubMed]
- Askamp, J.; van Putten, M.J. Mobile EEG in epilepsy. Int. J. Psychophysiol. 2014, 91, 30–35. [Google Scholar] [CrossRef] [PubMed]
- Gilliam, F.; Kuzniecky, R.; Faught, E. Ambulatory EEG monitoring. J. Clin. Neurophysiol. 1999, 16, 111–115. [Google Scholar] [CrossRef]
- Elger, C.E.; Hoppe, C. Diagnostic challenges in epilepsy: Seizure under-reporting and seizure detection. Lancet Neurol. 2018, 17, 279–288. [Google Scholar] [CrossRef]
- Brunnhuber, F.; Slater, J.; Goyal, S.; Amin, D.; Thorvardsson, G.; Freestone, D.R.; Richardson, M.P. Past, Present and Future of Home video-electroencephalographic telemetry: A review of the development of in-home video-electroencephalographic recordings. Epilepsia 2020, 61, S3–S10. [Google Scholar] [CrossRef]
- Mohammed, N.S.; Al-Mamoori, M.J.; Albermani, A.; AbudAlameer, W.R.; Abbas, F.N. Electroencephalogram and Visual Evoked Potential Changes in Patients with Primary Headaches. Indian J. Forensic Med. Toxicol. 2020, 14, 1685–1692. [Google Scholar]
- Somaiya, S. Electroencephalogram (EEG): Meaning, Sources and Significance. 2016. Available online: https://www.biologydiscussion.com/human-physiology/electroencephalogram/electroencephalogram-eeg-meaning-sources-and-significance/62944?fbclid=IwAR0RNKnj2dBNPUABXEtPIxdoWuZIAFLOQYgW8vbqD7PYyrvzah22WGc9xhY (accessed on 15 June 2021).
- Tatum, W.O. Handbook of EEG Interpretation; DemosMedical: New York, NY, USA, 2014. [Google Scholar]
- Chernecky, C.C.; Berger, B.J. (Eds.) Laboratory Tests and Diagnostic Procedures, 6th ed.; Elsevier: St. Louis, MO, USA, 2013. [Google Scholar]
- Cuellar, M.; Harkrider, A.; Jenson, D.; Thornton, D.; Bowers, A.; Saltuklaroglu, T. Time–Frequency Analysis of the EEG Mu Rhythm as a Measure of Sensorimotor Integration in the Later Stages of Swallowing. Clin. Neurophysiol. 2016, 127, 2625–2635. [Google Scholar] [CrossRef]
- Martins, N.R.; Angelica, A.; Chakravarthy, K.; Svidinenko, Y.; Boehm, F.J.; Opris, I.; Lebedev, M.A.; Swan, M.; Garan, S.A.; Rosenfeld, J.V.; et al. Human brain/cloud interface. Front. Neurosci. 2019, 13, 112. [Google Scholar] [CrossRef]
- Cecotti, H. Spelling with non-invasive brain–computer Interfaces—Current and future trends. J. Physiol.-Paris 2011, 105, 106–114. [Google Scholar] [CrossRef]
- Yu, X.; Qi, W. A user study of wearable EEG headset products for emotion analysis. In Proceedings of the 2018 International Conference on Algorithms, Computing and Artificial Intelligence, Sanya, China, 21–23 December 2018; pp. 1–7. [Google Scholar]
- Das, R.; Chatterjee, D.; Das, D.; Sinharay, A.; Sinha, A. Cognitive load measurement—A methodology to compare low cost commercial eeg devices. In Proceedings of the 2014 International conference on advances in computing, communications and informatics (ICACCI), Delhi, India, 24–27 September 2014; IEEE: Piscataway, NJ, USA, 2014; pp. 1188–1194. [Google Scholar]
- Stytsenko, K.; Jablonskis, E.; Prahm, C. Evaluation of consumer EEG device Emotiv EPOC. In Proceedings of the MEi: CogSci Conference 2011, Ljubljana, Slovenia, 17–18 June 2011. [Google Scholar]
- Frey, J. Comparison of a consumer grade EEG amplifier with medical grade equipment in BCI applications. In Proceedings of the International BCI Meeting, Pacific Grove, CA, USA, 30 May–3 June 2016. [Google Scholar]
- Katona, J.; Kovari, A. The evaluation of bci and pebl-based attention tests. Acta Polytech. Hung. 2018, 15, 225–249. [Google Scholar]
- Frey, J. Comparison of an open-hardware electroencephalography amplifier with medical grade device in brain-computer interface applications. arXiv 2016, arXiv:1606.02438. [Google Scholar]
- Ekandem, J.I.; Davis, T.A.; Alvarez, I.; James, M.T.; Gilbert, J.E. Evaluating the ergonomics of BCI devices for research and experimentation. Ergonomics 2012, 55, 592–598. [Google Scholar] [CrossRef] [PubMed]
- Sugiono, S.; Putra, A.S.; Fanani, A.A.; Cahyawati, A.N.; Oktavianty, O. A New Concept of Product Design by Involving Emotional Factors Using Eeg: A Case Study of Xomputer Mouse Design. Acta Neuropsychol. 2021, 19, 63–80. [Google Scholar] [CrossRef]
- Lacko, D.; Vleugels, J.; Fransen, E.; Huysmans, T.; De Bruyne, G.; Van Hulle, M.M.; Sijbers, J.; Verwulgen, S. Ergonomic design of an EEG headset using 3D anthropometry. Appl. Ergon. 2017, 58, 128–136. [Google Scholar] [CrossRef]
- Rogers, J.M.; Jensen, J.; Valderrama, J.T.; Johnstone, S.J.; Wilson, P.H. Single-channel EEG measurement of engagement in virtual rehabilitation: A validation study. Virtual Real. 2021, 25, 357–366. [Google Scholar] [CrossRef]
- Zhang, J.; Yao, R.; Ge, W.; Gao, J. Orthogonal convolutional neural networks for automatic sleep stage classification based on single-channel EEG. Comput. Methods Programs Biomed. 2020, 183, 105089. [Google Scholar] [CrossRef]
- Ko, L.W.; Komarov, O.; Lai, W.K.; Liang, W.G.; Jung, T.P. Eyeblink recognition improves fatigue prediction from single-channel forehead EEG in a realistic sustained attention task. J. Neural Eng. 2020, 17, 036015. [Google Scholar] [CrossRef] [PubMed]
- Eldele, E.; Chen, Z.; Liu, C.; Wu, M.; Kwoh, C.K.; Li, X.; Guan, C. An Attention-Based Deep Learning Approach for Sleep Stage Classification With Single-Channel EEG. IEEE Trans. Neural Syst. Rehabil. Eng. 2021, 29, 809–818. [Google Scholar] [CrossRef]
- Kaur, J.; Kaur, A. A review on analysis of EEG signals. In Proceedings of the 2015 International Conference on Advances in Computer Engineering and Applications, Ghaziabad, India, 19–20 March 2015; IEEE: Piscataway, NJ, USA, 2015; pp. 957–960. [Google Scholar]
- Lee, S.; Buchsbaum, M.S. Topographic Mapping of EEG Artifacts. Clin. EEG (Electroencephalogr.) 1987, 18, 61–67. [Google Scholar]
- Durka, P.; Klekowicz, H.; Blinowska, K.; Szelenberger, W.; Niemcewicz, S. A Simple System for Detection of EEG Artifacts in Polysomnographic Recordings. IEEE Trans. Biomed. Eng. 2003, 50, 526–528. [Google Scholar] [CrossRef]
- Moretti, D. Computerized Processing of EEG–EOG–EMG Artifacts for Multi-Centric Studies in EEG Oscillations and Event-Related Potentials. Int. J. Psychophysiol. 2003, 47, 199–216. [Google Scholar] [CrossRef]
- Correa, A.G.; Laciar, E.; Patiño, H.; Valentinuzzi, M. Artifact removal from EEG signals using adaptive filters in cascade. J. Phys. Conf. Ser. 2007, 90, 012081. [Google Scholar] [CrossRef]
- Leske, S.; Dalal, S.S. Reducing power line noise in EEG and MEG data via spectrum interpolation. Neuroimage 2019, 189, 763–776. [Google Scholar] [CrossRef]
- La Rosa, A.B.; Pereira, P.T.; Ücker, P.; Paim, G.; da Costa, E.A.; Bampi, S.; Almeida, S. Exploring NLMS-Based Adaptive Filter Hardware Architectures for Eliminating Power Line Interference in EEG Signals. Circuits Syst. Signal Process. 2021, 40, 3305–3337. [Google Scholar] [CrossRef]
- Reddy, A.G.; Narava, S. Artifact removal from EEG signals. Int. J. Comput. Appl. 2013, 77, 17–19. [Google Scholar]
- Qian, X.; Xu, Y.P.; Li, X. A CMOS continuous-time low-pass notch filter for EEG systems. Analog Integr. Circuits Signal Process. 2005, 44, 231–238. [Google Scholar] [CrossRef]
- Saini, M.; Satija, U.; Upadhayay, M.D. Effective Automated Method for Detection and Suppression of Muscle Artefacts from Single-Channel EEG Signal. Healthc. Technol. Lett. 2020, 7, 35–40. [Google Scholar] [CrossRef] [PubMed]
- Shah, S.A.A.; Zhang, L.; Bais, A. Dynamical System Based Compact Deep Hybrid Network for Classification of Parkinson Disease Related EEG Signals. Neural Netw. 2020, 130, 75–84. [Google Scholar] [CrossRef]
- Silva, G.; Alves, M.; Cunha, R.; Bispo, B.C.; Rodrigues, P.M. Parkinson Disease Early Detection Using EEG Channels Cross-Correlation. Int. J. Appl. Eng. Res. 2020, 15, 197–203. [Google Scholar]
- Noureddin, B.; Lawrence, P.D.; Birch, G.E. Online Removal of Eye Movement and Blink EEG Artifacts Using a High-Speed Eye Tracker. IEEE Trans. Biomed. Eng. 2012, 59, 2103–2110. [Google Scholar] [CrossRef]
- Jansen, M.; White, T.P.; Mullinger, K.J.; Liddle, E.B.; Gowland, P.A.; Francis, S.T.; Bowtell, R.; Liddle, P.F. Motion-Related Artefacts in EEG Predict Neuronally Plausible Patterns of Activation in fMRI Data. NeuroImage 2012, 59, 261–270. [Google Scholar] [CrossRef]
- Abbaspour, H.; Mehrshad, N.; Razavi, S.M.; Mesin, L. Artefacts Removal to Detect Visual Evoked Potentials in Brain Computer Interface Systems. J. Biomimetics Biomater. Biomed. Eng. 2019, 41, 91–103. [Google Scholar] [CrossRef]
- Diykh, M.; Li, Y.; Abdulla, S. EEG Sleep Stages Identification Based on Weighted Undirected Complex Networks. Comput. Methods Programs Biomed. 2020, 184, 105116. [Google Scholar] [CrossRef]
- Jiao, Y.; Deng, Y.; Luo, Y.; Lu, B.L. Driver Sleepiness Detection from EEG and EOG Signals Using GAN and LSTM Networks. Neurocomputing 2020, 408, 100–111. [Google Scholar] [CrossRef]
- Wang, Y.; Xu, G.; Zhang, S.; Luo, A.; Li, M.; Han, C. EEG Signal Co-Channel Interference Suppression Based on Image Dimensionality Reduction and Permutation Entropy. Signal Process. 2017, 134, 113–122. [Google Scholar] [CrossRef]
- Benbadis, S.R. EEG Artifacts: Overview, Physiologic Artifacts, Extraphysiologic Artifacts. 2019. Available online: https://emedicine.medscape.com/article/1140247-overview (accessed on 15 May 2021).
- Tandle, A.; Jog, N. Classification of Artefacts in EEG Signal Recordings and Overview of Removing Techniques. Int. J. Comput. Appl. 2015, 975, 8887. [Google Scholar]
- Cichocki, A.; Rutkowski, T.; Siwek, K. Blind Signal Extraction of Signals with Specified Frequency Band. In Proceedings of the 12th IEEE Workshop on Neural Networks for Signal Processing, Martigny, Switzerland, 6 September 2002; pp. 515–524. [Google Scholar] [CrossRef]
- Gallego-Jutglà, E.; Solé-Casals, J.; Rutkowski, T.M.; Cichocki, A. Application of Multivariate Empirical Mode Decomposition for Cleaning Eye Blinks Artifacts from EEG Signals. In Proceedings of the International Conference on Neural Computation Theory and Applications (Special Session on Challenges in Neuroengineering-2011), Paris, France, 24–26 October 2011; pp. 455–460. [Google Scholar]
- Rakhmatulin, I. Review of EEG Feature Selection by Neural Networks. Int. J. Sci. Bus. 2020, 4, 101–112. [Google Scholar] [CrossRef]
- Baig, M.Z.; Aslam, N.; Shum, H.P.H. Filtering Techniques for Channel Selection in Motor Imagery EEG Applications: A Survey. Artif. Intell. Rev. 2020, 53, 1207–1232. [Google Scholar] [CrossRef]
- Higashi, H.; Rutkowski, T.M.; Tanaka, T.; Tanaka, Y. Smoothing of xDAWN Spatial Filters for Robust Extraction of Event-Related Potentials. In Proceedings of the 2016 Asia-Pacific Signal and Information Processing Association Annual Summit and Conference (APSIPA), Jeju, Korea, 13–16 December 2016; pp. 1–5. [Google Scholar] [CrossRef]
- Schlögl, A.; Anderer, P.; Roberts, S.J.; Pregenzer, M.; Pfurtscheller, G. Artefact Detection in Sleep EEG by the Use of Kalman Filtering. In Proceedings of the EMBEC’99, Vienna, Austria, 4–7 November 1999; Volume 99, pp. 1648–1649. [Google Scholar]
- Li, J.; Chan, S.C.; Liu, Z.; Chang, C. A Novel Adaptive Fading Kalman Filter-Based Approach to Time-Varying Brain Spectral/Connectivity Analyses of Event-Related EEG Signals. IEEE Access 2020, 8, 51230–51245. [Google Scholar] [CrossRef]
- Qi, F.; Wu, W.; Yu, Z.L.; Gu, Z.; Wen, Z.; Yu, T.; Li, Y. Spatiotemporal-Filtering-Based Channel Selection for Single-Trial EEG Classification. IEEE Trans. Cybern. 2020, 51, 558–567. [Google Scholar] [CrossRef]
- Ahmed, O.I.; Yassin, H.M.; Said, L.A.; Psychalinos, C.; Radwan, A.G. Implementation and Analysis of Tunable Fractional-Order Band-Pass Filter of Order 2α. AEU—Int. J. Electron. Commun. 2020, 124, 153343. [Google Scholar] [CrossRef]
- Baranowski, J.; Piatek, P. Fractional Band-Pass Filters: Design, Implementation and Application to EEG Signal Processing. J. Circuits Syst. Comput. 2017, 26, 1750170. [Google Scholar] [CrossRef]
- Baranowski, J.; Bauer, W.; Zagorowska, M.; Piatek, P. On Digital Realizations of Non-Integer Order Filters. Circuits Syst. Signal Process. 2016, 35, 2083–2107. [Google Scholar] [CrossRef]
- Baranowski, J.; Pauluk, M.; Tutaj, A. Analog Realization of Fractional Filters: Laguerre Approximation Approach. AEU—Int. J. Electron. Commun. 2017, 81, 1–11. [Google Scholar] [CrossRef]
- Elwy, O.; Abdelaty, A.; Said, L.; Radwan, A. Fractional Calculus Definitions, Approximations, and Engineering Applications. J. Eng. Appl. Sci. 2020, 67, 1–30. [Google Scholar]
- Nagabushanam, P.; George, S.T.; Dolly, D.R.J.; Radha, S. Artifact Cleaning of Motor Imagery EEG by Statistical Features Extraction Using Wavelet Families. Int. J. Circuit Theory Appl. 2020, 48, 2219–2241. [Google Scholar] [CrossRef]
- Bhati, D.; Sharma, M.; Pachori, R.B.; Gadre, V.M. Time—Frequency Localized Three-Band Biorthogonal Wavelet Filter Bank Using Semidefinite Relaxation and Nonlinear Least Squares with Epileptic Seizure EEG Signal Classification. Digit. Signal Process. 2017, 62, 259–273. [Google Scholar] [CrossRef]
- Bhattacharyya, A.; Sharma, M.; Pachori, R.B.; Sircar, P.; Acharya, U.R. A Novel Approach for Automated Detection of Focal EEG Signals Using Empirical Wavelet Transform. Neural Comput. Appl. 2018, 29, 47–57. [Google Scholar] [CrossRef]
- Mamun, M.; Al-Kadi, M.; Marufuzzaman, M. Effectiveness of Wavelet Denoising on Electroencephalogram Signals. J. Appl. Res. Technol. 2013, 11, 156–160. [Google Scholar] [CrossRef]
- Yavuz, E.; Aydemir, O. Olfaction Recognition by EEG Analysis Using Wavelet Transform Features. In Proceedings of the 2016 International Symposium on INnovations in Intelligent SysTems and Applications (INISTA), Sinaia, Romania, 2–5 August 2016; pp. 1–4. [Google Scholar] [CrossRef]
- Ablin, P.; Cardoso, J.F.; Gramfort, A. Spectral Independent Component Analysis with Noise Modeling for M/EEG Source Separation. arXiv 2020, arXiv:2008.09693. [Google Scholar]
- Devulapalli, S.P.; Chanamallu, S.R.; Kodati, S.P. A Hybrid ICA Kalman Predictor Algorithm for Ocular Artifacts Removal. Int. J. Speech Technol. 2020, 23, 727–735. [Google Scholar] [CrossRef]
- Hsu, S.H.; Mullen, T.R.; Jung, T.P.; Cauwenberghs, G. Real-time adaptive EEG source separation using online recursive independent component analysis. IEEE Trans. Neural Syst. Rehabil. Eng. 2015, 24, 309–319. [Google Scholar] [CrossRef]
- Chang, C.Y.; Hsu, S.H.; Pion-Tonachini, L.; Jung, T.P. Evaluation of artifact subspace reconstruction for automatic artifact components removal in multi-channel EEG recordings. IEEE Trans. Biomed. Eng. 2019, 67, 1114–1121. [Google Scholar] [CrossRef]
- Shan, X.; Yang, E.H.; Zhou, J.; Chang, V.W.C. Human-Building Interaction under Various Indoor Temperatures through Neural-Signal Electroencephalogram (EEG) Methods. Build. Environ. 2018, 129, 46–53. [Google Scholar] [CrossRef]
- Corradino, C.; Bucolo, M. Automatic Preprocessing of EEG Signals in Long Time Scale. In Proceedings of the 2015 37th Annual International Conference of the IEEE Engineering in Medicine and Biology Society (EMBC), Milan, Italy, 25–29 August 2015; pp. 4110–4113. [Google Scholar] [CrossRef]
- Li, W.; Shen, Y.; Zhang, J.; Huang, X.; Chen, Y.; Ge, Y. Common Interferences Removal from Dense Multichannel EEG Using Independent Component Decomposition. Comput. Math. Methods Med. 2018, 2018, 1482874. [Google Scholar] [CrossRef]
- Arnin, J.; Kahani, D.; Lakany, H.; Conway, B.A. Evaluation of Different Signal Processing Methods in Time and Frequency Domain for Brain-Computer Interface Applications. In Proceedings of the 2018 40th Annual International Conference of the IEEE Engineering in Medicine and Biology Society (EMBC), Honolulu, HI, USA, 18–21 July 2018; pp. 235–238. [Google Scholar] [CrossRef]
- Chaudhary, U.; Mrachacz-Kersting, N.; Birbaumer, N. Neuropsychological and neurophysiological aspects of brain-computer-interface (BCI) control in paralysis. J. Physiol. 2020, 599, 2351–2359. [Google Scholar] [CrossRef] [PubMed]
- Borgheai, S.B.; McLinden, J.; Zisk, A.H.; Hosni, S.I.; Deligani, R.J.; Abtahi, M.; Mankodiya, K.; Shahriari, Y. Enhancing Communication for People in Late-Stage ALS Using an fNIRS-Based BCI System. IEEE Trans. Neural Syst. Rehabil. Eng. 2020, 28, 1198–1207. [Google Scholar] [CrossRef] [PubMed]
- Piccione, F.; Giorgi, F.; Tonin, P.; Priftis, K.; Giove, S.; Silvoni, S.; Palmas, G.; Beverina, F. P300-Based Brain Computer Interface: Reliability and Performance in Healthy and Paralysed Participants. Clin. Neurophysiol. 2006, 117, 531–537. [Google Scholar] [CrossRef]
- Khan, O.I.; Farooq, F.; Akram, F.; Choi, M.T.; Han, S.M.; Kim, T.S. Robust Extraction of P300 Using Constrained ICA for BCI Applications. Med. Biol. Eng. Comput. 2012, 50, 231–241. [Google Scholar] [CrossRef] [PubMed]
- Rashid, M.; Sulaiman, N.; Mustafa, M.; Khatun, S.; Bari, B.S.; Hasan, M.J. Recent Trends and Open Challenges in EEG Based Brain-Computer Interface Systems. In InECCE2019; Kasruddin Nasir, A.N., Ahmad, M.A., Najib, M.S., Abdul Wahab, Y., Othman, N.A., Abd Ghani, N.M., Irawan, A., Khatun, S., Raja Ismail, R.M.T., Saari, M.M., et al., Eds.; Springer: Singapore, 2020; Volume 632, pp. 367–378. [Google Scholar] [CrossRef]
- Pion-Tonachini, L.; Hsu, S.H.; Makeig, S.; Jung, T.P.; Cauwenberghs, G. Real-time eeg source-mapping toolbox (rest): Online ica and source localization. In Proceedings of the 2015 37th Annual International Conference of the IEEE Engineering in Medicine and Biology Society (EMBC), Milan, Italy, 25–29 August 2015; IEEE: Piscataway, NJ, USA, 2015; pp. 4114–4117. [Google Scholar]
- Flandrin, P.; Rilling, G.; Goncalves, P. Empirical Mode Decomposition as a Filter Bank. IEEE Signal Process. Lett. 2004, 11, 112–114. [Google Scholar] [CrossRef]
- Amo, C.; De Santiago, L.; Barea, R.; López-Dorado, A.; Boquete, L. Analysis of Gamma-Band Activity from Human EEG Using Empirical Mode Decomposition. Sensors 2017, 17, 989. [Google Scholar] [CrossRef] [PubMed]
- Chen, S.J.; Peng, C.J.; Chen, Y.C.; Hwang, Y.R.; Lai, Y.S.; Fan, S.Z.; Jen, K.K. Comparison of FFT and Marginal Spectra of EEG Using Empirical Mode Decomposition to Monitor Anesthesia. Comput. Methods Programs Biomed. 2016, 137, 77–85. [Google Scholar] [CrossRef]
- Gaur, P.; Pachori, R.B.; Wang, H.; Prasad, G. A Multi-Class EEG-Based BCI Classification Using Multivariate Empirical Mode Decomposition Based Filtering and Riemannian Geometry. Expert Syst. Appl. 2018, 95, 201–211. [Google Scholar] [CrossRef]
- Rutkowski, T.M.; Mandic, D.P.; Cichocki, A.; Przybyszewski, A.W. EMD Approach to Multichannel EEG Data—The Amplitude and Phase Components Clustering Analysis. J. Circuits Syst. Comput. 2010, 19, 215–229. [Google Scholar] [CrossRef]
- Molla, M.K.I.; Tanaka, T.; Rutkowski, T.M.; Cichocki, A. Separation of EOG Artifacts from EEG Signals Using Bivariate EMD. In Proceedings of the 2010 IEEE International Conference on Acoustics, Speech and Signal Processing, Dallas, TX, USA, 14–19 March 2010; pp. 562–565. [Google Scholar] [CrossRef]
- Maimon, N.B.; Molcho, L.; Intrator, N.; Lamy, D. Single-Channel EEG Features during n-Back Task Correlate with Working Memory Load. arXiv 2020, arXiv:2008.04987. [Google Scholar]
- Leite, N.M.N.; Pereira, E.T.; Gurjão, E.C.; Veloso, L.R. Deep convolutional autoencoder for eeg noise filtering. In Proceedings of the 2018 IEEE International Conference on Bioinformatics and Biomedicine (BIBM), Madrid, Spain, 3–6 December 2018; IEEE: Piscataway, NJ, USA, 2018; pp. 2605–2612. [Google Scholar]
- Yang, B.; Duan, K.; Fan, C.; Hu, C.; Wang, J. Automatic ocular artifacts removal in EEG using deep learning. Biomed. Signal Process. Control 2018, 43, 148–158. [Google Scholar] [CrossRef]
- Jafarifarmand, A.; Badamchizadeh, M.A. Artifacts removal in EEG signal using a new neural network enhanced adaptive filter. Neurocomputing 2013, 103, 222–231. [Google Scholar] [CrossRef]
- Cowan, H.; Daryanavard, S.; Porr, B.; Dahiya, R. A real-time noise cancelling EEG electrode employing Deep Learning. arXiv 2020, arXiv:2011.03466. [Google Scholar]
- Quej, V.H.; Almorox, J.; Arnaldo, J.A.; Saito, L. ANFIS, SVM and ANN soft-computing techniques to estimate daily global solar radiation in a warm sub-humid environment. J. Atmos. Sol.-Terr. Phys. 2017, 155, 62–70. [Google Scholar] [CrossRef]
- Jang, J.S. ANFIS: Adaptive-Network-Based Fuzzy Inference System. IEEE Trans. Syst. Man Cybern. 1993, 23, 665–685. [Google Scholar] [CrossRef]
- Chen, W.; Wang, Z.; Lao, K.F.; Wan, F. Ocular artifact removal from EEG using ANFIS. In Proceedings of the 2014 IEEE International Conference on Fuzzy Systems (FUZZ-IEEE), Beijing, China, 6–11 July 2014; IEEE: Piscataway, NJ, USA, 2014; pp. 2410–2417. [Google Scholar]
- Pereira, L.F.; Patil, S.A.; Mahadeshwar, C.D.; Mishra, I.; D’Souza, L. Artifact removal from EEG using ANFIS-GA. In Proceedings of the 2016 Online International Conference on Green Engineering and Technologies (IC-GET), Coimbatore, India, 19 November 2016; IEEE: Piscataway, NJ, USA, 2016; pp. 1–6. [Google Scholar]
- Akhtar, M.T.; James, C.J. Focal artifact removal from ongoing EEG–a hybrid approach based on spatially-constrained ICA and wavelet de-noising. In Proceedings of the 2009 Annual International Conference of the IEEE Engineering in Medicine and Biology Society, Minneapolis, MN, USA, 3–6 September 2009; IEEE: Piscataway, NJ, USA, 2009; pp. 4027–4030. [Google Scholar]
- Akhtar, M.T.; Mitsuhashi, W.; James, C.J. Employing spatially constrained ICA and wavelet denoising, for automatic removal of artifacts from multichannel EEG data. Signal Process. 2012, 92, 401–416. [Google Scholar] [CrossRef]
- Peng, H.; Hu, B.; Shi, Q.; Ratcliffe, M.; Zhao, Q.; Qi, Y.; Gao, G. Removal of Ocular Artifacts in EEG—An Improved Approach Combining DWT and ANC for Portable Applications. IEEE J. Biomed. Health Inform. 2013, 17, 600–607. [Google Scholar] [CrossRef] [PubMed]
- Maddirala, A.; Shaik, R.A. Removal of EOG Artifacts from Single Channel EEG Signals Using Combined Singular Spectrum Analysis and Adaptive Noise Canceler. IEEE Sens. J. 2016, 16, 8279–8287. [Google Scholar] [CrossRef]
- Nguyen, H.A.T.; Le, T.H.; Bui, T.D. A Deep Wavelet Sparse Autoencoder Method for Online and Automatic Electrooculographical Artifact Removal. Neural Comput. Appl. 2020, 32, 18255–18270. [Google Scholar] [CrossRef]
- Kose, M.R.; Ahirwal, M.K.; Janghel, R.R. Descendant Adaptive Filter to Remove Different Noises from ECG Signals. Int. J. Biomed. Eng. Technol. 2020, 33, 258–273. [Google Scholar] [CrossRef]
- Kaya, I. A Brief Summary of EEG Artifact Handling. arXiv 2019, arXiv:2001.00693. [Google Scholar] [CrossRef]
- Jafarifarmand, A.; Badamchizadeh, M.A.; Khanmohammadi, S.; Nazari, M.A.; Tazehkand, B.M. Real-time ocular artifacts removal of EEG data using a hybrid ICA-ANC approach. Biomed. Signal Process. Control 2017, 31, 199–210. [Google Scholar] [CrossRef]
- Torse, D.A.; Desai, V.V. Design of Adaptive EEG Preprocessing Algorithm for Neurofeedback System. In Proceedings of the 2016 International Conference on Communication and Signal Processing (ICCSP), Melmaruvathur, India, 6–8 April 2016; pp. 392–395. [Google Scholar] [CrossRef]
- Rejer, I.; Górski, P. A Multi-Filtering Algorithm for Applying ICA in a Low-Channel EEG. In Artificial Intelligence and Soft Computing; Rutkowski, L., Scherer, R., Korytkowski, M., Pedrycz, W., Tadeusiewicz, R., Zurada, J.M., Eds.; Springer International Publishing: Cham, Switzerland, 2019; Volume 11509, pp. 283–293. [Google Scholar] [CrossRef]
- Dimitriadis, S.I.; Marimpis, A.D. Enhancing performance and bit rates in a brain–computer interface system with phase-to-amplitude cross-frequency coupling: Evidences from traditional c-VEP, Fast c-VEP, and SSVEP designs. Front. Neuroinform. 2018, 12, 19. [Google Scholar] [CrossRef] [PubMed]
- Cohen, M.X. Assessing transient cross-frequency coupling in EEG data. J. Neurosci. Methods 2008, 168, 494–499. [Google Scholar] [CrossRef]
- Knyazev, G.G.; Savostyanov, A.N.; Bocharov, A.V.; Tamozhnikov, S.S.; Kozlova, E.A.; Leto, I.V.; Slobodskaya, H.R. Cross-frequency coupling in developmental perspective. Front. Hum. Neurosci. 2019, 13, 158. [Google Scholar] [CrossRef]
- Dimitriadis, S.I.; Laskaris, N.A.; Bitzidou, M.P.; Tarnanas, I.; Tsolaki, M.N. A novel biomarker of amnestic MCI based on dynamic cross-frequency coupling patterns during cognitive brain responses. Front. Neurosci. 2015, 9, 350. [Google Scholar] [CrossRef] [PubMed]
- Dimitriadis, S.I.; Laskaris, N.A.; Simos, P.G.; Fletcher, J.M.; Papanicolaou, A.C. Greater repertoire and temporal variability of cross-frequency coupling (CFC) modes in resting-state neuromagnetic recordings among children with reading difficulties. Front. Hum. Neurosci. 2016, 10, 163. [Google Scholar] [CrossRef] [PubMed]
- Cohen, W.R.; Hayes-Gill, B. Influence of Maternal Body Mass Index on Accuracy and Reliability of External Fetal Monitoring Techniques. Acta Obstet. et Gynecol. Scand. 2014, 93, 590–595. [Google Scholar] [CrossRef]
- Jirsa, V.; Müller, V. Cross-frequency coupling in real and virtual brain networks. Front. Comput. Neurosci. 2013, 7, 78. [Google Scholar] [CrossRef]
- Sakkalis, V. Review of advanced techniques for the estimation of brain connectivity measured with EEG/MEG. Comput. Biol. Med. 2011, 41, 1110–1117. [Google Scholar] [CrossRef]
- Haufe, S.; Nikulin, V.V.; Müller, K.R.; Nolte, G. A critical assessment of connectivity measures for EEG data: A simulation study. Neuroimage 2013, 64, 120–133. [Google Scholar] [CrossRef]
- Ullah, I.; Hussain, M.; Aboalsamh, H. An automated system for epilepsy detection using EEG brain signals based on deep learning approach. Expert Syst. Appl. 2018, 107, 61–71. [Google Scholar] [CrossRef]
- Nigam, V.P.; Graupe, D. A neural-network-based detection of epilepsy. Neurol. Res. 2004, 26, 55–60. [Google Scholar] [CrossRef] [PubMed]
- Oh, S.L.; Hagiwara, Y.; Raghavendra, U.; Yuvaraj, R.; Arunkumar, N.; Murugappan, M.; Acharya, U.R. A deep learning approach for Parkinson’s disease diagnosis from EEG signals. Neural Comput. Appl. 2020, 32, 10927–10933. [Google Scholar] [CrossRef]
- Merlin Praveena, D.; Angelin Sarah, D.; Thomas George, S. Deep learning techniques for EEG signal applications—A review. IETE J. Res. 2020, 1–8. [Google Scholar] [CrossRef]
- Guo, L.; Rivero, D.; Dorado, J.; Rabunal, J.R.; Pazos, A. Automatic epileptic seizure detection in EEGs based on line length feature and artificial neural networks. J. Neurosci. Methods 2010, 191, 101–109. [Google Scholar] [CrossRef] [PubMed]
- Zhang, X.; Yao, L.; Wang, X.; Monaghan, J.J.; Mcalpine, D.; Zhang, Y. A survey on deep learning-based non-invasive brain signals: Recent advances and new frontiers. J. Neural Eng. 2020, 18, 031002. [Google Scholar] [CrossRef] [PubMed]
- Zhang, X.; Yao, L.; Zhang, S.; Kanhere, S.; Sheng, M.; Liu, Y. Internet of Things meets brain–computer interface: A unified deep learning framework for enabling human-thing cognitive interactivity. IEEE Internet Things J. 2018, 6, 2084–2092. [Google Scholar] [CrossRef]
- Islam, M.R.; Moni, M.A.; Islam, M.M.; Rashed-Al-Mahfuz, M.; Islam, M.S.; Hasan, M.K.; Hossain, M.S.; Ahmad, M.; Uddin, S.; Azad, A.; et al. Emotion Recognition From EEG Signal Focusing on Deep Learning and Shallow Learning Techniques. IEEE Access 2021, 9, 94601–94624. [Google Scholar] [CrossRef]
- Luo, J.; Gao, X.; Zhu, X.; Wang, B.; Lu, N.; Wang, J. Motor Imagery EEG Classification Based on Ensemble Support Vector Learning. Comput. Methods Programs Biomed. 2020, 193, 105464. [Google Scholar] [CrossRef]
- Sabeti, M.; Boostani, R.; Moradi, E. Event Related Potential (ERP) as a Reliable Biometric Indicator: A Comparative Approach. Array 2020, 6, 100026. [Google Scholar] [CrossRef]
- Markand, O.N. Basic Techniques of Evoked Potential Recording. In Clinical Evoked Potentials; Springer International Publishing: Cham, Switzerland, 2020; pp. 1–23. [Google Scholar] [CrossRef]
- Kumar, A.; Anand, S.; Yaddanapudi, L.N. Comparison of Auditory Evoked Potential Parameters for Predicting Clinically Anaesthetized State. Acta Anaesthesiol. Scand. 2006, 50, 1139–1144. [Google Scholar] [CrossRef]
- Cruccu, G.; Aminoff, M.; Curio, G.; Guerit, J.; Kakigi, R.; Mauguiere, F.; Rossini, P.; Treede, R.D.; Garcia-Larrea, L. Recommendations for the Clinical Use of Somatosensory-Evoked Potentials. Clin. Neurophysiol. 2008, 119, 1705–1719. [Google Scholar] [CrossRef]
- Lueders, H.; Lesser, R.P.; Hahn, J.; Dinner, D.S.; Klem, G. Cortical Somatosensory Evoked Potentials in Response to Hand Stimulation. J. Neurosurg. 1983, 58, 885–894. [Google Scholar] [CrossRef]
- Cracco, R.Q.; Cracco, J.B. Somatosensory Evoked Potential in Man: Far Field Potentials. Electroencephalogr. Clin. Neurophysiol. 1976, 41, 460–466. [Google Scholar] [CrossRef]
- Chiappa, K.H. (Ed.) Evoked Potentials in Clinical Medicine, 3rd ed.; Lippincott-Raven: Philadelphia, PA, USA, 1997. [Google Scholar]
- Najarian, K. Biomedical Signal and Image Processing; Taylor & Francis: Abingdon, UK, 2016. [Google Scholar]
- Cook, M.L.; Varela, R.A.; Goldstein, J.D.; McCulloch, S.D.; Bossart, G.D.; Finneran, J.J.; Houser, D.; Mann, D.A. Beaked whale auditory evoked potential hearing measurements. J. Comp. Physiol. A 2006, 192, 489–495. [Google Scholar] [CrossRef] [PubMed]
- Borges, L.R.; Donadon, C.; Sanfins, M.D.; Valente, J.P.; Paschoal, J.R.; Colella-Santos, M.F. The effects of otitis media with effusion on the measurement of auditory evoked potentials. Int. J. Pediatr. Otorhinolaryngol. 2020, 133, 109978. [Google Scholar] [CrossRef] [PubMed]
- Saha, S.; Mamun, K.A.; Ahmed, K.I.U.; Mostafa, R.; Naik, G.R.; Darvishi, S.; Khandoker, A.H.; Baumert, M. Progress in Brain Computer Interface: Challenges and Potentials. Front. Syst. Neurosci. 2021, 15, 4. [Google Scholar] [CrossRef]
- Welschehold, S.; Boor, S.; Reuland, K.; Thömke, F.; Kerz, T.; Reuland, A.; Beyer, C.; Gartenschläger, M.; Wagner, W.; Giese, A.; et al. Technical Aids in the Diagnosis of Brain Death. Dtsch. Aerzteblatt Online 2012, 109, 624. [Google Scholar] [CrossRef]
- Picton, T.W. Human Auditory Evoked Potentials; Plural Pub: San Diego, CA, USA, 2010. [Google Scholar]
- Capitanio, L.; Jensen, E.W.; Filligoi, G.C.; Makovec, B.; Gagliardi, M.; Henneberg, S.W.; Lindholm, P.; Cerutti, S. On-Line Analysis of AEP and EEG for Monitoring Depth of Anaesthesia. Methods Inf. Med. 1997, 36, 311–314. [Google Scholar] [CrossRef]
- Arden, G.B. Recent Advances in Visual Sciences: The Visual Evoked Response in Ophthalmology; SAGE Publications: Thousand Oaks, CA, USA, 1973. [Google Scholar]
- Cammann, R. Use of Visual Evoked Potentials in Neurology—A Review. I. Zentralblatt Fur Neurochir. 1985, 46, 52. [Google Scholar]
- Rajbhandari Pandey, K.; Panday, D.R.; Limbu, N.; Shah, B.; Agarwal, K. Effect of Smoking on Visual Evoked Potential (VEP) and Visual Reaction Time (VRT). Asian J. Med Sci. 2020, 11, 9–13. [Google Scholar] [CrossRef]
- Lesiakowski, P.; Lubiński, W.; Zwierko, T. Analysis of the Relationship Between Training Experience and Visual Sensory Functions in Athletes from Different Sports. Pol. J. Sport Tour. 2017, 24, 110–114. [Google Scholar] [CrossRef][Green Version]
- Jung, T.P.; Makeig, S.; Westerfield, M.; Townsend, J.; Courchesne, E.; Sejnowski, T.J. Analysis and Visualization of Single-Trial Event-Related Potentials. Hum. Brain Mapp. 2001, 14, 166–185. [Google Scholar] [CrossRef] [PubMed]
- Handy, T.C. (Ed.) Event-Related Potentials: A Methods Handbook; MIT Press: Cambridge, MA, USA, 2005. [Google Scholar]
- Kropotov, J.D. Quantitative EEG, Event-Related Potentials and Neurotherapy, 1st ed.; Elsevier, Academic Press: Amsterdam, The Netherlands, 2009. [Google Scholar]
- Alvarenga, K.F.; Amorim, R.B.; Agostinho-Pesse, R.S.; Costa, O.A.; Nascimento, L.T.; Bevilacqua, M.C. Speech Perception and Cortical Auditory Evoked Potentials in Cochlear Implant Users with Auditory Neuropathy Spectrum Disorders. Int. J. Pediatr. Otorhinolaryngol. 2012, 76, 1332–1338. [Google Scholar] [CrossRef] [PubMed]
- Berman, S.; Backner, Y.; Krupnik, R.; Paul, F.; Petrou, P.; Karussis, D.; Levin, N.; Mezer, A.A. Conduction Delays in the Visual Pathways of Progressive Multiple Sclerosis Patients Covary with Brain Structure. NeuroImage 2020, 221, 117204. [Google Scholar] [CrossRef]
- Abed, D.K.; Almezel, F.; Al-Salem, Y.; Almuhanna, D.; Algharib, N.; Aldawood, F.; Albeladi, Q.; Kamal, A.; Abduljabbar, O. The Correlation between the Clinical, Radiological and Visual Evoke Potential Findings in Multiple Sclerosis Patients. Bahrain Med. Bull. 2020, 42, 107–109. [Google Scholar]
- Ford, H. Clinical Presentation and Diagnosis of Multiple Sclerosis. Clin. Med. 2020, 20, 380–383. [Google Scholar] [CrossRef] [PubMed]
- Kook, H.; Gupta, L.; Kota, S.; Molfese, D.; Lyytinen, H. An Offline/Real-Time Artifact Rejection Strategy to Improve the Classification of Multi-Channel Evoked Potentials. Pattern Recognit. 2008, 41, 1985–1996. [Google Scholar] [CrossRef]
- Fatourechi, M.; Bashashati, A.; Ward, R.K.; Birch, G.E. EMG and EOG Artifacts in Brain Computer Interface Systems: A Survey. Clin. Neurophysiol. 2007, 118, 480–494. [Google Scholar] [CrossRef] [PubMed]
- Ponton, C.W.; Don, M.; Waring, M.D.; Eggermont, J.J.; Masuda, A. Spatio-Temporal Source Modeling of Evoked Potentials to Acoustic and Cochlear Implant Stimulation. Electroencephalogr. Clin. Neurophysiol. Potentials Sect. 1993, 88, 478–493. [Google Scholar] [CrossRef]
- Legatt, A.D. Artifacts in Evoked Potential Recordings. In Atlas of Artifacts in Clinical Neurophysiology; Tatum, W.O., Ed.; Springer Publishing Company: New York, NY, USA, 2018. [Google Scholar] [CrossRef]
- Gilley, P.M.; Sharma, A.; Dorman, M.; Finley, C.C.; Panch, A.S.; Martin, K. Minimization of Cochlear Implant Stimulus Artifact in Cortical Auditory Evoked Potentials. Clin. Neurophysiol. 2006, 117, 1772–1782. [Google Scholar] [CrossRef] [PubMed]
- Al-ani, T.; Cazettes, F.; Palfi, S.; Lefaucheur, J.P. Automatic Removal of High-Amplitude Stimulus Artefact from Neuronal Signal Recorded in the Subthalamic Nucleus. J. Neurosci. Methods 2011, 198, 135–146. [Google Scholar] [CrossRef]
- Beer, N.A.M.; Velde, M.; Cluitmans, P.J.M. Clinical Evaluation of a Method for Automatic Detection and Removal of Artifacts in Auditory Evoked Potential Monitoring. J. Clin. Monit. 1995, 11, 381–391. [Google Scholar] [CrossRef]
- Chrapka, P. Advances in EP and ERP Signal Processing. Ph.D. Thesis, McMaster University, Hamilton, ON, Canada, 2018. [Google Scholar]
- De Bruin, H.; Archambeault, M.; Hasey, G. Recording EEG During Repetitive Trans-Cranial Magnetic Stimulation. In Proceedings of the International Conference on Bio-Inspired Systems and Signal Processing, Porto, Portugal, 14–17 January 2009; pp. 265–272. [Google Scholar] [CrossRef]
- Brodie, B.T.; Koeman, H. Sample and Hold Circuit. U.S. Patent 4,302,689, 26 January 1981. [Google Scholar]
- Freeman, J.A. An Electronic Stimulus Artifact Suppressor. Electroencephalogr. Clin. Neurophysiol. 1971, 31, 170–172. [Google Scholar] [CrossRef]
- Roby, R.J.; Lettich, E. A Simplified Circuit for Stimulus Artifact Suppression. Electroencephalogr. Clin. Neurophysiol. 1975, 39, 85–87. [Google Scholar] [CrossRef]
- Babb, T.L.; Mariani, E.; Strain, G.M.; Lieb, J.P.; Soper, H.V.; Crandall, P.H. A Sample and Hold Amplifier System for Stimulus Artifact Suppression. Electroencephalogr. Clin. Neurophysiol. 1978, 44, 528–531. [Google Scholar] [CrossRef]
- Peper, A.; Grimbergen, C.A. EEG Measurement During Electrical Stimulation. IEEE Trans. Biomed. Eng. 1983, BME-30, 231–233. [Google Scholar] [CrossRef] [PubMed]
- Heffer, L.F.; Fallon, J.B. A Novel Stimulus Artifact Removal Technique for High-Rate Electrical Stimulation. J. Neurosci. Methods 2008, 170, 277–284. [Google Scholar] [CrossRef] [PubMed]
- Schoenecker, M.C.; Bonham, B.H. Fast Stimulus Artifact Recovery in a Multichannel Neural Recording System. In Proceedings of the 2008 IEEE Biomedical Circuits and Systems Conference, Baltimore, MD, USA, 20–22 November 2008; pp. 253–256. [Google Scholar] [CrossRef]
- Chiappa, K.H.; Ropper, A.H. Evoked Potentials in Clinical Medicine. N. Engl. J. Med. 1982, 306, 1140–1150. [Google Scholar] [CrossRef]
- Cao, T.; Wan, F.; Wong, C.; da Cruz, J.; Hu, Y. Objective Evaluation of Fatigue by EEG Spectral Analysis in Steady-State Visual Evoked Potential-Based Brain-Computer Interfaces. BioMed. Eng. OnLine 2014, 13, 28. [Google Scholar] [CrossRef] [PubMed]
- Somers, B.; Francart, T.; Bertrand, A. A Generic EEG Artifact Removal Algorithm Based on the Multi-Channel Wiener Filter. J. Neural Eng. 2018, 15, 036007. [Google Scholar] [CrossRef] [PubMed]
- Wang, T.; Özdamar, Ö.; Bohórquez, J.; Shen, Q.; Cheour, M. Wiener Filter Deconvolution of Overlapping Evoked Potentials. J. Neurosci. Methods 2006, 158, 260–270. [Google Scholar] [CrossRef]
- Cichocki, A.; Gharieb, R.; Hoya, T. Efficient Extraction of Evoked Potentials by Combination of Wiener Filtering and Subspace Methods. In Proceedings of the 2001 IEEE International Conference on Acoustics, Speech, and Signal Processing (Cat. No.01CH37221), Salt Lake City, UT, USA, 7–11 May 2001; Volume 5, pp. 3117–3120. [Google Scholar] [CrossRef]
- Paul, J.; Luft, A.; Hanley, D.; Thakor, N. Coherence-Weighted Wiener Filtering of Somatosensory Evoked Potentials. IEEE Trans. Biomed. Eng. 2001, 48, 1483–1488. [Google Scholar] [CrossRef]
- Lin, B.S.; Lin, B.S.; Chong, F.C.; Lai, F. Adaptive Filtering of Evoked Potentials Using Higher-Order Adaptive Signal Enhancer with Genetic-Type Variable Step-Size Prefilter. Med. Biol. Eng. Comput. 2005, 43, 638–647. [Google Scholar] [CrossRef]
- Ahirwal, M.K.; Kumar, A.; Singh, G.K. Adaptive Filtering of EEG/ERP through Noise Cancellers Using an Improved PSO Algorithm. Swarm Evol. Comput. 2014, 14, 76–91. [Google Scholar] [CrossRef]
- Dien, J. Addressing Misallocation of Variance in Principal Components Analysis of Event-Related Potentials. Brain Topogr. 1998, 11, 43–55. [Google Scholar] [CrossRef] [PubMed]
- Quian Quiroga, R. Obtaining Single Stimulus Evoked Potentials with Wavelet Denoising. Phys. D Nonlinear Phenom. 2000, 145, 278–292. [Google Scholar] [CrossRef]
- Quian Quiroga, R.; van Luijtelaar, E. Habituation and Sensitization in Rat Auditory Evoked Potentials: A Single-Trial Analysis with Wavelet Denoising. Int. J. Psychophysiol. 2002, 43, 141–153. [Google Scholar] [CrossRef]
- Quiroga, R.; Garcia, H. Single-Trial Event-Related Potentials with Wavelet Denoising. Clin. Neurophysiol. 2003, 114, 376–390. [Google Scholar] [CrossRef]
- Ahmadi, M.; Quian Quiroga, R. Automatic Denoising of Single-Trial Evoked Potentials. NeuroImage 2013, 66, 672–680. [Google Scholar] [CrossRef]
- Shapiro, J.M. Embedded Image Coding Using Zerotrees of Wavelet Coefficients. In Wavelet Image and Video Compression; Topiwala, P.N., Ed.; Kluwer Academic Publishers: Boston, MA, USA, 2002; Volume 450, pp. 123–155. [Google Scholar] [CrossRef]
- Wang, Z.; Maier, A.; Leopold, D.A.; Logothetis, N.K.; Liang, H. Single-Trial Evoked Potential Estimation Using Wavelets. Comput. Biol. Med. 2007, 37, 463–473. [Google Scholar] [CrossRef] [PubMed]
- Iyer, D.; Zouridakis, G. Single-Trial Evoked Potential Estimation: Comparison between Independent Component Analysis and Wavelet Denoising. Clin. Neurophysiol. 2007, 118, 495–504. [Google Scholar] [CrossRef]
- Zouridakis, G.; Iyer, D. Comparison between ICA and Wavelet-Based Denoising of Single-Trial Evoked Potentials. In Proceedings of the 26th Annual International Conference of the IEEE Engineering in Medicine and Biology Society, San Francisco, CA, USA, 1–5 September 2004; Volume 3, pp. 87–90. [Google Scholar] [CrossRef]
- Lee, P.L.; Hsieh, J.C.; Wu, C.H.; Shyu, K.K.; Chen, S.S.; Yeh, T.C.; Wu, Y.T. The Brain Computer Interface Using Flash Visual Evoked Potential and Independent Component Analysis. Ann. Biomed. Eng. 2006, 34, 1641–1654. [Google Scholar] [CrossRef] [PubMed]
- Patidar, U.; Zouridakis, G. A Hybrid Algorithm for Artifact Rejection in EEG Recordings Based on Iterative ICA and Fuzzy Clustering. In Proceedings of the 2008 30th Annual International Conference of the IEEE Engineering in Medicine and Biology Society, Vancouver, BC, Canada, 20–25 August 2008; pp. 50–53. [Google Scholar] [CrossRef]
- Palaniappan, R.; Ravi, K. Improving Visual Evoked Potential Feature Classification for Person Recognition Using PCA and Normalization. Pattern Recognit. Lett. 2006, 27, 726–733. [Google Scholar] [CrossRef]
- Palaniappan, R.; Anandan, S.; Raveendran, P. Two Level PCA to Reduce Noise and EEG from Evoked Potential Signals. In Proceedings of the 7th International Conference on Control, Automation, Robotics and Vision, Singapore, 2–5 December 2002; Volume 3, pp. 1688–1693. [Google Scholar] [CrossRef]
- Mowla, M.R.; Ng, S.C.; Zilany, M.S.A.; Paramesran, R. Single-Trial Evoked Potential Estimation Using Iterative Principal Component Analysis. IEEE Sens. J. 2016, 16, 6955–6960. [Google Scholar] [CrossRef]
- Hu, L.; Mouraux, A.; Hu, Y.; Iannetti, G. A Novel Approach for Enhancing the Signal-to-Noise Ratio and Detecting Automatically Event-Related Potentials (ERPs) in Single Trials. NeuroImage 2010, 50, 99–111. [Google Scholar] [CrossRef] [PubMed]
- Zou, L.; Zhang, Y.; Yang, L.T.; Zhou, R. Single-Trial Evoked Potentials Study by Combining Wavelet Denoising and Principal Component Analysis Methods. J. Clin. Neurophysiol. 2010, 27, 17–24. [Google Scholar] [CrossRef]
- Wang, D.D.; Chen, W.; Starr, P.A.; de Hemptinne, C. Local Field Potentials and ECoG. In Stereotactic and Functional Neurosurgery; Pouratian, N., Sheth, S.A., Eds.; Springer International Publishing: Cham, Switzerland, 2020; pp. 107–117. [Google Scholar] [CrossRef]
- Nakasatp, N.; Levesque, M.F.; Barth, D.S.; Baumgartner, C.; Rogers, R.L.; Sutherling, W.W. Comparisons of MEG, EEG, and ECoG Source Localization in Neocortical Partial Epilepsy in Humans. Electroencephalogr. Clin. Neurophysiol. 1994, 91, 171–178. [Google Scholar] [CrossRef]
- RaviPrakash, H.; Korostenskaja, M.; Castillo, E.M.; Lee, K.H.; Salinas, C.M.; Baumgartner, J.; Anwar, S.M.; Spampinato, C.; Bagci, U. Deep Learning Provides Exceptional Accuracy to ECoG-Based Functional Language Mapping for Epilepsy Surgery. Front. Neurosci. 2020, 14, 409. [Google Scholar] [CrossRef]
- Hashiguchi, K.; Morioka, T.; Yoshida, F.; Miyagi, Y.; Nagata, S.; Sakata, A.; Sasaki, T. Correlation between Scalp-Recorded Electroencephalographic and Electrocorticographic Activities during Ictal Period. Seizure 2007, 16, 238–247. [Google Scholar] [CrossRef]
- Asano, E.; Juhasz, C.; Shah, A.; Muzik, O.; Chugani, D.C.; Shah, J.; Sood, S.; Chugani, H.T. Origin and Propagation of Epileptic Spasms Delineated on Electrocorticography. Epilepsia 2005, 46, 1086–1097. [Google Scholar] [CrossRef] [PubMed]
- Logothetis, N.K. The Underpinnings of the BOLD Functional Magnetic Resonance Imaging Signal. J. Neurosci. 2003, 23, 3963–3971. [Google Scholar] [CrossRef] [PubMed]
- Ulbert, I.; Halgren, E.; Heit, G.; Karmos, G. Multiple Microelectrode-Recording System for Human Intracortical Applications. J. Neurosci. Methods 2001, 106, 69–79. [Google Scholar] [CrossRef]
- van’t Klooster, M.A.; van Klink, N.E.; Zweiphenning, W.J.; Leijten, F.S.; Zelmann, R.; Ferrier, C.H.; van Rijen, P.C.; Otte, W.M.; Braun, K.P.; Huiskamp, G.J.; et al. Tailoring Epilepsy Surgery with Fast Ripples in the Intraoperative Electrocorticogram: Tailoring Epilepsy Surgery With Fast Ripples. Ann. Neurol. 2017, 81, 664–676. [Google Scholar] [CrossRef] [PubMed]
- Sellers, K.K.; Schuerman, W.L.; Dawes, H.E.; Chang, E.F.; Leonard, M.K. Comparison of Common Artifact Rejection Methods Applied to Direct Cortical and Peripheral Stimulation in Human ECoG. In Proceedings of the 2019 9th International IEEE/EMBS Conference on Neural Engineering (NER), San Francisco, CA, USA, 20–23 March 2019; pp. 77–80. [Google Scholar] [CrossRef]
- Caldwell, D.J.; Cronin, J.A.; Rao, R.P.N.; Collins, K.L.; Weaver, K.E.; Ko, A.L.; Ojemann, J.G.; Kutz, J.N.; Brunton, B.W. Signal Recovery from Stimulation Artifacts in Intracranial Recordings with Dictionary Learning. J. Neural Eng. 2020, 17, 026023. [Google Scholar] [CrossRef]
- Schweigmann, M.; Koch, K.P.; Auler, F.; Kirchhoff, F. Improving Electrocorticograms of Awake and Anaesthetized Mice Using Wavelet Denoising. Curr. Dir. Biomed. Eng. 2018, 4, 469–472. [Google Scholar] [CrossRef]
- Freeman, W.J.; Rogers, L.J.; Holmes, M.D.; Silbergeld, D.L. Spatial Spectral Analysis of Human Electrocorticograms Including the Alpha and Gamma Bands. J. Neurosci. Methods 2000, 95, 111–121. [Google Scholar] [CrossRef]
- Deeb, S.E. Analysis of Globus Pallidus Local Field Potentials and Electrocorticograms of Patients Diagnosed with Parkinson’s Disease—ProQuest. Ph.D. Thesis, San Diego State University, San Diego, CA, USA, 2019. [Google Scholar]
- Chen, Z.; Huang, L.; Shen, Y.; Wang, J.; Zhao, R.; Dai, J. A New Algorithm for Classification of Ictal and Pre-Ictal Epilepsy ECoG Using MI and SVM. In Proceedings of the 2017 International Conference on Signals and Systems (ICSigSys), Bali, Indonesia, 16–18 May 2017; pp. 212–216. [Google Scholar] [CrossRef]
- Hossain, G.; Myers, M.H.; Kozma, R. Study of Phase Relationships in ECoG Signals Using Hilbert-Huang Transforms. In Advances in Brain Inspired Cognitive Systems; Hutchison, D., Kanade, T., Kittler, J., Kleinberg, J.M., Mattern, F., Mitchell, J.C., Naor, M., Nierstrasz, O., Pandu Rangan, C., Steffen, B., et al., Eds.; Springer: Berlin/Heidelberg, Germany, 2012; Volume 7366, pp. 174–182. [Google Scholar] [CrossRef]
- Seo, J.H.; Tsuda, I.; Lee, Y.J.; Ikeda, A.; Matsuhashi, M.; Matsumoto, R.; Kikuchi, T.; Kang, H. Pattern Recognition in Epileptic EEG Signals via Dynamic Mode Decomposition. Mathematics 2020, 8, 481. [Google Scholar] [CrossRef]
- Ince, N.F.; Goksu, F.; Tewfik, A.H. An ECoG Based Brain Computer Interface with Spatially Adapted Time-Frequency Patterns. In Proceedings of the 2008 International Conference on Bio-Inspired Systems and Signal Processing (BIOSIGNALS 2008), Funchal, Madeira–Portugal, 28–31 January 2008; pp. 132–139. [Google Scholar]
- Herff, C.; Krusienski, D.J.; Kubben, P. The potential of stereotactic-EEG for brain-computer interfaces: Current progress and future directions. Front. Neurosci. 2020, 14, 123. [Google Scholar] [CrossRef] [PubMed]
- Guenot, M.; Isnard, J.; Ryvlin, P.; Fischer, C.; Ostrowsky, K.; Mauguiere, F.; Sindou, M. Neurophysiological monitoring for epilepsy surgery: The Talairach SEEG method. Stereotact. Funct. Neurosurg. 2001, 77, 29–32. [Google Scholar] [CrossRef]
- Bartolomei, F.; Lagarde, S.; Wendling, F.; McGonigal, A.; Jirsa, V.; Guye, M.; Bénar, C. Defining epileptogenic networks: Contribution of SEEG and signal analysis. Epilepsia 2017, 58, 1131–1147. [Google Scholar] [CrossRef]
- Mullin, J.P.; Shriver, M.; Alomar, S.; Najm, I.; Bulacio, J.; Chauvel, P.; Gonzalez-Martinez, J. Is SEEG safe? A systematic review and meta-analysis of stereo-electroencephalography—Related complications. Epilepsia 2016, 57, 386–401. [Google Scholar] [CrossRef] [PubMed]
- Gordon, E.; Konopka, L.M. EEG databases in research and clinical practice: Current status and future directions. Clin. EEG Neurosci. 2005, 36, 53. [Google Scholar] [CrossRef]
- Agarwal, M. EEG Databases—GitHub Repository. 2021. Available online: https://github.com/meagmohit/EEG-Datasets (accessed on 14 June 2021).
- Van Horn, J.D.; Grafton, S.T.; Rockmore, D.; Gazzaniga, M.S. Sharing neuroimaging studies of human cognition. Nat. Neurosci. 2004, 7, 473–481. [Google Scholar] [CrossRef]
- Physionet—Data Base. 2021. Available online: https://physionet.org (accessed on 12 April 2021).
- Goldberger, A.L.; Amaral, L.A.N.; Glass, L.; Hausdorff, J.M.; Ivanov, P.C.; Mark, R.G.; Mietus, J.E.; Moody, G.B.; Peng, C.K.; Stanley, H.E. PhysioBank, PhysioToolkit, and PhysioNet: Components of a New Research Resource for Complex Physiologic Signals. Circulation 2000, 101, e215–e220. [Google Scholar] [CrossRef]
- Sweeney, K.T.; Ayaz, H.; Ward, T.E.; Izzetoglu, M.; McLoone, S.F.; Onaral, B. A methodology for validating artifact removal techniques for physiological signals. IEEE Trans. Inf. Technol. Biomed. 2012, 16, 918–926. [Google Scholar] [CrossRef] [PubMed]
- Kemp, B.; Zwinderman, A.H.; Tuk, B.; Kamphuisen, H.A.; Oberye, J.J. Analysis of a sleep-dependent neuronal feedback loop: The slow-wave microcontinuity of the EEG. IEEE Trans. Biomed. Eng. 2000, 47, 1185–1194. [Google Scholar] [CrossRef]
- Abel, J.H.; Badgeley, M.A.; Meschede-Krasa, B.; Schamberg, G.; Garwood, I.C.; Lecamwasam, K.; Chakravarty, S.; Zhou, D.W.; Keating, M.; Purdon, P.L.; et al. Machine learning of EEG spectra classifies unconsciousness during GABAergic anesthesia. PLoS ONE 2021, 16, e0246165. [Google Scholar] [CrossRef] [PubMed]
- Detti, P.; Vatti, G.; Zabalo Manrique de Lara, G. EEG Synchronization Analysis for Seizure Prediction: A Study on Data of Noninvasive Recordings. Processes 2020, 8, 846. [Google Scholar] [CrossRef]
- Detti, P. Siena Scalp EEG Database (Version 1.0.0). PhysioNet 2020. [Google Scholar] [CrossRef]
- Shoeb, A.H. Application of Machine Learning to Epileptic Seizure Onset Detection and Treatment. Ph.D. Thesis, Massachusetts Institute of Technology, Cambridge, MA, USA, 2009. [Google Scholar]
- Schalk, G.; McFarland, D.J.; Hinterberger, T.; Birbaumer, N.; Wolpaw, J.R. BCI2000: A general-purpose brain-computer interface (BCI) system. IEEE Trans. Biomed. Eng. 2004, 51, 1034–1043. [Google Scholar] [CrossRef]
- Zyma, I.; Tukaev, S.; Seleznov, I.; Kiyono, K.; Popov, A.; Chernykh, M.; Shpenkov, O. Electroencephalograms during mental arithmetic task performance. Data 2019, 4, 14. [Google Scholar] [CrossRef]
- Matran-Fernandez, A.; Poli, R. Towards the automated localisation of targets in rapid image-sifting by collaborative brain-computer interfaces. PLoS ONE 2017, 12, e0178498. [Google Scholar] [CrossRef]
- Oikonomou, V.P.; Liaros, G.; Georgiadis, K.; Chatzilari, E.; Adam, K.; Nikolopoulos, S.; Kompatsiaris, I. Comparative evaluation of state-of-the-art algorithms for SSVEP-based BCIs. arXiv 2016, arXiv:1602.00904. [Google Scholar]
- Hu, L.; Zhang, Z. EEG Signal Processing and Feature Extraction; Springer: Berlin, Germany, 2019. [Google Scholar]
- Chen, S.; He, Z.; Han, X.; He, X.; Li, R.; Zhu, H.; Zhao, D.; Dai, C.; Zhang, Y.; Lu, Z.; et al. How big data and high-performance computing drive brain science. Genom. Proteom. Bioinform. 2019, 17, 381–392. [Google Scholar] [CrossRef] [PubMed]
- Landhuis, E. Neuroscience: Big brain, big data. Nature 2017, 541, 559–561. [Google Scholar] [CrossRef] [PubMed]
- Cavanagh, J.F. Electrophysiology as a theoretical and methodological hub for the neural sciences. Psychophysiology 2019, 56, e13314. [Google Scholar] [CrossRef]
- Khosla, A.; Khandnor, P.; Chand, T. A comparative analysis of signal processing and classification methods for different applications based on EEG signals. Biocybern. Biomed. Eng. 2020, 40, 649–690. [Google Scholar] [CrossRef]
- Blankertz, B.; Lemm, S.; Treder, M.; Haufe, S.; Müller, K.R. Single-trial analysis and classification of ERP components—A tutorial. NeuroImage 2011, 56, 814–825. [Google Scholar] [CrossRef]
- Makeig, S.; Kothe, C.; Mullen, T.; Bigdely-Shamlo, N.; Zhang, Z.; Kreutz-Delgado, K. Evolving signal processing for brain–computer interfaces. Proc. IEEE 2012, 100, 1567–1584. [Google Scholar] [CrossRef]
- Müller, K.R.; Tangermann, M.; Dornhege, G.; Krauledat, M.; Curio, G.; Blankertz, B. Machine learning for real-time single-trial EEG-analysis: From brain–computer interfacing to mental state monitoring. J. Neurosci. Methods 2008, 167, 82–90. [Google Scholar] [CrossRef]
- Neuner, I.; Arrubla, J.; Werner, C.J.; Hitz, K.; Boers, F.; Kawohl, W.; Shah, N.J. The default mode network and EEG regional spectral power: A simultaneous fMRI-EEG study. PLoS ONE 2014, 9, e88214. [Google Scholar] [CrossRef]
- Ritter, P.; Villringer, A. simultaneous EEG–fMRI. Neurosci. Biobehav. Rev. 2006, 30, 823–838. [Google Scholar] [CrossRef]
- Huster, R.J.; Debener, S.; Eichele, T.; Herrmann, C.S. Methods for simultaneous EEG-fMRI: An introductory review. J. Neurosci. 2012, 32, 6053–6060. [Google Scholar] [CrossRef] [PubMed]
- Mishra, V.; Gautier, N.M.; Glasscock, E. Simultaneous Video-EEG-ECG monitoring to identify neurocardiac dysfunction in mouse models of epilepsy. J. Vis. Exp. Jove 2018, 57300. [Google Scholar] [CrossRef]
- Niegowski, M.; Zivanovic, M. ECG-EMG separation by using enhanced non-negative matrix factorization. In Proceedings of the 2014 36th Annual International Conference of the IEEE Engineering in Medicine and Biology Society, Chicago, IL, USA, 26–30 August 2014; IEEE: Piscataway, NJ, USA, 2014; pp. 4212–4215. [Google Scholar]
- Haddix, C.; Bahrani, A.A.; Kawala-Janik, A.; Besio, W.G.; Yu, G.; Sunderam, S. Trial measurement of movement-related cortical dynamics using electroencephalography and diffuse correlation spectroscopy. In Proceedings of the 2017 22nd International Conference on Methods and Models in Automation and Robotics (MMAR), Miedzyzdroje, Poland, 28–31 August 2017; IEEE: Piscataway, NJ, USA, 2017; pp. 642–645. [Google Scholar]
- Yang, J.; Cha, S.; Yun, D.; An, J. Probe Configuration Design for Closed-loop Multi-Channel fNIRS-tDCS BCI. In Proceedings of the 2020 8th International Winter Conference on Brain-Computer Interface (BCI), Gangwon, Korea, 26–28 February 2020; IEEE: Piscataway, NJ, USA, 2020; pp. 1–3. [Google Scholar]
- Matarasso, A.K.; Rieke, J.D.; White, K.; Yusufali, M.M.; Daly, J.J. Combined real-time fMRI and real time fNIRS brain computer interface (BCI): Training of volitional wrist extension after stroke, a case series pilot study. PLoS ONE 2021, 16, e0250431. [Google Scholar] [CrossRef]
- Val-Calvo, M.; Álvarez-Sánchez, J.R.; Ferrández-Vicente, J.M.; Díaz-Morcillo, A.; Fernández-Jover, E. Real-time multi-modal estimation of dynamically evoked emotions using EEG, heart rate and galvanic skin response. Int. J. Neural Syst. 2020, 30, 2050013. [Google Scholar] [CrossRef] [PubMed]
- Park, H.J.; Han, J.M.; Jeong, D.U.; Park, K.S. A study on the elimination of the ECG artifact in the polysomnographic EEG and EOG using AR model. In Proceedings of the 20th Annual International Conference of the IEEE Engineering in Medicine and Biology Society. Vol. 20 Biomedical Engineering Towards the Year 2000 and Beyond (Cat. No. 98CH36286), Hong Kong, China, 1 November 1998; IEEE: Piscataway, NJ, USA, 1998; Volume 3, pp. 1632–1635. [Google Scholar]
- Sanei, S.; Chambers, J.A. EEG Signal Processing; John Wiley & Sons: Hoboken, NJ, USA, 2013. [Google Scholar]
- Yan, W.X.; Mullinger, K.J.; Brookes, M.J.; Bowtell, R. Understanding gradient artefacts in simultaneous EEG/fMRI. Neuroimage 2009, 46, 459–471. [Google Scholar] [CrossRef] [PubMed]
- Guarnieri, R. Applications. Ph.D. Thesis, KU Leuven, Leuven, Belgium, June 2021. [Google Scholar]
- Rogasch, N.C.; Thomson, R.H.; Farzan, F.; Fitzgibbon, B.M.; Bailey, N.W.; Hernandez-Pavon, J.C.; Daskalakis, Z.J.; Fitzgerald, P.B. Removing artefacts from TMS-EEG recordings using independent component analysis: Importance for assessing prefrontal and motor cortex network properties. Neuroimage 2014, 101, 425–439. [Google Scholar] [CrossRef]
- Zander, T.O.; Kothe, C.; Jatzev, S.; Gaertner, M. Enhancing human-computer interaction with input from active and passive brain-computer interfaces. In Brain-Computer Interfaces; Springer: Berlin, Germany, 2010; pp. 181–199. [Google Scholar]
- Bhattacharyya, S.; Das, S.; Das, A.; Dey, R.; Dhar, R. Neuro-feedback system for real-time BCI decision prediction. Microsyst. Technol. 2021, 27, 3725–3734. [Google Scholar] [CrossRef]
- Martišius, I.; Damaševičius, R. A prototype SSVEP based real time BCI gaming system. Comput. Intell. Neurosci. 2016, 2016, 3861425. [Google Scholar] [CrossRef]
- Martinek, R.; Ladrova, M.; Sidikova, M.; Jaros, R.; Behbehani, K.; Kahankova, R.; Kawala-Sterniuk, A. Advanced Bioelectrical Signal Processing Methods: Past, Present and Future Approach—Part I: Cardiac Signals. Sensors 2021, 21, 5186. [Google Scholar] [CrossRef]
- Alipour, A.; Rezai, A.; Hashemi, T.; Yousefpour, N. The effectiveness of cognitive behavioral therapy focused on lifestyle modification to increase monitoring vital signs and coronary heart disease and psychological well-being. Q. J. Health Psychol. 2017, 5, 125–136. [Google Scholar]
- Fioranelli, F.; Le Kernec, J.; Shah, S.A. Radar for health care: Recognizing human activities and monitoring vital signs. IEEE Potentials 2019, 38, 16–23. [Google Scholar] [CrossRef]


| Method | Overall Performance | SNR Improvement | Computational Cost | Real-Time | Implementation Complexity |
|---|---|---|---|---|---|
| Filtering | Low | Low | Low | Yes | Simple |
| WT | Medium | Medium | Medium | Yes | Medium |
| ICA | Medium | Medium | Medium | Yes | Medium |
| EMD | Medium | Medium | High | No | Medium |
| T-F | Medium | Medium | High | No | Complex |
| Neural Networks | High | Medium | High | Yes | Complex |
| ANFIS | High | Medium | High | Yes | Complex |
| Hybrid Methods | High | High | High | Yes | Complex |
| Method | Overall Performance | SNR Improvement | Computational Cost | Real-Time | Implementation Complexity |
|---|---|---|---|---|---|
| WT | Medium | Medium | Medium | Yes | Medium |
| PCA | Medium | Medium | Low | Yes | Simple |
| ICA | Medium | Medium | Medium | Yes | Medium |
| Hybrid methods | High | High | High | Yes | Complex |
| Method | Overall Performance | SNR Improvement | Computational Cost | Real-Time | Implementation Complexity |
|---|---|---|---|---|---|
| EWT | High | Height | Medium | No | Medium |
| EMD | Medium | Medium | High | No | Medium |
| DMD | Medium | Medium | High | Yes | Medium |
| T-F | High | Medium | High | No | Complex |
Publisher’s Note: MDPI stays neutral with regard to jurisdictional claims in published maps and institutional affiliations. |
© 2021 by the authors. Licensee MDPI, Basel, Switzerland. This article is an open access article distributed under the terms and conditions of the Creative Commons Attribution (CC BY) license (https://creativecommons.org/licenses/by/4.0/).
Share and Cite
Martinek, R.; Ladrova, M.; Sidikova, M.; Jaros, R.; Behbehani, K.; Kahankova, R.; Kawala-Sterniuk, A. Advanced Bioelectrical Signal Processing Methods: Past, Present and Future Approach—Part II: Brain Signals. Sensors 2021, 21, 6343. https://doi.org/10.3390/s21196343
Martinek R, Ladrova M, Sidikova M, Jaros R, Behbehani K, Kahankova R, Kawala-Sterniuk A. Advanced Bioelectrical Signal Processing Methods: Past, Present and Future Approach—Part II: Brain Signals. Sensors. 2021; 21(19):6343. https://doi.org/10.3390/s21196343
Chicago/Turabian StyleMartinek, Radek, Martina Ladrova, Michaela Sidikova, Rene Jaros, Khosrow Behbehani, Radana Kahankova, and Aleksandra Kawala-Sterniuk. 2021. "Advanced Bioelectrical Signal Processing Methods: Past, Present and Future Approach—Part II: Brain Signals" Sensors 21, no. 19: 6343. https://doi.org/10.3390/s21196343
APA StyleMartinek, R., Ladrova, M., Sidikova, M., Jaros, R., Behbehani, K., Kahankova, R., & Kawala-Sterniuk, A. (2021). Advanced Bioelectrical Signal Processing Methods: Past, Present and Future Approach—Part II: Brain Signals. Sensors, 21(19), 6343. https://doi.org/10.3390/s21196343