Article

Improved Self-Organizing Map-Based Unsupervised Learning Algorithm for Sitting Posture Recognition System

1
College of Electronics and Information, Hangzhou Dianzi University, Hangzhou 310018, China
2
College of Electrical Engineering, Zhejiang University of Water Resources and Electric Power, Hangzhou 310018, China
*
Authors to whom correspondence should be addressed.
Sensors 2021, 21(18), 6246; https://doi.org/10.3390/s21186246
Submission received: 3 August 2021 / Revised: 25 August 2021 / Accepted: 15 September 2021 / Published: 17 September 2021

Abstract

:
As the intensity of work increases, many of us sit for long hours while working in the office. It is not easy to sit properly at work all the time and sitting for a long time with wrong postures may cause a series of health problems as time goes by. In addition, monitoring the sitting posture of patients with spinal disease would be beneficial for their recovery. Accordingly, this paper designs and implements a sitting posture recognition system from a flexible array pressure sensor, which is used to acquire pressure distribution map of sitting hips in a real-time manner. Moreover, an improved self-organizing map-based classification algorithm for six kinds of sitting posture recognition is proposed to identify whether the current sitting posture is appropriate. The extensive experimental results verify that the performance of ISOM-based sitting posture recognition algorithm (ISOM-SPR) in short outperforms that of four kinds of traditional algorithms including decision tree-based (DT), K-means-based (KM), back propagation neural network-based (BP), self-organizing map-based (SOM) sitting posture recognition algorithms. Finally, it is proven that the proposed system based on ISOM-SPR algorithm has good robustness and high accuracy.

1. Introduction

As everyone knows, sedentary behavior is becoming more common, while most white-collar workers spend a lot of time sitting down in front of computer and not moving. The ensuing problems are inevitable with the widespread existence of sedentary lifestyles, and the harm to human health is gradually increasing [1]. Modern medical studies have shown that long-term slouching has a direct influence on the cervical spine unevenness, oppressing the stretching of the neck muscle, etc. [2]. The link between a poor sitting posture and bad health consequences is growing with clear evidence, including obesity, cardiovascular and metabolic diseases, and even cancer. In addition, sedentary behavior with abnormal posture has an impact not only on physical health but also on psychosocial health. Sanchez-Villegas et al. [3] provide a positive correlation between sedentary behavior and the risk of developing a mental disorder, with those at the highest level of the sedentary index having a 31% higher risk of mental disorder when compared with less sedentary individuals. Among them, inappropriate sitting postures are the main causes for the above health problems [4,5]. As a result, the innovative research on sitting posture recognition system is of great significance to the sedentary crowd’s health.
According to the existing literature, two types of methods are often used to distinguish sitting posture: wearable [6,7,8,9,10] and non-wearable [11,12,13,14]. The detection sensors of the former are mainly relying on an accelerometer, inertial sensor, and gyroscope [6]. In this approach, wearable sensors are attached either to the user’s back [7], shoulders [8], or legs [9] to collect human motion state. Hence it may be inconvenient and uncomfortable to wear such electronic devices for a normal person [10], leading to narrow applicability and less maneuverability. The latter can be further divided into two categories, the first method is based on machine vision, and the other is based on simple pressure distribution [11]. The machine vision-based posture recognition approach gets information from cameras covering sitting people, and then identifies the sitting posture by image processing [12] or machine learning [13]. However, it is difficult to ensure robustness depending on the light conditions and shooting angles [14], and it also involves some privacy issues. The simple pressure distribution-based approach is to place sensors at some specific locations of a chair or backrest and use feature information collected by these sensors to recognize sitting postures [15]. This method may be uncomfortable and low accurate. Experimental results of [16] shows that the overall accuracy of this method is 85.9%, and the accuracy rate reaches 83.33% in [17]. As an exploration and improvement, we study the method of sitting posture recognition based on the flexible array pressure sensor for real-time and accurate sitting posture recognition. Many algorithms have been applied to sitting posture recognition in existing papers, Benocci et al. [18] use the k-nearest neighbor (kNN) for sitting postures recognition, the derived accuracy degree is 92.7%. Liu et al. [19] apply the convolutional neural network (CNN) to the sitting posture recognition and can achieve 95.5% accuracy. Kim et al. [15] also apply CNN to the sitting posture recognition and compare it with decision tree (DT), multinomial logistic regression (MLR), etc. The average accuracy is 95.3%. Unfortunately, the complexity of the CNN algorithm is relatively high, so it is difficult to apply it in real-time recognition. We use SOM algorithm as the basic algorithm for the recognition of sitting postures. The simple network structure of SOM ensures the real-time recognition of the system for sitting postures. The data collected by our self-made data acquisition system is similar for the same sitting posture. Considering the characteristics of sitting posture data, the output speed of the proposed system using SOM algorithm will be fast and accurate.
The main contributions of this paper are:
  • This paper proposes one novel sitting posture recognition system based on a flexible array pressure sensor and overcomes the dependence on the environment of the sitting posture recognition method based on machine vision.
  • This paper introduces the SOM algorithm for sitting posture recognition for the first time, and an improvement of SOM issued to optimize connected weights, therefore, it solves the problem of the low recognition rate of the traditional method based on simple pressure distribution.
The rest of this document is organized as follows. Section 2 proposes detailed system framework of sitting posture recognition. In Section 3, SOM based sitting posture pressure recognition algorithm is described in detail. Moreover, an improved SOM considering the optimization of weights is proposed to overcome the limitations of SOM network structure and to achieve better results. Experimental results are presented in Section 4, and a summary of the whole paper is made in Section 5.

2. System Model

One novel sitting posture recognition system composed of flexible array pressure sensor and cloud platform is designed in this paper. The whole system consists of three main components: pressure acquisition circuit, cloud platform service and analysis and monitoring software. The pressure acquisition circuit is responsible for pressure data collection, and then transmits the pressure data to the cloud platform according to the user’s wishes, while the cloud platform saves the data and transfers real-time data to the analysis and monitoring software, and finally receives the recognition results. The analysis and monitoring software is responsible for the visualization of pressure distribution of sitting postures, and the implementation of some sitting postures recognition algorithms. During the process of data analysis, we constructed a variety of sitting posture recognition algorithms, and an improved SOM algorithm for postures classification is discussed. After testing and analyzing, the sitting posture recognition algorithm based on improved SOM (ISOM-SPR) has strong robustness and high accuracy compared with other existing algorithms.
The framework of the proposed sitting posture recognition system is shown in Figure 1. Each user is sitting on a special chair equipped with a flexible array pressure sensor, and we self-made data acquisition system to collect real-time pressure values and users have the power to choose whether to transmit it to the Internet. If certain user agrees, his sitting posture information would be uploaded to the cloud platform for better management. Users can check information about their sitting postures via their cell phones or computers, the recognition and monitoring software provides a visual display of real-time data.
The block diagram of the sitting posture recognition system is described in Figure 2, which is composed of three main parts: pressure acquisition circuit, cloud platform and analysis and monitoring software.
The pressure acquisition circuit mainly includes a STM32 MCU based data acquisition board and a flexible array pressure sensor in Figure 3. The array pressure sensor is a large-area flexible pressure sensor. The sensor has a total of four sets of interfaces, each interface has 16 pins, so there are a total of 32 row pins and 32 column pins. The pins are designed to achieve efficient data acquisition with the minimum number of pins. There are 1024 independent induction units distributed within a 400 mm × 400 mm square, and each induction point is 8.5 mm × 8.5 mm in size. The size of sensor array is designed by combining the size of actual seat and area of contact between buttocks and seat when users sit down. One point’s resistance of this strain gauge-designed sensor will change when the pressure it receives changes.
Since the applied flexible array pressure sensor has 1024 independent sensing point, we could not have access to all the points at one time. We acquire the data of one sensing point with multi-channel switch CD74HC4076. We provide a strobe signal for multi-channel, only one row pin and one column pin are strobed at the same time as shown in Figure 4. The output signal at this moment is the pressure information of the sensor node corresponding to the row and column.
The pressure is then obtained by high-precision A/D convertor [20]. The resistance of each point is Rij. Considering the different softness of different seats, we first filtered the collected data in the process of data collection. Hence, the resistance change caused by the sensor deformation is much less than that caused by human body pressure. We set a threshold, and only data above that threshold will be collected. The relational expression between output voltage uo and resistance Rij of each induction point is illustrated in Equation (1).
u o = V r e f × R i j R i j + R I M , ( i , j = 1 , 2 , , 32 ) ,  
where Vref is 5 V, the impedance matching resistance RIM is 200 kΩ, so it has both good linearity and the relatively wide voltage range. The change of resistance Rij is determined by the pressure at the corresponding induction point, the relationship between pressure pij and resistance Rij is shown in Figure 5, which could be expressed as p i j = 1690 / R i j 3.379 with actual measurement.
The analysis and monitoring software is mainly responsible for the implementation of some sitting postures recognition algorithms, real-time display of pressure distribution. Users will be alerted if they are sitting with inappropriate postures, it also alerts users if they are sitting with some posture for too long time. The pressure detection system interface is shown in Figure 6. Users can also save the current sitting posture pressure map. The entire system will still work without an Internet connection and the data will only be stored on the user’s PC, not available from the phone. Each pressure acquisition circuit has the ability of transmitting sensory data to the cloud platform service with Wi-Fi. The cloud platform service will receive and save these sensory data for each user in a confidential manner. Users can also check the information through their cell phones if the users agree to upload the data to the cloud platform. It is convenience for users to view records anytime and anywhere. In this case, users such as the elderly or patients with cervical Spondylosis can get better help and comprehensive supervision. The interface on the phone is shown in Figure 7. We divided the whole sensor array into four regions, namely, upper right, upper left, lower right and lower left, corresponding to pressure zone 1–4, respectively. It also helps the user numerically check how he or she is sitting.
To improve classification accuracy, the self-organizing map algorithm [21], one unsupervised artificial neural network method, is introduced into the designed recognition algorithm of sitting postures. The self-organizing map (SOM) network structure has two layers: the input layer and the output layer. The SOM generates a low-dimensional, discrete map by learning data in the input space. The number of neurons in the input layer is determined by the dimension of the input vector x = x 1 , x 2 , , x i . The structure diagram of SOM and classification results are described in Figure 8. With self-learning by SOM, the more similar the data, the more likely it is fall into the same category.

3. SOM Based Sitting Posture Recognition Algorithm

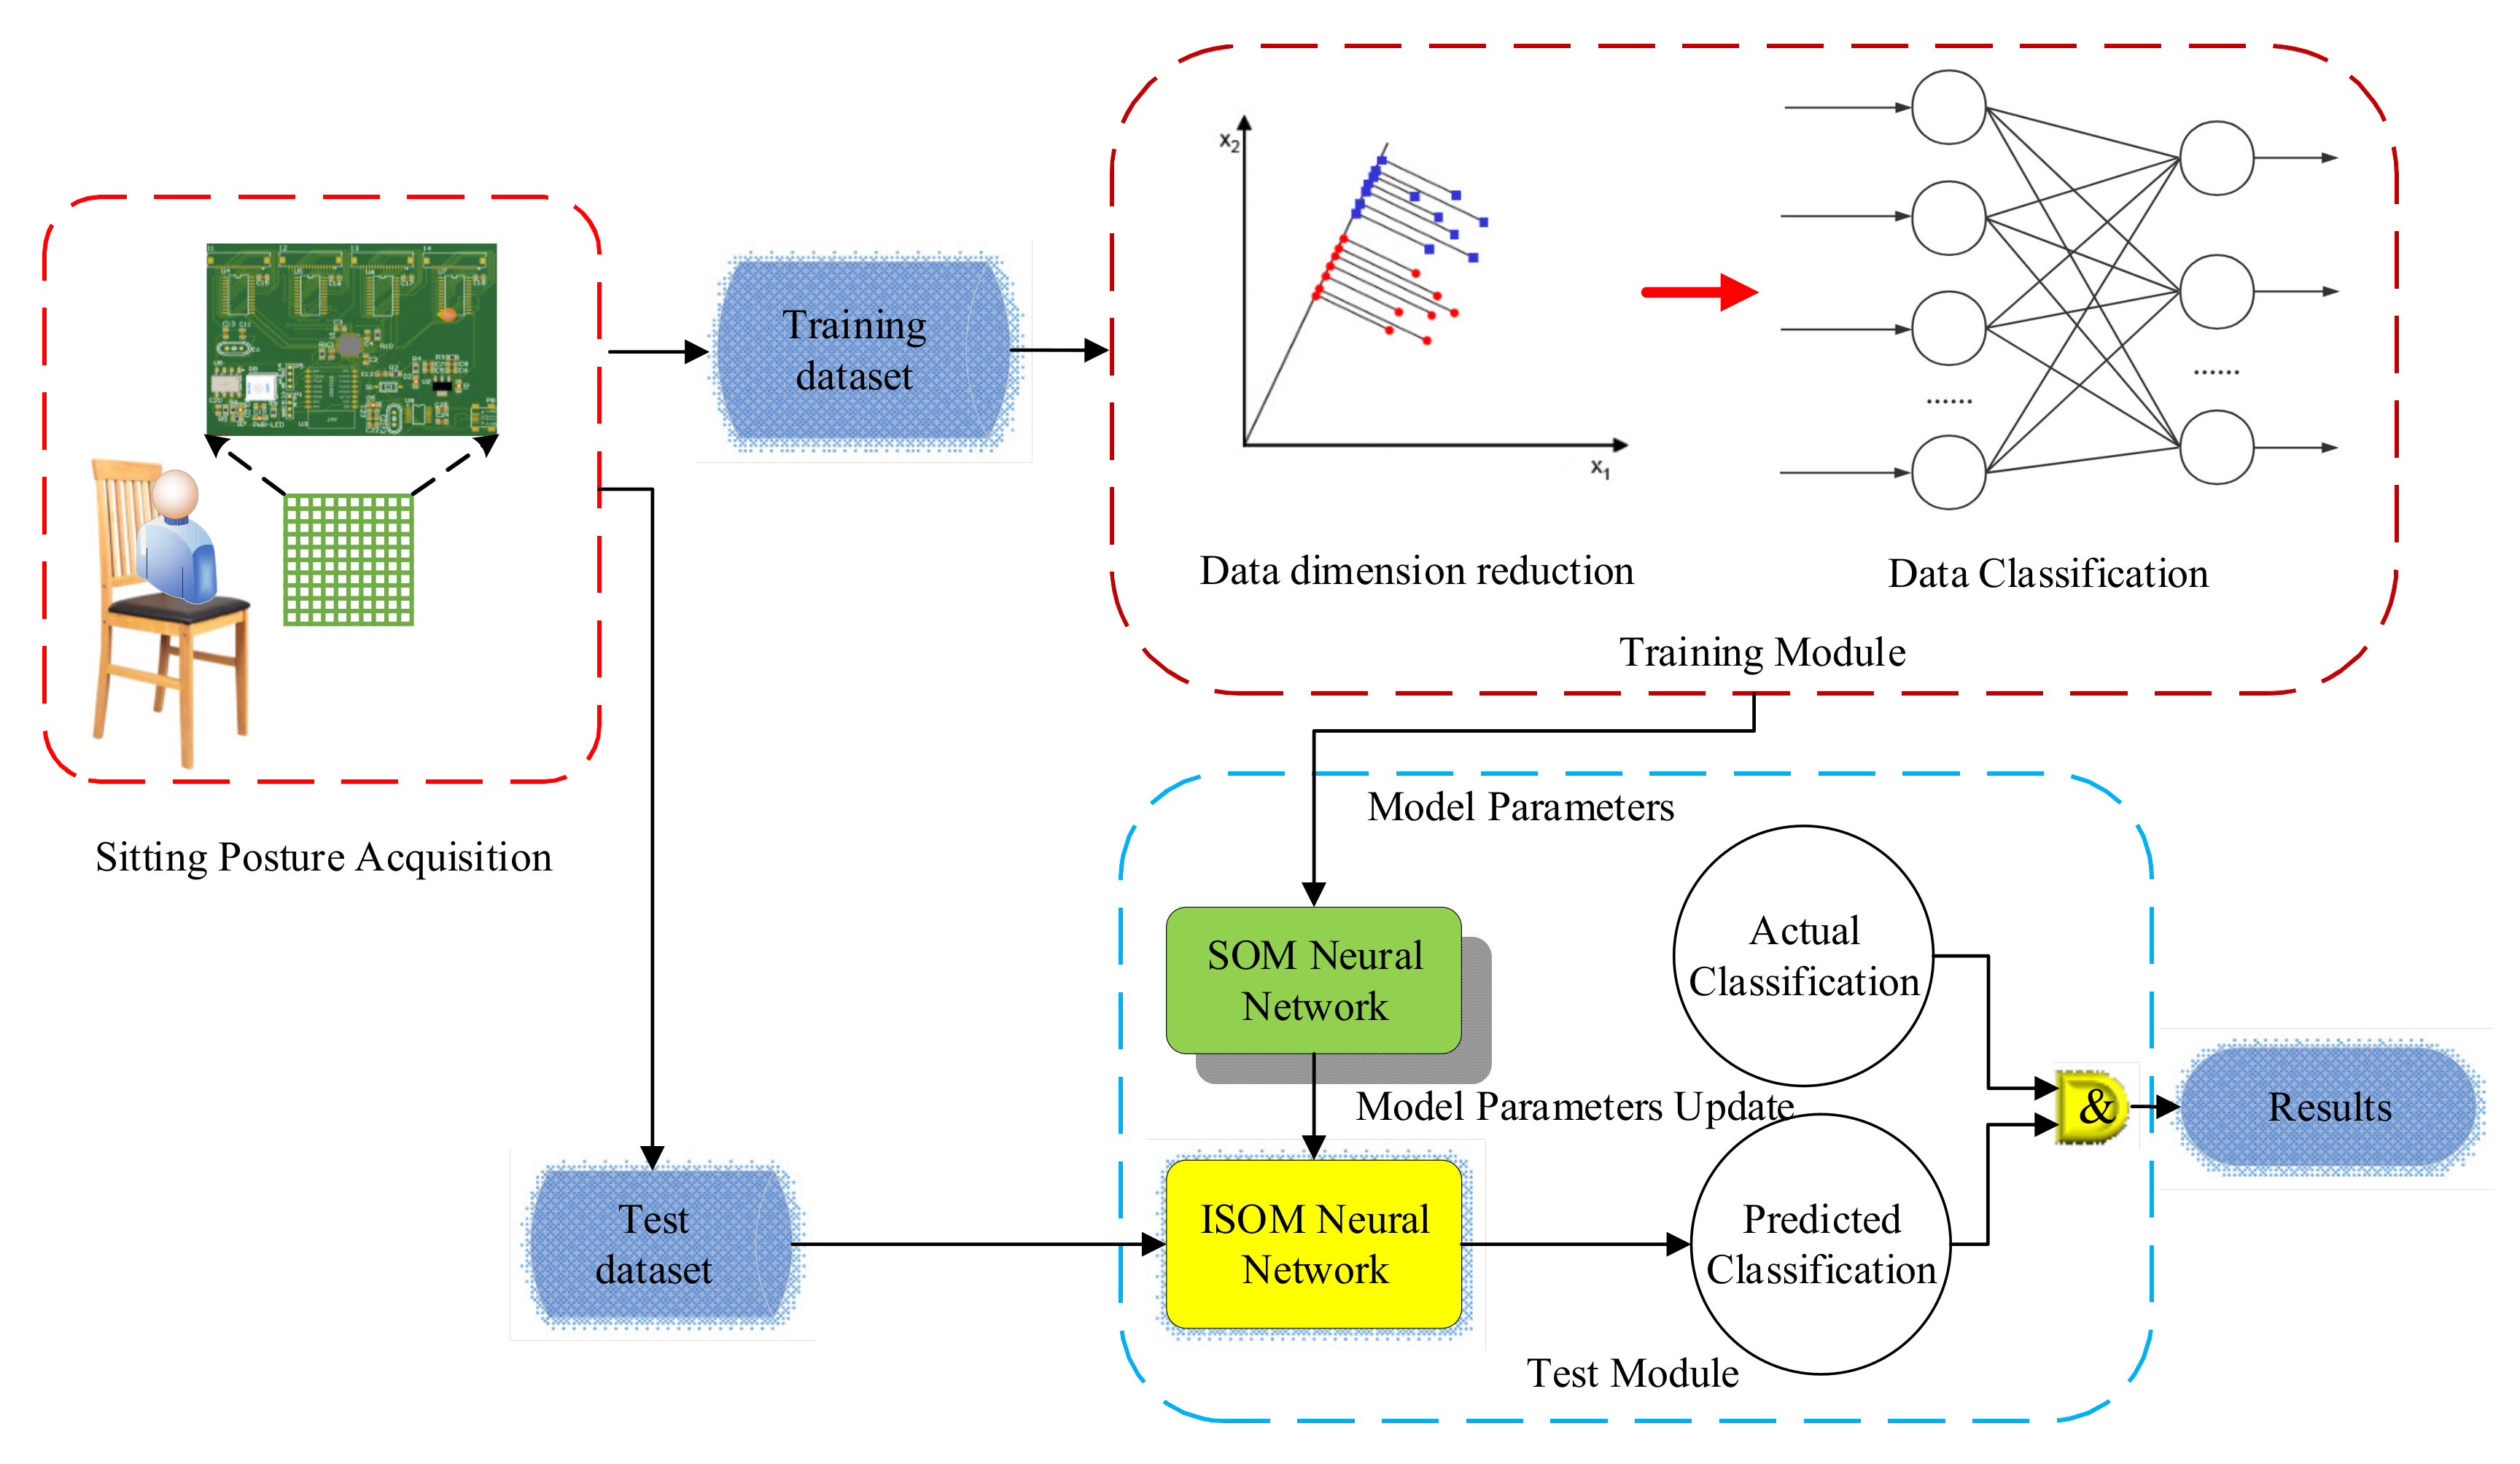
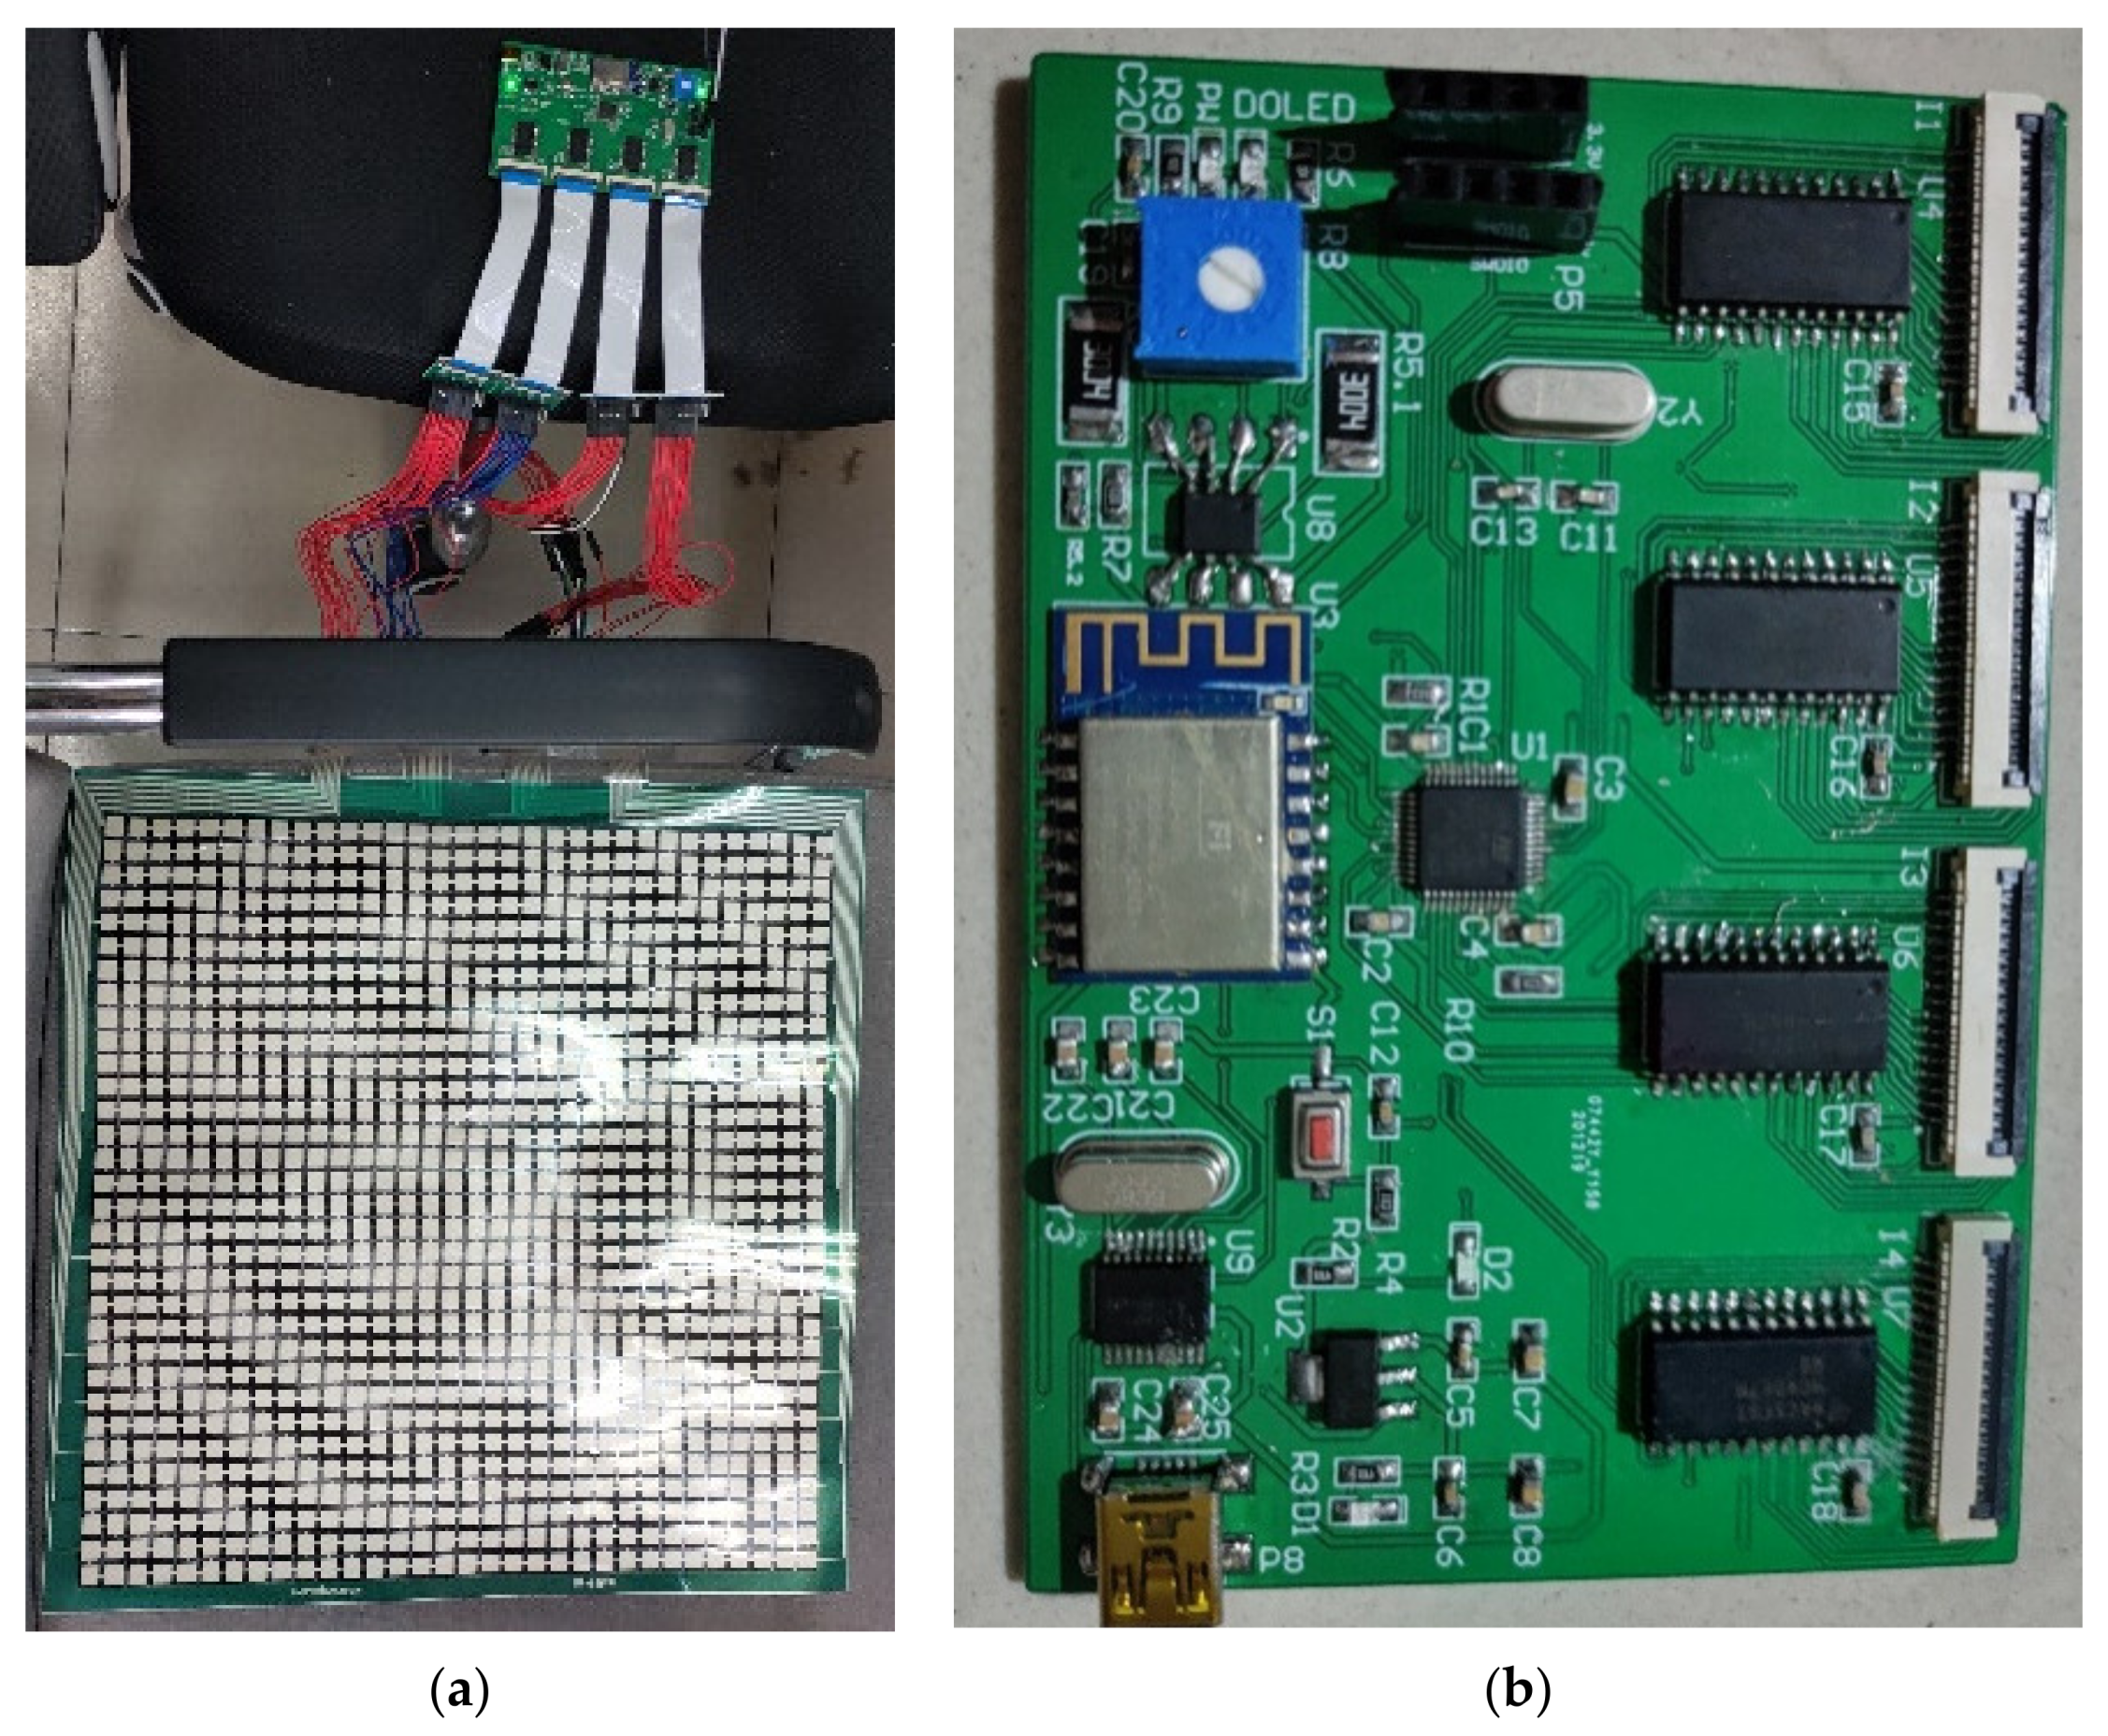
The principle of the sitting posture recognition process is demonstrated in Figure 9. The original data collected by the pressure acquisition circuit are taken as the original dataset. Each set of data is a matrix with rows and columns of 32. Due to a large amount of data, the sensible first step is to reduce the dimension of data. However, the characteristics of the data should be preserved as much as possible while the data volume is reduced. After the data are reduced in dimensionality, it is classified using the SOM algorithm. SOM algorithm, on the one hand, can put similar data in the same category, on the other hand, maps the input data into two-dimensional discrete graphics in the output layer. These characteristics apply well to the data processing of sitting posture. The collected data are divided into training part and testing part. The actual sitting posture of the human body corresponding to the pressure distribution received by the pressure sensor array is described in Figure 10. Six sitting postures, namely standard sitting, lean left, lean right, waist bow, right cross-legs, and left cross-legs [22] are common sitting postures, so classification and detailed data analysis are carried out for these six sitting postures.

3.1. Dimensionality Reduction for Original Data

The number of neurons in the output layer is positively correlated with the number of categories of training samples. If the number of neurons is less than that of categories, it is not enough to distinguish all the categories, hence the results of training are bounded to combine the similar classes into one. On the contrary, if there are more neurons than categories, it is possible to divide them excessive or to have “dead nodes”, i.e., one node never wins and is far away from other winning nodes during the training process, so their weights will never update.
The original pressure distribution data area matrix with 32 rows and 32 columns as following, so the number of input nodes in this network is 1024 theoretically. As a time-varying matrix, P is changing over time. The following descriptions are all in the state of time t. For the sake of clarity, the variable t is omitted.
P = p 1 , 1 p 1 , 2 . . . p 1 , 32 p 2 , 1 p 2 , 2 . . . p 2 , 32 . . . . . . . . . . . . p 32 , 1 p 32 , 2 . . . p 32 , 32 .
Excessive data input may introduce unnecessary noises, increase computation complexity, thus slow down the speed of data processing. Therefore, we pre-process the input data and compress the data by principal component analysis (PCA) [23]. P = P 1 , P 2 , , P 32 can also be thought of as 32-dimensional vectors, each of which has 32 elements, P k = p 1 , k , p 2 , k , , p 32 , k T . The covariance matrix is defined as follows:
R = r 1 , 1 r 1 , 2 . . . r 1 , 32 r 2 , 1 r 2 , 2 . . . r 2 , 32 . . . . . . . . . . . . r 32 , 1 r 32 , 2 . . . r 32 , 32 .
Every member r m n in the covariance matrix is a covariance between p m and p n , the calculation method [24,25] is as follows:
r m n = c o v ( p m , p n ) = k = 1 m ( p k - p ¯ m ) ( p k - p ¯ n ) m - 1 , ( m , n = 1 , 2 , , 32 ) .
The eigenvectors φ 1 , φ 2 , φ 3 , , φ 32 and their corresponding eigenvalues of the matrix R are calculated. If the eigenvectors are over-reserved, the noise will also be retained, and the amount of data will not be reduced significantly, thus the calculation speed will be negatively affected. However, the difference between the samples will not be observed if too few eigenvectors are selected. After calculation and analysis, the top 8 eigenvectors were selected without affecting the characteristics of the data, and the calculation speed of classification is improved at the same time. The 8 eigenvectors corresponding to the 8 largest eigenvalues are constructed into a matrix A = φ k | φ k T o p 8 φ i , i = 1 , 2 , , 32 . Finally, the data matrix Pr after dimensionality reduction is calculated as follows:
P r = P A .
Pr is a 32 by 8 matrix, the amount of data has been reduced from 1024 to 256.
P r = p r 1 , 1 p r 1 , 2 . . . p r 1 , 8 p r 2 , 1 p r 2 , 2 . . . p r 2 , 8 . . . . . . . . . . . . p r 32 , 1 p r 32 , 2 . . . p r 32 , 8 .

3.2. Data Classification

PCA is a traditional data compression method under the condition of retaining data characteristics to the maximum extent. After the data arecompressed, the noise will be reduced, and the calculation speed of the SOM network will be improved.
The elements of the matrix Pr are connected from head to tail to construct the input vector of the SOM network. Each vector in the input layer has 256 elements. The input vector can be written as p r i = p r i : p r i = p r i   1 , 1 ,   p r i   1 , 2 , , p r i   1 , 8 , p r i   2 , 1 ,   p r i   2 , 2 , , p r i   2 , 8 , , p r i   32 , 1 ,   p r i   32 , 2 , , p r i   32 , 8 , m = 1 , 2 , , 32 ,   n = 1 ,   2 ,   , 8 ,   i = 1 , 2 , , M , Mdenotes the number of input neurons, which is the number of training samples, the connected weights between input neuron i and j in the competitive layer can be written as   w j = w j : w j = w j 1 , w j 2 , , w j 256 , j = 1 , , N , where N is the number of output neurons, since the output layer is designed to have 6 nodes, so N is set to 6.
The first step is to normalize the selected samples and weights as Equation (7) and Equation (8) [26]. Normalization eliminates the adverse effects caused by singular samples and different data sizes, helps to improve the solution convergence speed, and improves the efficiency of model training.
p - r i = p r i p r i , i = 1 , 2 , , M .
w - j = w j w j , j = 1 , 2 , , N .
The Euclidean distance d i j between the input p ¯ r i and the weight w ¯ j [26] is calculated as following:
d i j = p ¯ r i - w ¯ j , ( i = 1 , 2 , , M , j = 1 , 2 , , N ) ,
d c = m i n d i j , ( i = 1 , 2 , , M , j = 1 , 2 , , N ) ,
where   d c is the smallest distance among d i j , and the neuron with the minimal distance will be the winner c .
The neighborhood function is used to determine the influence of the winning node on its near neighbor node, hence update range of each node in the winning neighborhood. The most common choice is the Gaussian function [26].
h i j = e x p - D i j 2 - 2 s 2 .
D c j = r c - r j .
The Gaussian based winning neighborhood function is shown in Equation (11), where D c j is the distance between neuron c and neuron j,   r c denotes the location of winning neuron c , and r j denotes the location of the near neighbor neuron j . N c t refers to the number of neurons centered on the winning neuron, which is determined by the neighborhood function. N c 0 is the initial neighborhood value.
We use the exponential function to define the wining neighborhood function’s decay rate,
σ t = σ 0 e x p - t / t s .
The learning rate is η t 0 , 1 , the initial value is η 0 . The updates are applied for all the training process. Finally, we will iterate the process until the learning rate converges to 0.
η ( t ) = η 0 exp ( - t / τ η ) .
The weight is adjusted to all neurons in the winning neighborhood. If one neuron is in the winner’s neighborhood, the weight will change as the first equation of Equation (15); otherwise, the weight will change as the second equation of Equation (15).
w ¯ i j t + 1 = w ¯ i j t + η t h i j t p ¯ r i w ¯ j , j N c t w ¯ i j t + 1 = w ¯ i j t , j N c t .

3.3. SOM Based Sitting Posture Recognition Algorithm (SOM-SPR)

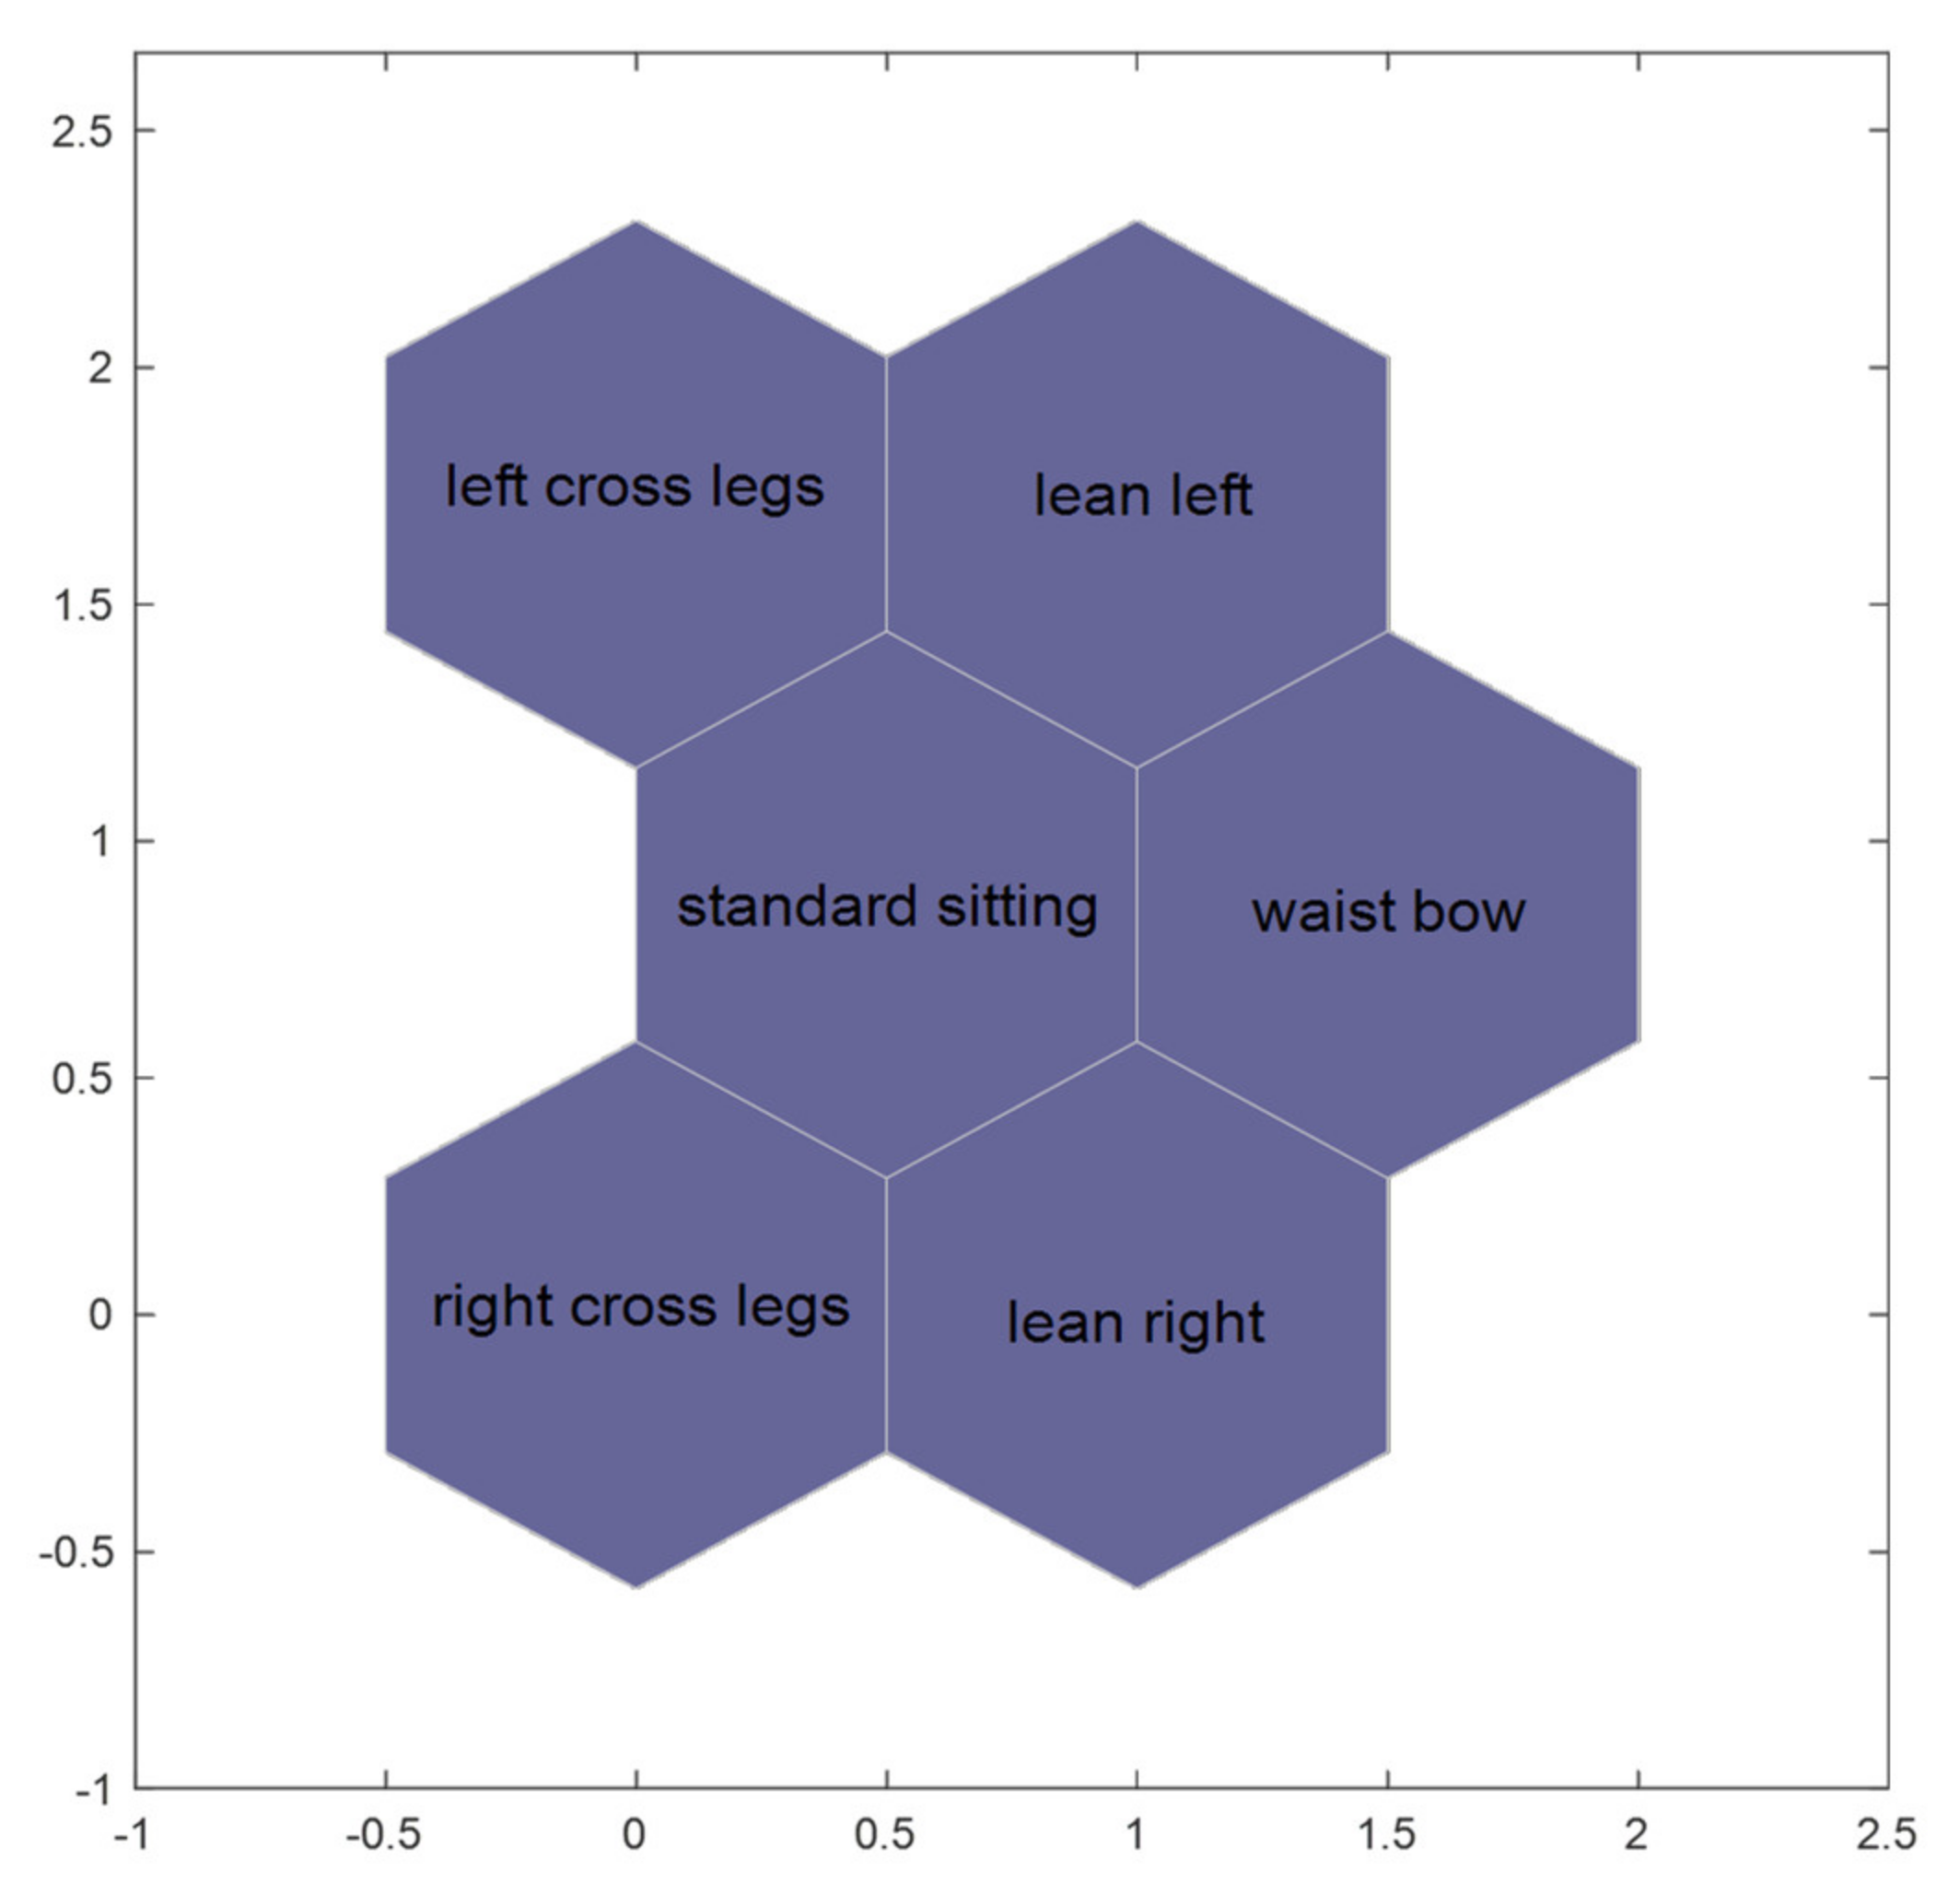
The arrangement form of neuron nodes in the output layer depends on the needs of practical applications, and the arrangement form should reflect the physical meaning of practical problems as intuitively as possible.
Six sitting postures, including left cross legs, right cross legs, lean left, lean right, waist bow, and standard sitting, are arranged to identify, so the number of output nodes is 6. Moreover, the neurons are connected via hexagonal topology [27], as Figure 11. All the data are distributed on a two-dimensional plane. If the posture is similar, the distance will be closer in topology. For instance, the center is “standard sitting”, “left cross legs” and “lean left” are above “standard sitting”. This structure is also in line with human experience and cognition.
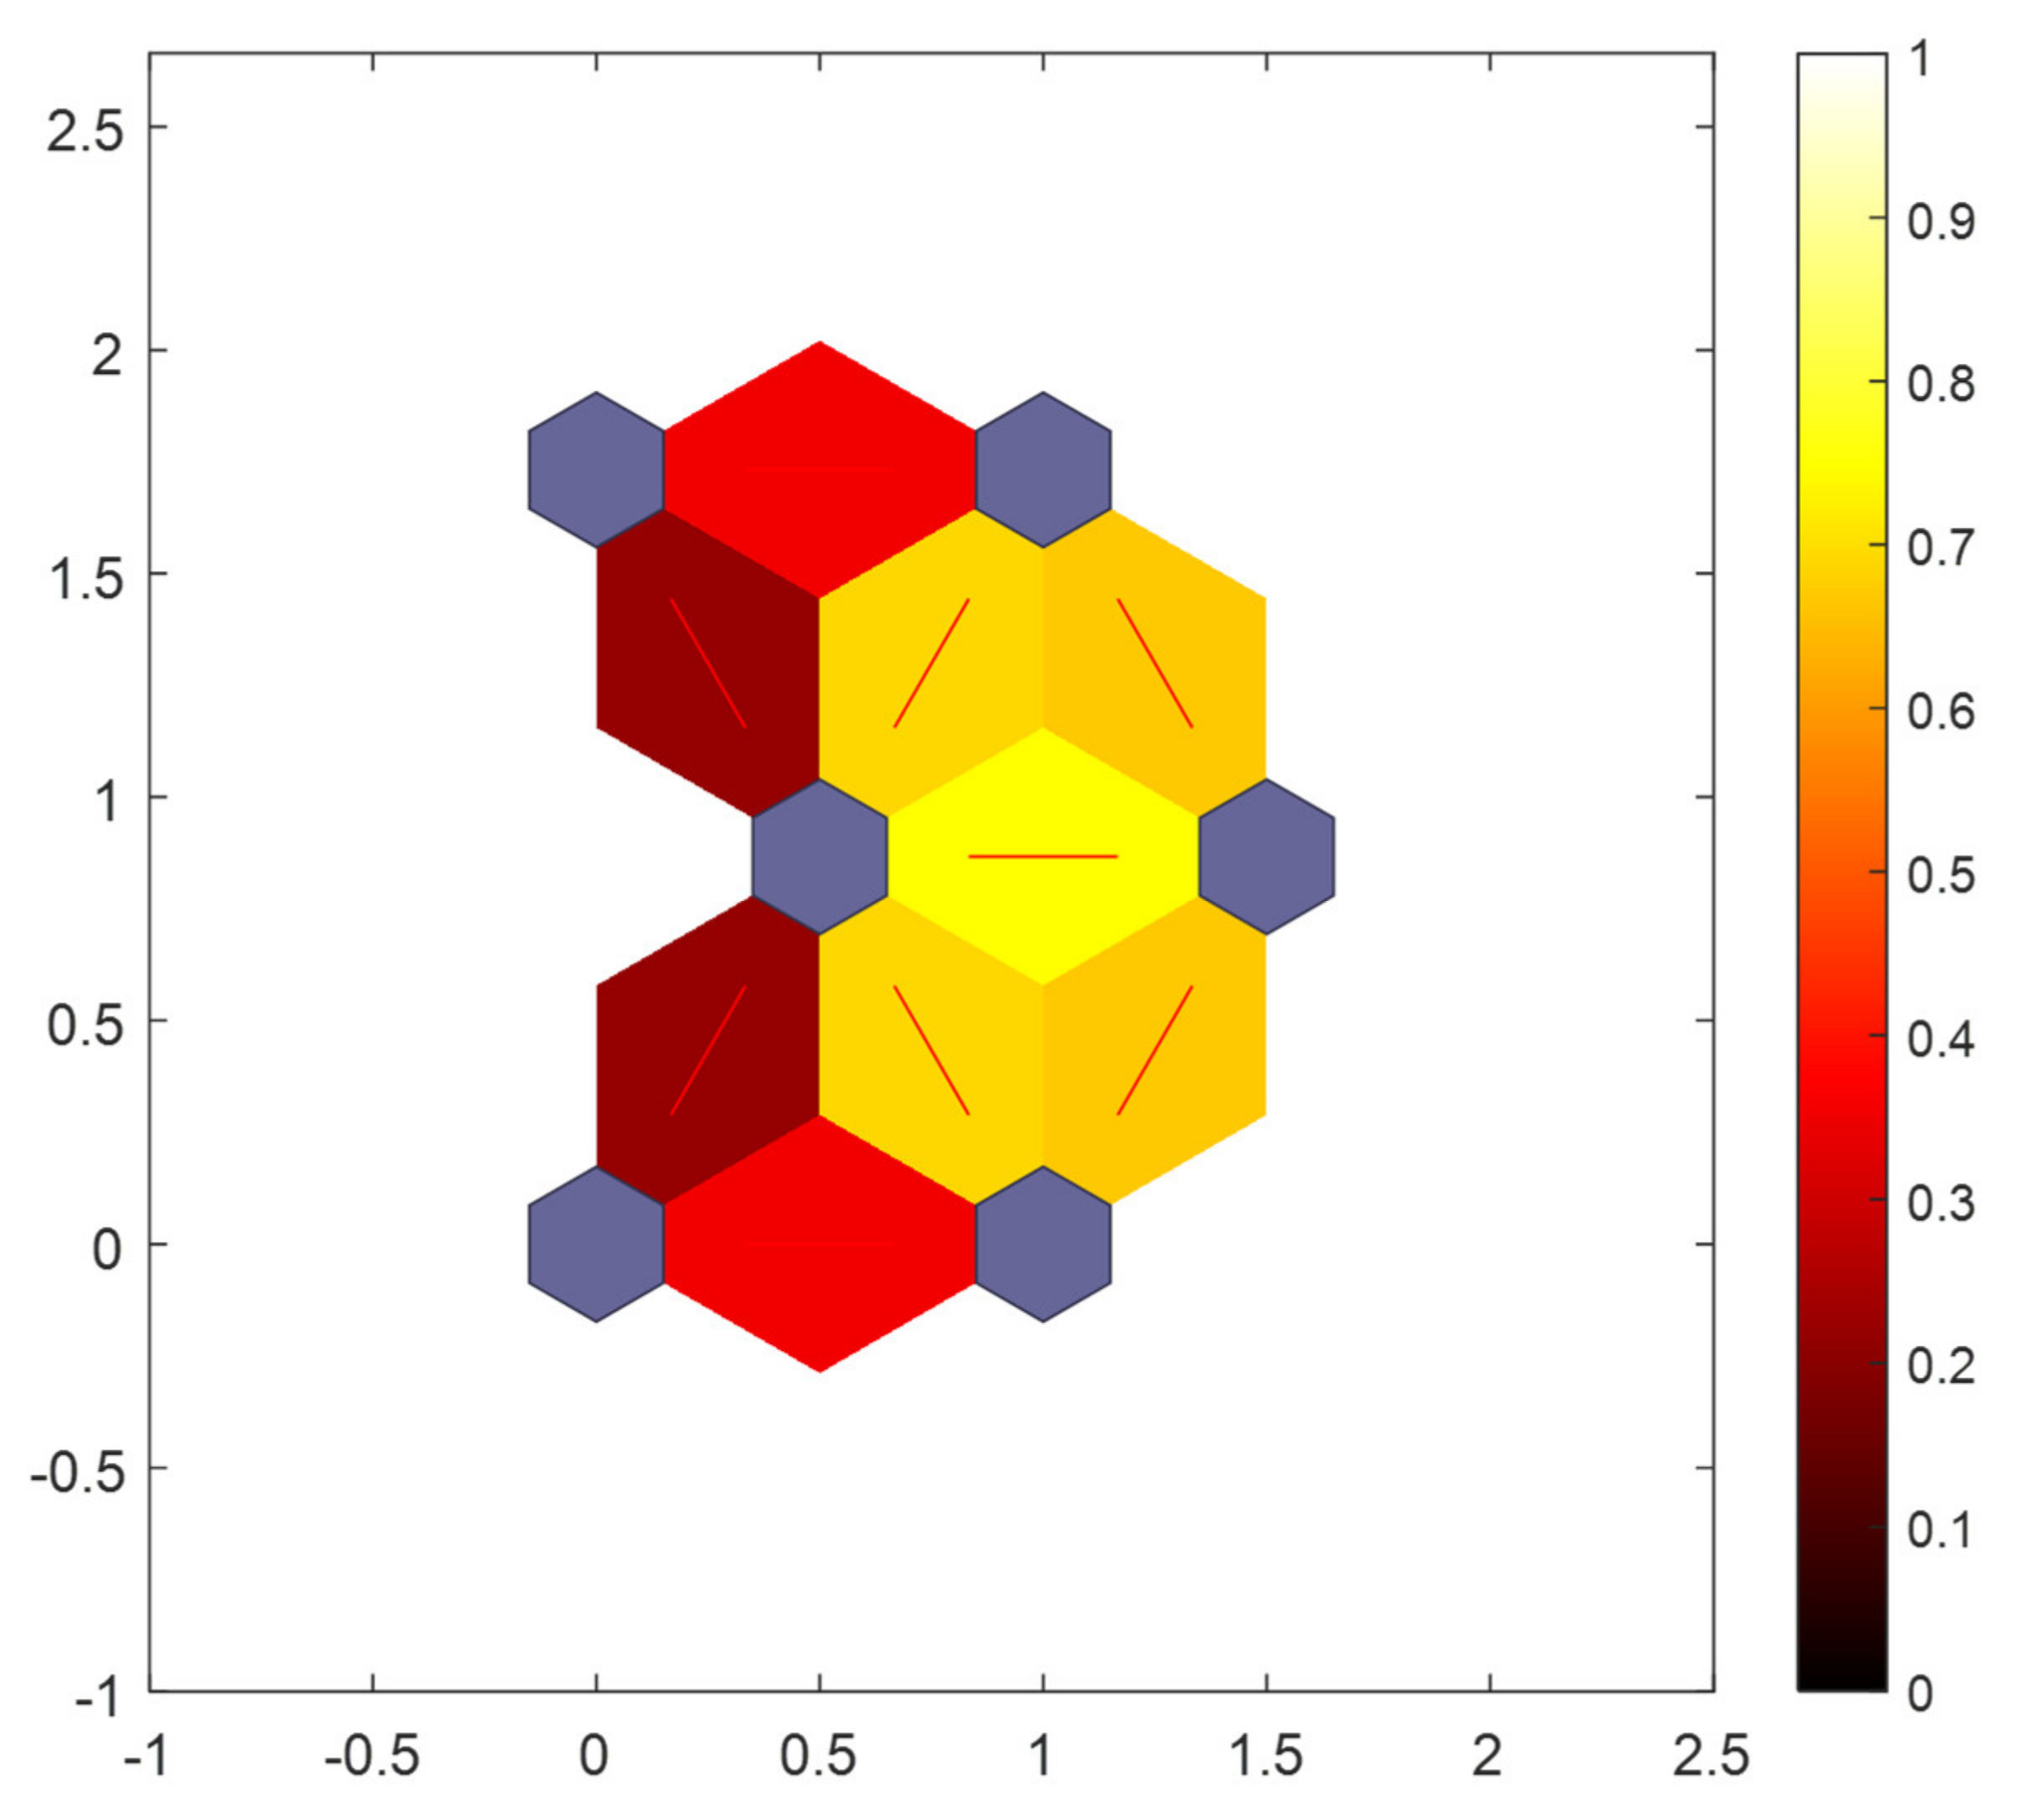
The results of Figure 12 show that the sitting posture clustering results make two classes with high similarity closer to each other, the more similar the two categories are, the closer the distance is. As shown in Figure 12, the color ranges from red to orange and then to yellow. The lighter the color, the higher the similarity of their features. As a result, the distance between “standard sitting” and “waist bow” is very small, while the distance between “standard sitting” and “waist bow” is very big. In terms of results, the accuracy of SOM-SPR is excellent, however, we have made improvements to the SOM network in pursuit of better results, details in Section 3.4.

3.4. Improved SOM Based Sitting Posture Recognition Algorithm (ISOM-SPR)

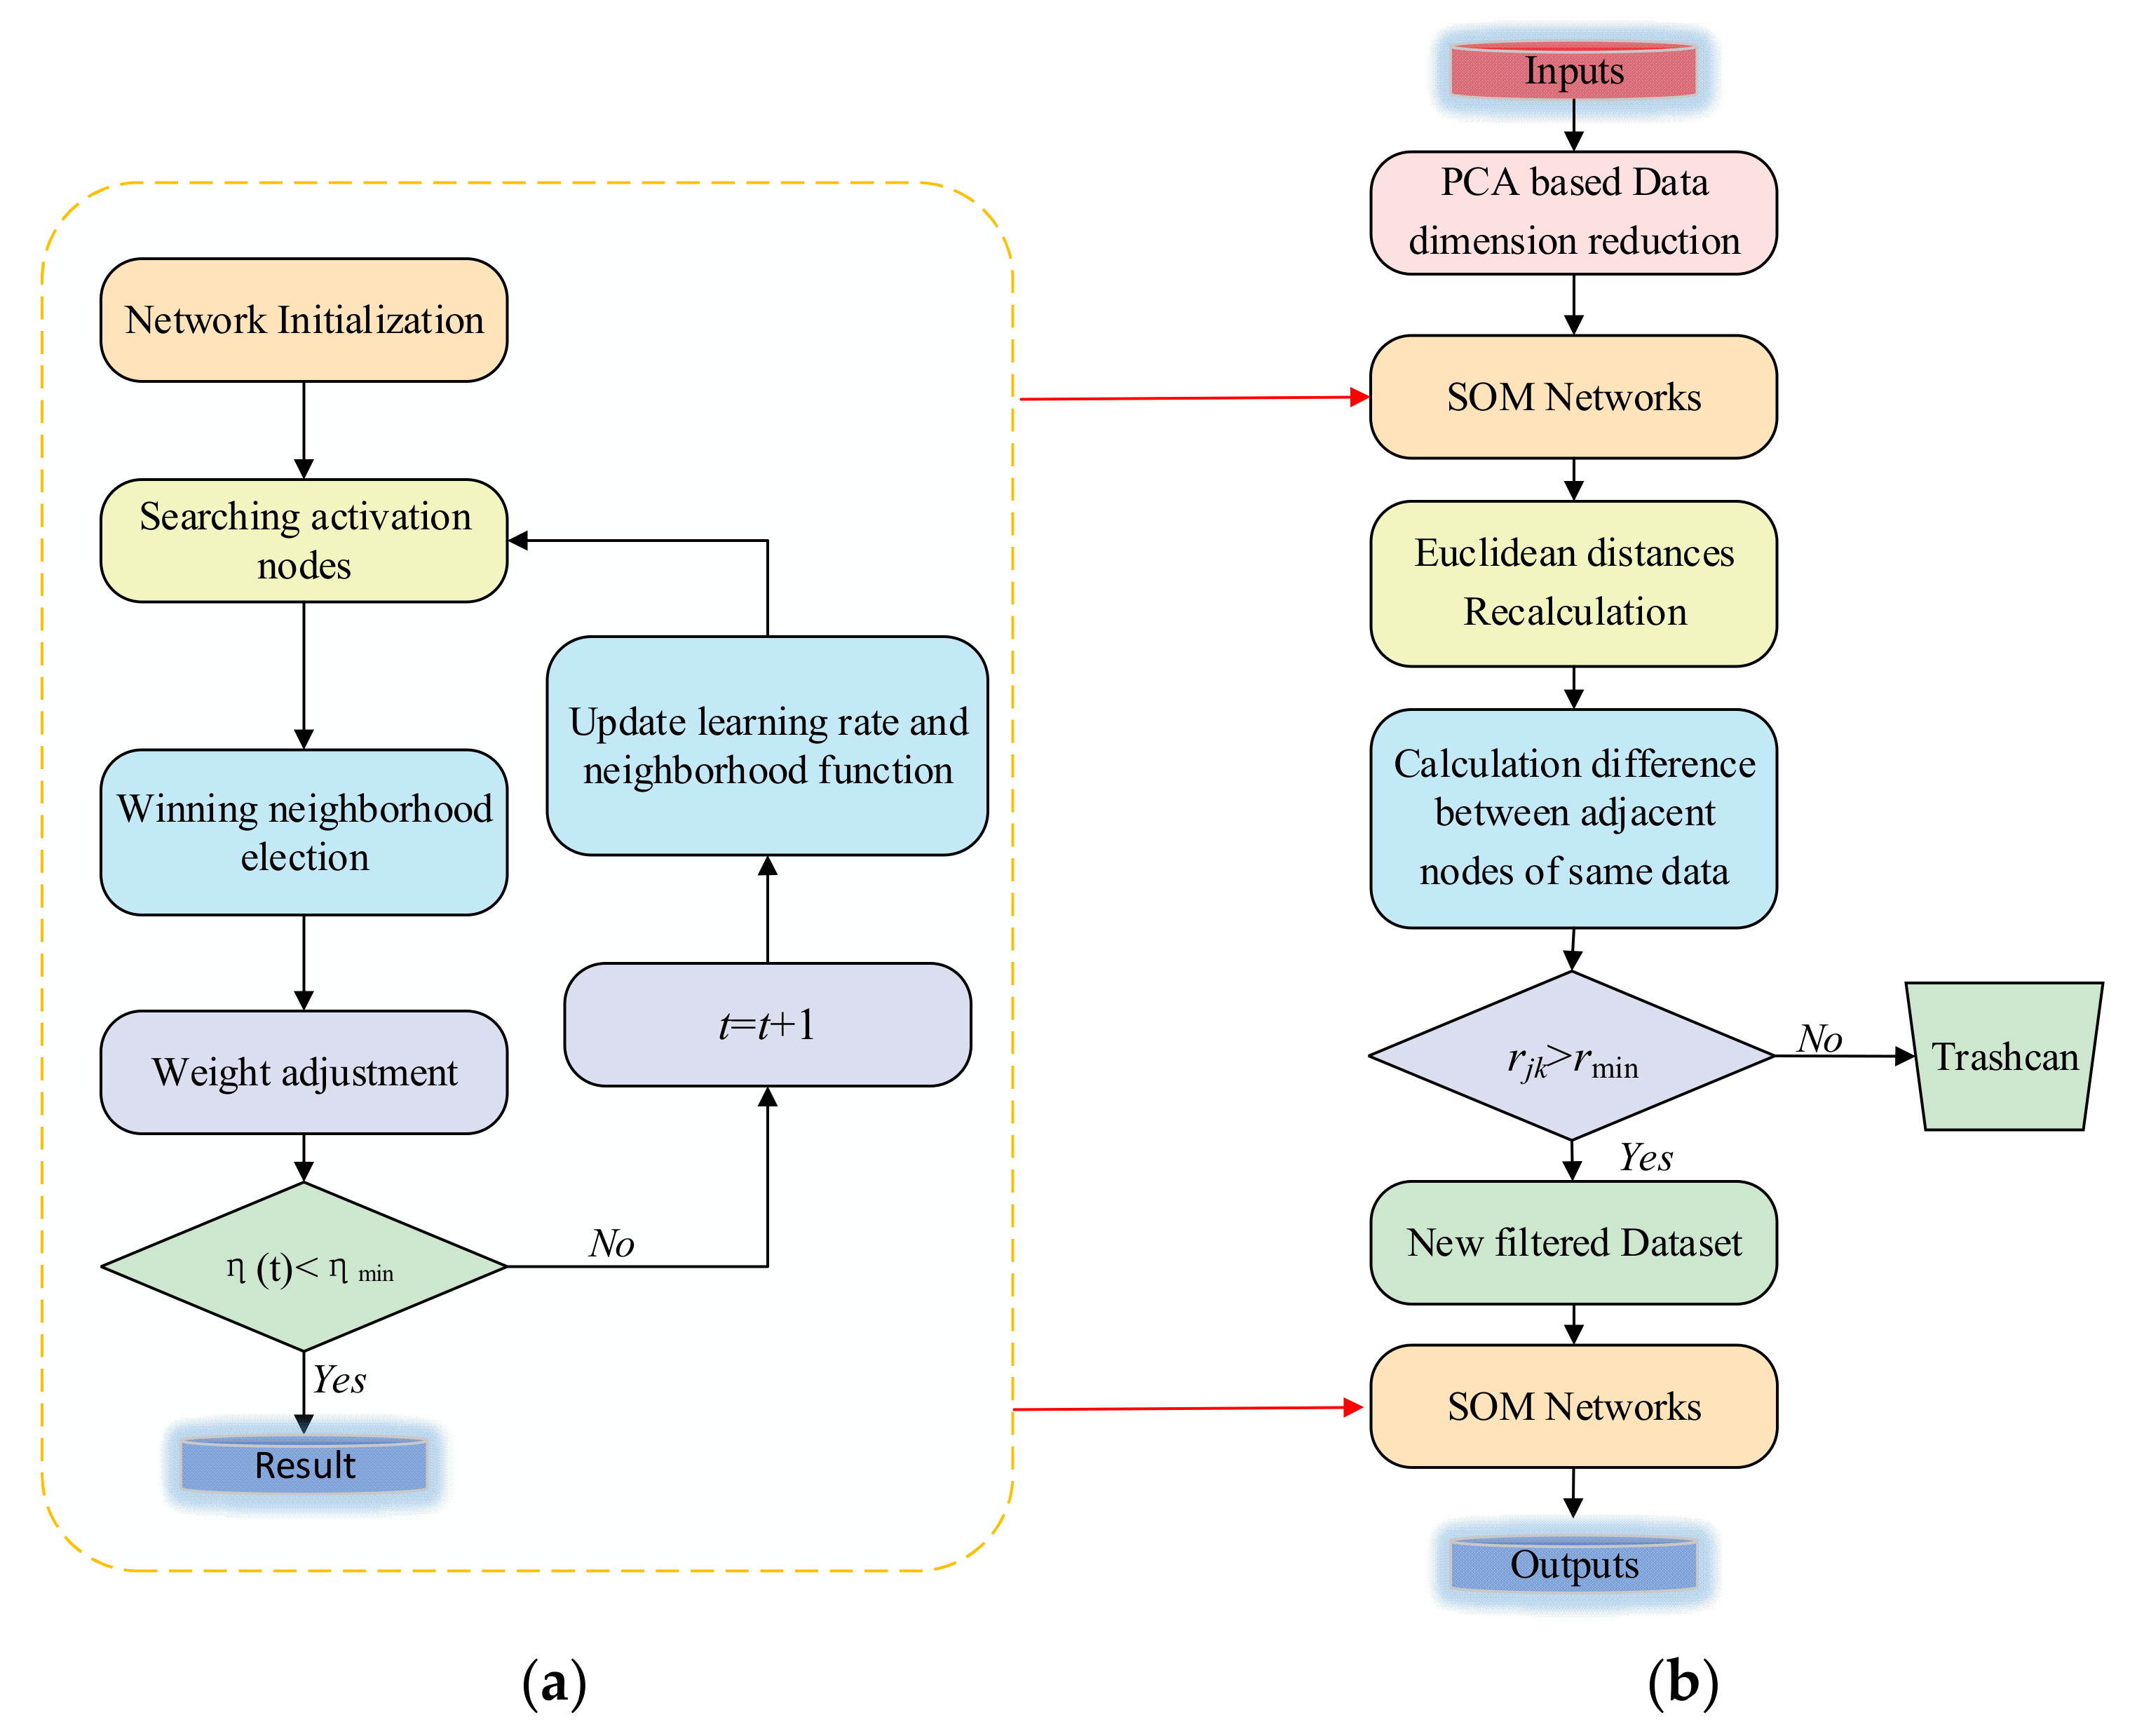
As we know, SOM algorithm is an unsupervised learning method, which has good characteristics of self-organizing and visualization. However, there are still some apparent limitations, such as the network structure is fixed and cannot change dynamically. Therefore, an improved SOM approach to solve this problem is studied to achieve better recognition results of sitting posture.
Once the SOM-SPR algorithm finished once clustering, the weights will not change. Therefore, we recalculate the Euclidean distances between the input p ¯ r i and the fixed weight w ¯ j .
d n e w i j = p ¯ r i - w ¯ j .
Hence, the difference e j k between adjacent nodes of the same data is calculated. j and k are the labels of two adjacent nodes, respectively.
e j k = d n e w i j d n e w ik , ( i = 1 , 2 , , M , j , k = 1 , 2 , , N , k j ) .
r j k = e j k d n e w i j + d n e w i k .
The degree of differentiation of the same data relative to two nodes is defined as r j k . As the number r j k gets bigger, the difference gets bigger and bigger. Onthecontrary, the smaller the r j k , the less significant the difference. The corresponding set of data will be removedwhen r j k   is less than certain threshold value r m i n . The flow charts of SOM-SPR algorithm and ISOM-SPR algorithm are shown in Figure 13.
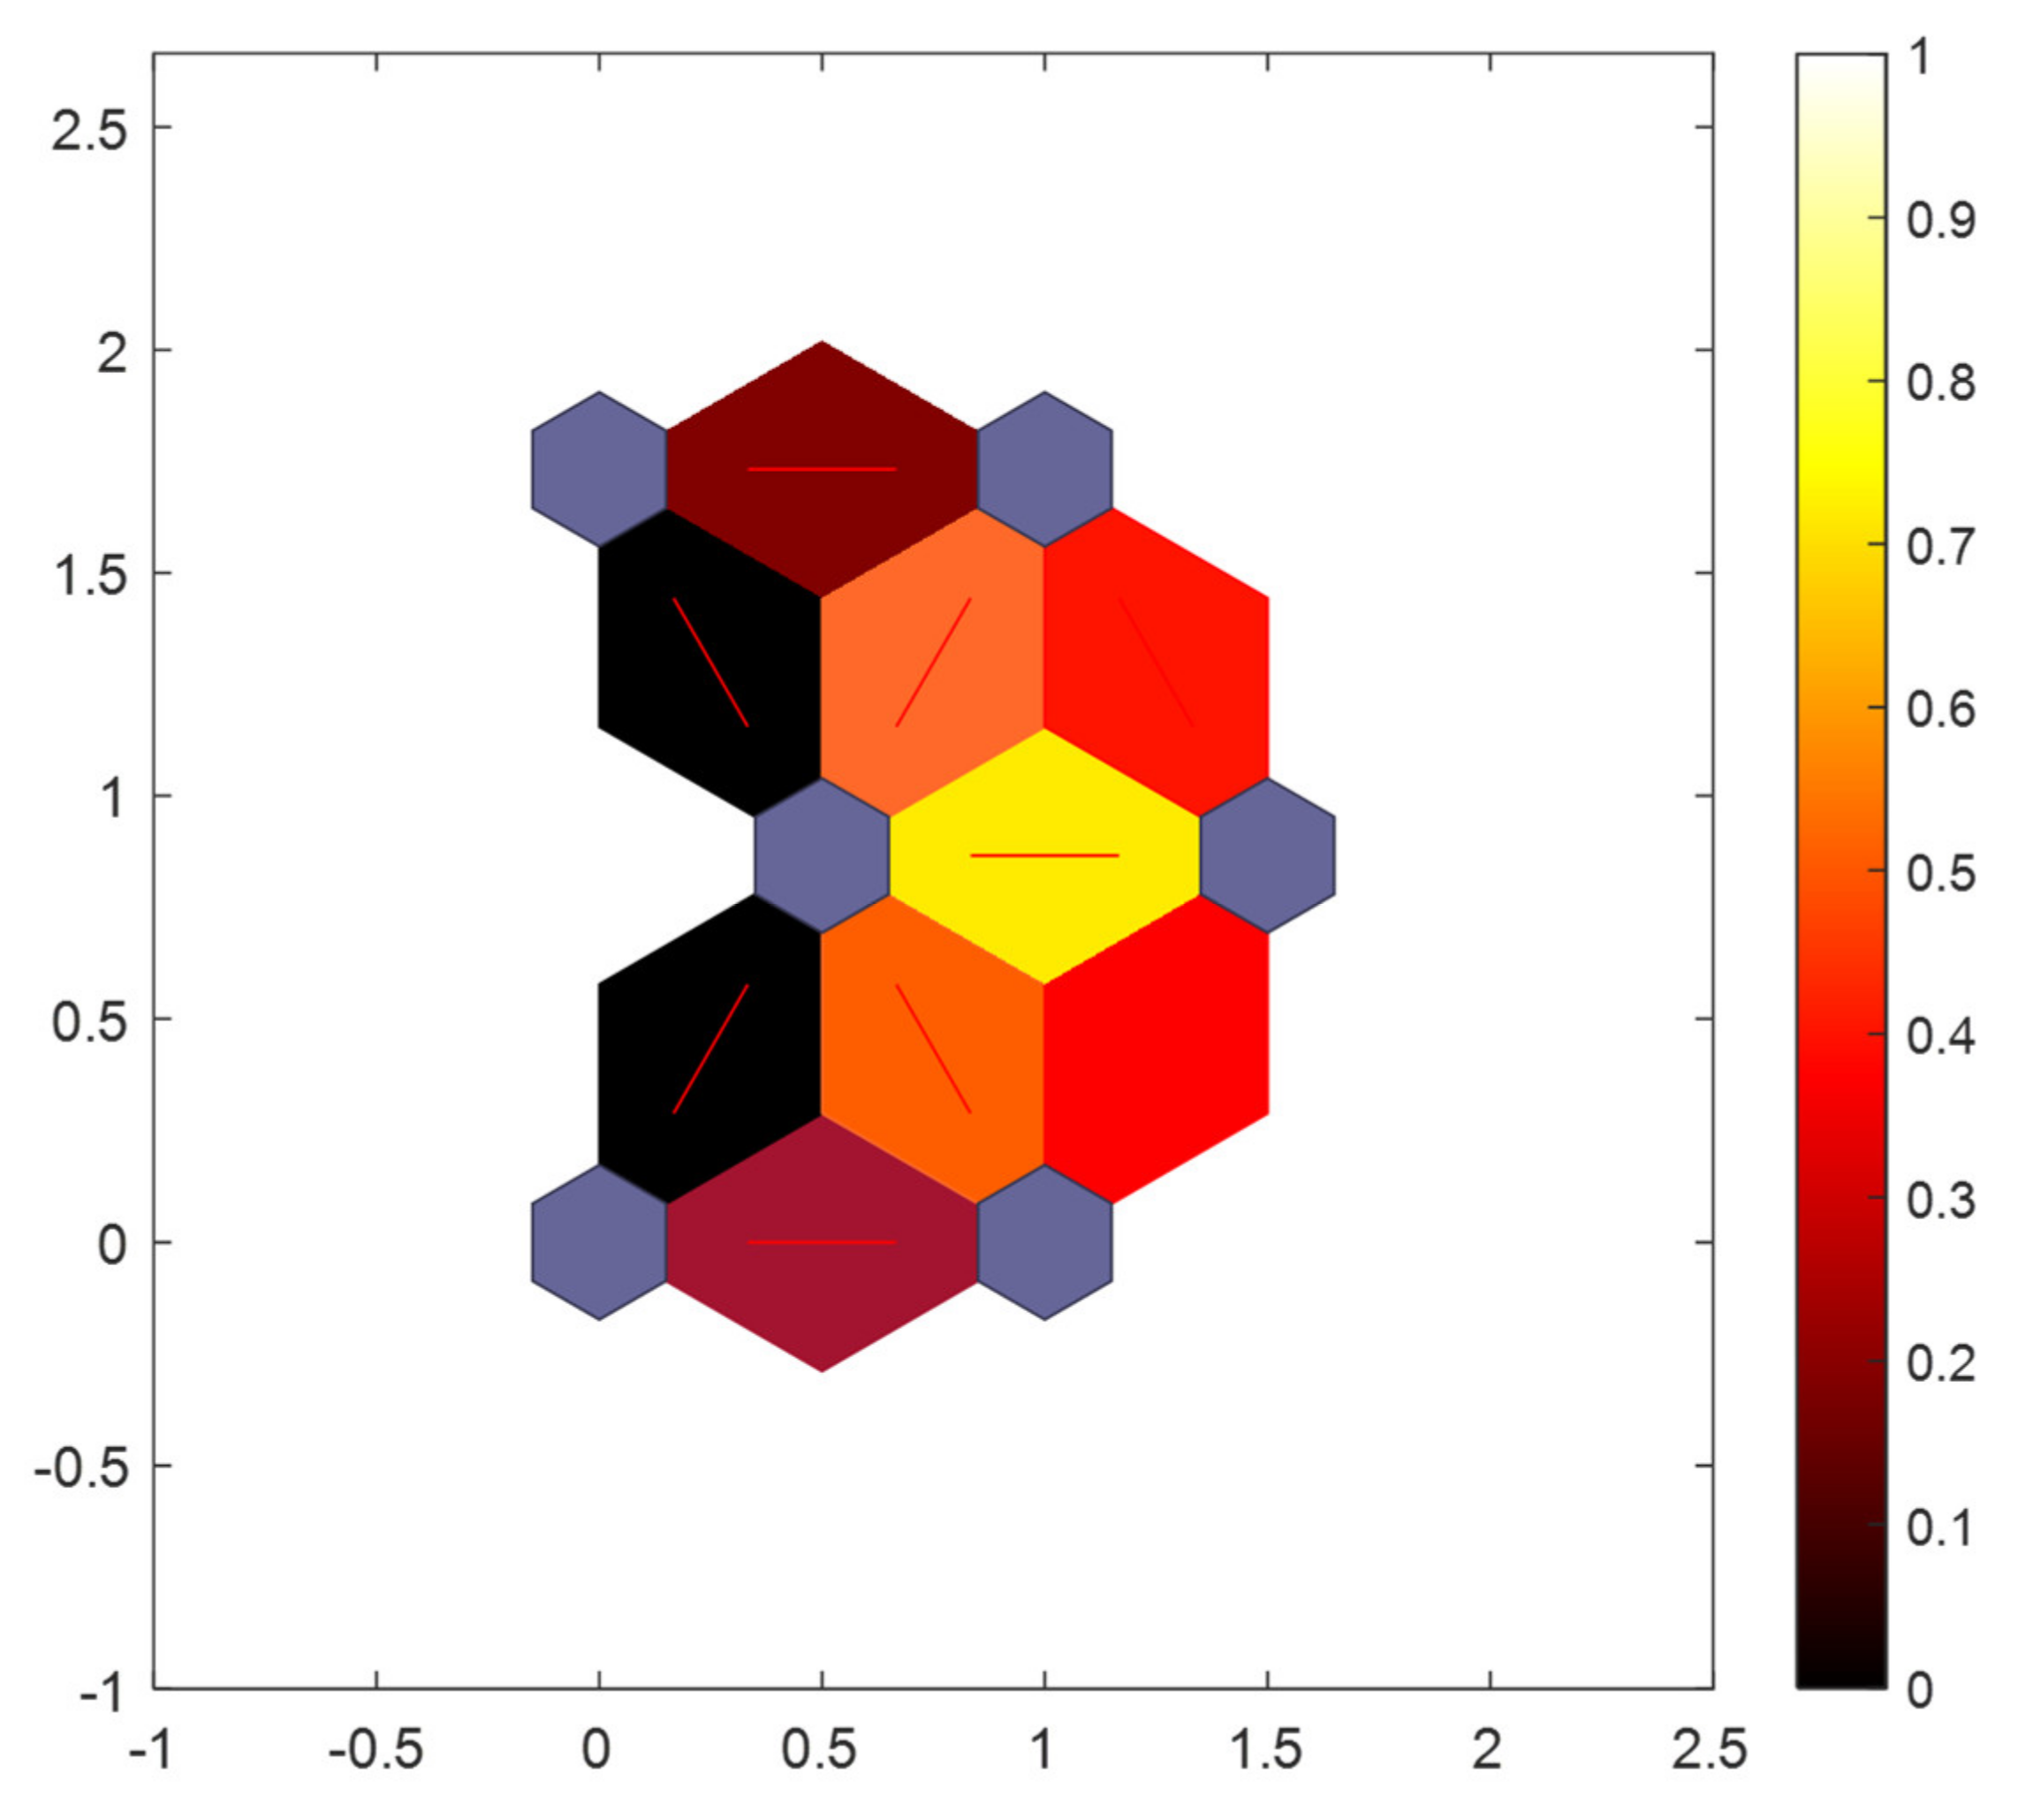
After that, we use the retained data to complete the learning process again. In this way, the result characteristics of final clustering will be more obvious. In other words, the distance between nodes in the output layer will be larger, as Figure 14.
The parameters in the training process for SOM-SPR and ISOM-SPR algorithms are listed in Table 1.

4. Experiment Results

4.1. Data Sets

In our experiments, 40 volunteers participated, including 10 females and 30 males. The heights of the volunteers ranged from 1.58 m to 1.81 m, and the weights ranged from 45 kg to 80 kg. Participants were asked to sit with six different positions, and we recorded data on each participant’s six sitting postures. During the test, the volunteers sat on the sensor as shown in Figure 15. The whole system is shown in Figure 16a, and the self-made data acquisition circuit is exhibited in Figure 16b.
For the sake of clarity, different sitting postures are labeled respectively, left cross-legs as LC, right cross-legs as RC, lean left as LL, lean right as LR, waist bow as WB, and standard sitting as SS. We saved around 30 frames for each pose and had a total of 8000 sets of data to form Dataset 1.
The general idea of training is as follows: firstly, all data samples are divided into 55% as training samples and 45% as test samples. In each sample, the data from the used flexible pressure array sensor are taken as input vectors, and the corresponding sitting posture is taken as the output.

4.2. Confusion Metrics

The confusion matrix is a measure used while solving classification problems [28]. It can be applied to binary classification as well as for multi-class problems. A multi-class confusion matrix for “left cross-legs” is shown in Table 2.
A c c u r a c y = T P + T N T P + T N + F P + F N .
R e c a l l = T P T P + F N .
P r e c i s i o n = T P T P + F P .

4.3. Experimental Result

In the test phase, we compare five traditional methods for sitting posture recognition, namely Decision tree-based SPR(DT-SPR) [15], K-means based SPR (KM-SPR) [29], BP neural network based SPR(BPNN-SPR) [30], SOM network based SPR(SOM-SPR), and the improved SOM network based SPR(ISOM-SPR). Table 3 shows the precision comparable results of different SPR algorithms. It is obvious that the performance of DT-SPR is the worst, ISOM-SPR has the highest average precision.
Table 4 compares the recall rate of different SPR algorithms. For postures LC and RC, three algorithms have a 100% recall rate. The performance of ISOM-SPR is better than all the other algorithms in terms of average recall rate.
Since training data and test data come from the same group of volunteers, there is a certain degree of similarity in the dataset, which may lead to the overfitting phenomenon. Therefore, we collected 3000 sets of data from 15 people who had never participated in the experiments and named this dataset Dataset 2. The new dataset is used to test the trained model. Table 5 shows the precision of the five SPR algorithms with new dataset. Table 6 shows the recall rate of the ISOM-SPR in comparison with the rest algorithms. Consistent with expected results, the precision and recall rate of all SPR algorithms have decreased. However, the results of ISOM-SPR are still the best of five SPR algorithms.
For the two data sets, the accuracy comparison of five SPR algorithms shows in Table 7. The accuracy of ISOM-SPR is the highest among all algorithms, regardless of Dataset 1 or Dataset 2. Consistent with expectations, test results are worse using Dataset 2 than Dataset 1, but the result of ISOM-SPR is still the best.
We conduct further analysis of ISOM-SPR; the confusion matrix of ISOM-SPR using Dataset 1 is shown in Table 8, while Dataset 2 is shown in Table 9. The precision and recall rates of all results using Dataset 1 are above 90%. It is clear from Table 8 and Table 9 that the identification results of LC and RC are the best, the result of LL’s misidentification is mostly LC, while the result of LR’s misidentification is mostly RC. The identification of WB and SS are the worst, with the misidentification of WB is mostly SS, while WB is always mistaken for SS.

5. Conclusions

In this paper, we designed a real-time sitting posture recognition system using flexible array pressure sensor and improved SOM classification method. The analysis and monitoring software can display the sitting posture pressure values and distributions, identify whether the sitting position is appropriate, and upload the data to the Cloud platform. The results of six kinds of sitting posture classification verified that the accuracy of ISOM-SPR reaches 95.67%, much better than DT-SPR, KM-SPR, BP-SPR, and SOM-SPR methods. The whole system has a great performance in using ISOM-SPR algorithm. High accuracy recognition of sitting posture can help users better check their sitting habits, so that users can consciously change some of their bad behaviors.
In future work, the number of samples can be further increased, in this way, the network model will have better applicability.

Author Contributions

Conceptualization, W.C.; methodology, W.C., D.Z.; software, D.Z.; validation, D.Z.; formal analysis, M.Z.; investigation, M.Z.; writing—original draft preparation, W.C., D.Z.; writing—review and editing, W.C., D.Z.; visualization, Y.X., Z.L.; supervision, W.C.; project administration, W.C., M.Z.; funding acquisition, W.C., M.Z. All authors have read and agreed to the published version of the manuscript.

Funding

This research was partially supported by National Natural Science Foundation of China (Grant No.61801431), Fundamental Research Funds for the Provincial Universities of Zhejiang (No.GK209907299001-001), Zhejiang new seedling plan project (2021R423005, 2021R407059) and National College Students’ innovation and Entrepreneurship Project (202011481014).

Institutional Review Board Statement

Not applicable.

Informed Consent Statement

Informed consent was obtained from all subjects involved in the study.

Conflicts of Interest

The authors declare no conflict of interest.

References

  1. Robertson, M.; Amick, B.C.; Derango, K.; Rooney, T.; Bazzani, L.; Harrist, R.; Moore, A. The effects of an office ergonomics training and chair intervention on worker knowledge, behavior and musculoskeletal risk. Appl. Erg. 2009, 40, 124–135. [Google Scholar] [CrossRef] [PubMed]
  2. Tremblay, M.S.; Leblanc, A.G.; Kho, M.E.; Saunders, T.J.; Larouche, R.; Colley, R.C.; Goldfield, G.; Gorber, S. Systematic review of sedentary behavior and health indicators in school-aged children and youth. Int. J. Behav. Nutr. Phys. Act. 2011, 8, 98. [Google Scholar] [CrossRef] [PubMed] [Green Version]
  3. Kokkinos, P.; Sheriff, H.; Kheirbek, R. Physical Inactivity and Mortality Risk. Cardiol. Res. Pract. 2011, 2011, 924945. [Google Scholar] [CrossRef] [Green Version]
  4. Haynes, S.; Williams, K. Impact of seating posture on user comfort and typing performance for people with chronic low back pain. Int. J. Ind. Ergon. 2008, 38, 35–46. [Google Scholar] [CrossRef]
  5. Harcombe, H.; Mcbride, D.; Derrett, S.; Gray, A. Prevalence and impact of musculoskeletal disorders in New Zealand nurses, postal workers and office workers. Aust. N. Z. J. Public Health 2009, 33, 437–441. [Google Scholar] [CrossRef]
  6. Wu, C.-C.; Chiu, C.-C.; Yeh, C.-Y. Development of wearable posture monitoring system for dynamic assessment of sitting posture. Phys. Eng. Sci. Med. 2020, 43, 187–203. [Google Scholar] [CrossRef]
  7. Dunne, L.E.; Walsh, P.; Hermann, S.; Smyth, B.; Caulfield, B. Wearable Monitoring of Seated Spinal Posture. IEEE Trans. Biomed. Circuits Syst. 2008, 2, 97–105. [Google Scholar] [CrossRef]
  8. Lee, C.-H.; Lee, S.; Shin, G. Reliability of forward head posture evaluation while sitting, standing, walking and running. Hum. Mov. Sci. 2017, 55, 81–86. [Google Scholar] [CrossRef] [PubMed]
  9. Grant, P.M.; Ryan, C.G.; Tigbe, W.W.; Granat, M.H. The validation of a novel activity monitor in the measurement of posture and motion during everyday activities. Br. J. Sports Med. 2006, 40, 992–997. [Google Scholar] [CrossRef] [PubMed] [Green Version]
  10. Nguyen, H.; Lebel, K.; Boissy, P.; Bogard, S.; Goubault, E.; Duval, C. Auto detection and segmentation of daily living activities during a Timed Up and Go task in people with Parkinson’s disease using multiple inertial sensors. J. Neuro Eng. Rehabil. 2017, 14, 1–13. [Google Scholar] [CrossRef] [Green Version]
  11. Roh, J.; Park, H.-J.; Lee, K.; Hyeong, J.; Kim, S.; Lee, B. Sitting Posture Monitoring System Based on a Low-Cost Load Cell Using Machine Learning. Sensors 2018, 18, 208. [Google Scholar] [CrossRef] [Green Version]
  12. O’Sullivan, K.; O’Keeffe, M.; O’Sullivan, L.; O’Sullivan, P.; Dankaerts, W. Perceptions of sitting posture among members of the community, both with and without non-specific chronic low back pain. Man. Ther. 2013, 18, 551–556. [Google Scholar] [CrossRef]
  13. Claeys, K.; Brumagne, S.; Deklerck, J.; Vanderhaeghen, J.; Dankaerts, W. Sagittal evaluation of usual standing and sitting spinal posture. J. Bodyw. Mov. Ther. 2016, 20, 326–333. [Google Scholar] [CrossRef]
  14. Claus, A.P.; Hides, J.A.; Moseley, G.L.; Hodges, P.W. Thoracic and lumbar posture behavior in sitting tasks and standing: Progressing the biomechanics from observations to measurements. Appl. Ergon. 2016, 53, 161–168. [Google Scholar] [CrossRef] [PubMed] [Green Version]
  15. Kim, Y.; Son, Y.; Kim, W.; Jin, B.; Yun, M. Classification of Children’s Sitting Postures Using Machine Learning Algorithms. Appl. Sci. 2018, 8, 1280. [Google Scholar] [CrossRef] [Green Version]
  16. Xu, W.; Huang, M.-C.; Amini, N.; He, L.; Sarrafzadeh, M. eCushion: A Textile Pressure Sensor Array Design and Calibration for Sitting Posture Analysis. IEEE Sens. J. 2013, 13, 3926–3934. [Google Scholar] [CrossRef]
  17. Yongxiang, J.; Jingle, D.; Sanpeng, D.; Yuming, Q.; Peng, W.; Zijing, W.; Tianjiang, Z. Sitting posture recognition by body pressure distribution and airbag regulation strategy based on seat comfort evaluation. J. Eng. 2019, 2019, 8910–8914. [Google Scholar] [CrossRef]
  18. Benocci, M.; Farella, E.; Benini, L. A context-aware smart seat. In Proceedings of the 4th IEEE International Workshop on Advances in Sensors and Interfaces, Savelletri di Fasano, Italy, 28–29 June 2011; pp. 104–109. [Google Scholar]
  19. Liu, W.; Guo, Y.; Yang, J.; Hu, Y.; Wei, D. Sitting posture recognition based on human body pressure and CNN. In AIP Conference Proceedings; AIP Publishing LLC: Melville, NY, USA, 2019; Volume 2073, p. 020093. [Google Scholar]
  20. Wang, L.; Ding, T.; Wang, P. Thin Flexible Pressure Sensor Array Based on Carbon Black/Silicone Rubber Nanocomposite. IEEE Sens. J. 2009, 9, 1130–1135. [Google Scholar] [CrossRef]
  21. Kohonen, T. Self-Organizing Maps, 3rd ed.; Springer Series in Information Sciences; Springer: Berlin/Heidelberg, Germany, 2001. [Google Scholar]
  22. Gutierrez, E.; Alm, M.; Hultling, C.; Saraste, H. Measuring seating pressure, area, and asymmetry in persons with spinal cord injury. Eur. Spine J. 2004, 13, 374–379. [Google Scholar] [CrossRef] [PubMed] [Green Version]
  23. Phaladiganon, P.; Kim, S.B.; Chen, V.C.P.; Jiang, W. Principal component analysis-based control charts for multivariate nonnormal distributions. Expert Syst. Appl. 2013, 40, 3044–3054. [Google Scholar] [CrossRef]
  24. Jackson, J.E.; Hearne, F.T. Relationships among Coefficients of Vectors Used In Principal Components. Technometrics 1973, 15, 601–610. [Google Scholar] [CrossRef]
  25. Li, J.; Wang, S.; Yang, D.; Dong, C.; Tao, Y.; Zhou, Y. An improved Q-estimation approach: The weighted centroid frequency shift method. J. Geophys. Eng. 2016, 13, 399–411. [Google Scholar] [CrossRef] [Green Version]
  26. Kaski, S.; Lagus, K. Comparing self-organizing maps. In Proceedings of the ICANN: International Conference on Artificial Neural Networks, Bochum, Germany, 16–19 July 1996; Volume 1112, pp. 809–814. [Google Scholar]
  27. Vatanen, T.; Osmala, M.; Raiko, T.; Lagus, K.; Sysi-Aho, M.; Orešič, M.; Honkela, T.; Lähdesmäki, H. Self-organization and missing values in SOM and GTM. Neurocomputing 2015, 147, 60–70. [Google Scholar] [CrossRef]
  28. Kulkarni, A.; Chong, D.; Batarseh, F.A. Foundations of data imbalance and solutions for a data democracy. In Data Democracy; Academic Press: Cambridge, MA, USA, 2020; pp. 83–106. [Google Scholar]
  29. Javadi, S.; Hashemy, S.M.; Mohammadi, K.; Howard, K.W.F.; Neshat, A. Classification of aquifer vulnerability using K-means cluster analysis. J. Hydrol. 2017, 549, 27–37. [Google Scholar] [CrossRef]
  30. Li, B.; Han, C.; Bai, B. Hybrid approach for human posture recognition using anthropometry and BP neural network based on Kinect V2. EURASIP J. Image Video Process. 2019, 1, 8. [Google Scholar] [CrossRef] [Green Version]
Figure 1. System framework.
Sensors 21 06246 g001
Figure 2. The block diagram of the sitting posture recognition system.
Sensors 21 06246 g002
Figure 3. Flexible array pressure sensor.
Sensors 21 06246 g003
Figure 4. Schematic diagram of analog switch connection.
Sensors 21 06246 g004
Figure 5. The characteristic curve of array pressure sensor. The left shows the pressure is directly proportional to the resistance 1/R; The right shows the pressure is inversely proportional to R.
Sensors 21 06246 g005
Figure 6. The software interface of analysis and monitoring application.
Sensors 21 06246 g006
Figure 7. The interface on the phone.
Sensors 21 06246 g007
Figure 8. The SOM network structure diagram.
Sensors 21 06246 g008
Figure 9. The principle of proposed algorithm.
Sensors 21 06246 g009
Figure 10. Sitting posture and pressure distribution.
Sensors 21 06246 g010
Figure 11. The SOM-SPR topology of the output layer.
Sensors 21 06246 g011
Figure 12. The SOM-SPR neighbor nodes distance.
Sensors 21 06246 g012
Figure 13. Flow charts of two algorithms. (a) Flow chart of SOM-SPR. (b) Flow chart of ISOM-SPR.
Sensors 21 06246 g013
Figure 14. The ISOM-SPR neighbor nodes distance.
Sensors 21 06246 g014
Figure 15. Experimental scene.
Sensors 21 06246 g015
Figure 16. The data acquisition system and circuit. (a) The data acquisition system. (b) Pressure acquisition circuit.
Sensors 21 06246 g016
Table 1. SOM-SPR and ISOM-SPR parameters.
ParameterSymbolOptimal Value
Number of the output neuronsN6 (2 × 3)
Initial learning rateη00.6
The time constant of the learning rateτη1000
Learning gainσ010
The time constant of the exponential functionτσ2
Initial neighborhood sizeNc(0)3
Total sample numberM3600
The degree of differentiationrmin0.15
Table 2. Multi-class confusion matrix for “left cross-legs”.
ActualPredicted
LCRCLLLRWBSS
LCTPFNFNFNFNFN
RCFPTNTNTNTNTN
LLFPTNTNTNTNTN
LRFPTNTNTNTNTN
WBFPTNTNTNTNTN
SSFPTNTNTNTNTN
Table 3. The precision of five SPR algorithms for Dataset 1.
Sitting PostureDT-SPRKM-SPRBP-SPRSOM-SPRISOM-SPR
LC92.47%96.77%96.26%94.94%97.40%
RC91.69%96.62%95.59%93.17%97.88%
LL83.47%93.15%90.59%93.50%96.47%
LR89.55%93.27%90.51%92.65%95.89%
WB72.99%87.89%87.72%89.66%91.60%
SS77.40%91.41%88.76%90.60%94.58%
Ave.84.60%93.19%91.57%92.42%95.64%
Std.0.03250.00560.00630.00190.0026
Table 4. The recall rate of five SPR algorithms for Dataset 1.
Sitting PostureDT-SPRKM-SPRBP-SPRSOM-SPRISOM-SPR
LC94.17%100.00%94.33%100.00%100.00%
RC95.67%100.00%93.83%100.00%100.00%
LL84.17%95.17%94.67%93.50%95.67%
LR85.67%94.67%93.83%92.50%97.33%
WB75.67%84.67%84.50%83.83%90.83%
SS72.50%85.17%88.17%85.17%90.17%
Ave.84.64%93.28%91.56%92.50%95.67%
Std.0.04420.02360.00890.02420.0094
Table 5. The precision of the five SPR algorithms for Dataset 2.
Sitting PostureDT-SPRKM-SPRBP-SPRSOM-SPRISOM-SPR
LC90.31%95.84%91.50%94.94%95.87%
RC89.31%94.87%91.53%93.17%96.01%
LL82.39%89.78%87.74%93.50%93.00%
LR85.67%90.11%87.98%92.65%93.82%
WB72.03%86.87%88.81%89.66%90.34%
SS79.15%89.88%88.38%90.60%93.37%
Ave.83.14%91.22%89.32%92.42%93.74%
Std.0.02360.00590.00150.00190.0022
Table 6. The recall rate of the five SPR algorithms for Dataset 2.
Sitting PostureDT-SPRKM-SPRBP-SPRSOM-SPRISOM-SPR
LC93.17%96.00%93.33%95.33%96.83%
RC94.67%95.50%93.67%95.17%96.33%
LL82.67%93.67%91.83%92.17%95.17%
LR83.67%94.17%91.50%91.83%96.17%
WB73.83%83.83%82.00%85.50%88.83%
SS71.50%84.33%83.67%84.83%89.17%
Ave.83.25%91.25%89.33%90.81%93.75%
Std.0.04560.01580.01320.01060.0069
Table 7. The accuracy of five SPR algorithms.
DT-SPRKM-SPRBP-SPRSOM-SPRISOM-SPR
Dataset 184.64%93.28%91.56%92.50%95.67%
Dataset 283.25%91.25%89.33%90.81%93.75%
Table 8. The confusion matrix of ISOM-SPR using Dataset 1.
Dataset 1LCRCLLLRWBSSTotalRecall
LC60000000600100.00%
RC06000000600100.00%
LL15057407460095.67%
LR01105844160097.33%
WB1212145452660090.83%
SS009113954160090.17%
Total616613595609595572
Precision97.40%97.88%96.47%95.89%91.60%94.58%
Table 9. The confusion matrix of ISOM-SPR using Dataset 2.
Dataset 1LCRCLLLRWBSSTotalRecall
LC58101603060096.83%
RC05780184060096.33%
LL180571010160095.17%
LR01805775060096.17%
WB3611105333760088.83%
SS4016103553560089.17%
Total606602614615590573
Precision95.87%96.01%93.00%93.82%90.34%93.37%
Publisher’s Note: MDPI stays neutral with regard to jurisdictional claims in published maps and institutional affiliations.

