
Experimental Validation and Deployment of Observability Applications for Monitoring of Low-Voltage Distribution Grids

 , , ,
, , ,  ,
,  and
and
Abstract
:1. Introduction
- Algorithmic challenges to deal with varying data quality and with potentially inaccurate data: Data from the smart meters and PV Inverters need to be correlated to the low-voltage grid topology and processed jointly with measurements from the distribution grid from other DSO systems (e.g., substation measurements). It is pertinent to mention that these measurements might come from devices created by different vendors with varying data standards.
- Interconnection of different systems with different criticality levels: Data access to SMs and Inverters is performed via different ICT technologies, in the latter case also involving the Internet. Therefore, the variable properties of the used communication technologies and the different connection architectures influence the security, availability, and performance of the ICT connection.
- Security and Privacy challenges: Grid measurements close to the customer site might contain potentially privacy sensitive data, depending on the type of measurement.
2. Framework for Grid Observability Apps Deployment
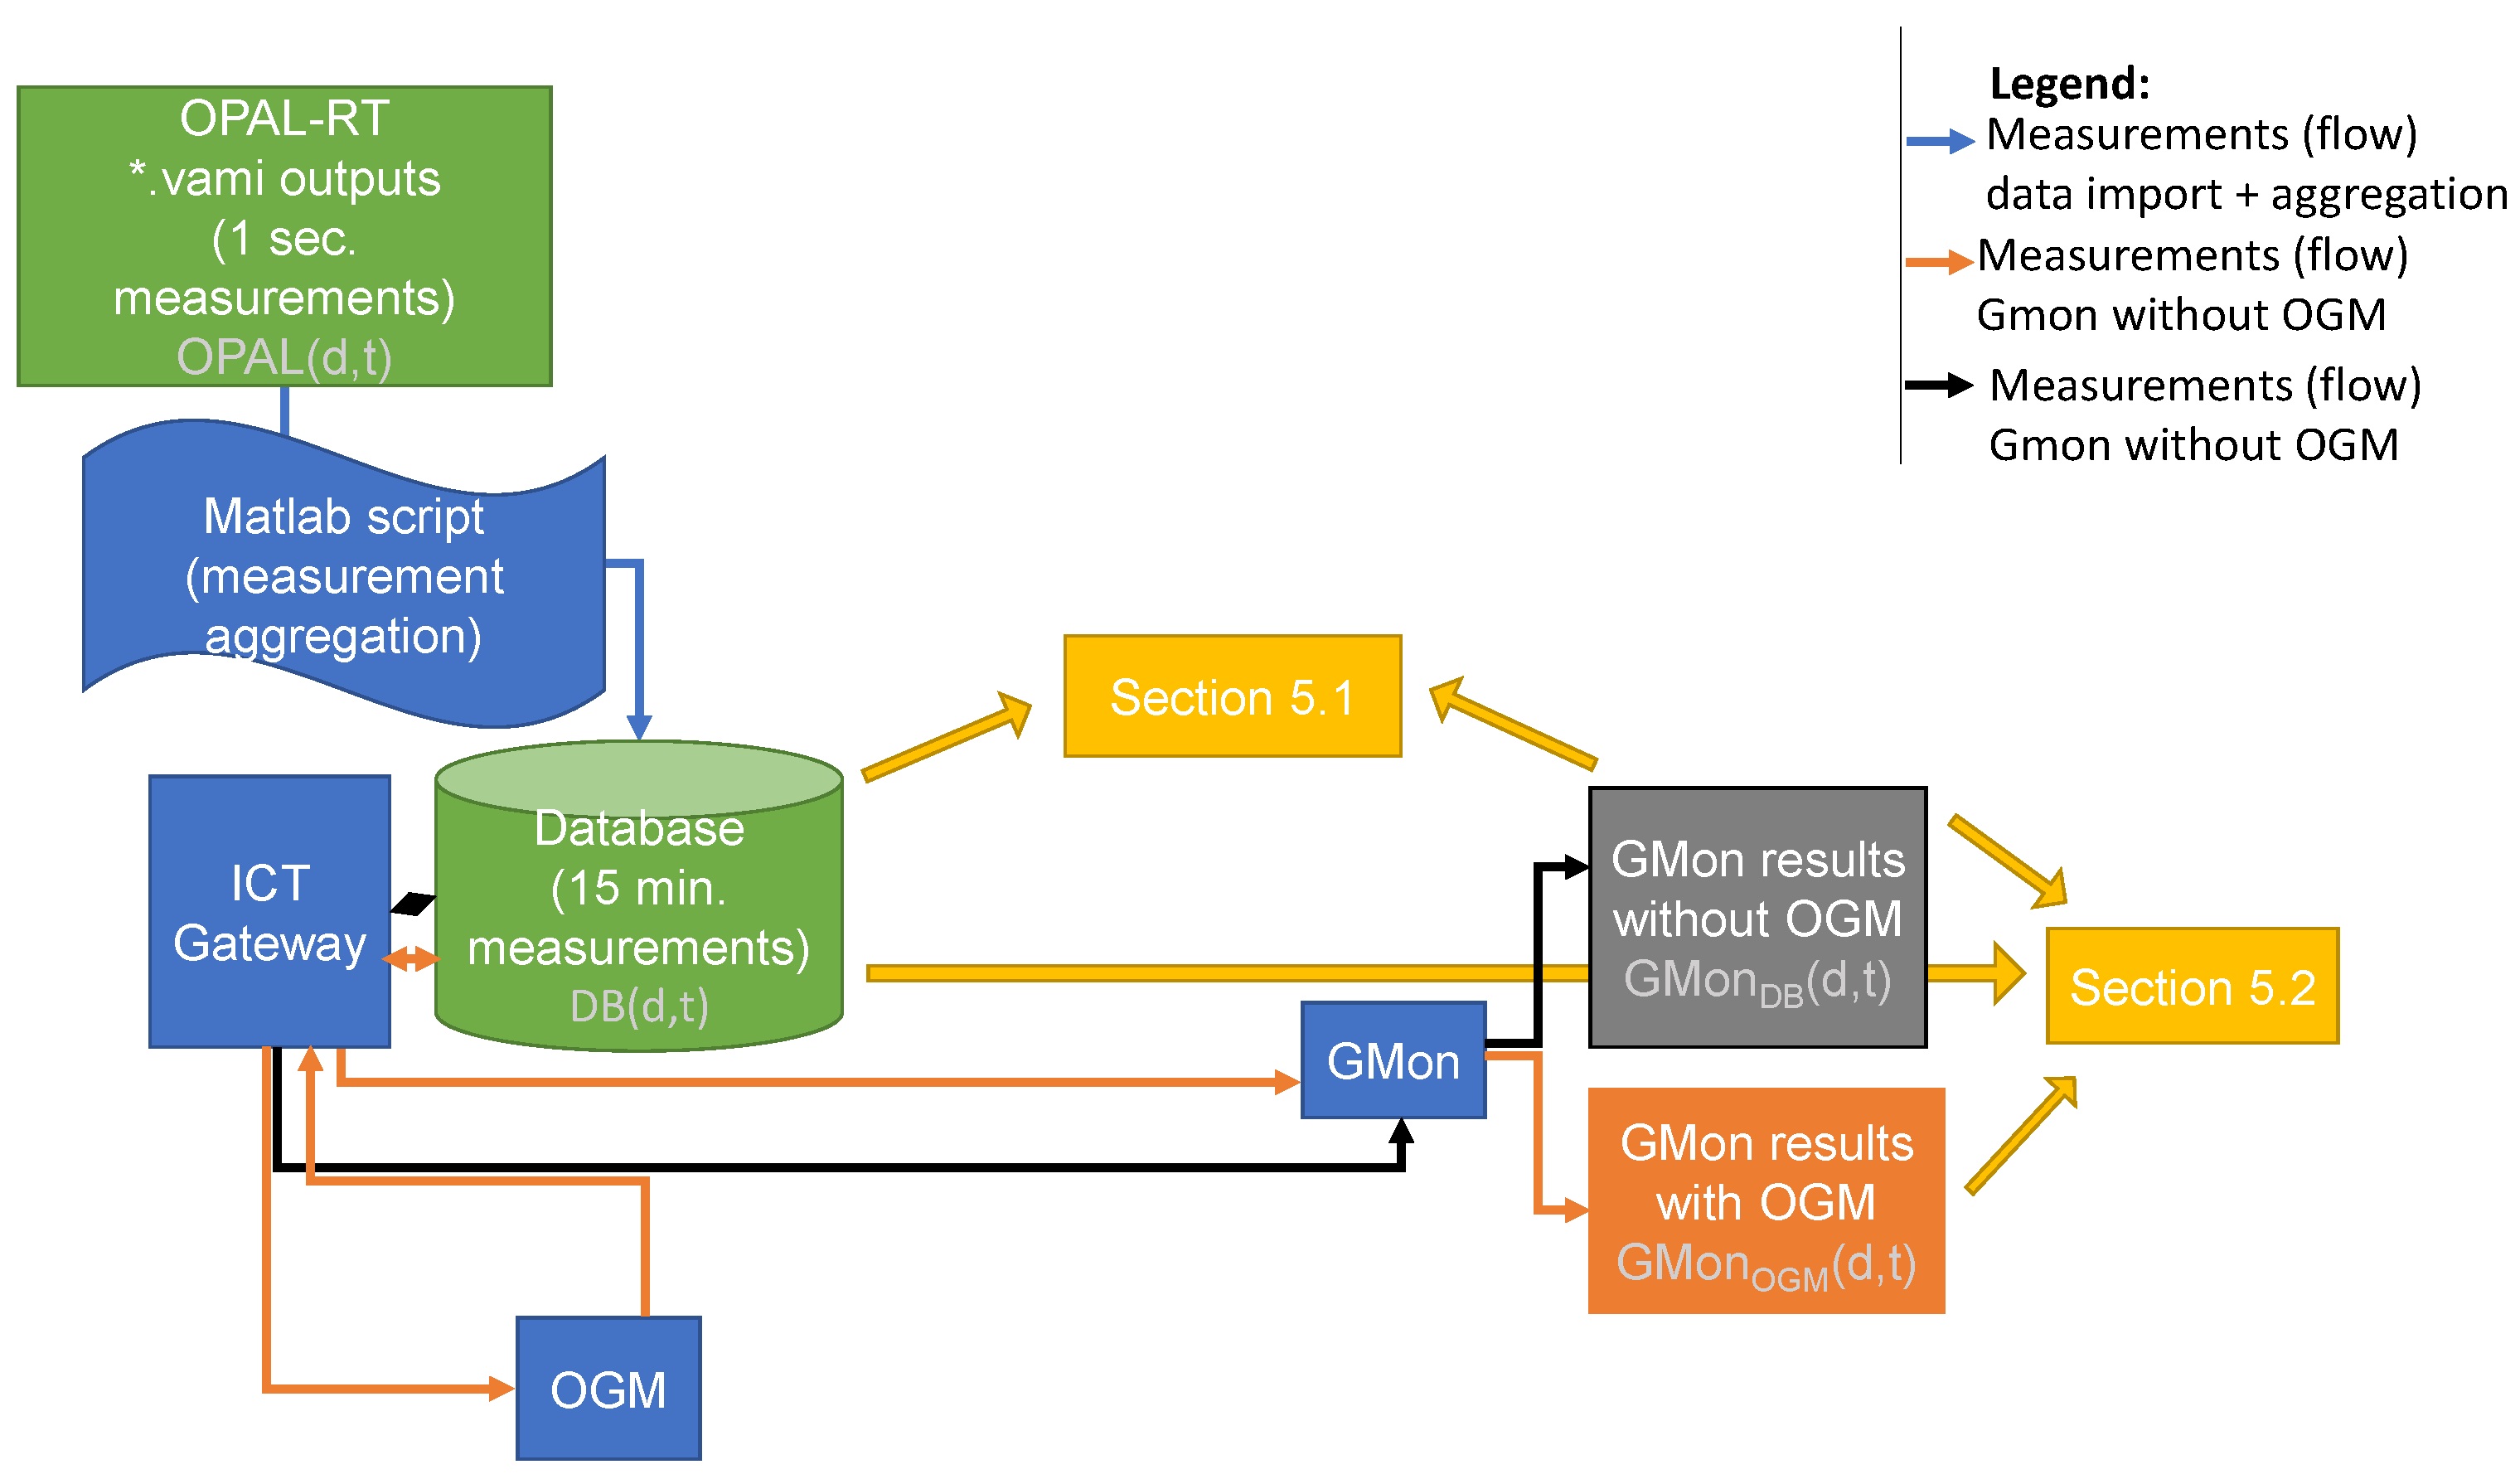
2.1. Overview of Information Flow
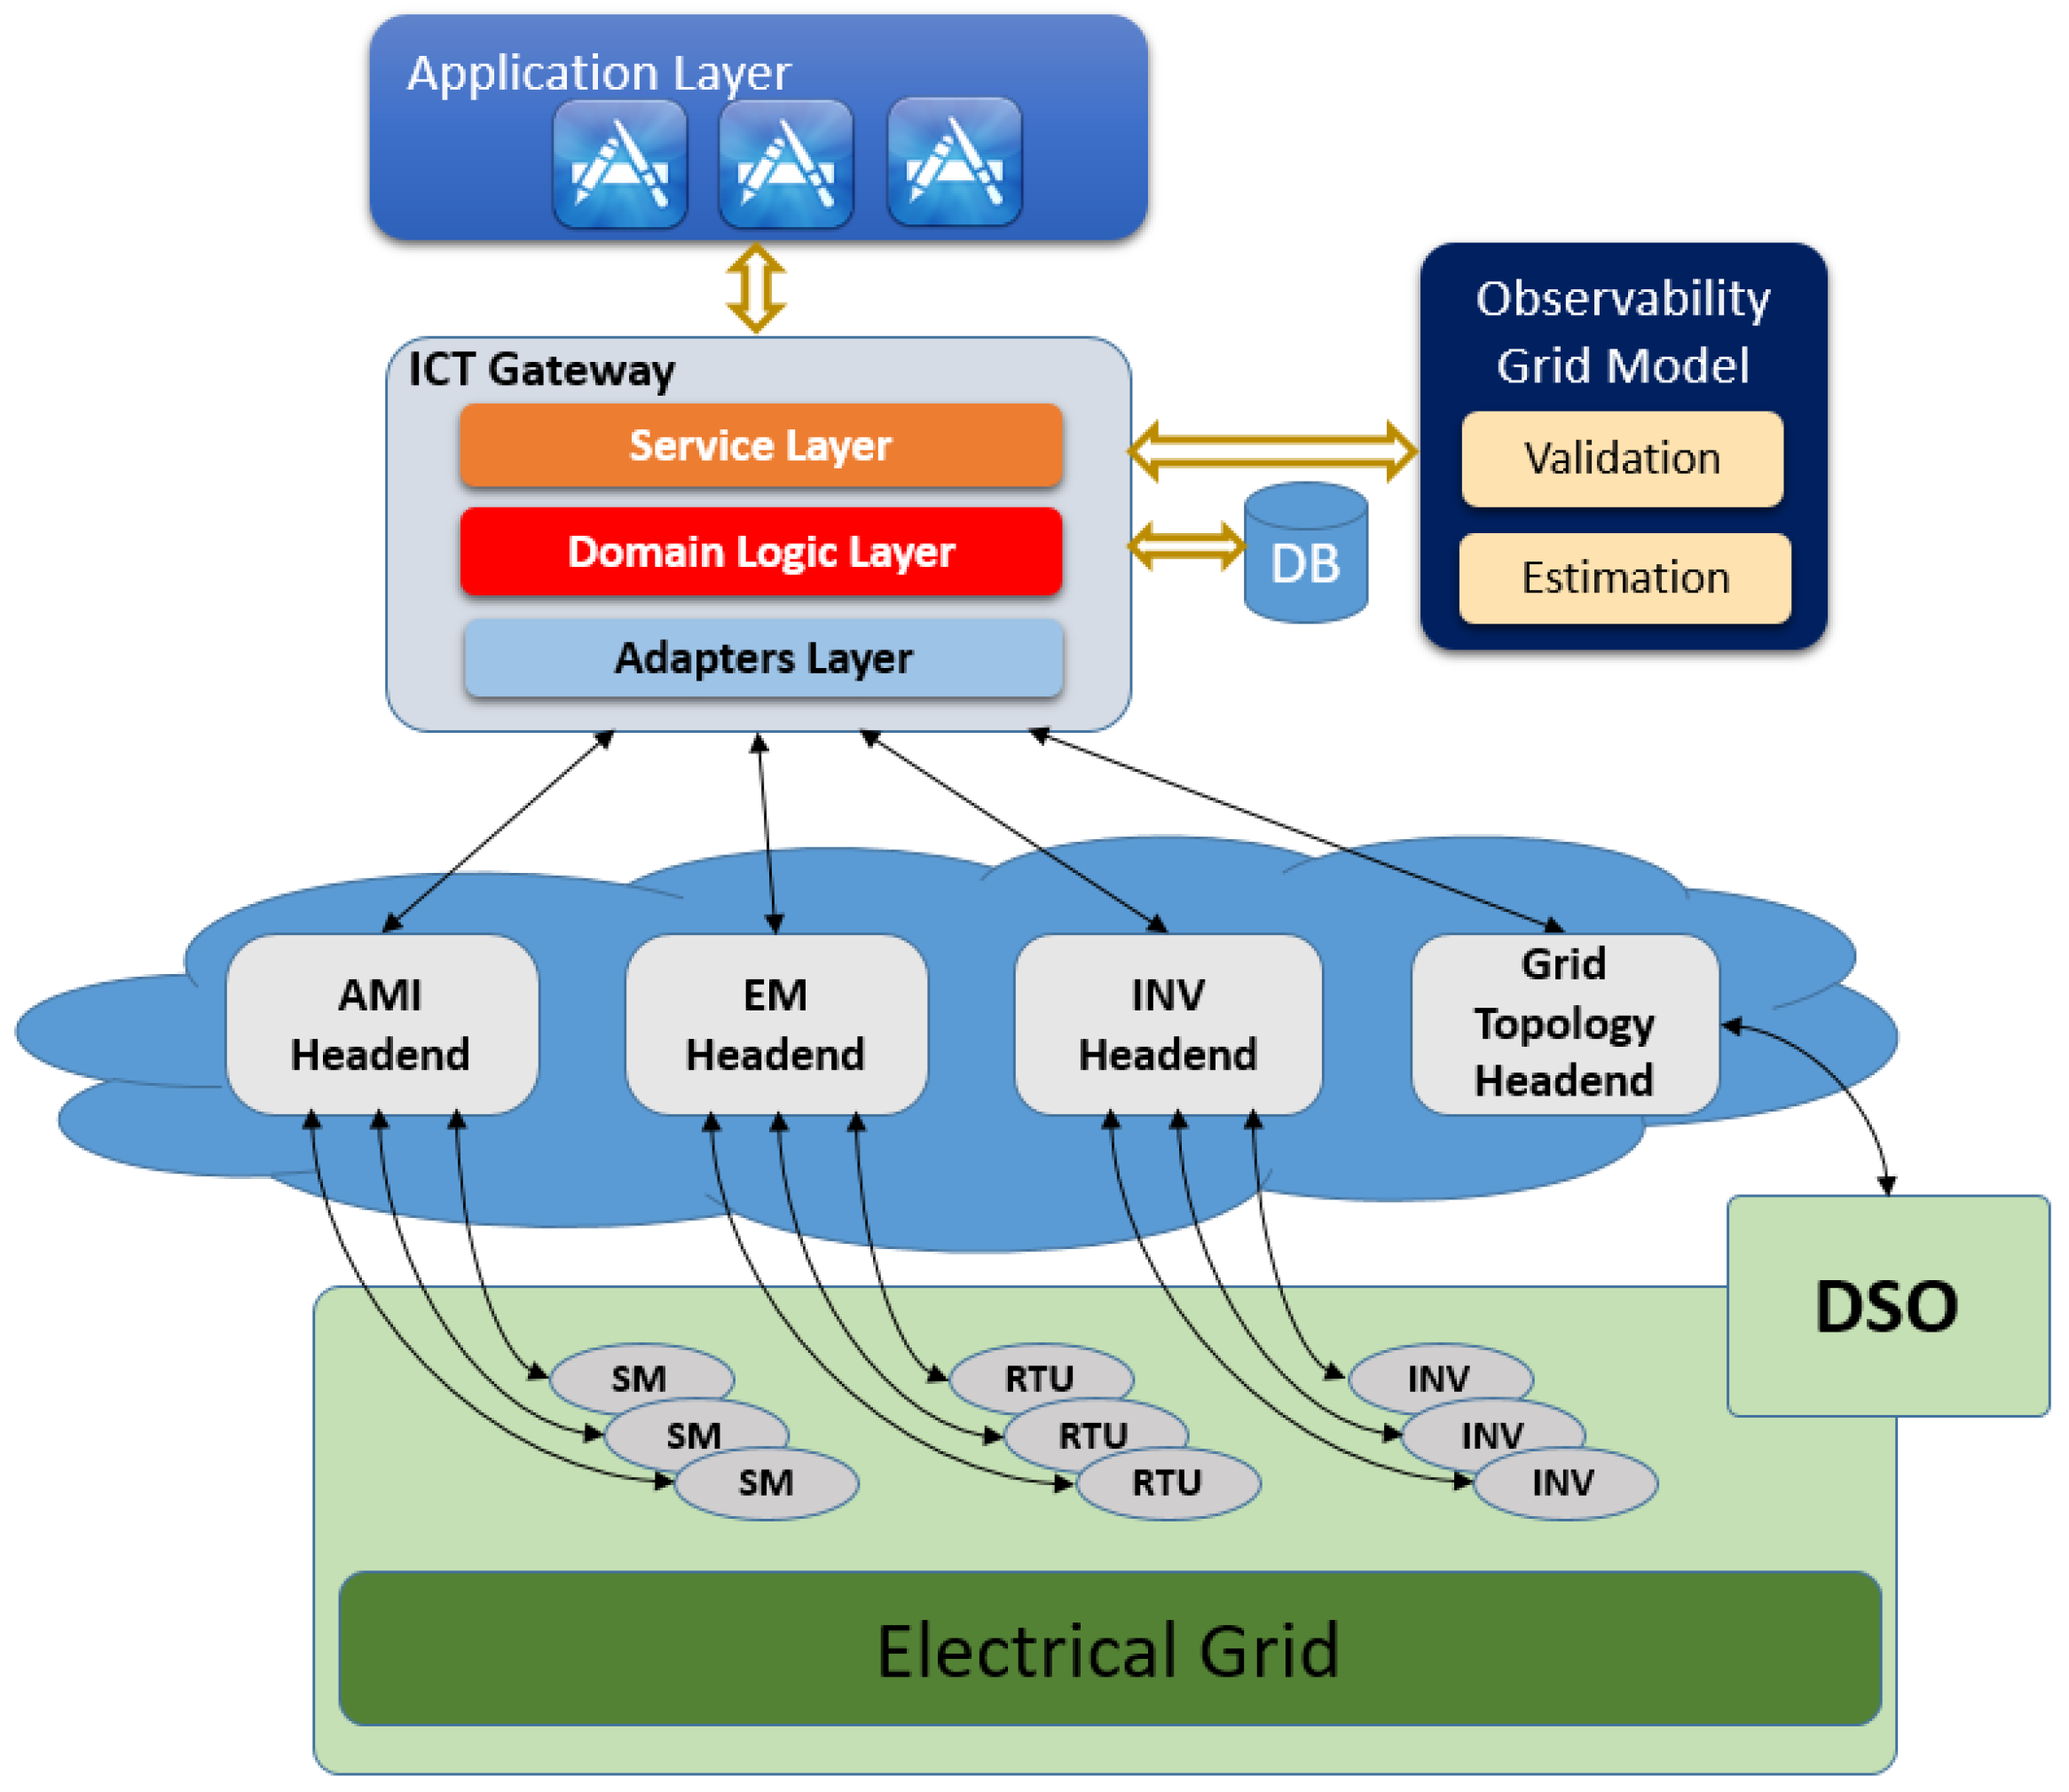
2.2. Grid Observability Applications Deployment Architecture
2.2.1. Application Layer
2.2.2. ICT Gateway Layer
- The AMI adapter refers to the Advanced Metering Infrastructure (AMI) subsystem aiming at collecting and making available to the ICT Gateway data from SMs deployed in the grid.
- The INV adapter refers to an internet portal of the PV inverter subsystem. It aims at three tasks: (1) Collecting and making available data from PV systems deployed in the grid, (2) providing service messages that represent alarms generated within the PV system, and (3) sending data like setpoints to PV inverters.
- The EM adapter refers to the Remote Terminal Unit (RTU) subsystem. It aims at collecting measurements and alarms from electrical measurement devices deployed in the grid, and sending on-demand access requests to the RTUs.
- The Grid Topology adapter refers to the GIS system of the DSO for collecting electrical grid topology information, like nodes and cables, as well es their parameters.
2.2.3. Headend Layer
2.3. Grid Topology Extraction
- Lack of standard data models: DSOs frequently include the LV grid topology data in their databases, which may come from different systems such as Geographical Information System (GIS) or other asset management systems, which store a relevant part of the grid topology in a type-specific format. For some DSOs, this data may come in a single file (e.g., in a common information model (CIM) XML format), while for others, it may come in different files, where each file carries information about a specific grid node entity. The varying data quality of grid topological information is due to the lack of standard data models that leads to complexities in extracting topology information.
- Complexities in extracting topology information: The topology data usually employ a composite design pattern, and thus, entities cannot be directly interlinked, that is, there is no explicit mapping between a substation and a customer connection box, and so forth. Therefore, novel algorithms are required for not only extracting and parsing the topological data, but also to create links between different entities of the grid.
- Dependence on multiple databases: Information about different grid node entities need to be collected from different databases. For instance, the GIS system usually stops at the house connection box. Thus, the private cables from the connection boxes to the customer meters are not included in the GIS data and need to be collected from other database sources.
- Incorrectness/incompleteness of topology information: The inaccuracies/deficiencies in the data can be addressed by either manually defined rules in implementation or depending on multiple databases to extract correct information within a required amount of time [18].
- Mapping between data and measurement points in grid topology: Data from devices such as RTUs, smart meters or PV inverters need to be mapped to the measurement points in the grid topology. Typically, several layers of mappings exist because each subsystem uses its own internal mappings, while DSOs have their own schemes. This makes it even harder for systems to link data properly [28].
- Parameter fetching issues: Various grid parameters, specifically cable parameters, might get outdated or need to be changed, which are often fetched from datasheets. Manual fetching of such parameters becomes challenging for systems.
- Challenges in data collection and integration: Collection of measurements from various devices (PV inverters, RTUs) with diverse identification schemes is a challenge. The measurement data from devices need to be related to a unique grid topology model.
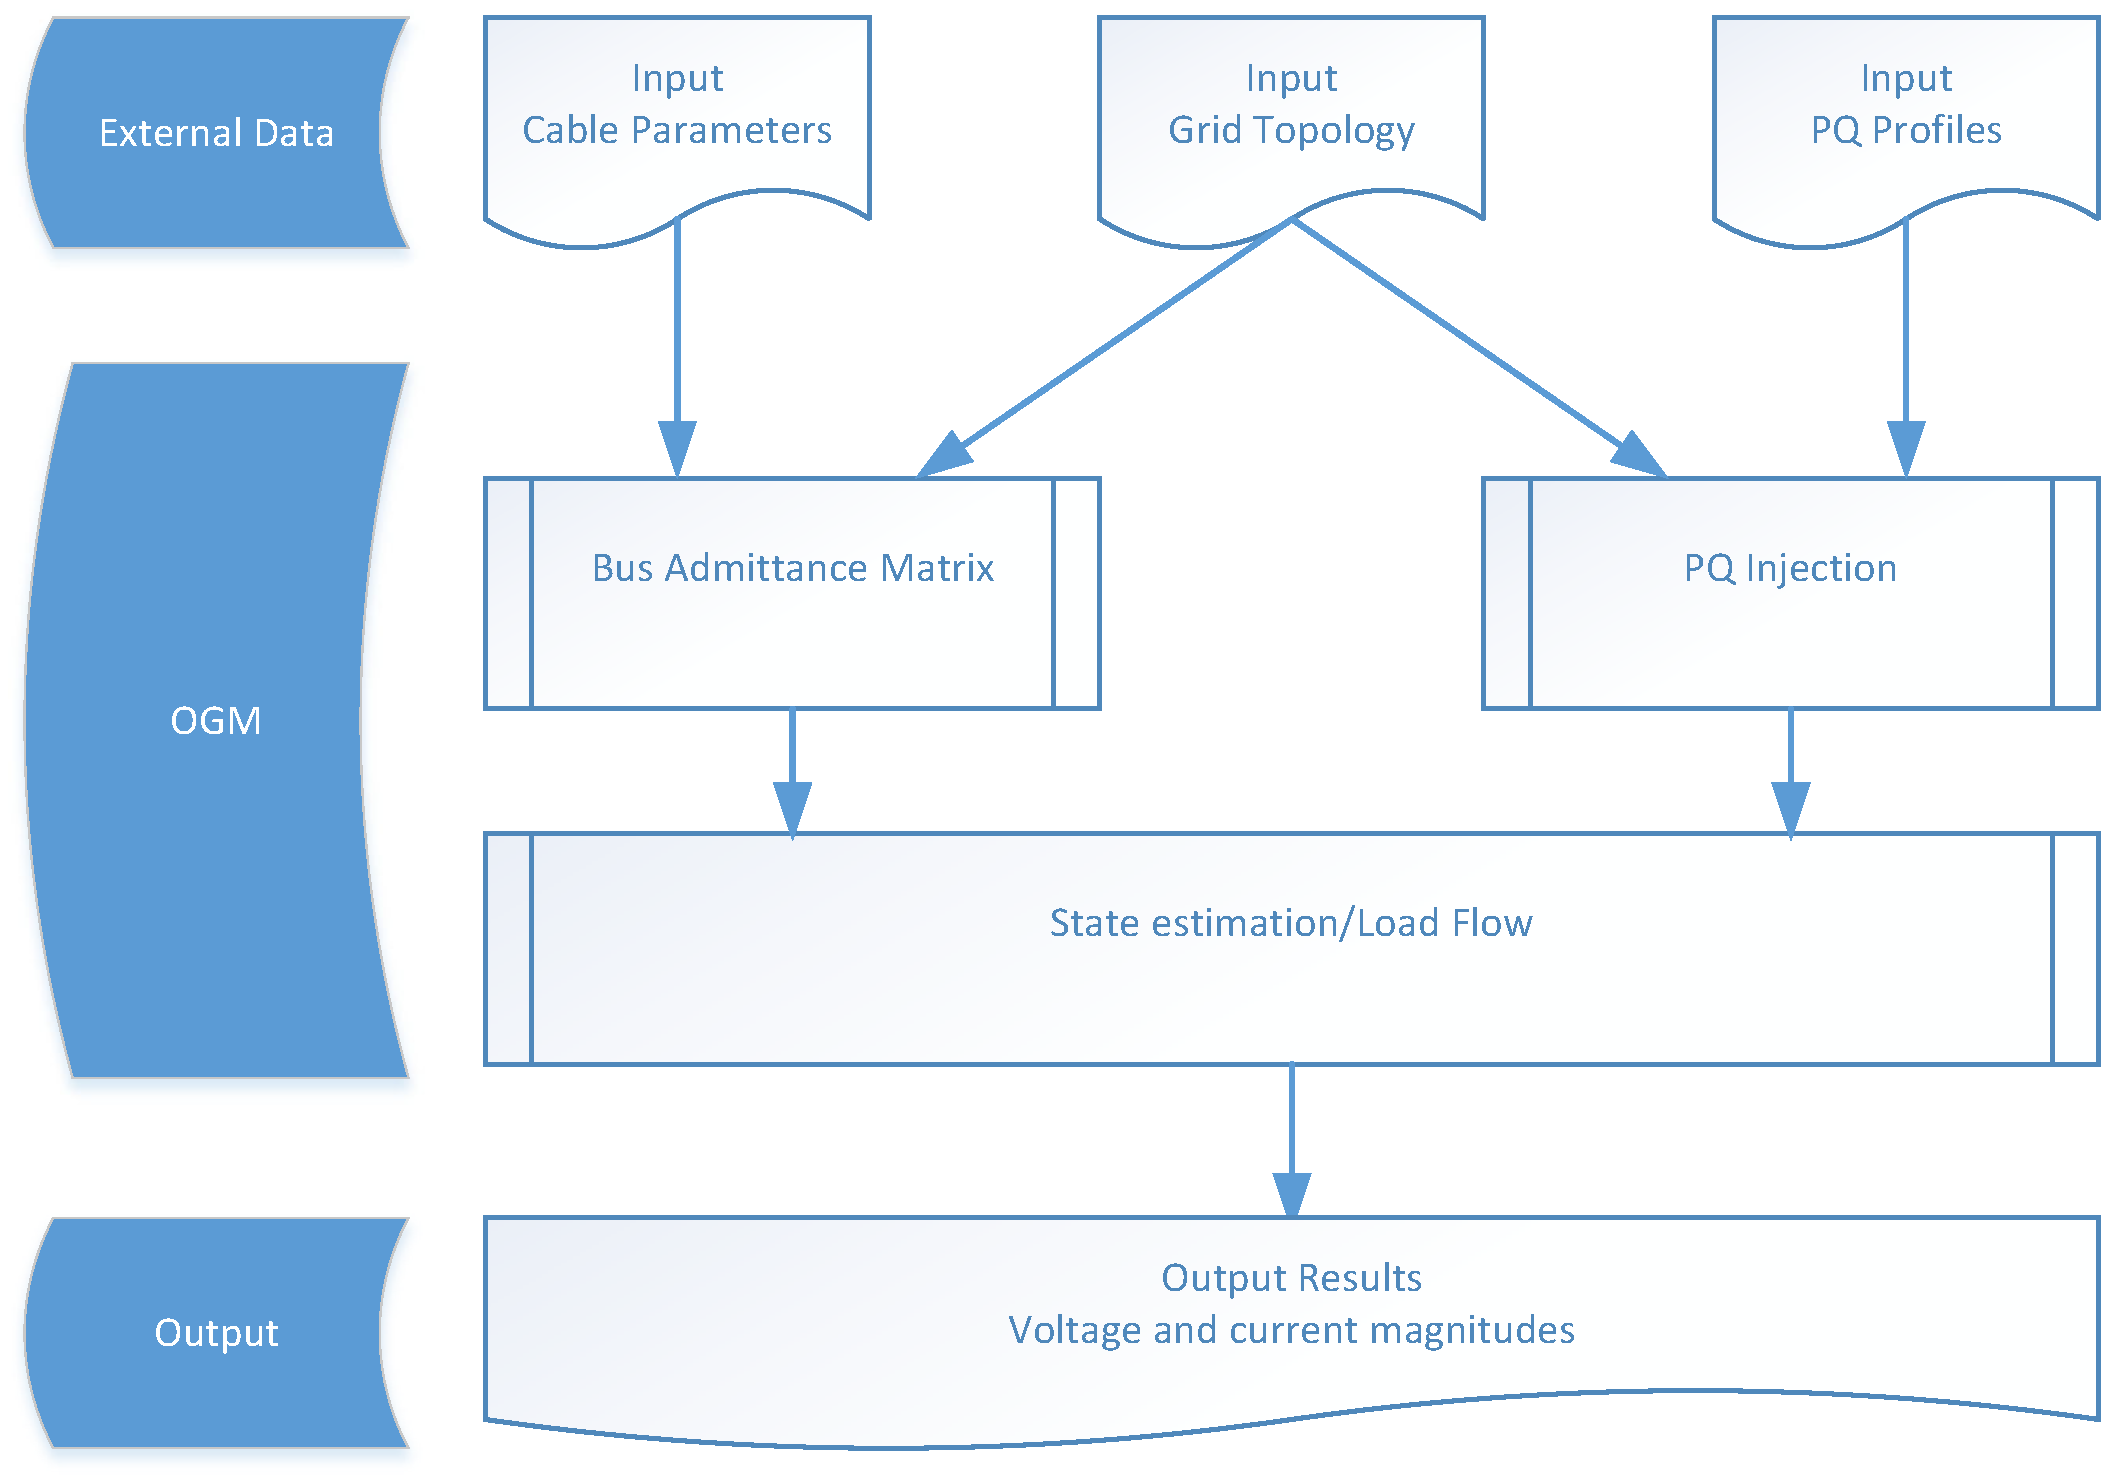
Observability Grid Model
- The bus admittance matrix is obtained from the distribution grid topology and the cable parameters (series resistance and reactance and shunt capacitance);
- Measured voltage values V at time t of the transformer (lumped value over phases); and
- Measured active P and reactive Q power values at time t of all customer connection boxes (sum over phases).
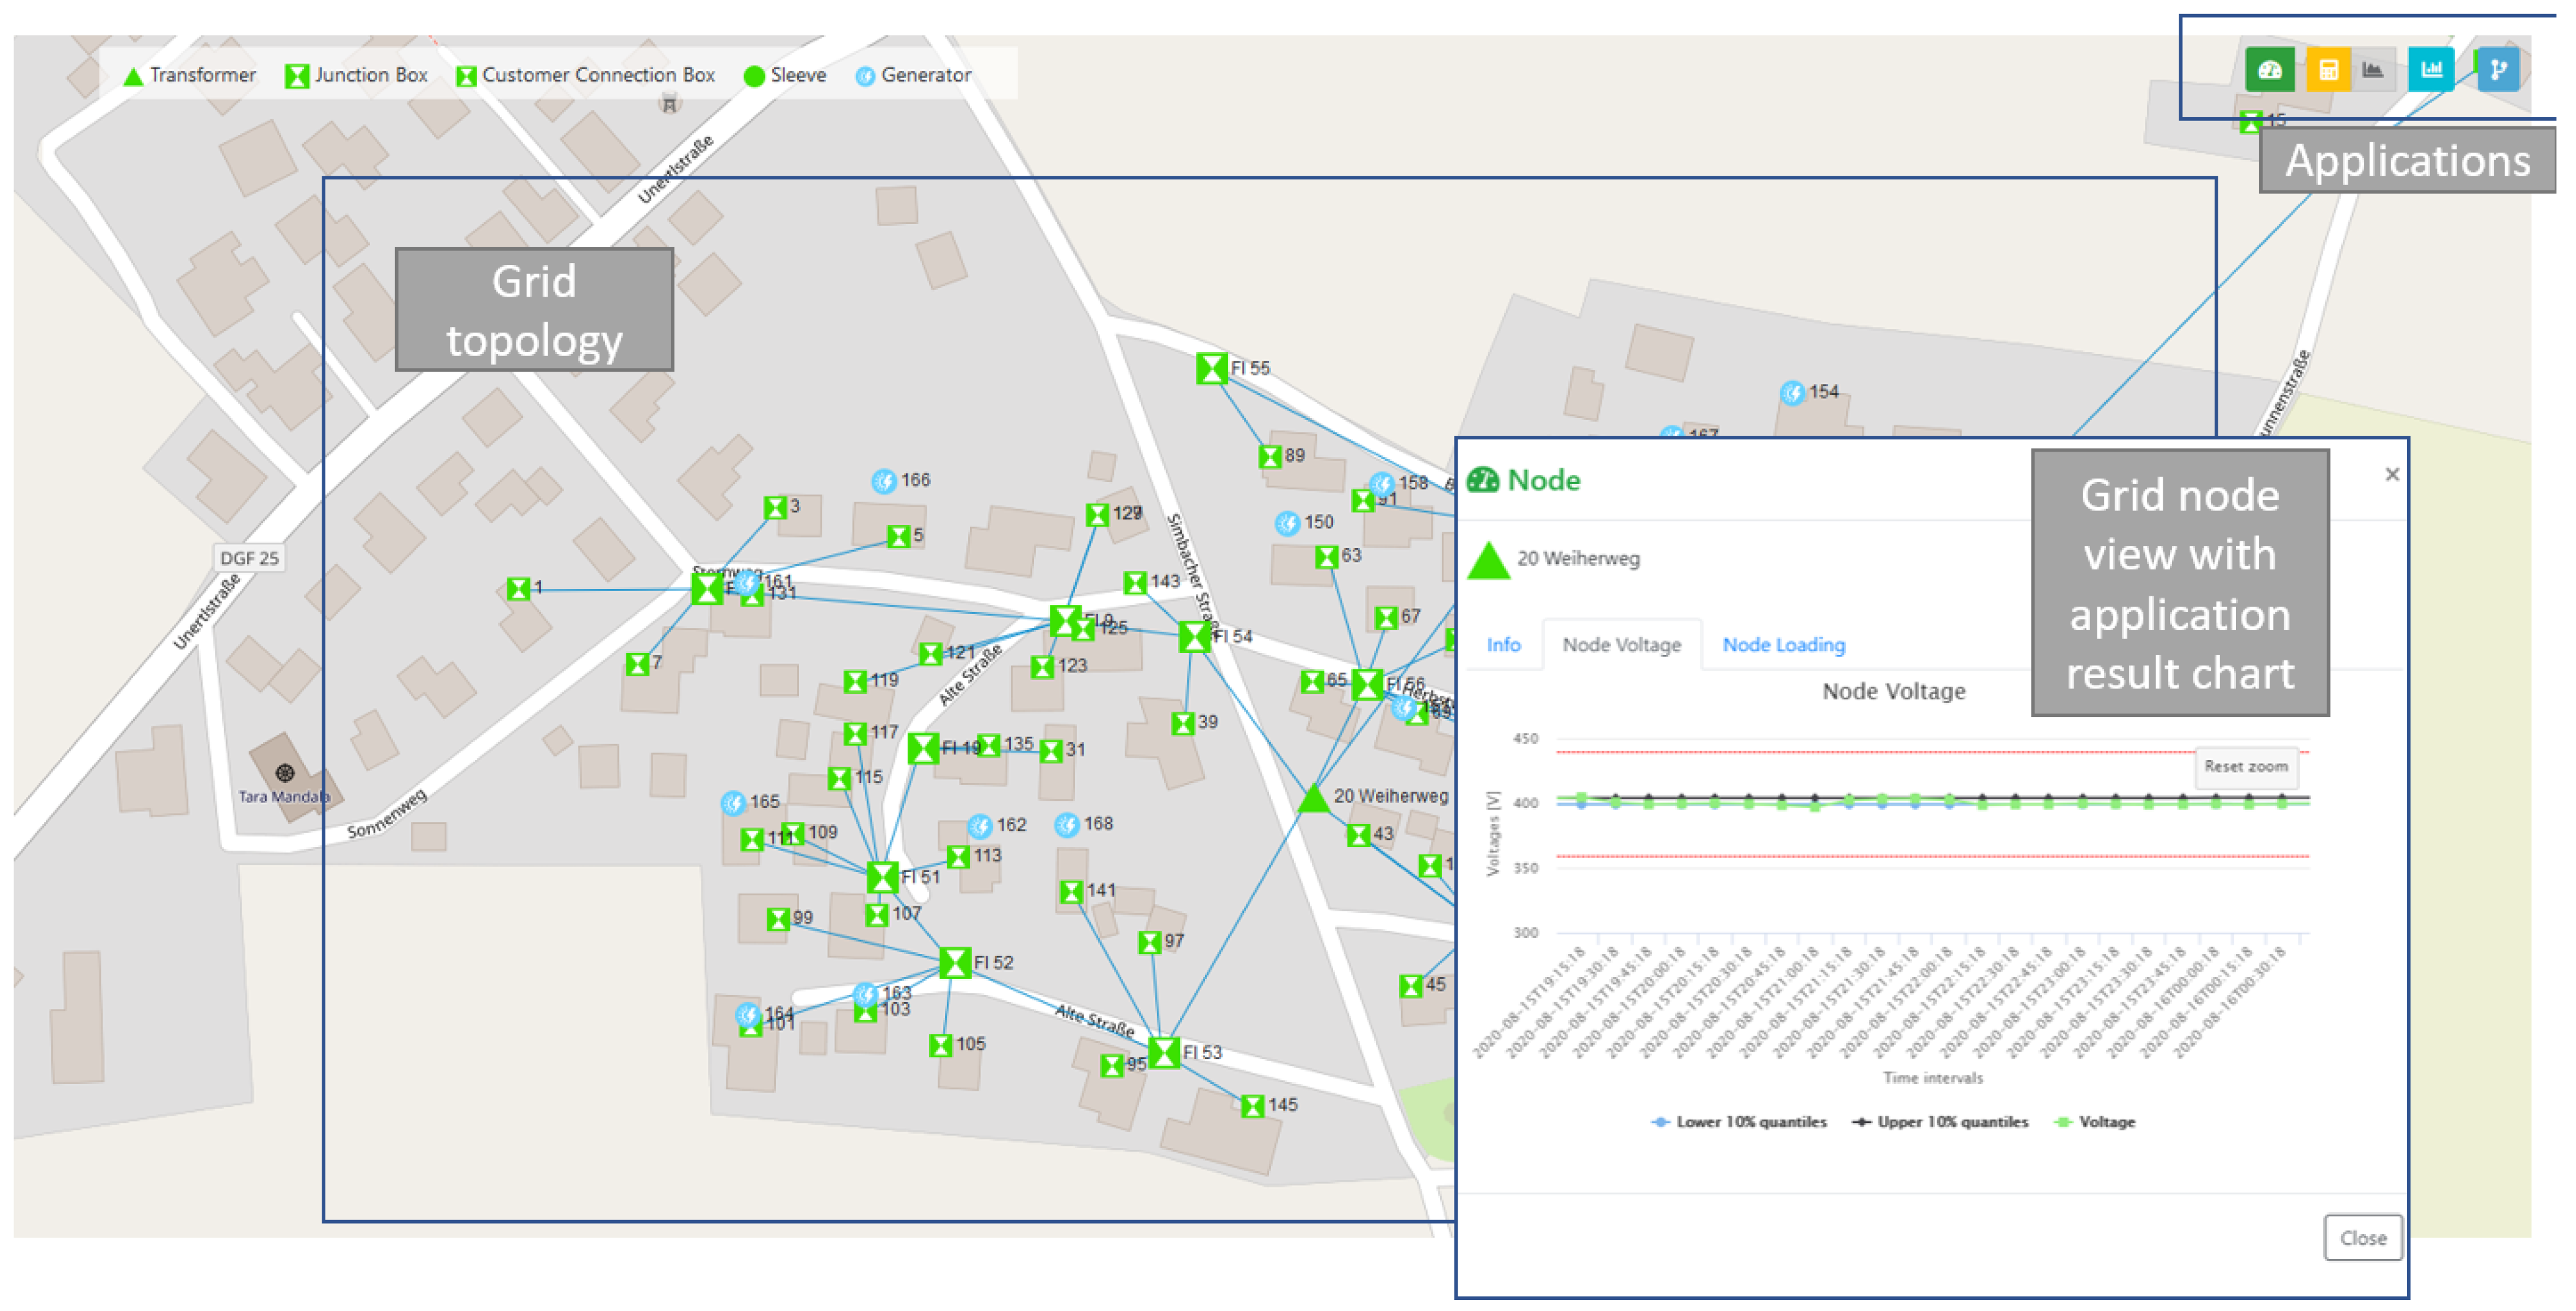
2.4. GUI as a Visualization Tool
3. Overview of Grid Observability Applications
3.1. Grid Monitoring Application
- The average voltages over the full time interval ;
- The time stamps where the average voltages exceed the configurable threshold; and
- The evolution over of the 95% and 5% quantiles of the average voltages over a one-week sliding window [15].
3.2. Loss Calculation
- Active and reactive powers at the substation transformer;
- Absolute and relative, active and reactive power total loss in the grid.
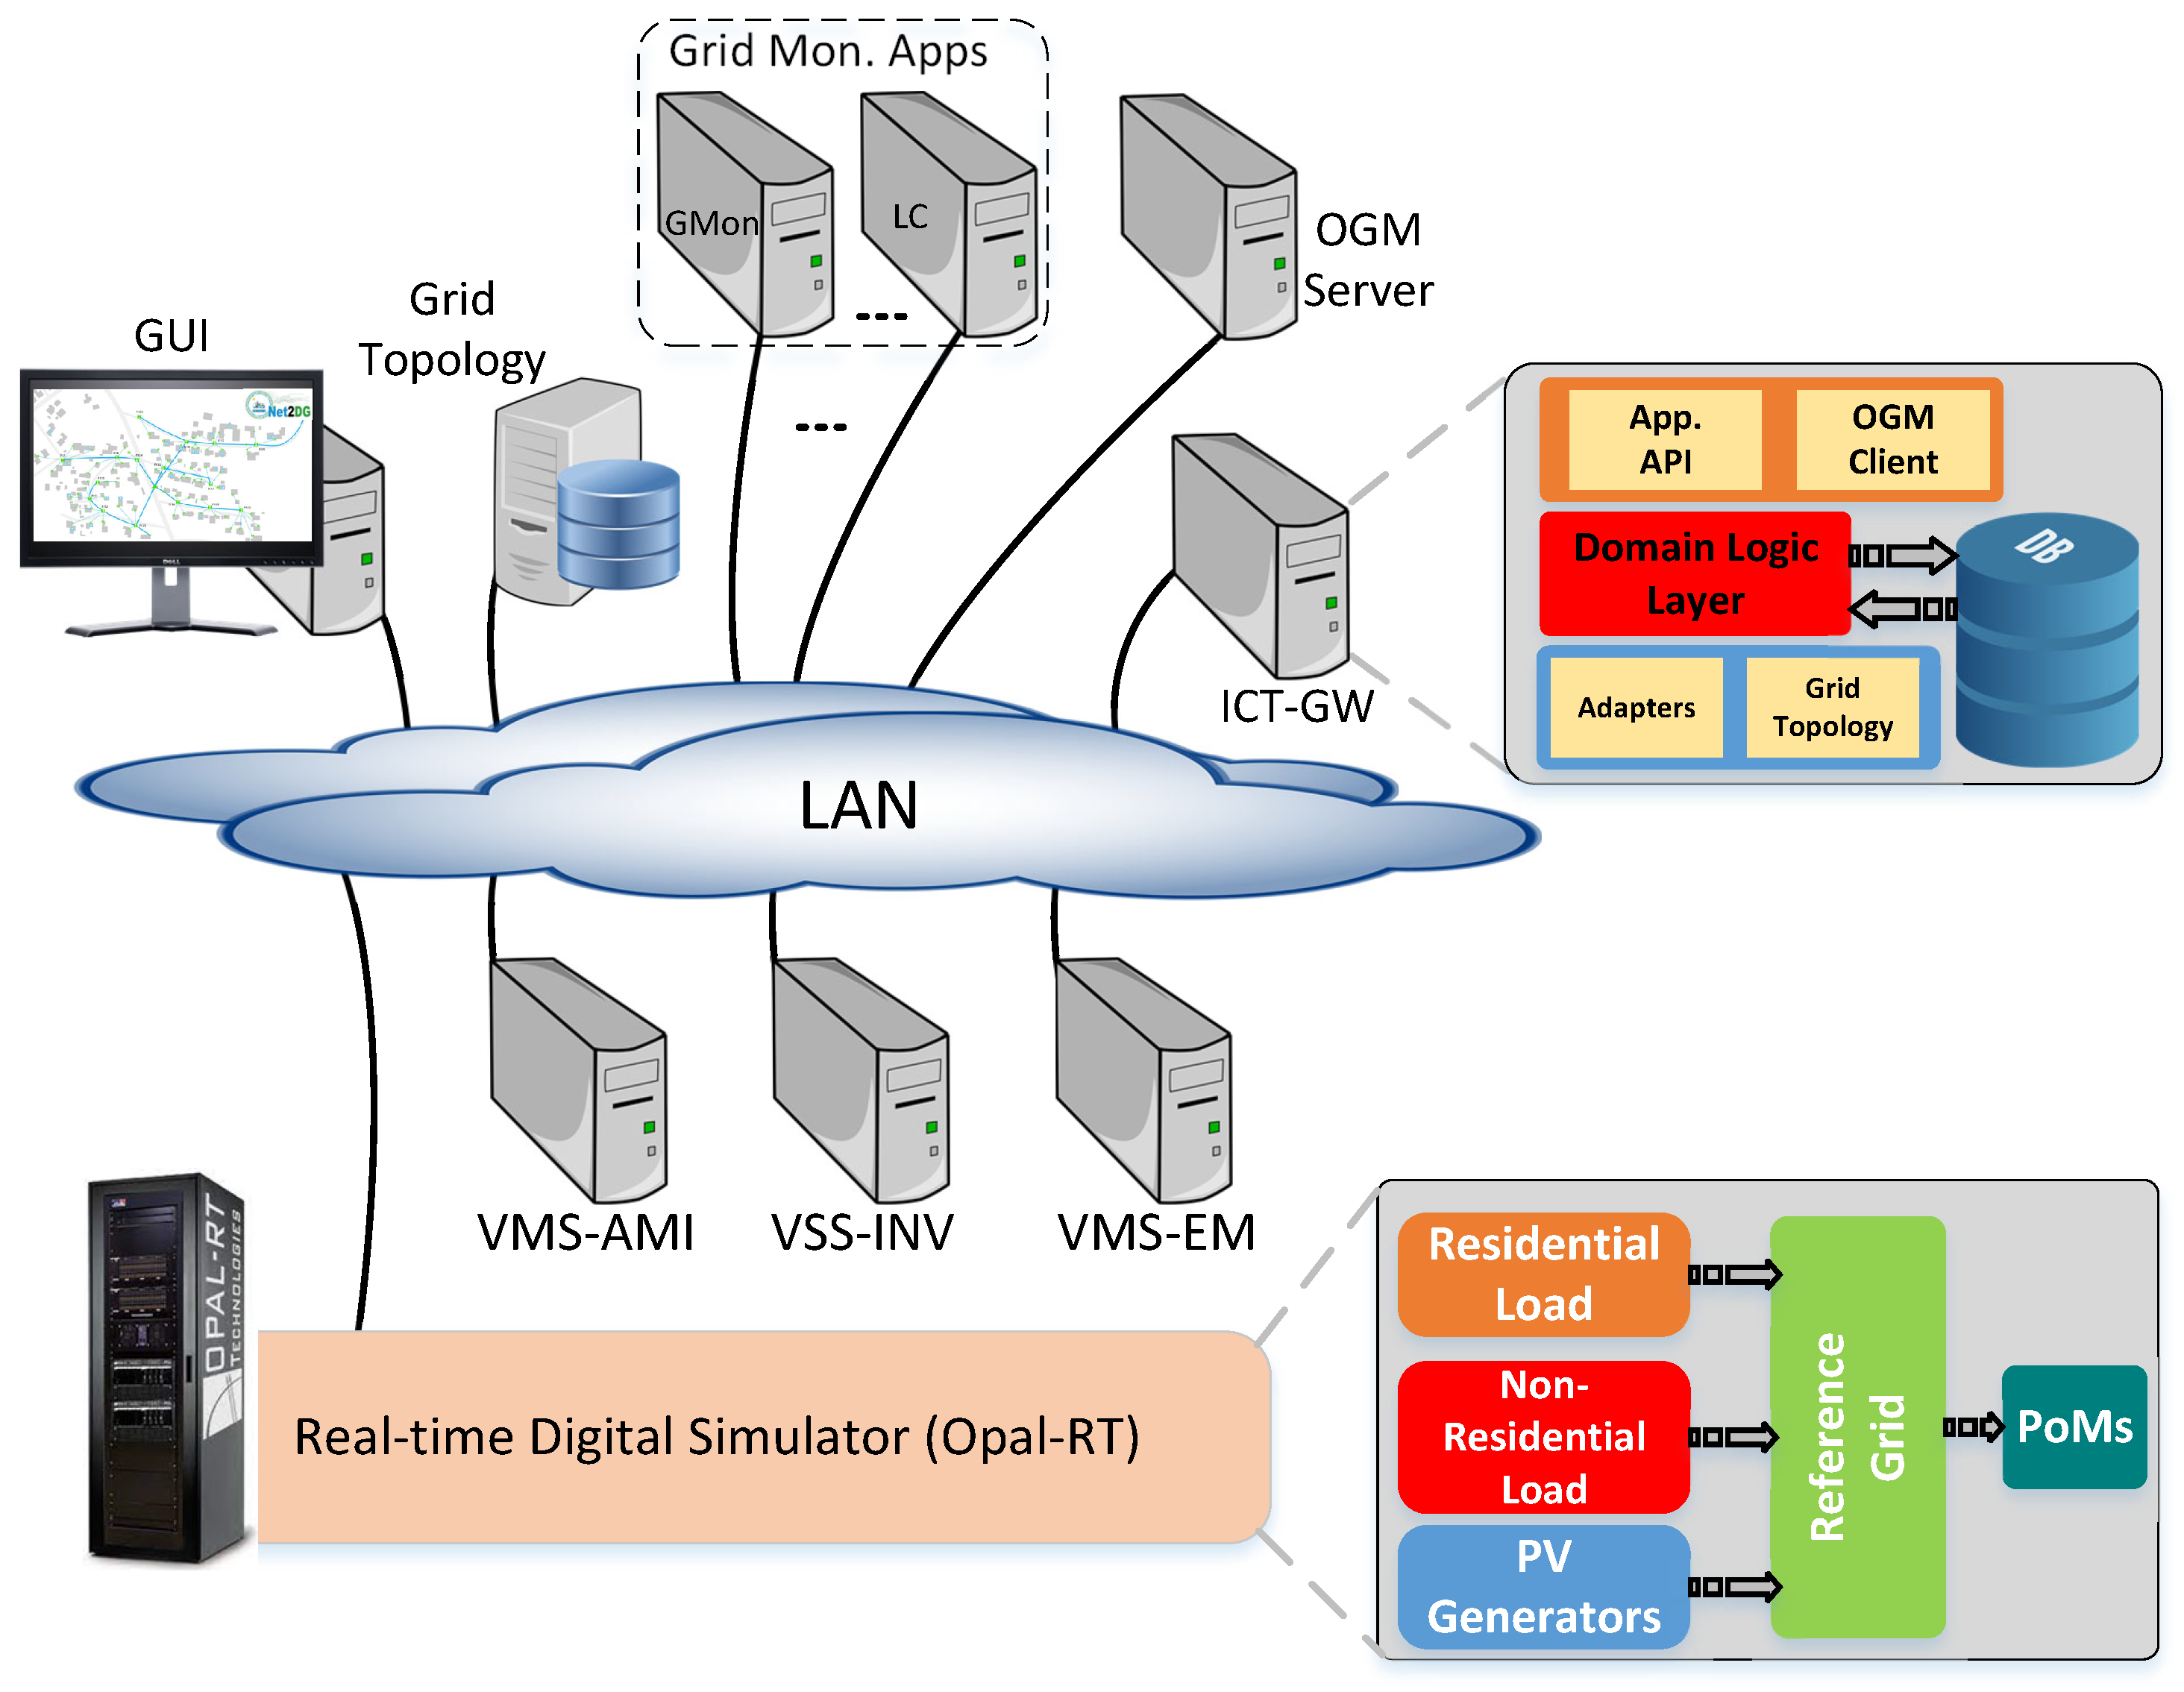
4. Experimental Setup for Validation
4.1. Description of RT-HIL in the Context of App Validation
4.2. Summary of Hardware/Software Platforms
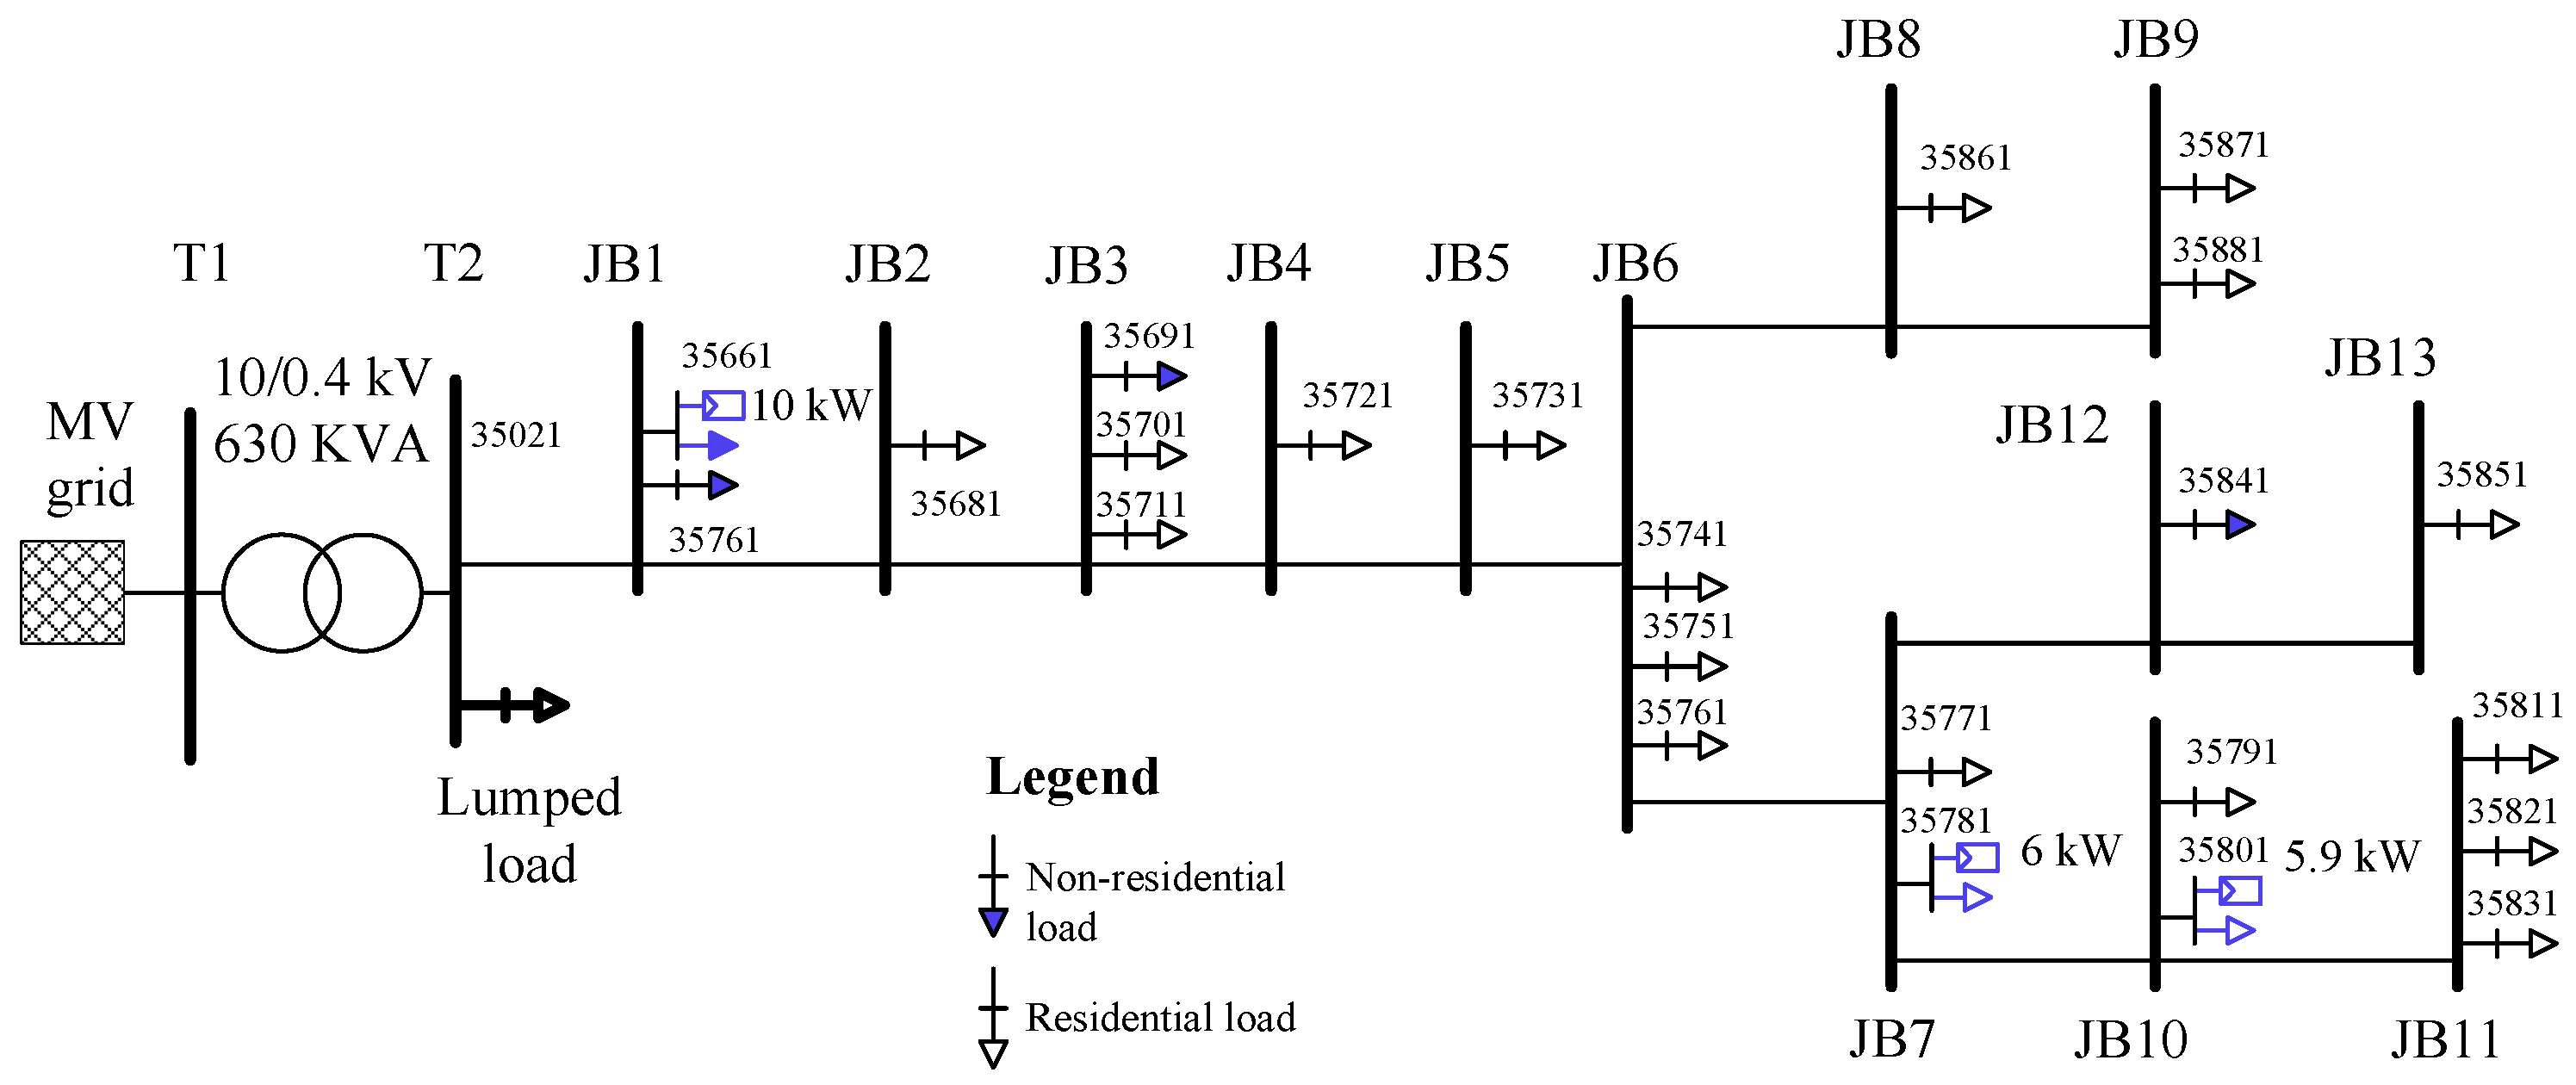
4.3. Description of the LV Distribution Network
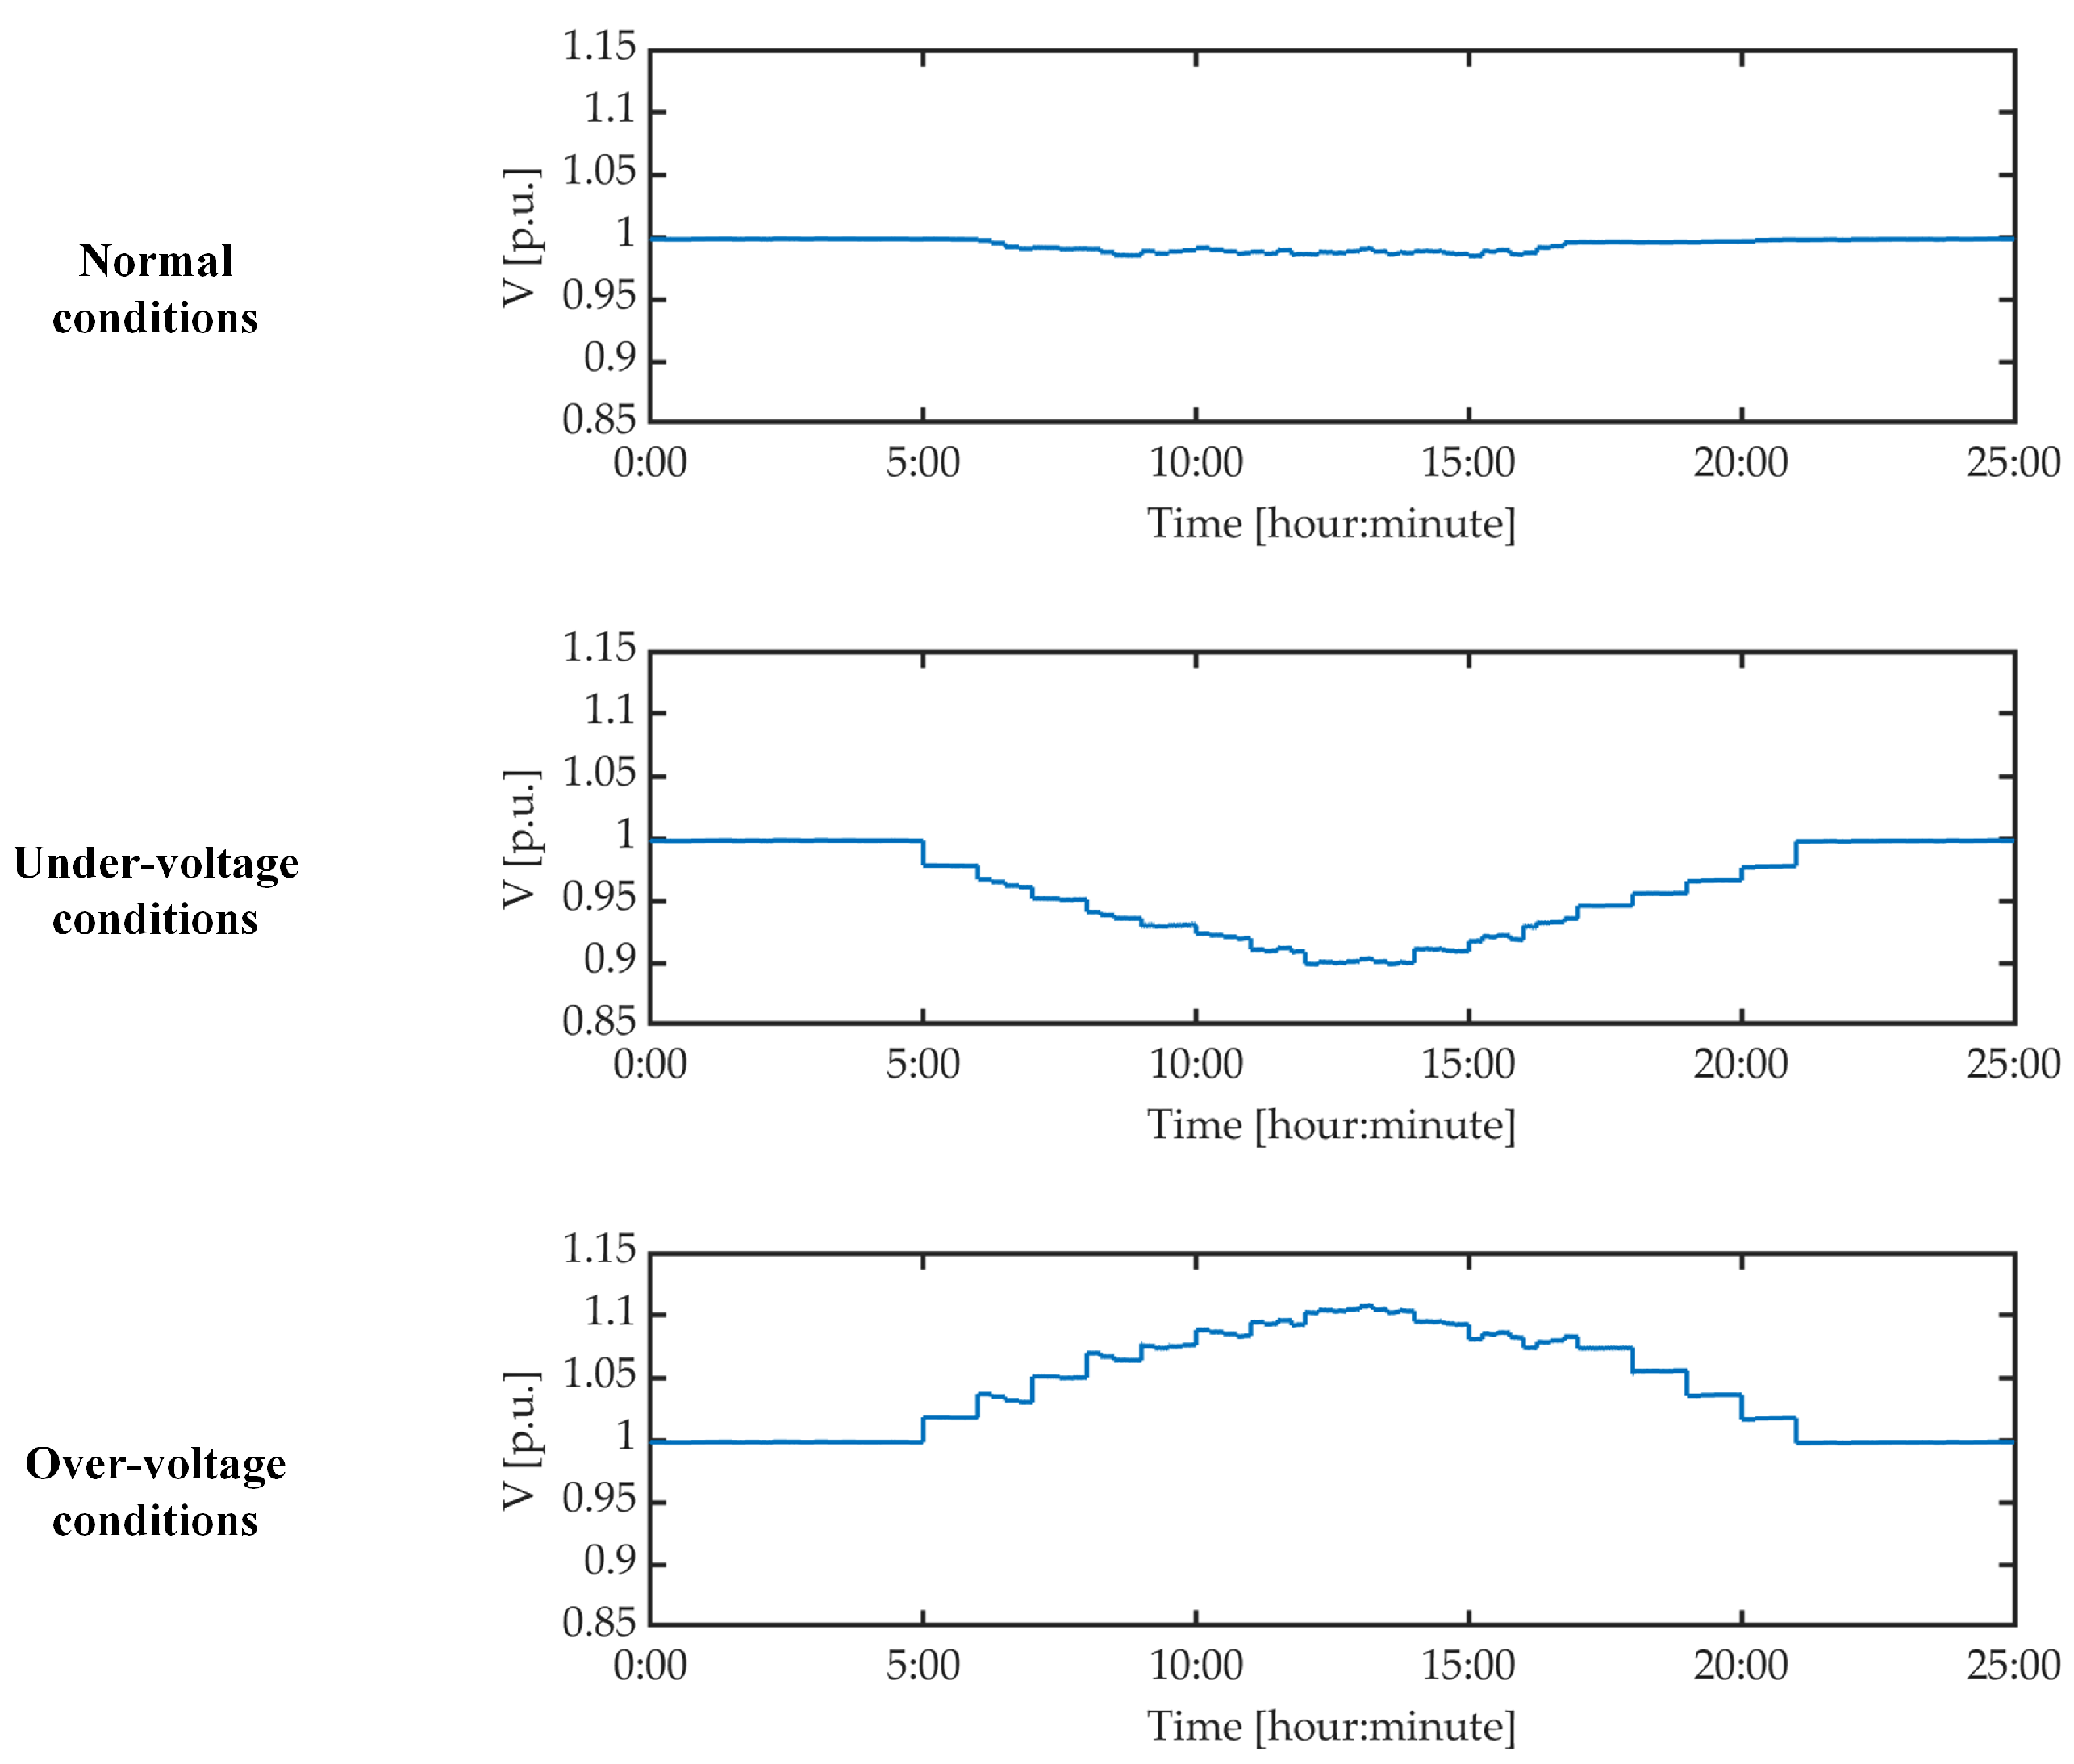
4.4. Use Cases
- Normal conditions, for which the grid voltages at all smart meters of the LV distribution grid are within the normal limits, that is, the 0.9 p.u. to 1.1 p.u. interval;
- Under-voltage conditions, for which the grid voltages at some smart meters fall below the 0.9 p.u. limit; and
- Over-voltage conditions, for which the grid voltages at some smart meters exceed the 1.1 p.u. limit.
5. OPAL-RT Lab Validation of GMon Application
5.1. Grid Monitoring Application—Correctness
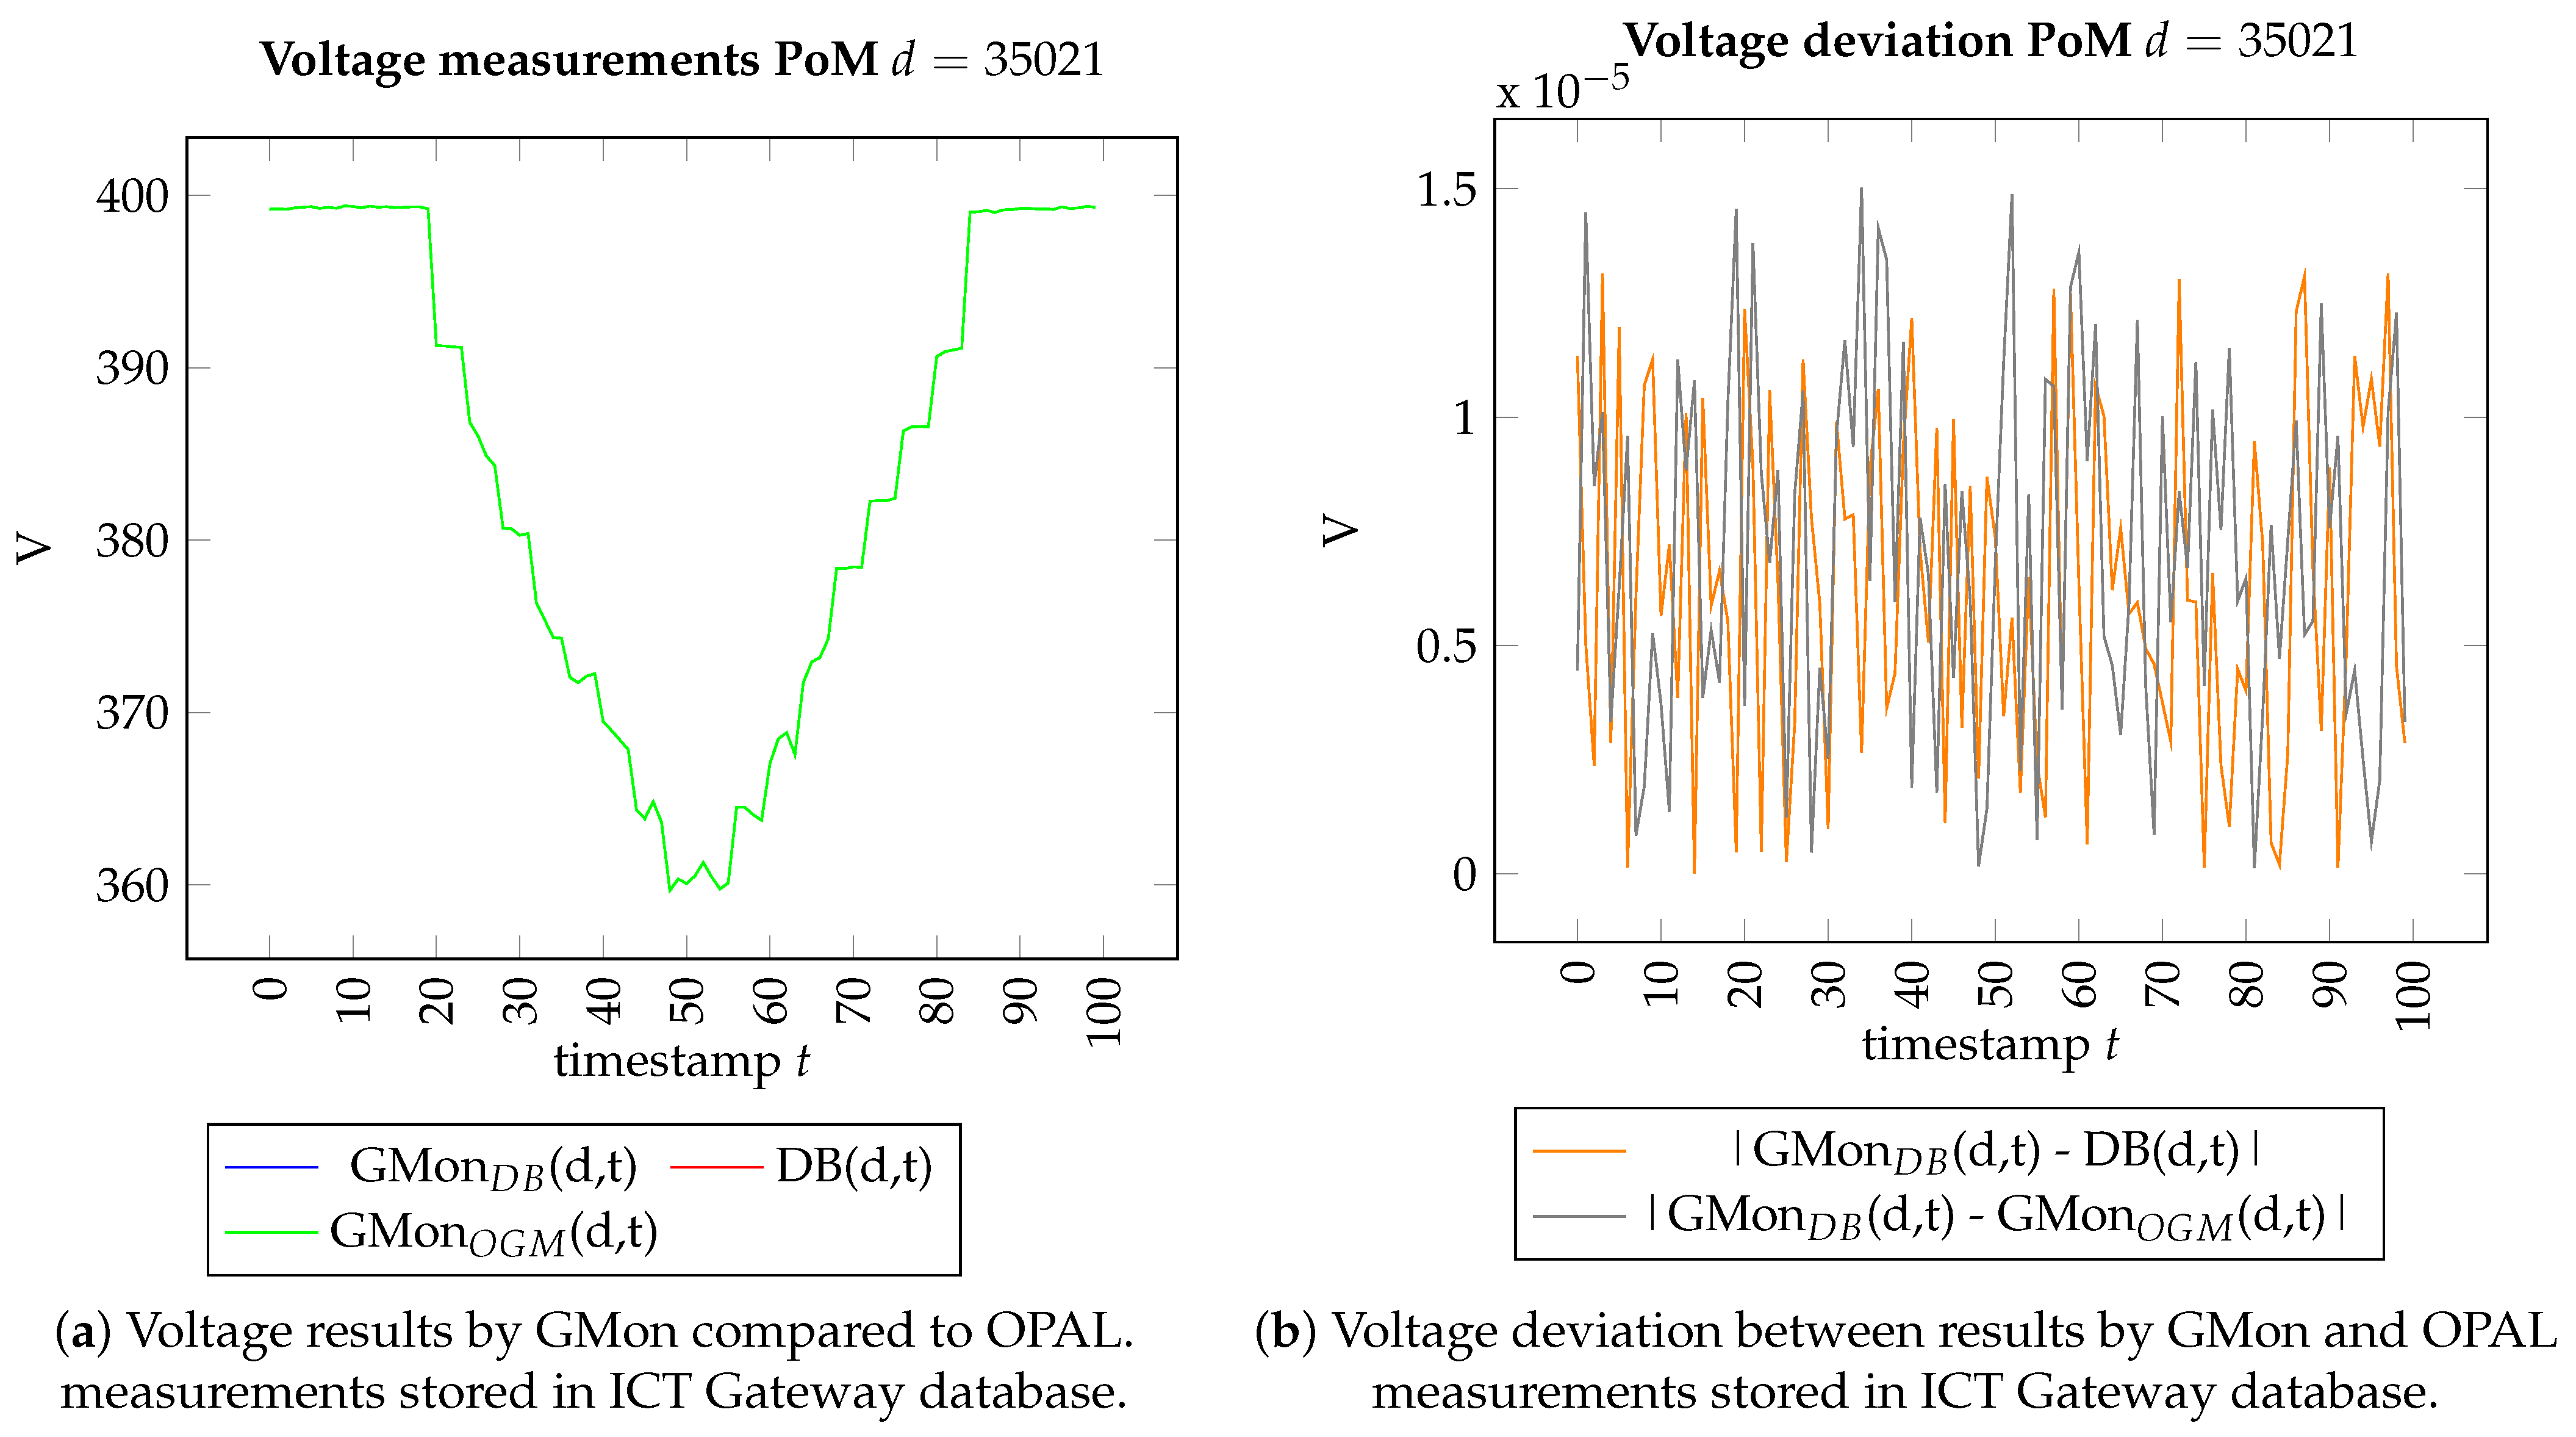
5.1.1. Methodology
5.1.2. Results
5.2. Grid Monitoring Application Using OGM—Correctness
5.2.1. Methodology
5.2.2. Results
5.3. Summary
5.4. Loss Calculation Application Using OGM—Correctness
5.5. Results
6. Field Trials of Observability Applications
6.1. Description of the Danish Field Trial
6.2. Grid Monitoring Application
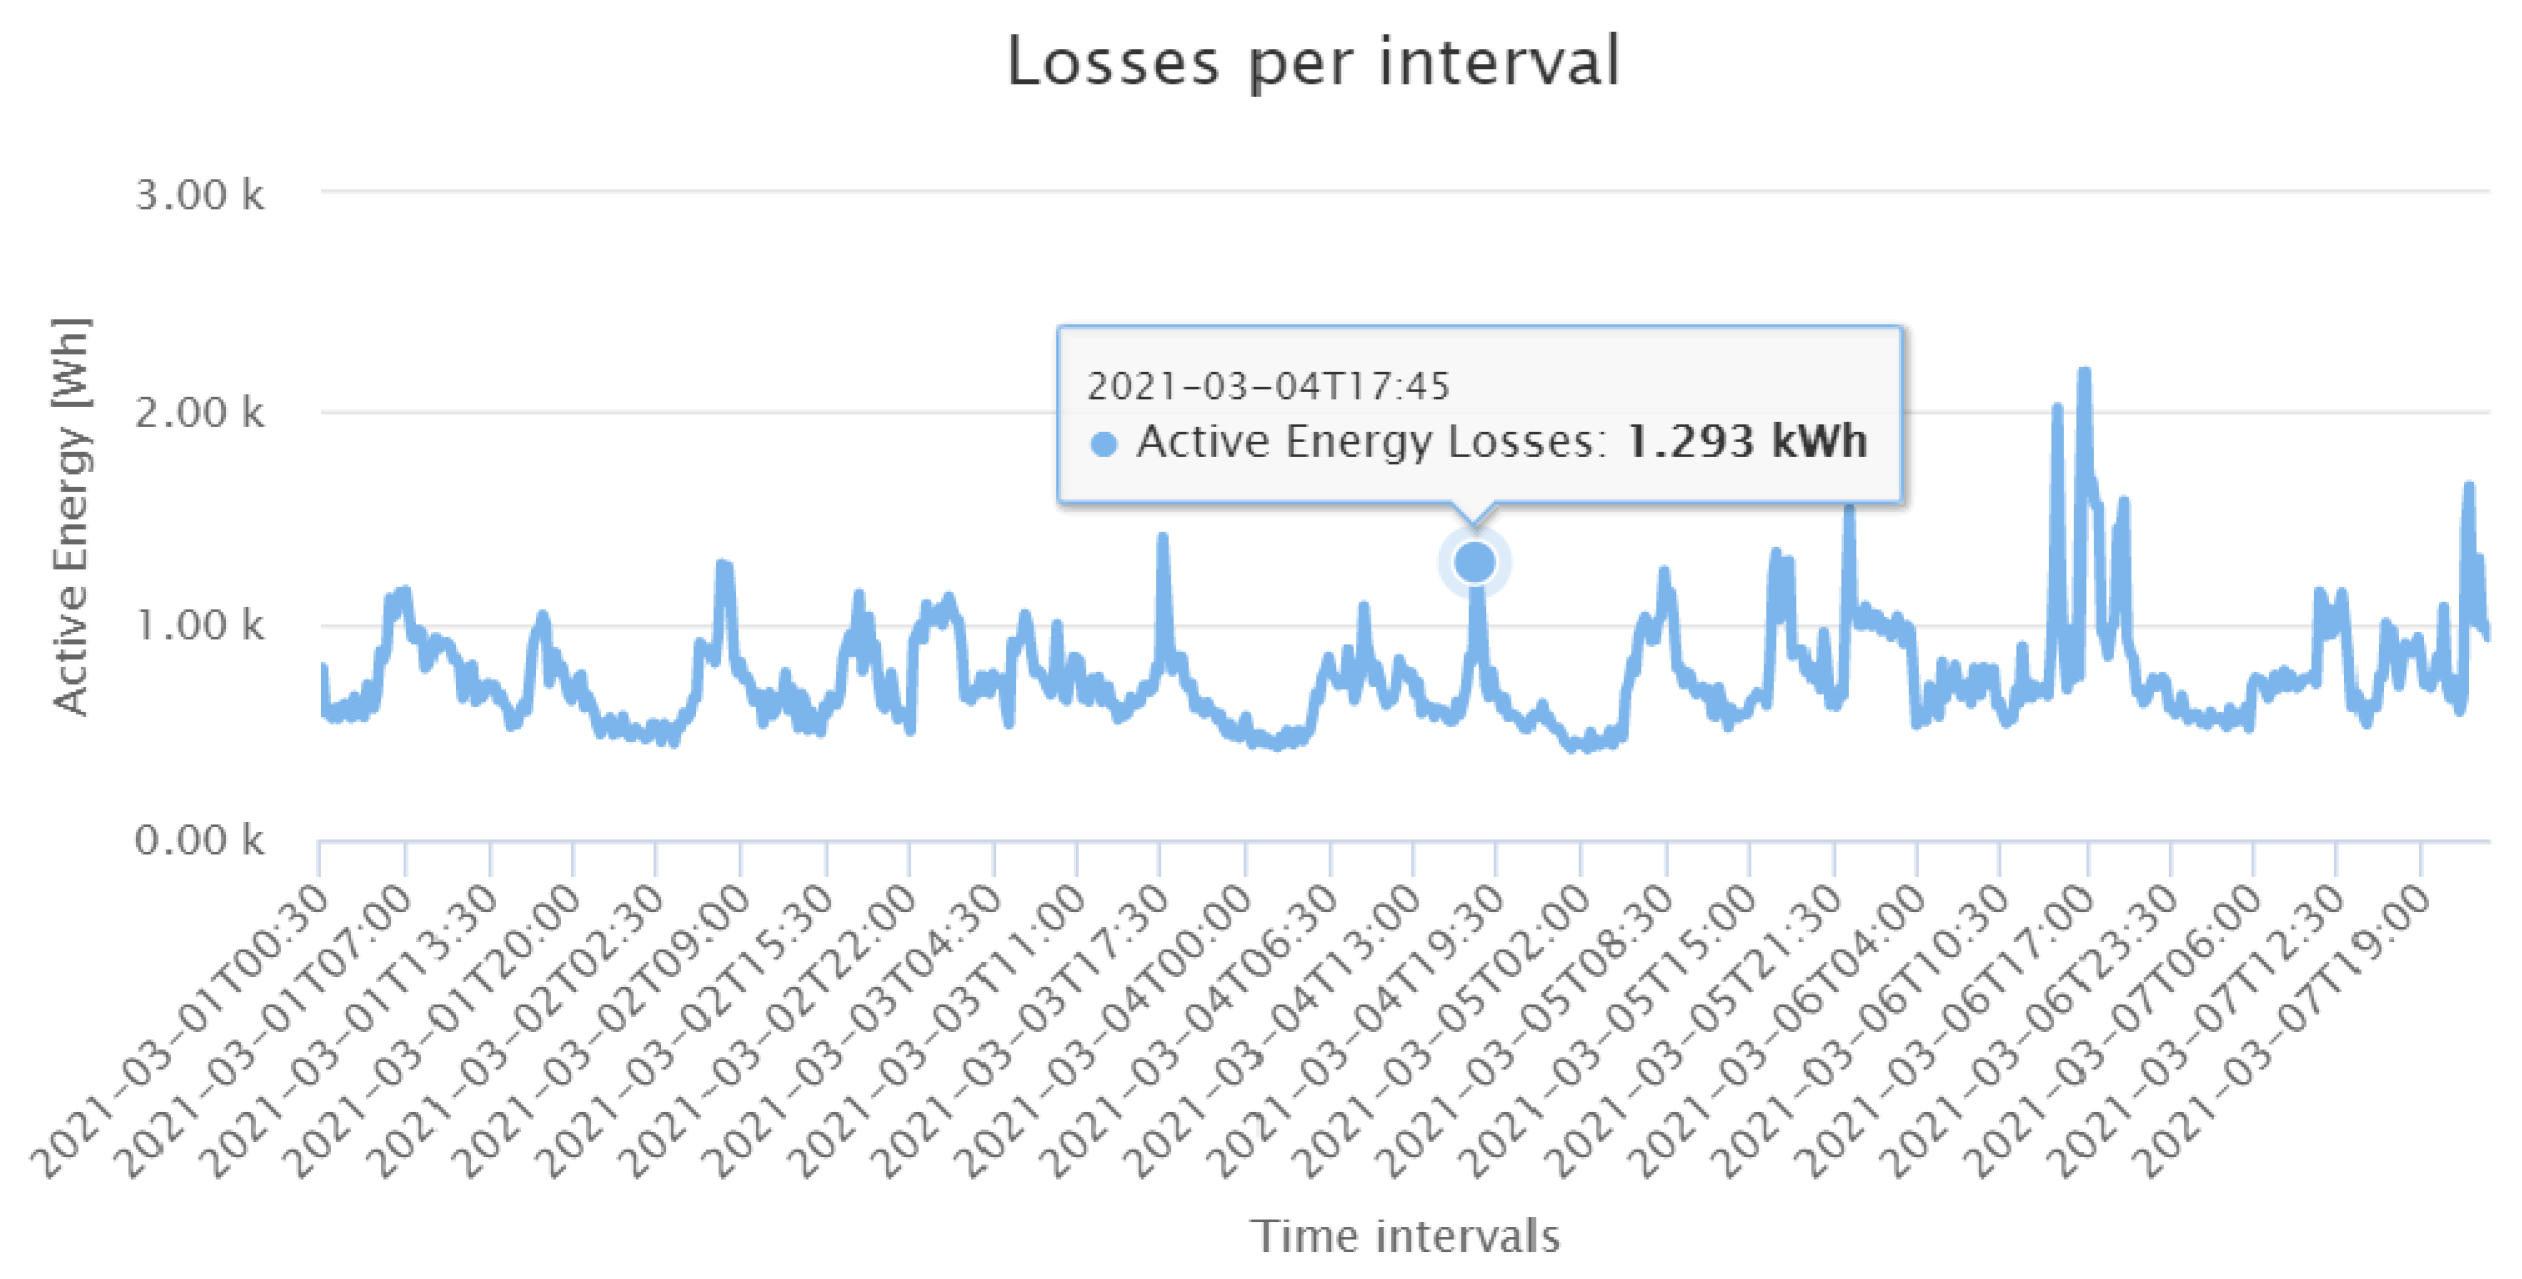
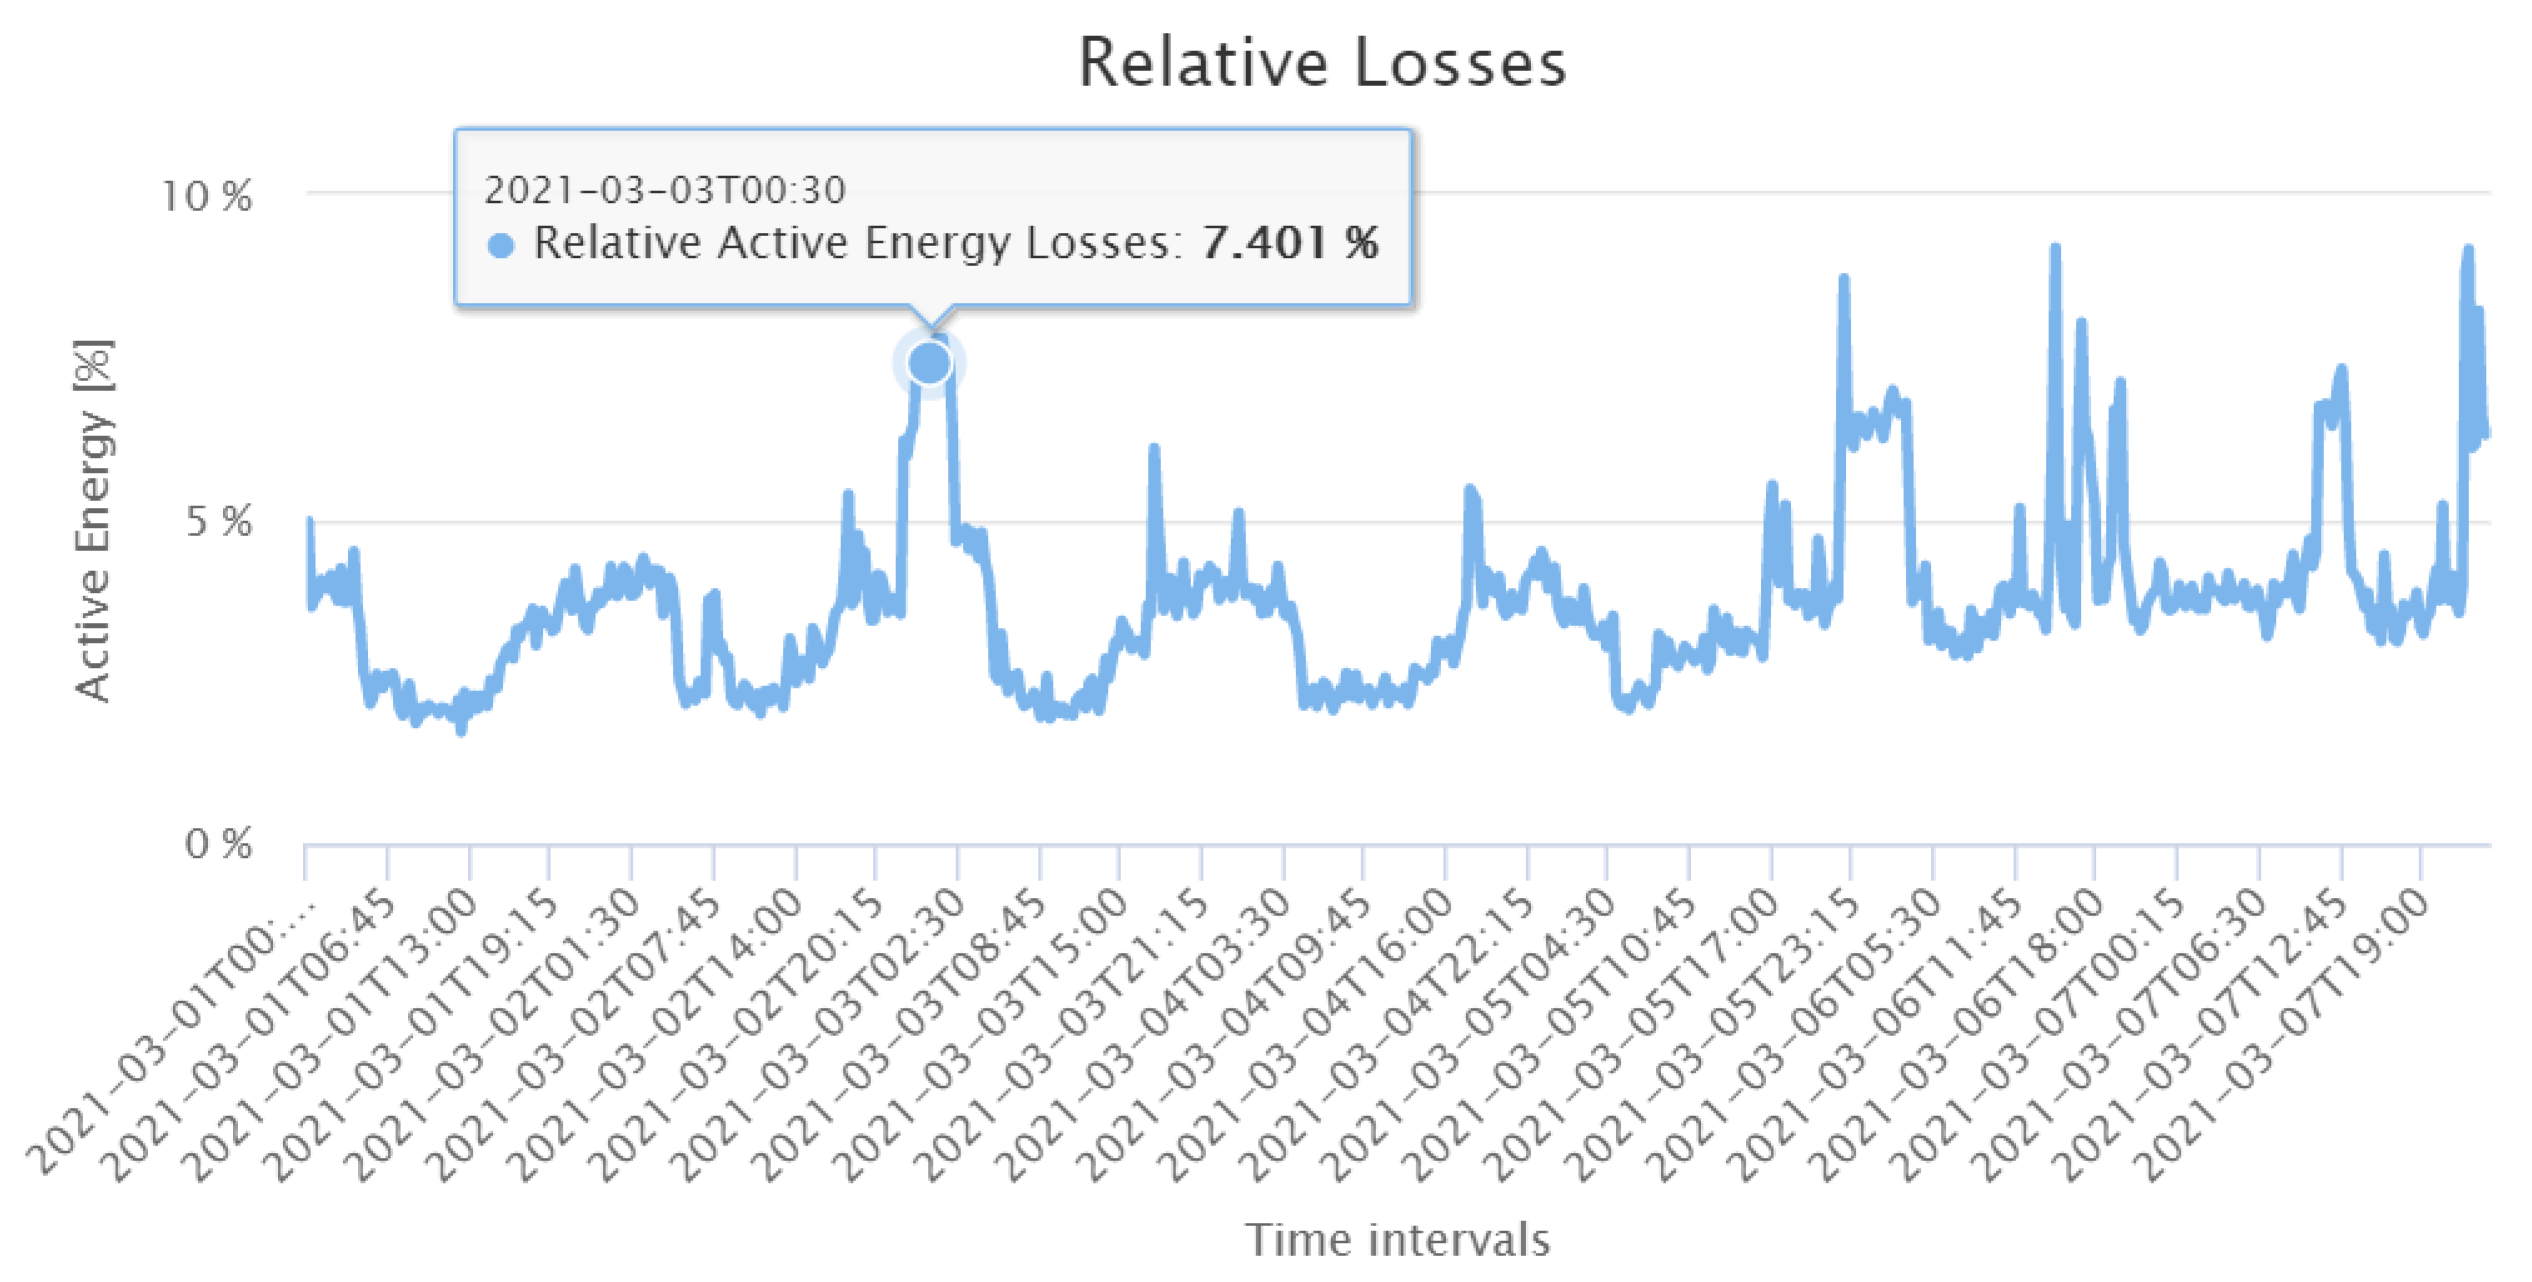
6.3. Loss Calculation
7. Conclusions
Author Contributions
Funding
Acknowledgments
Conflicts of Interest
Abbreviations
| AMI | Advanced Metering Infrastructure |
| CIM | Common Information Model |
| DSO | Distribution system operator |
| DSSE | Distribution system state estimation |
| EM | Electrical Measurements |
| GIS | Geographical Information System |
| GMON | Grid Monitoring application |
| GUI | Graphical User Interface |
| HIL | Hardware in the loop |
| ICT | Information and communication technologies |
| INV | Inverter |
| ICGW | ICT Gateway |
| LC | Loss Calculation application |
| LV | Low Voltage |
| LAN | Local Access Network |
| MV | Medium Voltage |
| MAE | Mean Absolute Error |
| OGM | Observability Grid Model |
| PAE | Percentage Absolute Error |
| PMU | Phasor Measurement Unit |
| PV | Photo Voltaic |
| PQ | Active and Reactive Power |
| RES | Renewable Energy Sources |
| RTU | Remote Terminal Unit |
| VMS | Virtual Measurement Subsystem |
| VMS-AMI | VMS for AMI |
| VSS | Virtual Subsystem |
| VSS-INV | VSS for PV grid Inverters |
References
- McDonald, J. Adaptive intelligent power systems: Active distribution networks. Energy Policy 2008, 36, 4346–4351. [Google Scholar] [CrossRef]
- Repo, S.; Lu, S.; Pöhö, T.; Giustina, D.D.; Ravera, G.; Selga, J.M.; Figuerola, F.A.C. Active distribution network concept for distributed management of low voltage network. IEEE PES ISGT Eur. 2013, 2013, 1–5. [Google Scholar] [CrossRef]
- Haque, A.; Nguyen, P.; Kling, W.; Bliek, F. Congestion management in smart distribution network. In Proceedings of the 2014 49th International Universities Power Engineering Conference, Cluj-Napoca, Romania, 2–5 September 2014. [Google Scholar] [CrossRef]
- Schwefel, H.P.; Silva, N.; Bendtsen, J.D.; Olsen, R.L.; Iov, F.; Andersen, K.; Kristensen, R.; Lyhne, M.; Pedersen, E.B.; Ostner, S.; et al. Net2DG Deliverable D1.1—Case Study Specifications & Application Requirements. Available online: http://www.net2dg.eu/1c254772_52ed_4f92_991a_9502725a16af.html (accessed on 26 August 2021).
- Schwefel, H.P.; Silva, N.; Bendtsen, J.D.; Olsen, R.L.; Iov, F.; Andersen, K.; Kristensen, R.; Lyhne, M.; Pedersen, E.B.; Ostner, S.; et al. Net2DG Deliverable D1.2—Initial Baseline Architecture. Available online: http://www.net2dg.eu/1c254772_52ed_4f92_991a_9502725a16af.html (accessed on 26 August 2021).
- Hu, Z.; Li, F. Cost-benefit analyses of active distribution network management, Part I: Annual benefit analysis. IEEE Trans. Smart Grid 2012, 3, 1067–1074. [Google Scholar] [CrossRef]
- Hu, Z.; Li, F. Cost-benefit analyses of active distribution network management, Part II: Investment reduction analysis. IEEE Trans. Smart Grid 2012, 3, 1075–1081. [Google Scholar] [CrossRef]
- Morales, J.; Conejo, A.; Madsen, H.; Pinson, P.; Zugno, M. Integrating Renewables in Electricity Markets; Springer Science & Business Media: New York, NY, USA, 2014. [Google Scholar] [CrossRef]
- Wang, J.; Zong, Y.; You, S.; Træholt, C. A review of Danish integrated multi-energy system flexibility options for high wind power penetration. Clean Energy 2017, 1, 23–35. [Google Scholar] [CrossRef] [Green Version]
- Danish Energy Agency. Denmark’s Energy and Climate Outlook 2019—Baseline Scenario Projection Towards 2030 with Existing Measures (Frozen Policy); Danish Energy Agency: København, Denmark, 2019.
- Tornbjerg, J. Smart Distribution Grids Power Europe’s Transition to Green Energy; Danish Energy Association and State of Green: København, Denmark, 2017. [Google Scholar]
- Ahmad, F.; Rasool, A.; Ozsoy, E.; Sekar, R.; Sabanovic, A.; Elitaş, M. Distribution system state estimation—A step towards smart grid. Renew. Sustain. Energy Rev. 2018, 81, 2659–2671. [Google Scholar] [CrossRef] [Green Version]
- CIRED. Reduction of technical and non-technical losses in distribution networks. Int. Conf. Electr. Distrib. 2017. Available online: http://cired.net/cired-working-groups/technical-and-non-technical-losses (accessed on 26 August 2021).
- Persson, M.; Lindskog, A. Detection and localization of non-technical losses in distribution systems with future smart meters. In Proceedings of the 2019 IEEE Milan PowerTech, PowerTech 2019, Milan, Italy, 23–27 June 2019. [Google Scholar] [CrossRef]
- EN50160. Voltage Characteristics of Electricity Supplied by Public Distribution Systems; CENELEC: Brussels, Belgium, 2010. [Google Scholar]
- Counet, J. Over 70% European Consumers to Have a Smart Meter for Electricity by 2020. Available online: https://ec.europa.eu/jrc/en/news/over-70-percent-european-consumers-have-smart-meter-electricity-2020 (accessed on 26 August 2021).
- Shahid, K.; Schiavone, E.; Drenjanac, D.; Bæklund, R.P.; Olsen, R.L.; Schwefel, H. Extraction of CIM-Based Distribution Grid Topology Information for Observability. In Proceedings of the 2019 15th European Dependable Computing Conference (EDCC), Naples, Italy, 17–20 September 2019; pp. 165–170. [Google Scholar]
- Shahid, K.; Schiavone, E.; Drenjanac, D.; Lyhne, M.; Olsen, R.L.; Schwefel, H. Handling Incomplete and Erroneous Grid Topology Information for Low Voltage Grid Observability. In Proceedings of the 2019 IEEE International Conference on Communications, Control, and Computing Technologies for Smart Grids (SmartGridComm), Beijing, China, 21–23 October 2019; pp. 1–6. [Google Scholar]
- Martin-Loeches, R.; Pombo, D.; Iov, F.; Kemal, M.; Olsen, R. Enabling Smart Grid Features by Enhanced Utilization of Actual Advanced Metering Infrastructure. In Proceedings of the 25th International Conference on Electricity Distribution, CIRED 2019, AIM—Electrical Engineers Association of the Montefiore Institute, 2019, International Conference and Exhibition on Electricity Distribution, CIRED, Madrid, Spain, 3–6 June 2019. [Google Scholar]
- Iov, F.; Ciontea, C.I.; Olsen, R.L.; Shahid, K.; Schwefel, H.P.; Silva, N.; Mercep, I.; Drenjanac, D.; Nostro, N.; Enrico, S.; et al. Net2DG Deliverable D5.1—First Integrated Deployment at Lab and Test Bed. Available online: http://www.net2dg.eu/1c254772_52ed_4f92_991a_9502725a16af.html (accessed on 26 August 2021).
- Iov, F.; Ciontea, C.I.; Olsen, R.L.; Shahid, K.; Gui, Y.; Schäler, C.; Strasser, K.; Silva, N.; Nostro, N.; Enrico, S.; et al. Net2DG Deliverable D5.3—Final Consolidated Results. Available online: http://www.net2dg.eu/1c254772_52ed_4f92_991a_9502725a16af.html (accessed on 26 August 2021).
- Lu, S.; Repo, S.; Giustina, D.D.; Figuerola, F.A.C.; Löf, A.; Pikkarainen, M. Real-Time Low Voltage Network Monitoring—ICT Architecture and Field Test Experience. IEEE Trans. Smart Grid 2015, 6, 2002–2012. [Google Scholar] [CrossRef]
- Genge, B.; Haller, P.; Dumitru, C.; Enăchescu, C. Designing Optimal and Resilient Intrusion Detection Architectures for Smart Grids. IEEE Trans. Smart Grid 2017, 8, 2440–2451. [Google Scholar] [CrossRef]
- Kiani Bejestani, A.; Annaswamy, A.; Samad, T. A Hierarchical Transactive Control Architecture for Renewables Integration in Smart Grids: Analytical Modeling and Stability. IEEE Trans. Smart Grid 2014, 5, 2054–2065. [Google Scholar] [CrossRef]
- Costanzo, G.T.; Zhu, G.; Anjos, M.F.; Savard, G. A System Architecture for Autonomous Demand Side Load Management in Smart Buildings. IEEE Trans. Smart Grid 2012, 3, 2157–2165. [Google Scholar] [CrossRef]
- Ravikumar, G.; Ameme, D.; Misra, S.; Brahma, S.; Tourani, R. iCASM: An Information-Centric Network Architecture for Wide Area Measurement Systems. IEEE Trans. Smart Grid 2020, 11, 3418–3427. [Google Scholar] [CrossRef]
- Net2DG Home. Available online: http://www.net2dg.eu/ (accessed on 5 April 2019).
- Santodomingo, R.; Rohjans, S.; Uslar, M.; Rodríguez-Mondèjar, J.A.; Sanz-Bobi, M.A. Facilitating the Automatic Mapping of IEC 61850 Signals and CIM Measurements. IEEE Trans. Power Syst. 2013, 28, 4348–4355. [Google Scholar] [CrossRef]
- Pombo, D.V.; Iov, F.; Silva, N.; Schwefel, H.P.; Kristensen, R.; Winter, C.; Diewald, N.; Handrup, K. Net2DG Deliverable D2.1—Algorithms for Grid Estimation and Observability Applications. Available online: http://www.net2dg.eu/1c254772_52ed_4f92_991a_9502725a16af.html (accessed on 26 August 2021).
- Huang, M.; Wei, Z.; Zhao, J.; Jabr, R.A.; Pau, M.; Sun, G. Robust Ensemble Kalman Filter for Medium-Voltage Distribution System State Estimation. IEEE Trans. Instrum. Meas. 2020, 69, 4114–4124. [Google Scholar] [CrossRef]
- Ranković, A.; Maksimović, B.M.; Sarić, A.T. A three-phase state estimation in active distribution networks. Int. J. Electr. Power Energy Syst. 2014, 54, 154–162. [Google Scholar] [CrossRef]
- SunSpec Modbus Specifications—SunSpec Alliance. Available online: https://sunspec.org/sunspec-modbus-specifications/ (accessed on 26 August 2021).
- Iosif Ciontea, C.; Shahid, K.; Iov, F.; Løvenstein Olsen, R. Flexible Platform for the Study and Testing of Smart Energy Systems Enabling-Technologies. In Proceedings of the 2020 IEEE PES Innovative Smart Grid Technologies Europe (ISGT-Europe), Delft, The Netherlands, 26–28 October 2020; pp. 1114–1119. [Google Scholar] [CrossRef]
- Smart Energy Systems Laboratory. Available online: https://www.et.aau.dk/laboratories/power-systems-laboratories/smart-energy-systems/ (accessed on 10 March 2021).
- Ciontea, C.I.; Iov, F. A study of load imbalance influence on power quality assessment for distribution networks. Electricity 2021, 2, 5. [Google Scholar] [CrossRef]
- Tex, C.; Schäler, M.; Böhm, K. Swellfish Privacy: Exploiting Time-Dependent Relevance for Continuous Differential Privacy; Technical Report; KIT Scientific Working Papers; Institute for Program Structures and Data Organization (IPD): Karlsruhe, Germany, 2020. [Google Scholar]


| Hardware/Software Platform | Tool/Technology |
|---|---|
| Opal-RT | RT-Lab/ePHASOR + Matlab/ Simulink |
| HeadEnds | WebSocket Server |
| ICT Gateway | Java 1.8 + Jetty |
| Data Access API | Java Persistence API |
| Grid Topology Headend | Java 1.8 |
| Grid Observability Apps | Java 1.8 |
| VMS-AMI | Java 1.8 |
| VSS-INV | Java 1.8 |
| GUI | Angular |
| PCs | Standard Industrial PCs |
| Energy [kWh] | Error [%] | ||
|---|---|---|---|
| True Values from OPAL Data | LC Application with OGM | ||
| Total energy throughput at the substation transformer | 172.8 | 172.7 | 0.05 |
| Total energy loss (technical loss) | 2.91 | 2.81 | 3.43 |
Publisher’s Note: MDPI stays neutral with regard to jurisdictional claims in published maps and institutional affiliations. |
© 2021 by the authors. Licensee MDPI, Basel, Switzerland. This article is an open access article distributed under the terms and conditions of the Creative Commons Attribution (CC BY) license (https://creativecommons.org/licenses/by/4.0/).
Share and Cite
Nainar, K.; Ciontea, C.I.; Shahid, K.; Iov, F.; Olsen, R.L.; Schäler, C.; Schwefel, H.-P.C. Experimental Validation and Deployment of Observability Applications for Monitoring of Low-Voltage Distribution Grids. Sensors 2021, 21, 5770. https://doi.org/10.3390/s21175770
Nainar K, Ciontea CI, Shahid K, Iov F, Olsen RL, Schäler C, Schwefel H-PC. Experimental Validation and Deployment of Observability Applications for Monitoring of Low-Voltage Distribution Grids. Sensors. 2021; 21(17):5770. https://doi.org/10.3390/s21175770
Chicago/Turabian StyleNainar, Karthikeyan, Catalin Iosif Ciontea, Kamal Shahid, Florin Iov, Rasmus Løvenstein Olsen, Christine Schäler, and Hans-Peter Christian Schwefel. 2021. "Experimental Validation and Deployment of Observability Applications for Monitoring of Low-Voltage Distribution Grids" Sensors 21, no. 17: 5770. https://doi.org/10.3390/s21175770
APA StyleNainar, K., Ciontea, C. I., Shahid, K., Iov, F., Olsen, R. L., Schäler, C., & Schwefel, H.-P. C. (2021). Experimental Validation and Deployment of Observability Applications for Monitoring of Low-Voltage Distribution Grids. Sensors, 21(17), 5770. https://doi.org/10.3390/s21175770