
Enhanced Breathing Pattern Detection during Running Using Wearable Sensors


Abstract
:1. Introduction
1.1. The Importance of Breathing Pattern
1.2. Breathing Sensors
1.3. Flow Reversal Detection
- To determine the accuracy and precision of the HX and custom algorithm for detecting FR during running;
- To determine the measurement agreement of the HX and reference spirometer for measuring BR and timing during running.
2. Materials and Methods
2.1. Participants
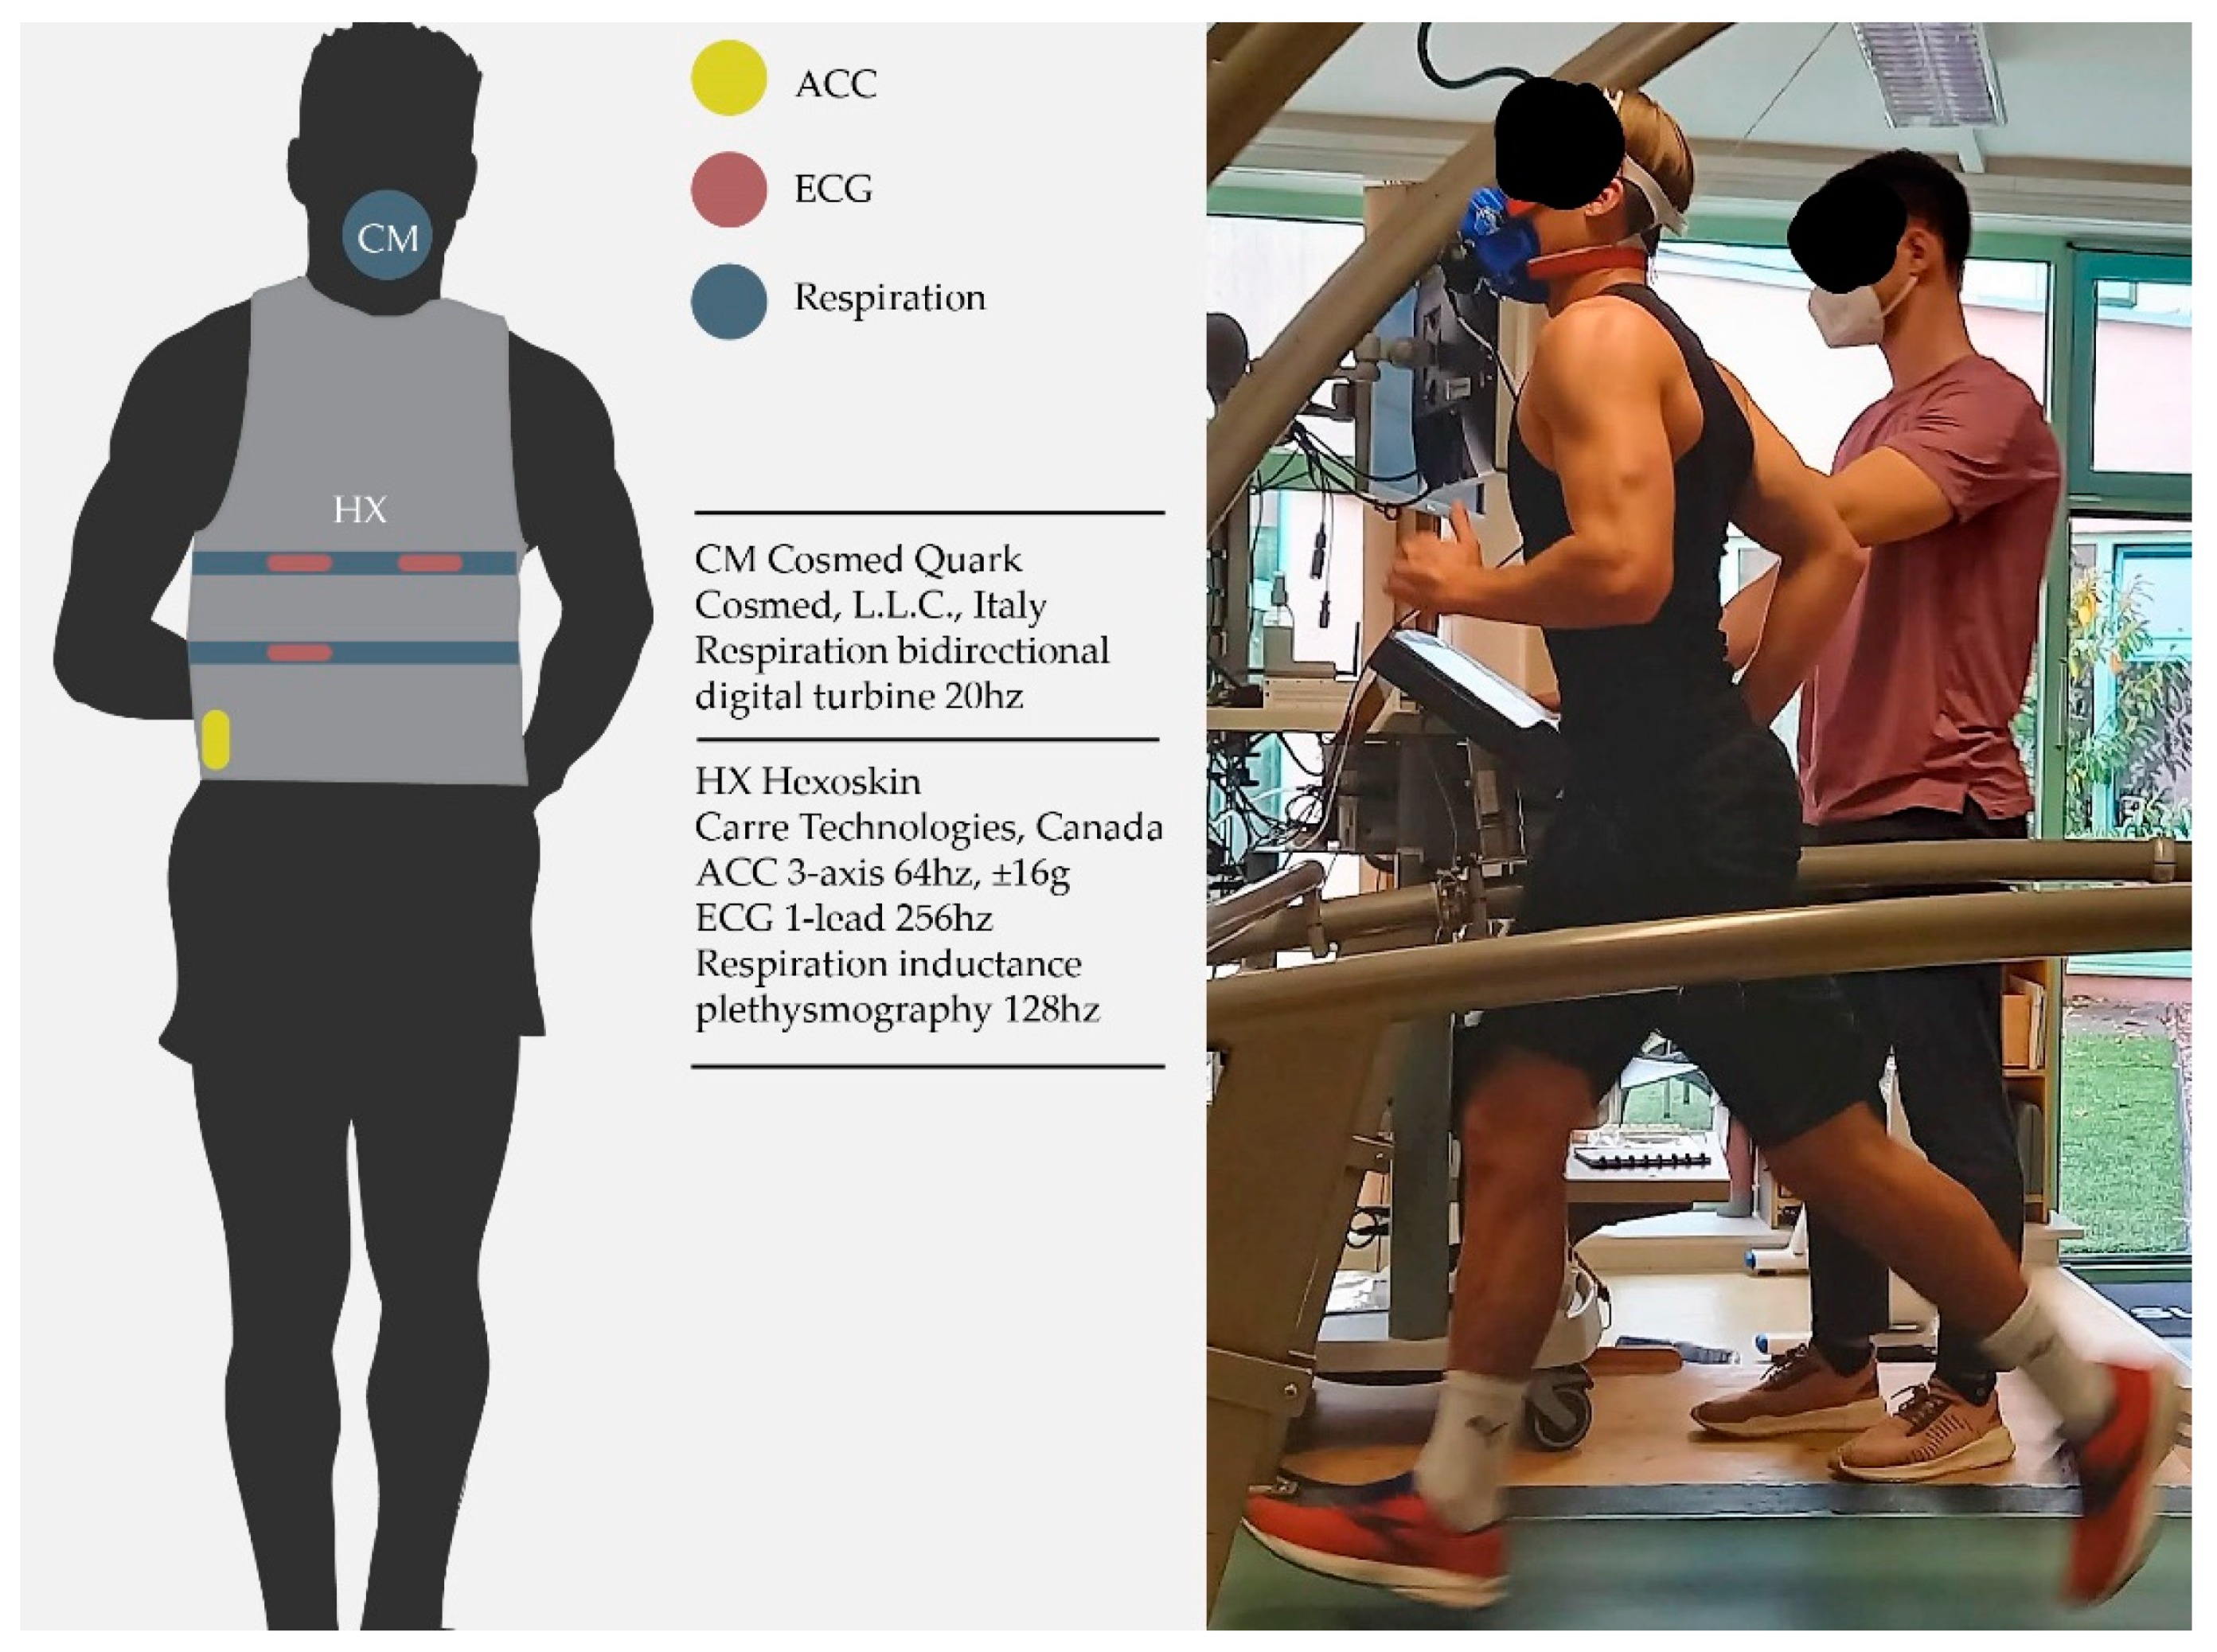
2.2. Instruments
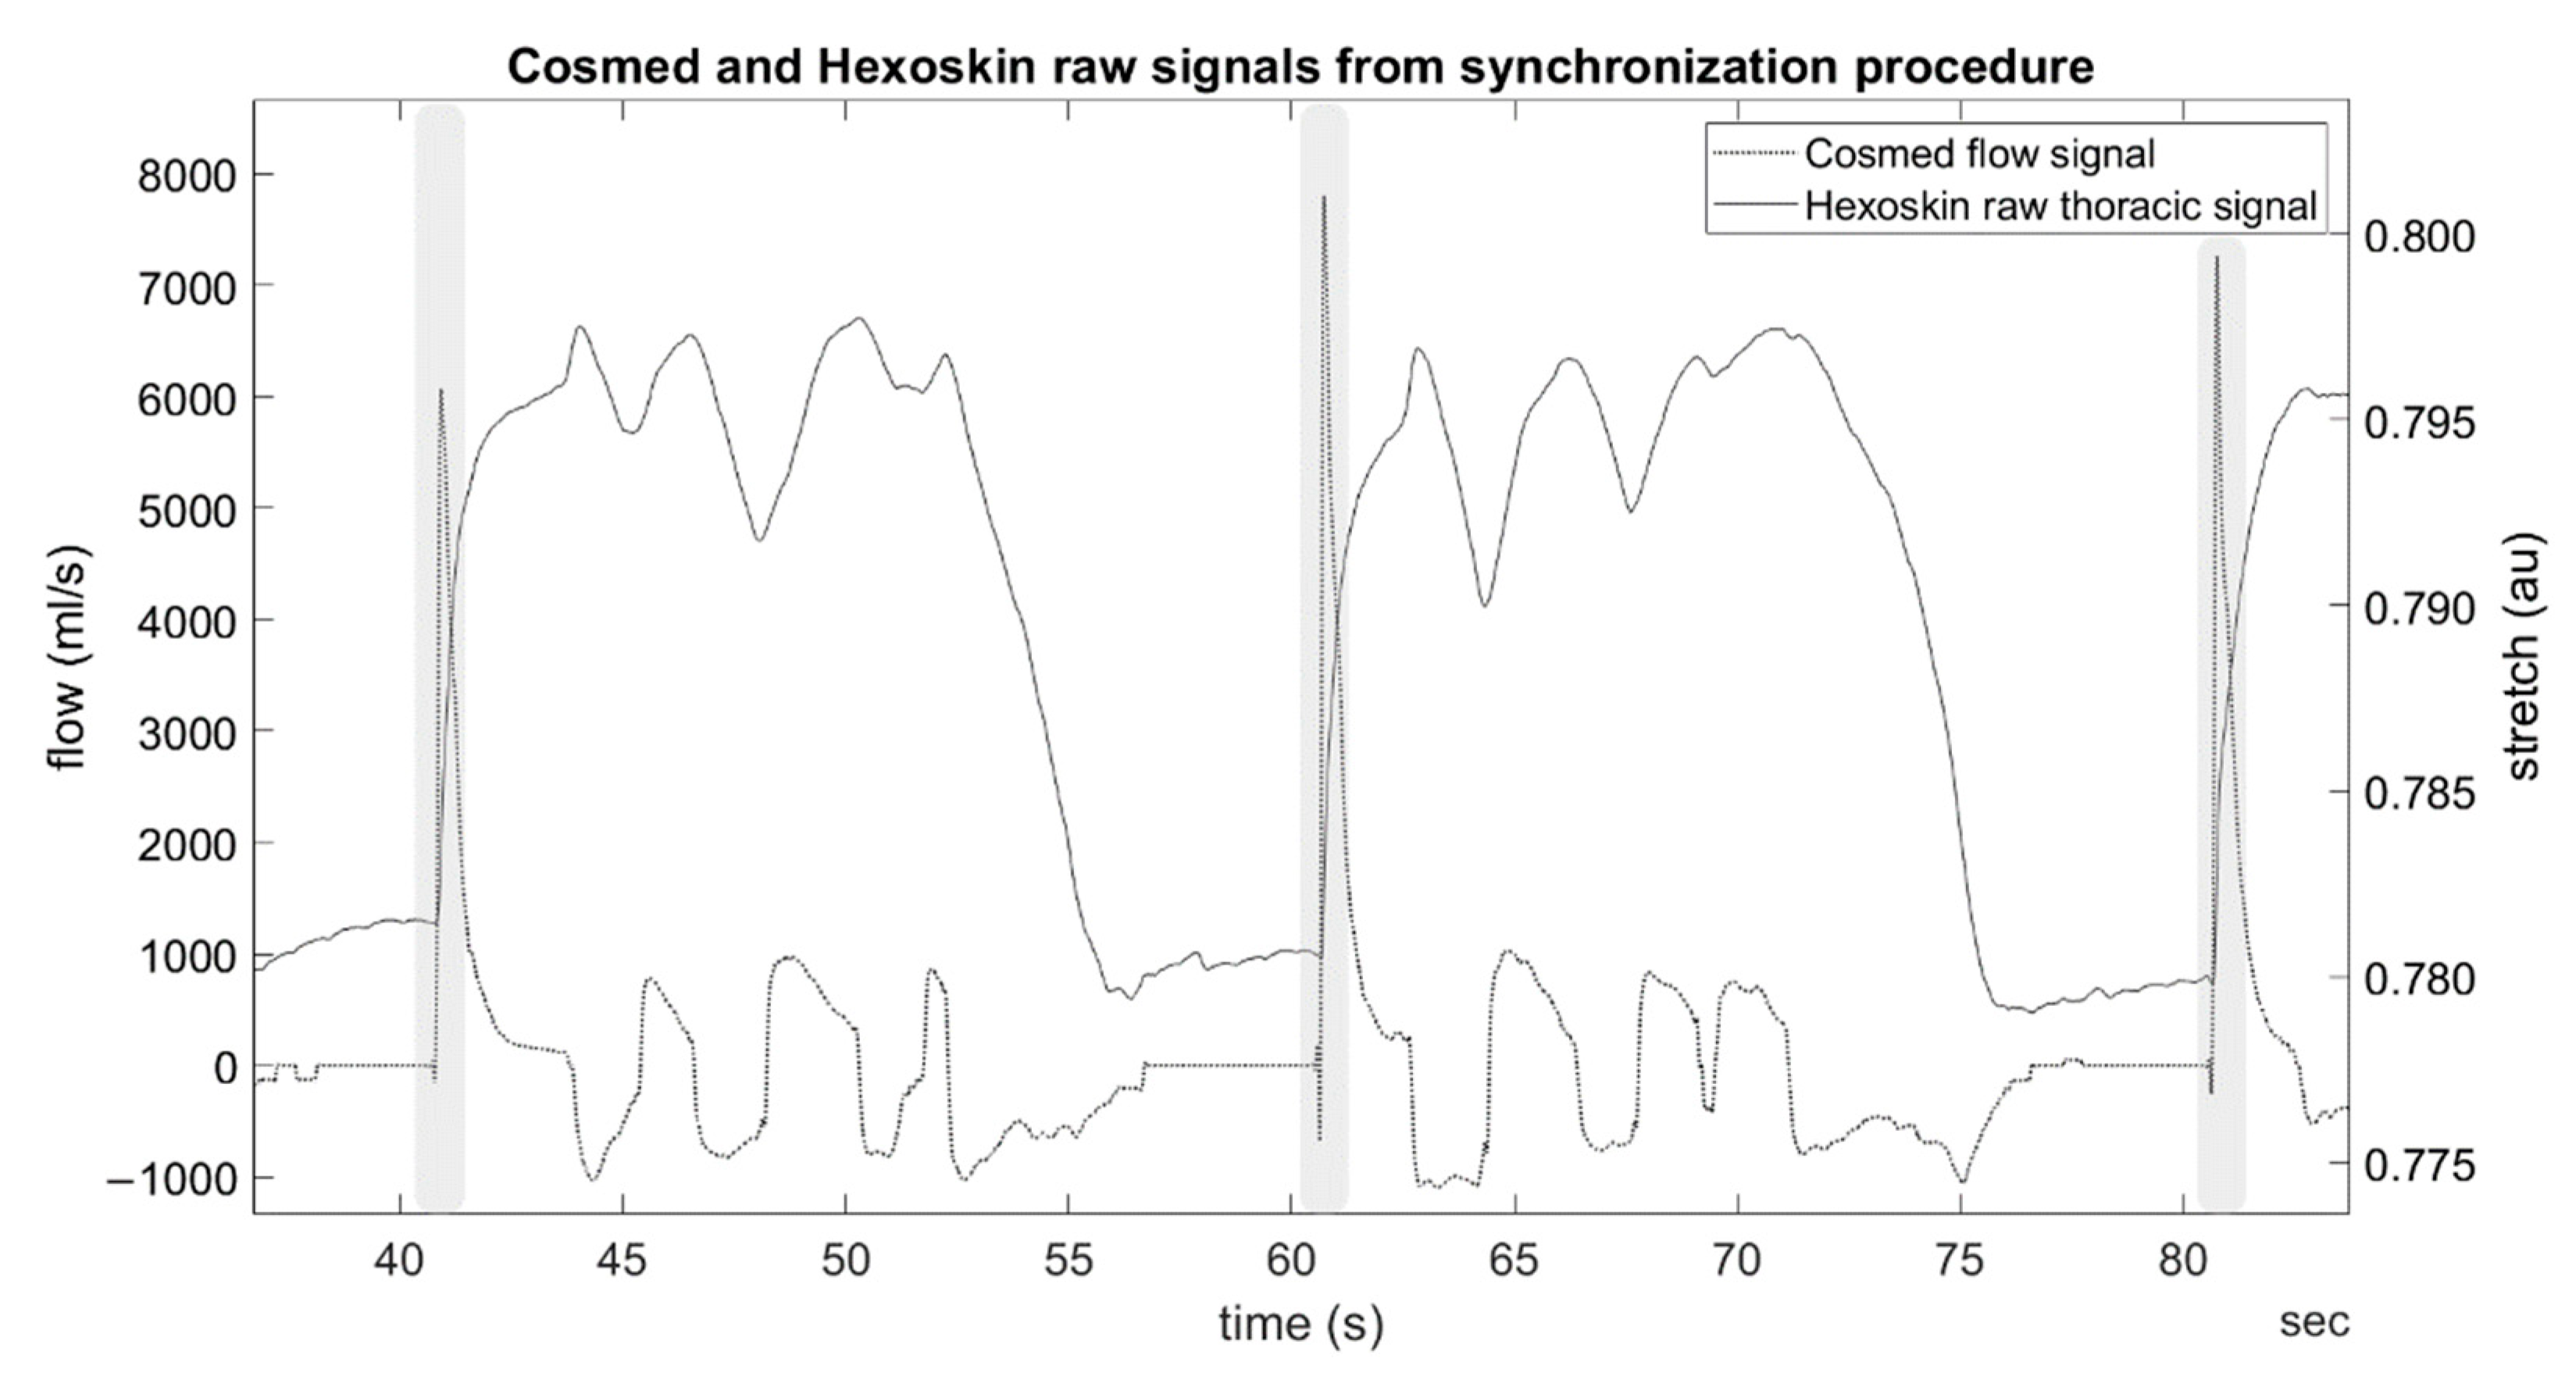
2.3. Data Collection
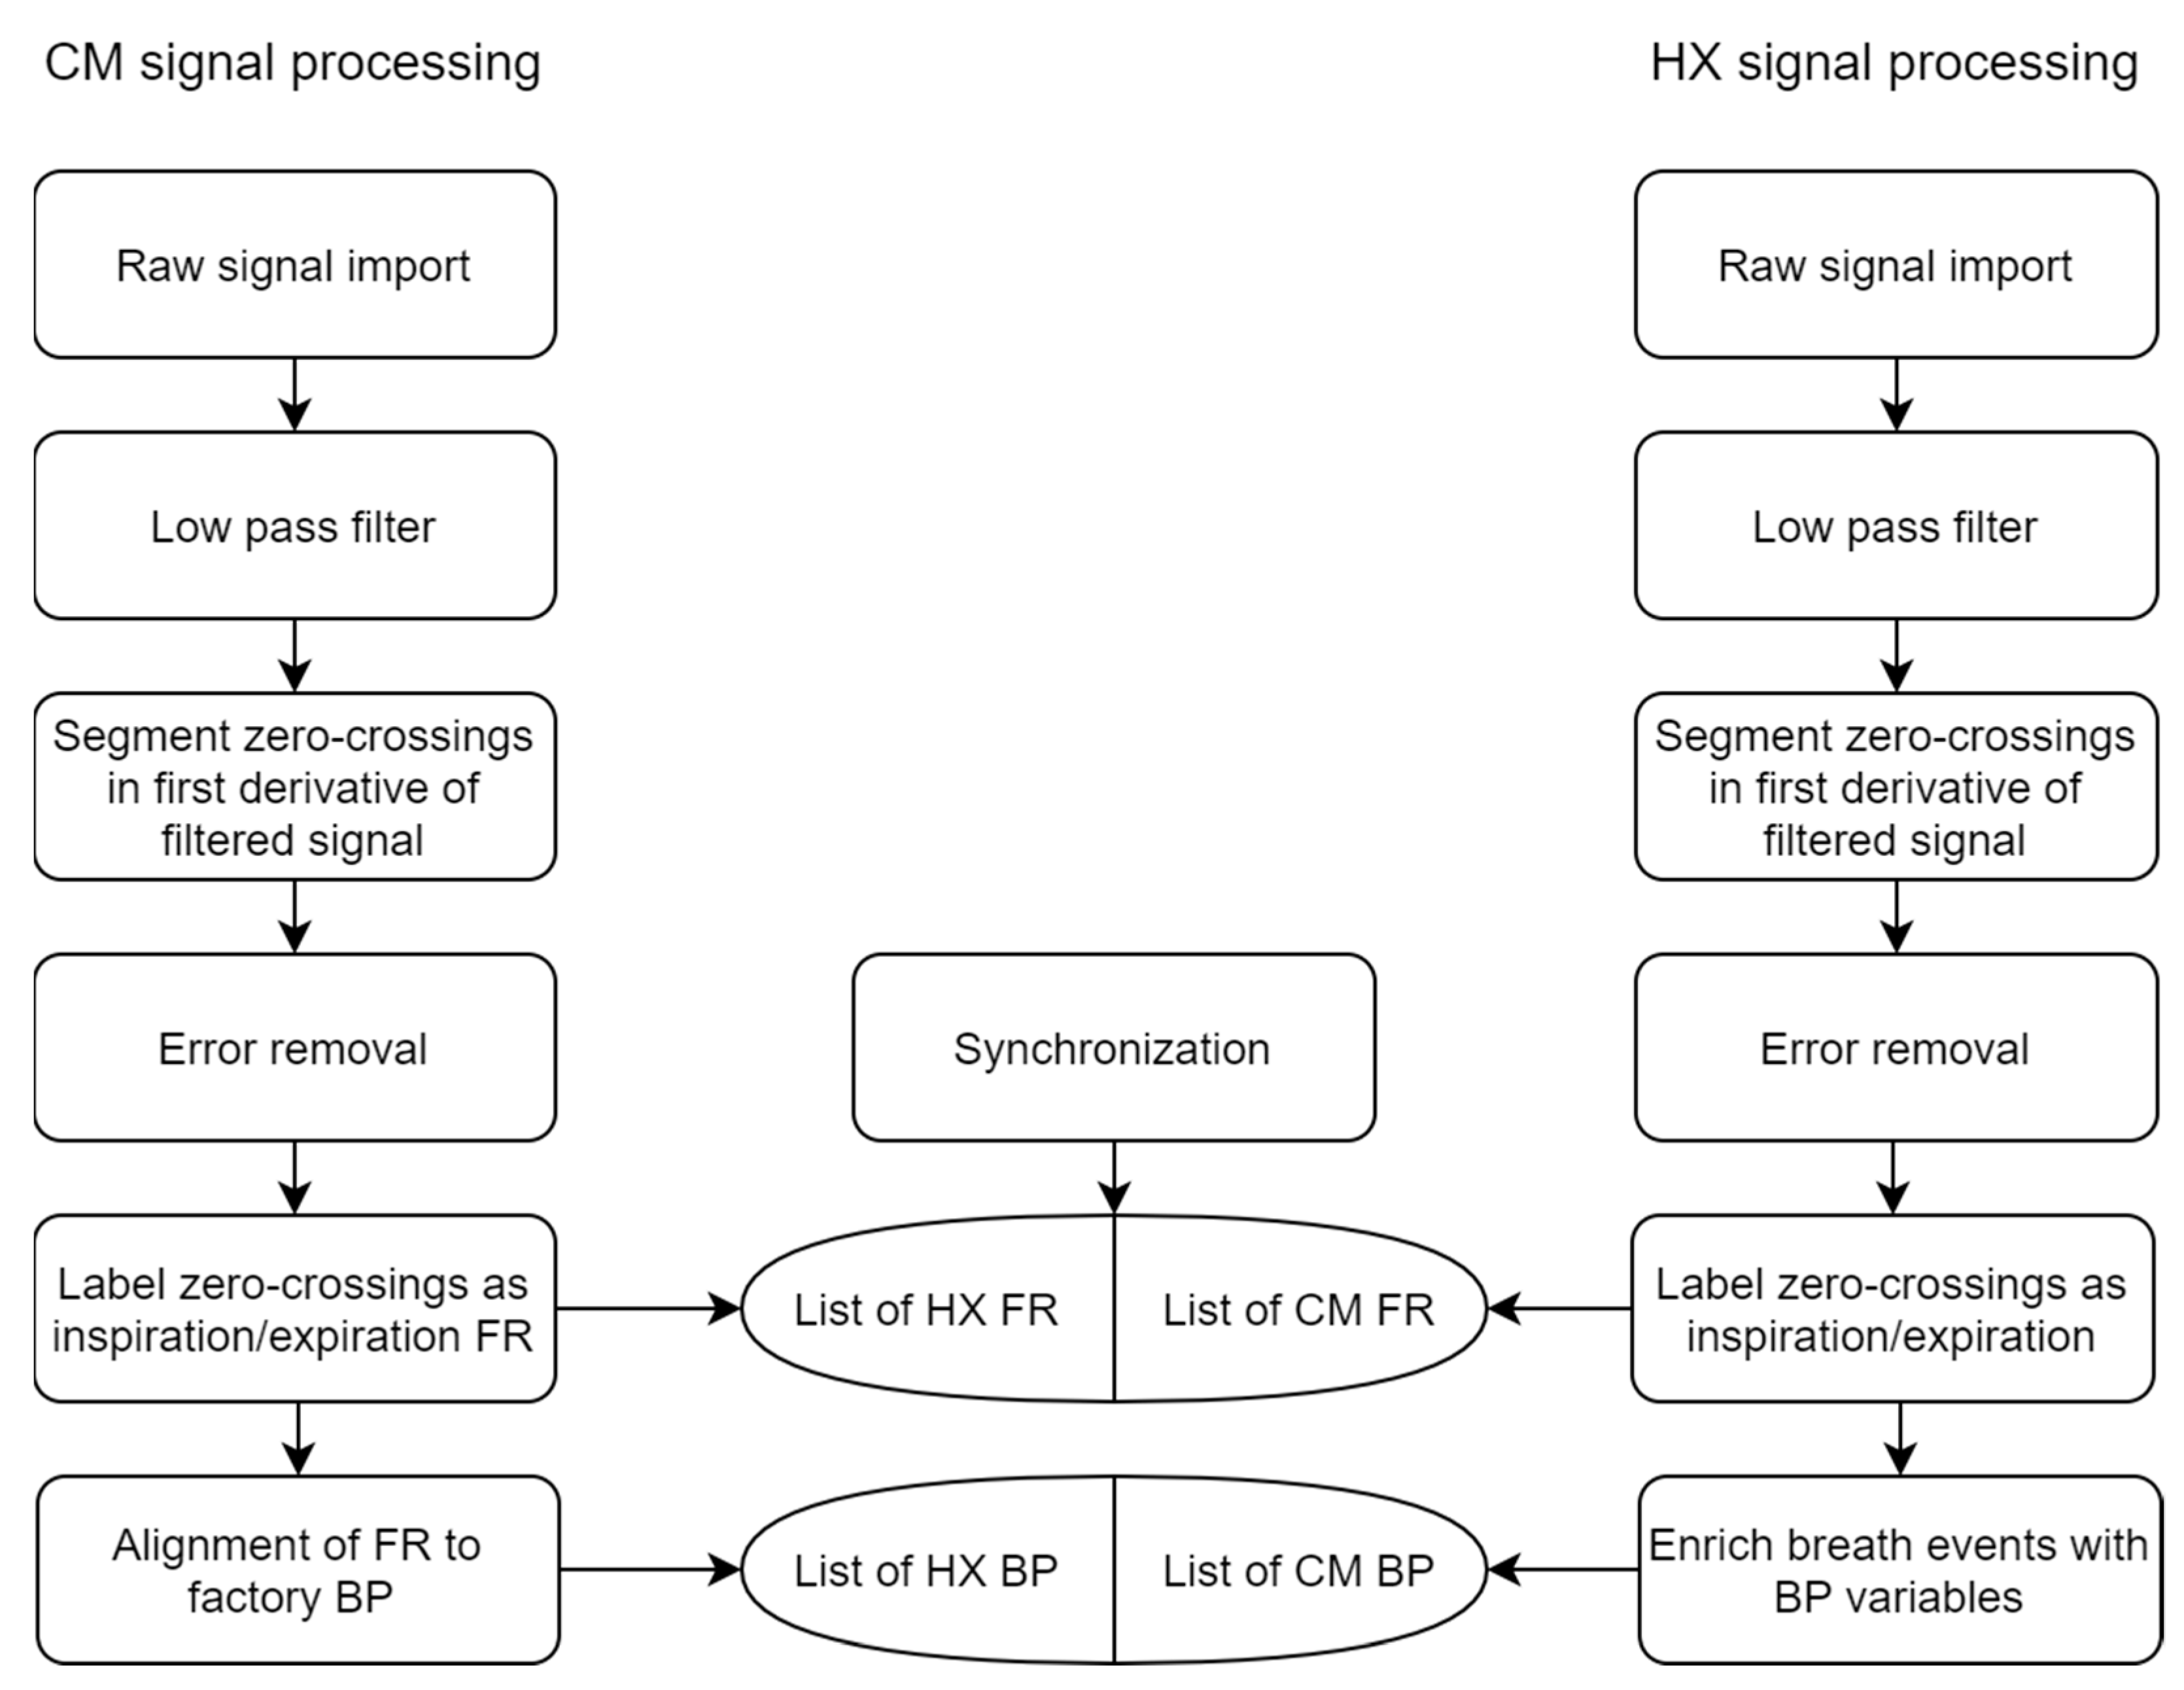
2.4. Data Processing
2.5. Statistical Analysis
2.5.1. FR Detection
- Precision: the proportion of FR detected by the algorithm that are actual FR (Equation (1)).
- Recall: the proportion of actual FR detected by the breath detection algorithm (Equation (2)).
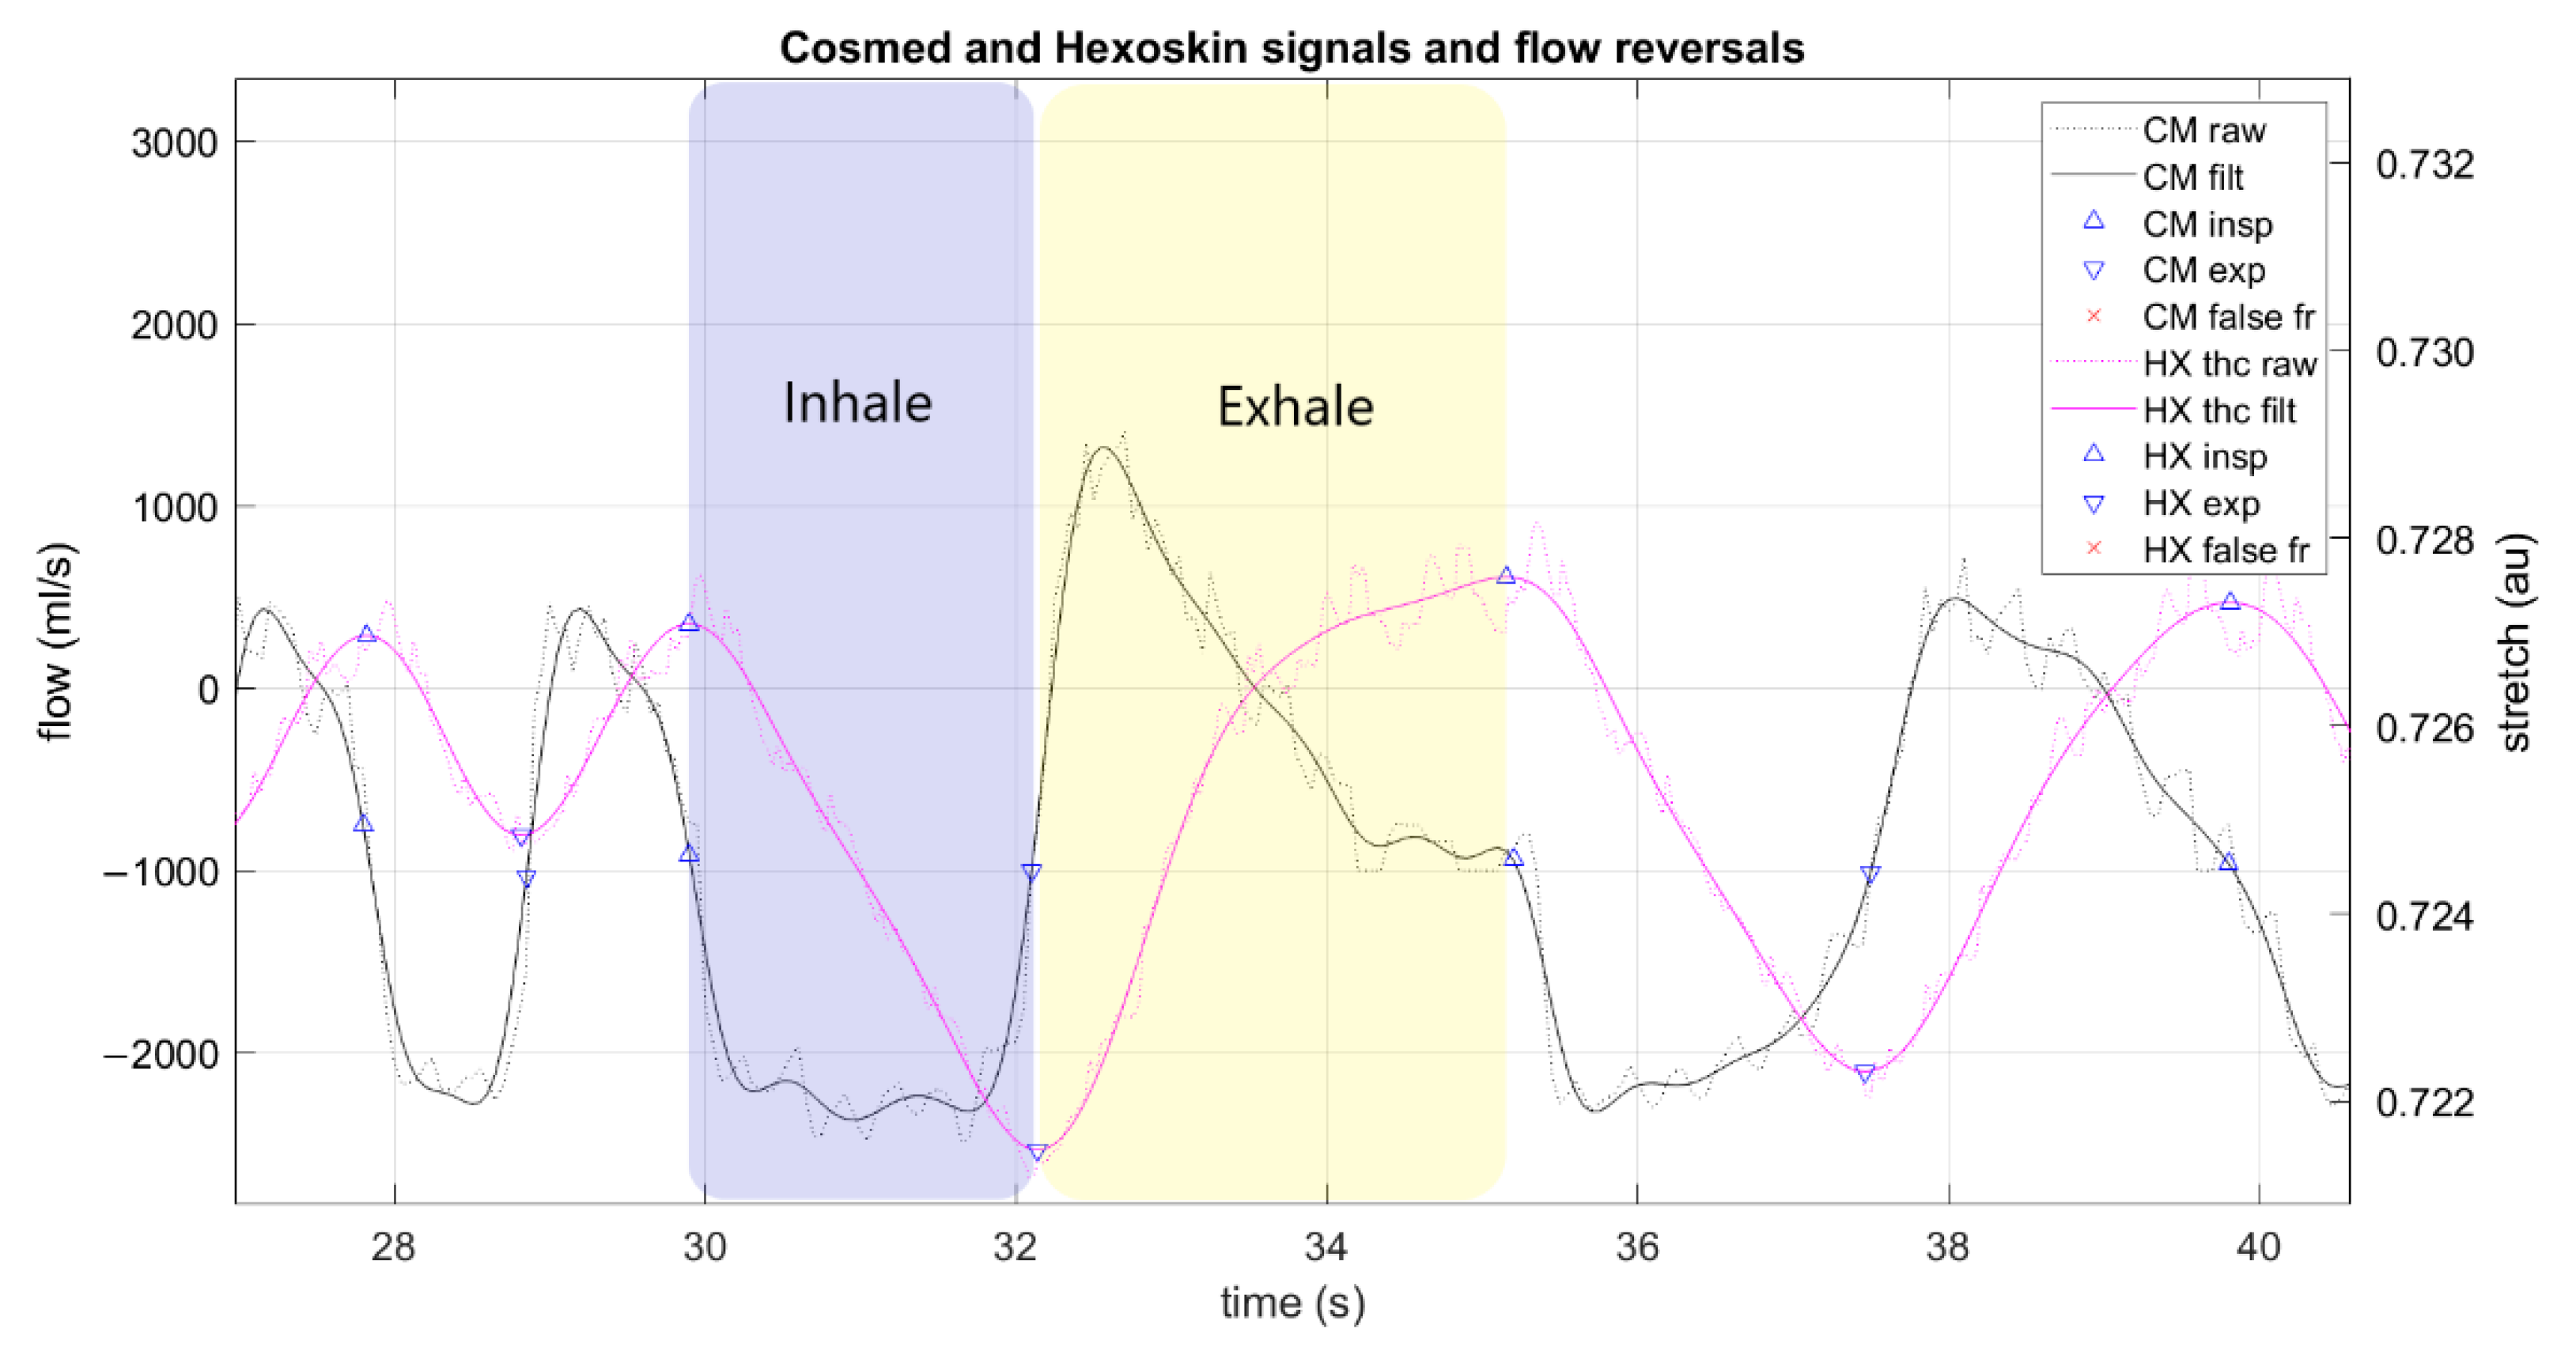
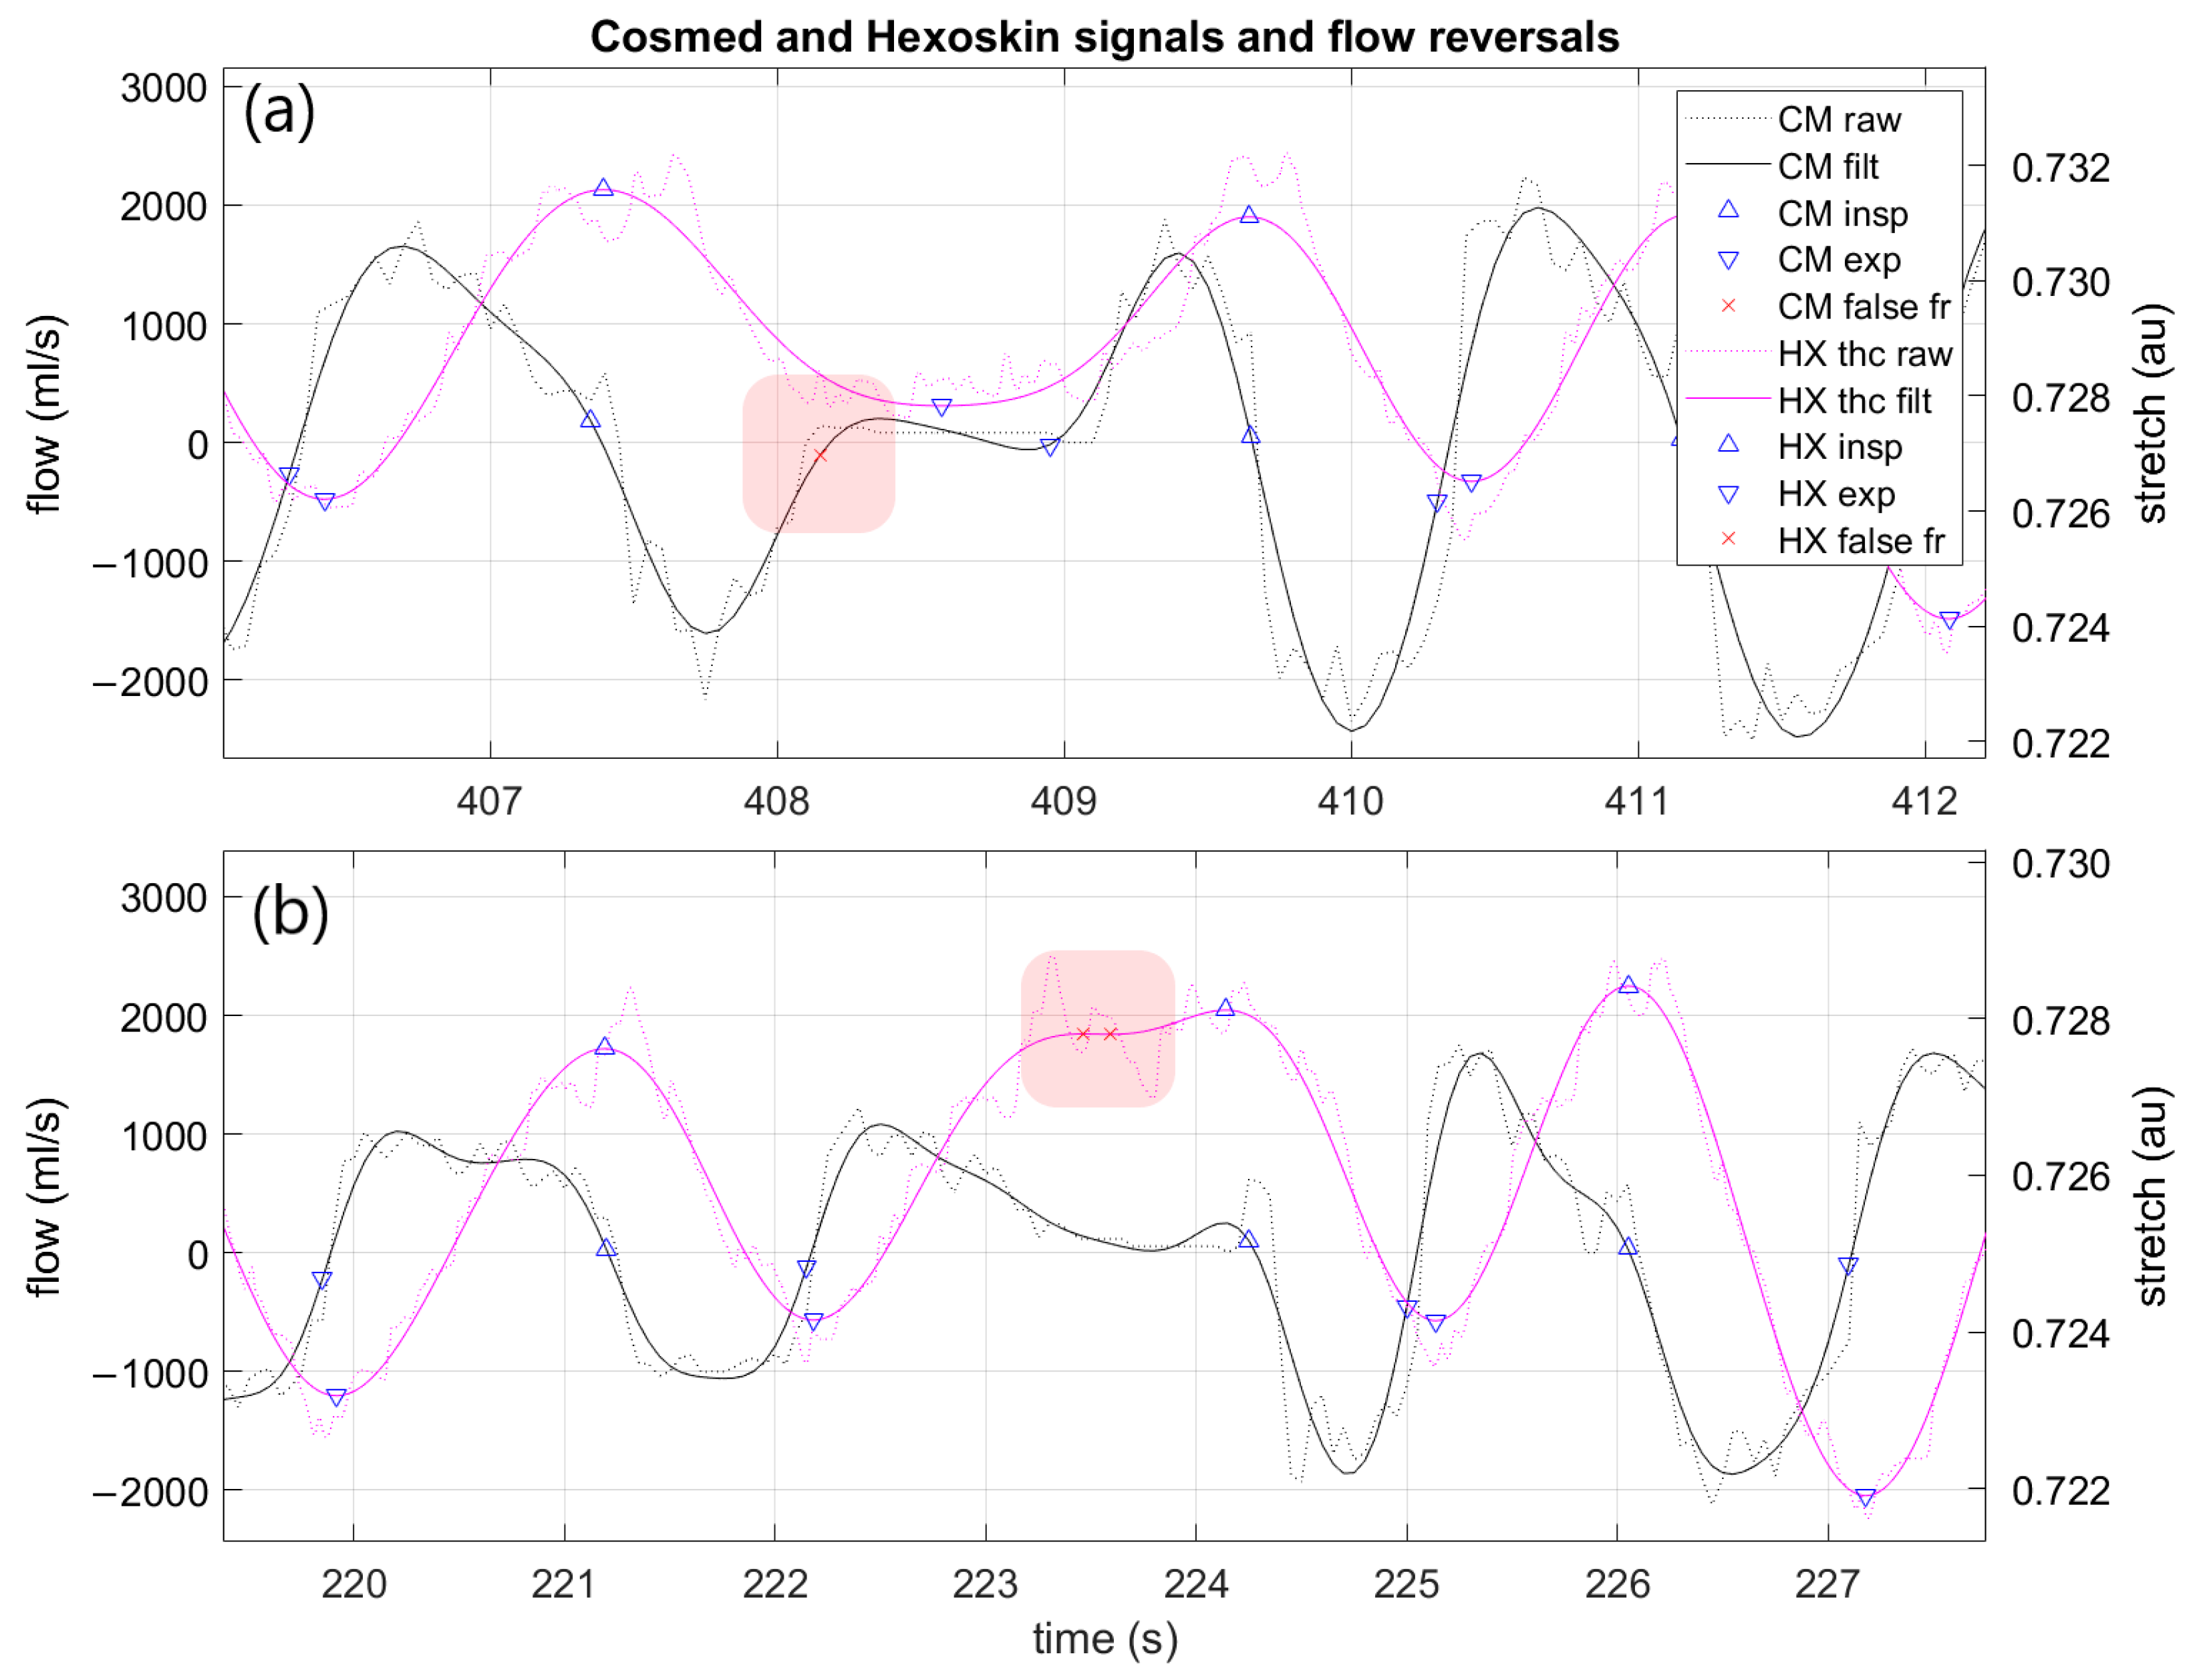
- True positives (TP) are determined by a detected FR that was an actual FR (based on CM factory breath-by-breath data). A correct detection is characterized by the correct breath phase determination (either inspiration or expiration) and by the difference in time between the detected and the actual timestamp. If the time difference is smaller than half the mean tB of the last five breaths, it is a true positive.
- False positives (FP) reflect the number of FR detected by the breath detection algorithm that are not actual FR detected by the reference system.
- False negatives (FN) are the number of actual FR that are not detected by the breath detection algorithm.
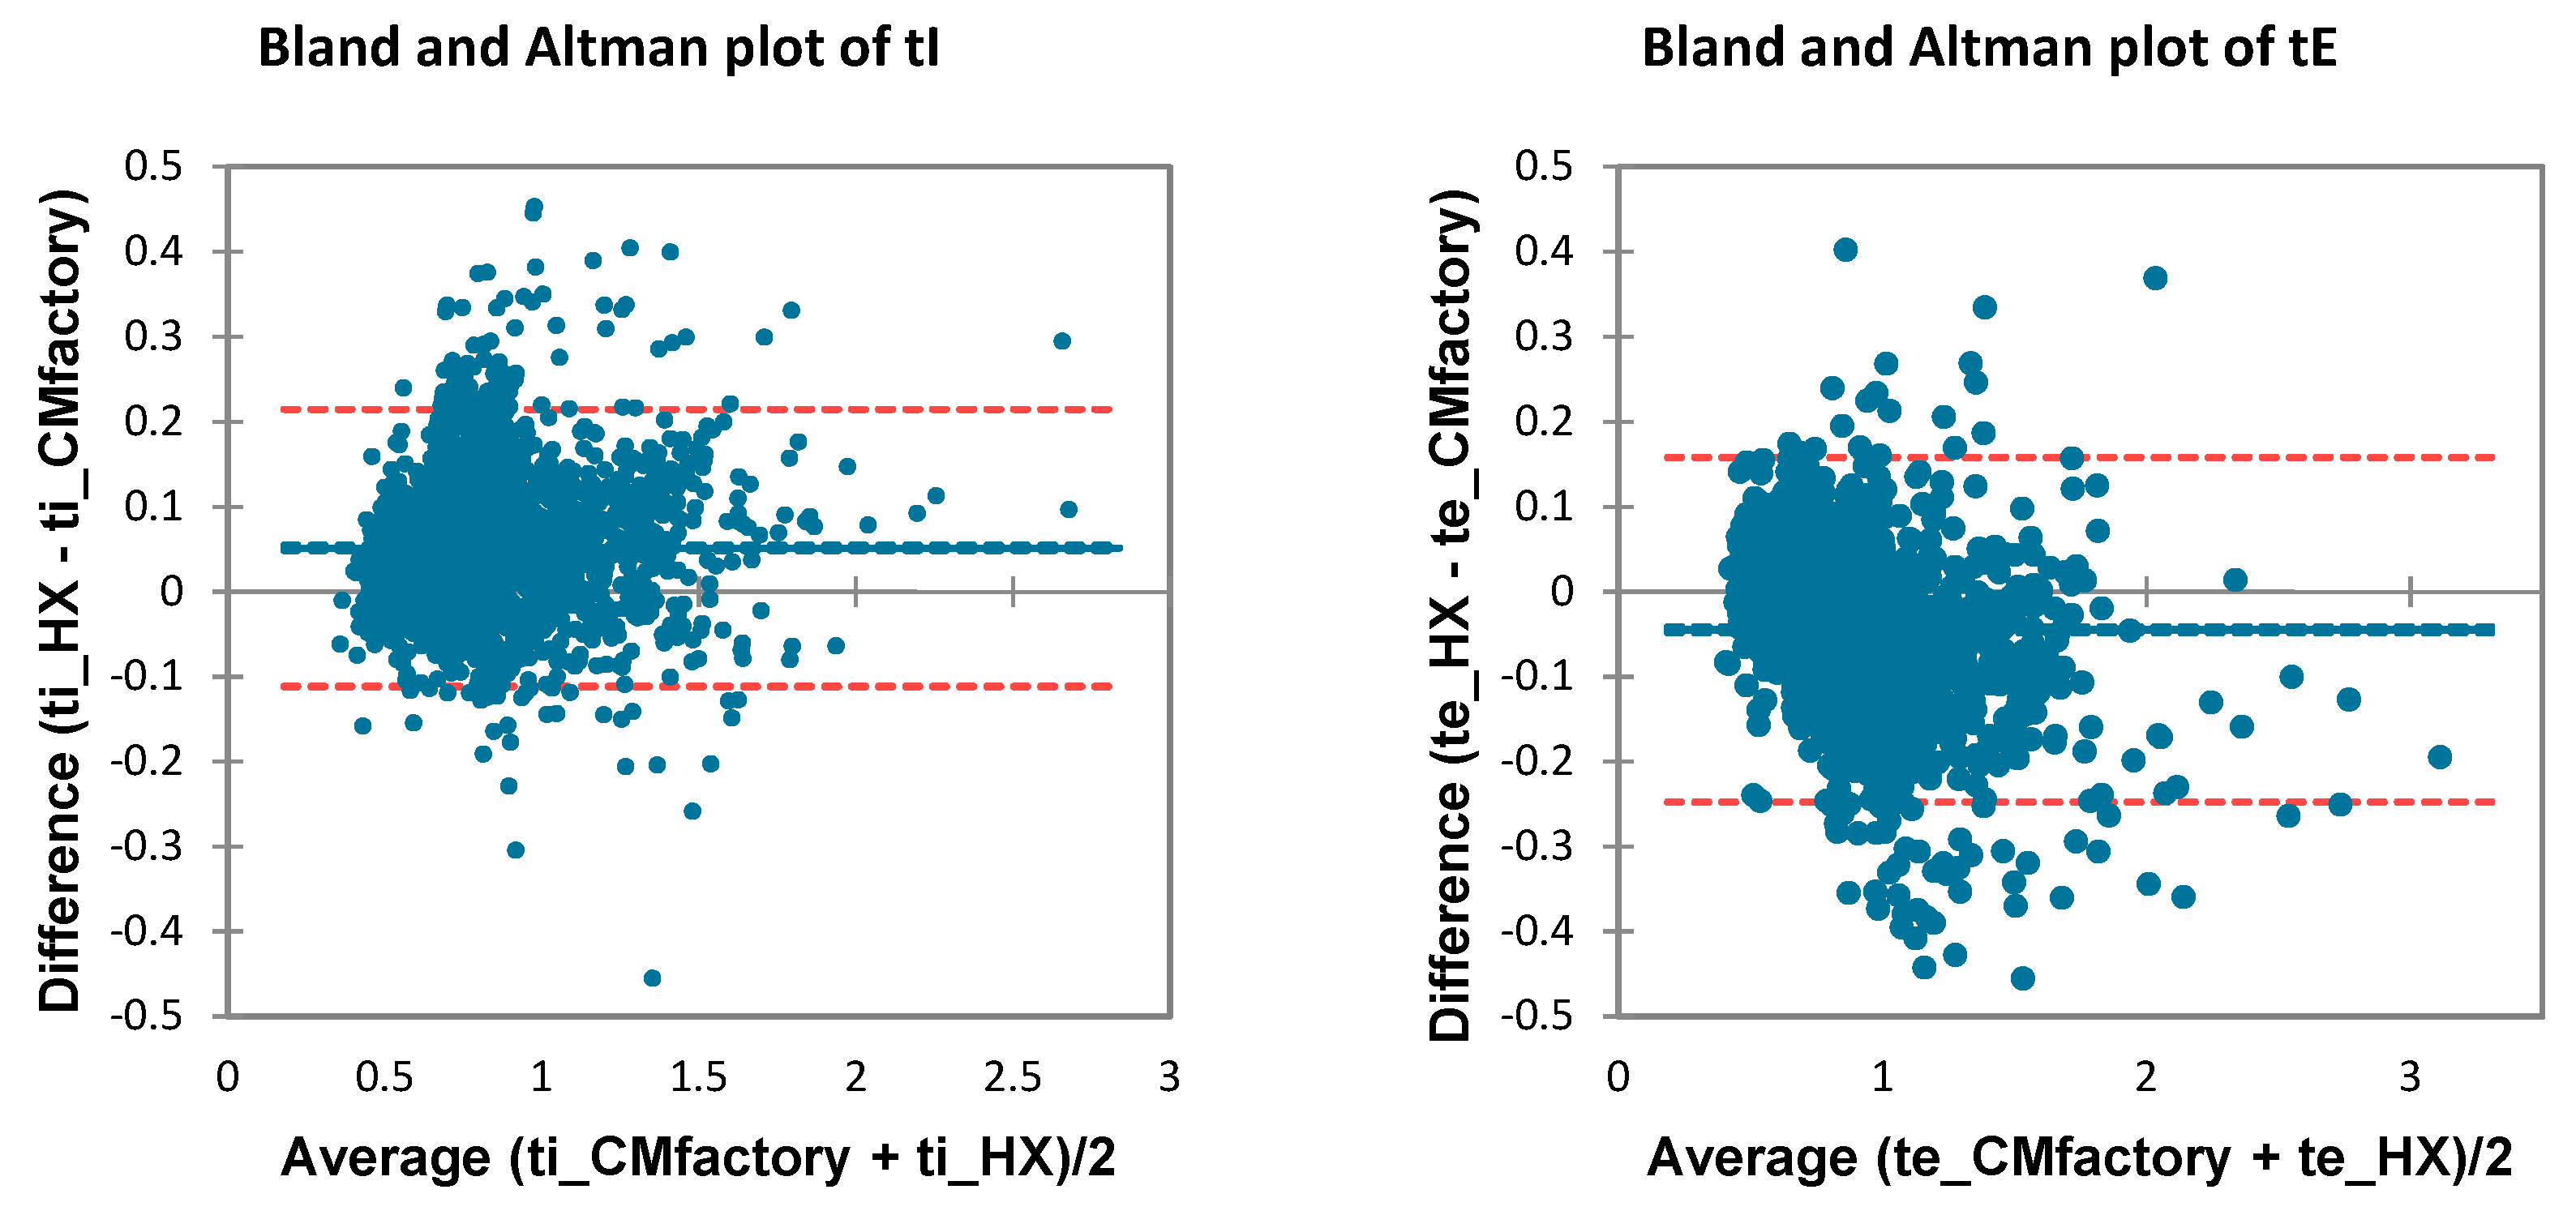
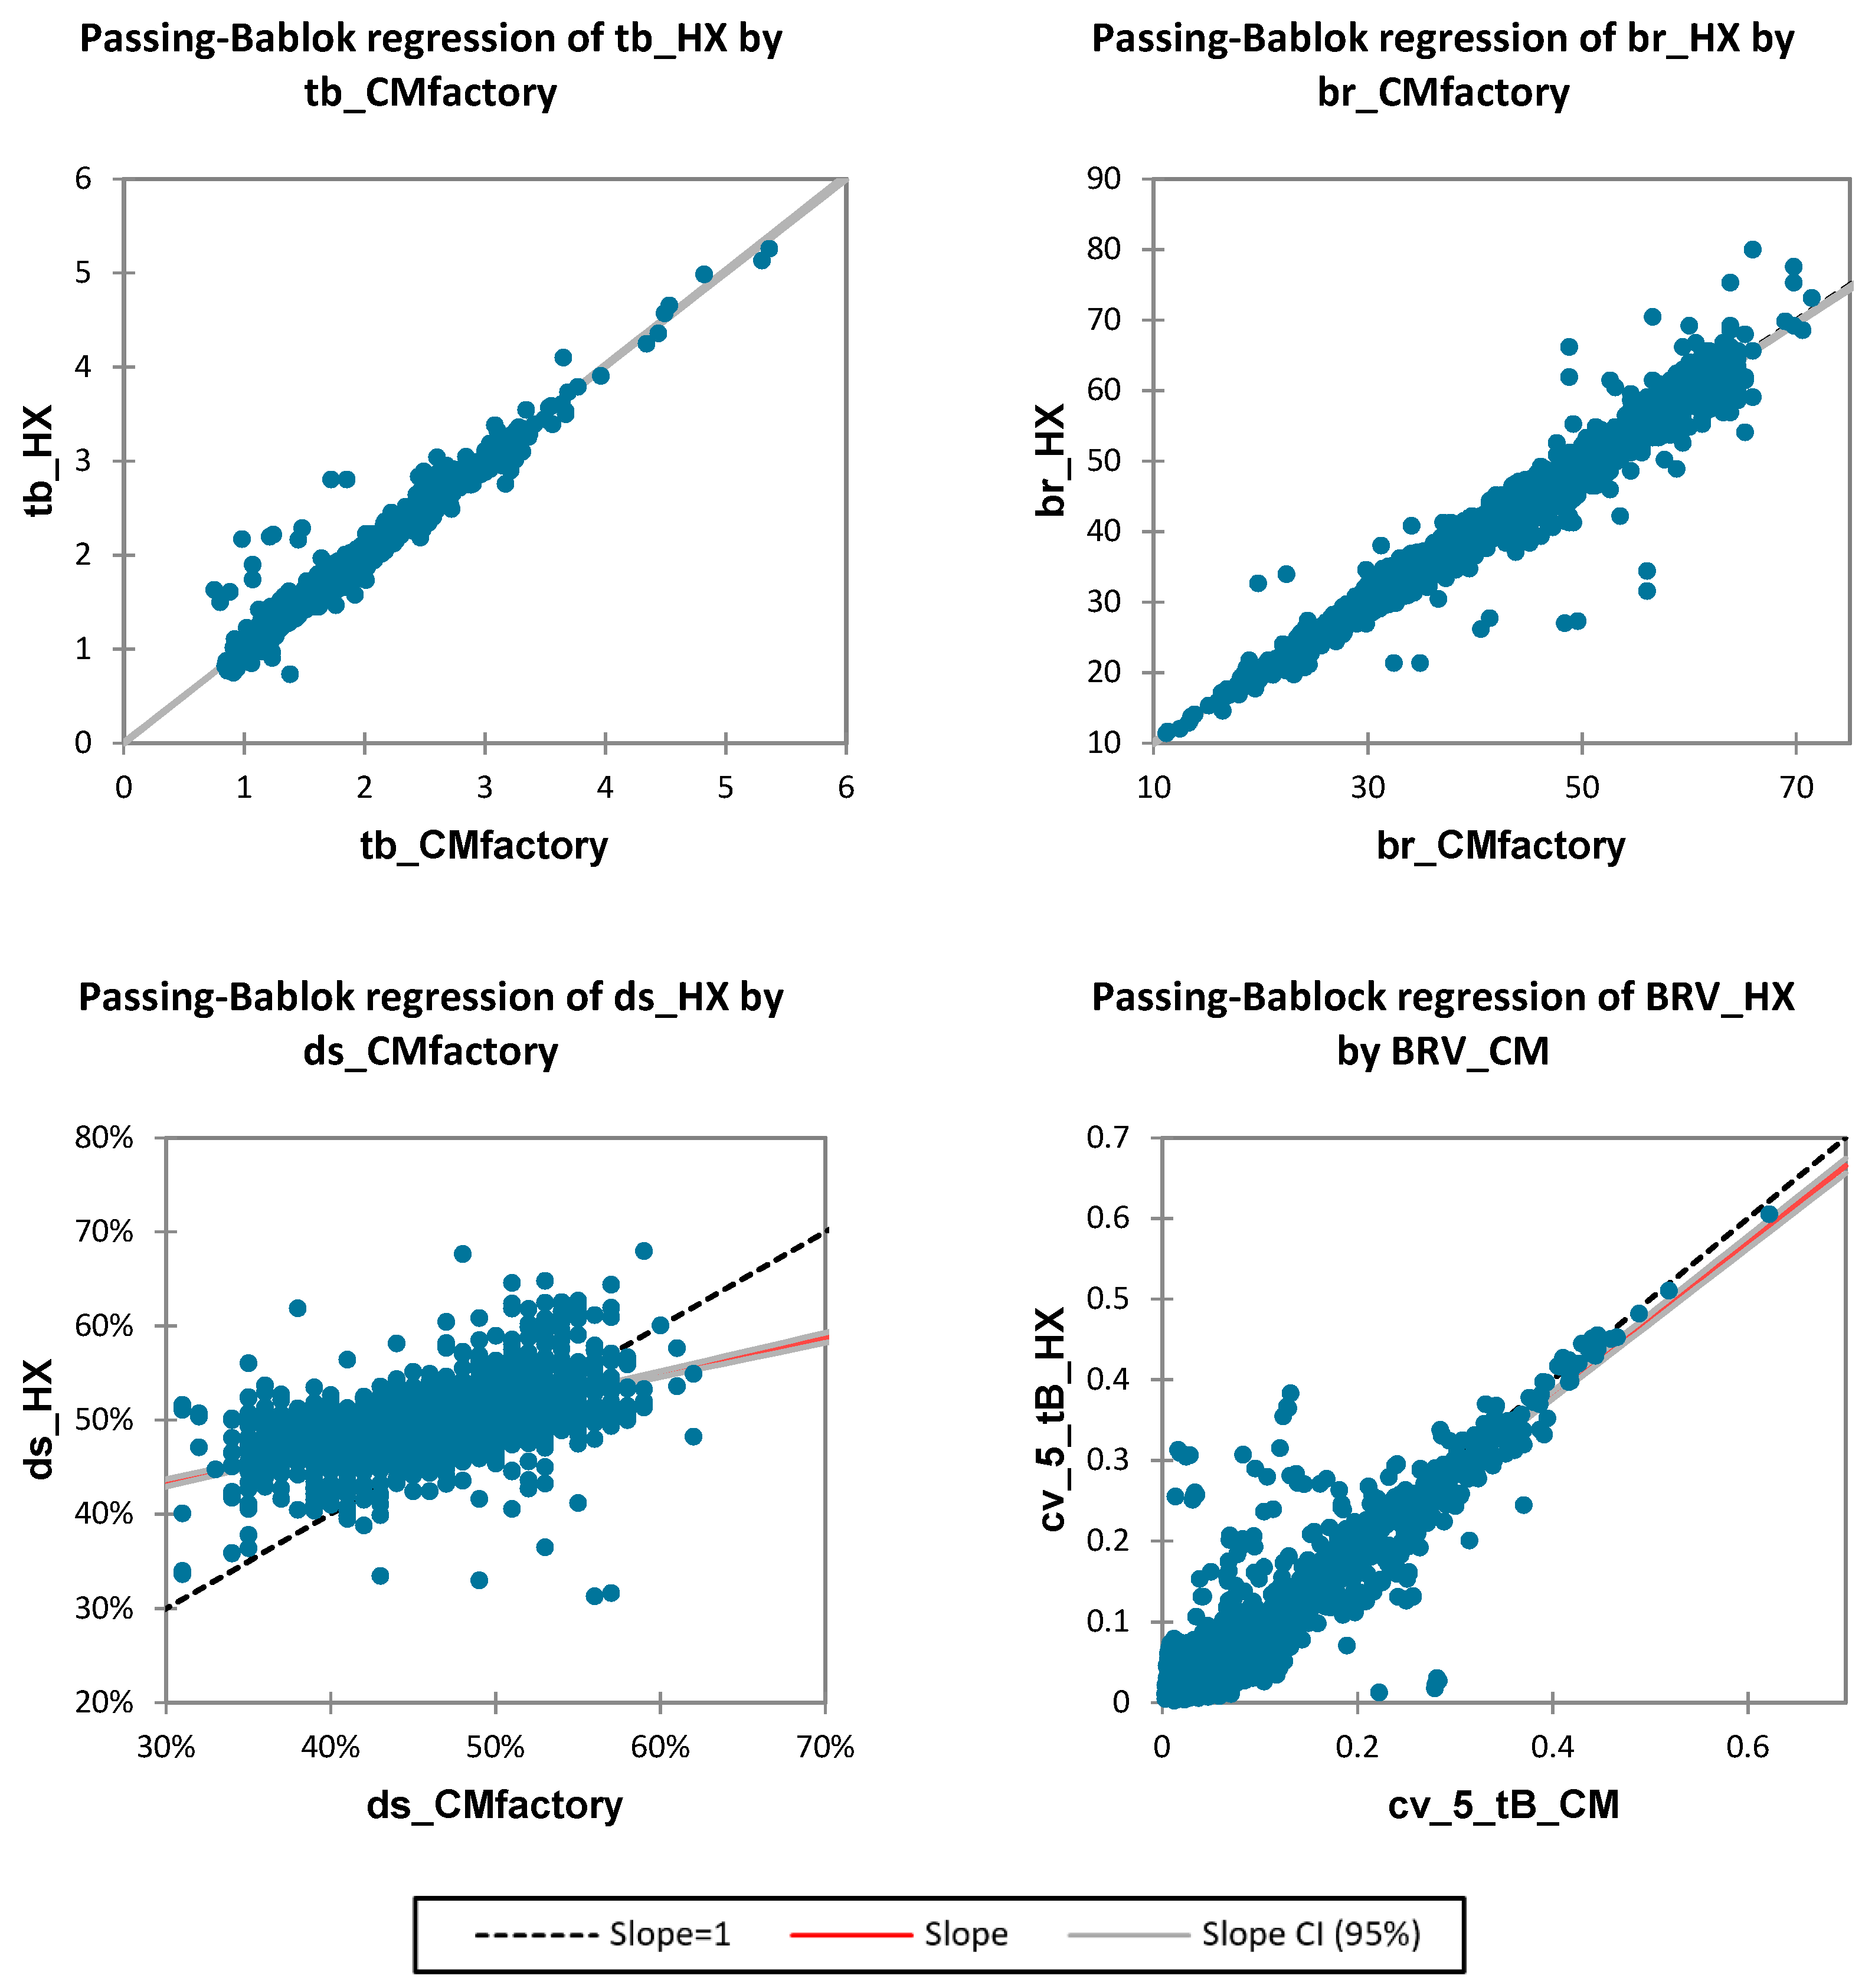
2.5.2. BP Detection
3. Results
3.1. Sample
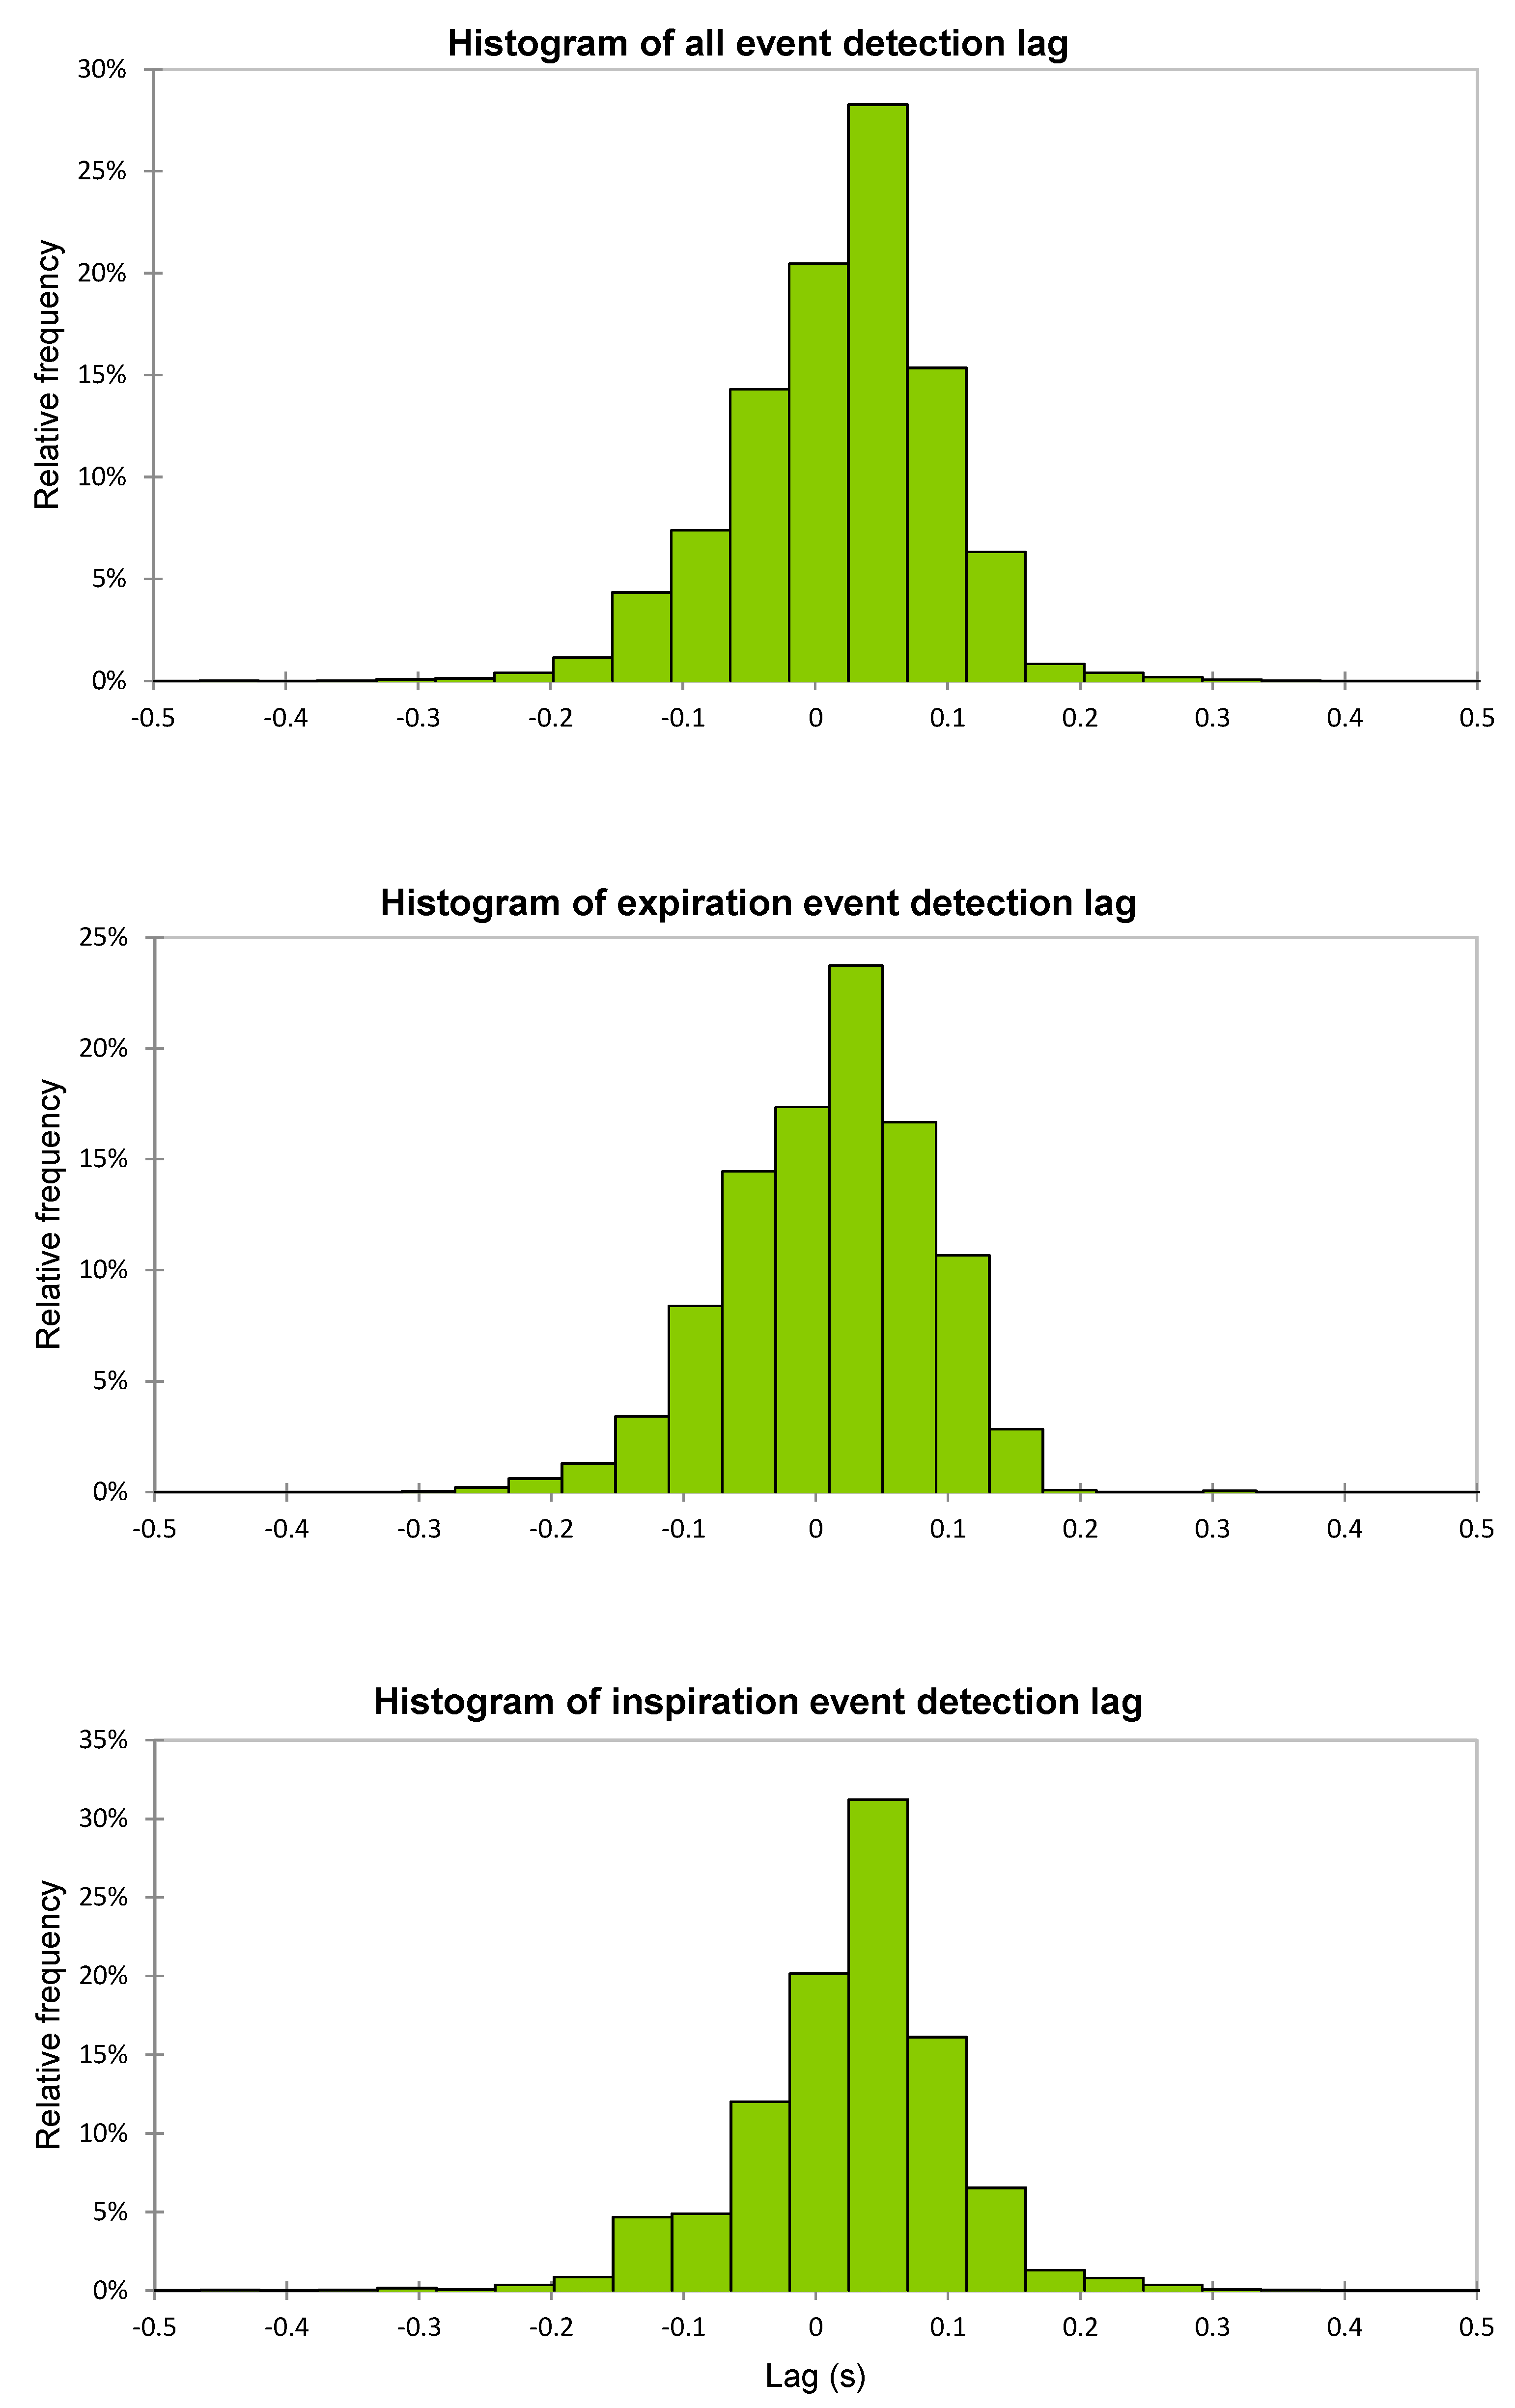
3.2. FR Detection
3.3. BP Detection
4. Discussion
4.1. FR Detection Accuracy
4.2. BP Detection Accuracy
4.3. Limitations and Practical Applications
5. Conclusions
Author Contributions
Funding
Institutional Review Board Statement
Informed Consent Statement
Data Availability Statement
Conflicts of Interest
Abbreviations
| BP | Breathing pattern |
| BR | Breathing rate, respiratory frequency (breaths per minute, bpm) |
| BRV | Breathing rate variability (%) |
| CM | Cosmed Quark spirometer |
| ds | Duty cycle, breath ratio (inhale time/breath cycle time) (%) |
| FN | False negative |
| FP | False positive |
| FR | Flow reversal |
| HX | Hexoskin smart shirt |
| LOA | Bland–Altman 95% limits of agreement |
| LRC | Locomotor-respiratory coupling |
| tB | Breath cycle time (from inspiration to next inspiration) (s) |
| tE | Exhale time (s) |
| tI | Inhale time (s) |
| TP | True positive |
References
- Nicolò, A.; Massaroni, C.; Schena, E.; Sacchetti, M. The Importance of Respiratory Rate Monitoring: From Healthcare to Sport and Exercise. Sensors 2020, 20, 6396. [Google Scholar] [CrossRef]
- Nicolò, A.; Massaroni, C.; Passfield, L. Respiratory frequency during exercise: The neglected physiological measure. Front. Physiol. 2017, 8, 922. [Google Scholar] [CrossRef] [PubMed]
- Ionescu, M.F.; Mani-Babu, S.; Degani-Costa, L.H.; Johnson, M.; Paramasivan, C.; Sylvester, K.; Fuld, J. Cardiopulmonary Exercise Testing in the Assessment of Dysfunctional Breathing. Front. Physiol. 2020, 11, 620955. [Google Scholar] [CrossRef]
- Naranjo, J.; Centeno, R.A.; Galiano, D.; Beaus, M. A nomogram for assessment of breathing patterns during treadmill exercise. Br. J. Sports Med. 2005, 39, 80–83. [Google Scholar] [CrossRef] [Green Version]
- Daley, M.A.; Bramble, D.M.; Carrier, D.R. Impact loading and locomotor-respiratory coordination significantly influence breathing dynamics in running humans. PLoS ONE 2013, 8, e70752. [Google Scholar] [CrossRef] [Green Version]
- Massaroni, C.; Nicolò, A.; Lo Presti, D.; Sacchetti, M.; Silvestri, S.; Schena, E. Contact-based methods for measuring respiratory rate. Sensors 2019, 19, 908. [Google Scholar] [CrossRef] [PubMed] [Green Version]
- Di Tocco, J.; Massaroni, C.; Bravi, M.; Miccinilli, S.; Sterzi, S.; Formica, D.; Schena, E. Evaluation of thoraco-abdominal asynchrony using conductive textiles. In Proceedings of the 2020 IEEE International Instrumentation and Measurement Technology Conference (I2MTC), Dubrovnik, Croatia, 25–28 May 2020; pp. 1–5. [Google Scholar]
- Cherif, N.H.; Mezghani, N.; Gaudreault, N.; Ouakrim, Y.; Mouzoune, I.; Boulay, P. Physiological data validation of the hexoskin smart textile. In Proceedings of the 11th International Joint Conference on Biomedical Engineering Systems and Technologies (BIOSTEC 2018), Funchal, Portugal, 19–21 January 2018; Volume 1, pp. 150–156. [Google Scholar]
- Phillips, M.B.; Beach, J.; Cathey, M.; Lockert, J.; Satterfield, W. Reliability and validity of the Hexoskin wearable body metrics telemetry shirt. J. Sport Hum. Perform. 2017, 5. [Google Scholar] [CrossRef]
- Tanner, E.A.; Montes, J.; Manning, J.W.; Taylor, J.E.; DeBeliso, M.; Young, J.C.; Navalta, J.W. Validation of Hexoskin biometric shirt to COSMED K4 b2 metabolic unit in adults during trail running. Sports Technol. 2015, 8, 118–123. [Google Scholar] [CrossRef]
- Vanegas, E.; Igual, R.; Plaza, I. Sensing systems for respiration monitoring: A technical systematic review. Sensors 2020, 20, 5446. [Google Scholar] [CrossRef]
- Massaroni, C.; Nicolò, A.; Girardi, M.; La Camera, A.; Schena, E.; Sacchetti, M.; Silvestri, S.; Taffoni, F. Validation of a wearable device and an algorithm for respiratory monitoring during exercise. IEEE Sens. J. 2019, 19, 4652–4659. [Google Scholar] [CrossRef]
- Fiamma, M.N.; Samara, Z.; Baconnier, P.; Similowski, T.; Straus, C. Respiratory inductive plethysmography to assess respiratory variability and complexity in humans. Respir. Physiol. Neurobiol. 2007, 156, 234–239. [Google Scholar] [CrossRef]
- Soni, R.; Muniyandi, M. Breath rate variability: A novel measure to study the meditation effects. Int. J. Yoga 2019, 12, 45. [Google Scholar] [PubMed]
- Martinez, A.; Brunauer, R.; Venek, V.; Snyder, C.; Jahnel, R.; Buchecker, M.; Thorwartl, C.; Stoggl, T. Development and Validation of a Gyroscope-Based Turn Detection Algorithm for Alpine Skiing in the Field. Front. Sports Act. Living 2019, 1, 18. [Google Scholar] [CrossRef] [PubMed] [Green Version]
- Montoye, A.H.K.; Mitrzyk, J.R.; Molesky, M.J. Comparative Accuracy of a Wrist-Worn Activity Tracker and a Smart Shirt for Physical Activity Assessment. Meas. Phys. Educ. Exerc. Sci. 2017, 21, 201–211. [Google Scholar] [CrossRef]
- Bland, J.M.; Altman, D.G. Applying the right statistics: Analyses of measurement studies. Ultrasound Obstet. Gynecol. Off. J. Int. Soc. Ultrasound Obstet. Gynecol. 2003, 22, 85–93. [Google Scholar] [CrossRef] [PubMed]
- Robergs, R.A.; Dwyer, D.; Astorino, T. Recommendations for improved data processing from expired gas analysis indirect calorimetry. Sports Med. 2010, 40, 95–111. [Google Scholar] [CrossRef] [PubMed]
- Passing, H.; Bablok, W. A new biometrical procedure for testing the equality of measurements from two different analytical methods. Application of linear regression procedures for method comparison studies in clinical chemistry, Part I. J. Clin. Chem. Clin. Biochem. 1983, 709–720. [Google Scholar] [CrossRef]
- Schober, P.; Boer, C.; Schwarte, L.A. Correlation Coefficients: Appropriate Use and Interpretation. Anesth. Analg. 2018, 126, 1763–1768. [Google Scholar] [CrossRef] [PubMed]
- Vlemincx, E.; Abelson, J.L.; Lehrer, P.M.; Davenport, P.W.; Van Diest, I.; Van den Bergh, O. Respiratory variability and sighing: A psychophysiological reset model. Biol. Psychol. 2013, 93, 24–32. [Google Scholar] [CrossRef]
- Bernardi, E.; Pratali, L.; Mandolesi, G.; Spiridonova, M.; Roi, G.S.; Cogo, A. Thoraco-abdominal coordination and performance during uphill running at altitude. PLoS ONE 2017, 12, e0174927. [Google Scholar] [CrossRef] [Green Version]
- Hopkins, W.G. Measures of reliability in sports medicine and science. Sports Med. 2000, 30, 1–15. [Google Scholar] [CrossRef] [Green Version]
- Villar, R.; Beltrame, T.; Hughson, R.L. Validation of the Hexoskin wearable vest during lying, sitting, standing, and walking activities. Appl. Physiol. Nutr. Metab. 2015, 40, 1019–1024. [Google Scholar] [CrossRef] [PubMed]
- Elliot, C.A.; Hamlin, M.J.; Lizamore, C.A. Validity and reliability of the Hexoskin wearable biometric vest during maximal aerobic power testing in elite cyclists. J. Strength Cond. Res. 2019, 33, 1437–1444. [Google Scholar] [CrossRef] [PubMed] [Green Version]
- Raffoul, D. Validation and Responsiveness of Wearable Biometric Technology to Monitor Cardiac and Ventilatory Parameters at Rest and During Exercise in COPD; McGill University: Montréal, QC, Canada, 2020. [Google Scholar]
- Smith, C.M.; Chillrud, S.N.; Jack, D.W.; Kinney, P.; Yang, Q.; Layton, A.M. Laboratory Validation of Hexoskin Biometric Shirt at Rest, Submaximal Exercise, and Maximal Exercise While Riding a Stationary Bicycle. J. Occup. Environ. Med. 2019, 61, e104–e111. [Google Scholar] [CrossRef] [PubMed]
- Grassmann, M.; Vlemincx, E.; von Leupoldt, A.; Mittelstadt, J.M.; Van den Bergh, O. Respiratory Changes in Response to Cognitive Load: A Systematic Review. Neural Plast. 2016, 2016, 8146809. [Google Scholar] [CrossRef] [PubMed] [Green Version]
- Andrade, A. Fractal Physiology, Breath-to-Breath Variability and Respiratory Diseases: An Introduction to Complex Systems Theory Application in Pulmonary and Critical Care Medicine. Pract. Appl. Biomed. Eng. 2013. [Google Scholar] [CrossRef]
- Boulding, R.; Stacey, R.; Niven, R.; Fowler, S.J. Dysfunctional breathing: A review of the literature and proposal for classification. Eur. Respir. Rev. 2016, 25, 287–294. [Google Scholar] [CrossRef] [Green Version]
- Leutheuser, H.; Heyde, C.; Roecker, K.; Gollhofer, A.; Eskofier, B.M. Reference-Free Adjustment of Respiratory Inductance Plethysmography for Measurements during Physical Exercise. IEEE Trans. Biomed. Eng. 2017, 64, 2836–2846. [Google Scholar] [CrossRef] [PubMed]
- Lemire, M.; Lonsdorfer-Wolf, E.; Isner-Horobeti, M.E.; Kouassi, B.Y.L.; Geny, B.; Favret, F.; Dufour, S.P. Cardiorespiratory Responses to Downhill Versus Uphill Running in Endurance Athletes. Res. Q. Exerc. Sport 2018, 89, 511–517. [Google Scholar] [CrossRef]
- Perez, W.; Tobin, M.J. Separation of factors responsible for change in breathing pattern induced by instrumentation. J. Appl. Physiol. 1985, 59, 1515–1520. [Google Scholar] [CrossRef]


| Variable | All n = 12 | Females n = 6 | Males n = 6 |
|---|---|---|---|
| Age (y) | 31.5 ± 4.5 | 32.6 ± 5.9 | 30.5 ± 2.8 |
| Height (m) | 170.9 ± 10.7 | 165.3 ± 8.6 | 176.5 ± 10.2 |
| Mass (kg) | 63.4 ± 12.7 | 56.6 ± 10.0 | 70.3 ± 11.8 |
| Sum of torso skinfolds (mm) | 29.9 ± 6.9 | 30.8 ± 8.1 | 29.0 ± 6.1 |
| Ratio chest:abdomen | 1.1 ± 0.1 | 1.1 ± 0.1 | 1.1 ± 0.1 |
| Variable | Source | Observations | Minimum | Maximum | Mean ± SD |
|---|---|---|---|---|---|
| tI (s) | CM | 3907 | 0.12 | 2.63 | 0.76 ± 0.25 |
| HX | 3907 | 0.28 | 2.81 | 0.81 ± 0.26 | |
| tE (s) | CM | 3907 | 0.17 | 3.21 | 0.86 ± 0.29 |
| HX | 3907 | 0.26 | 3.02 | 0.81 ± 0.27 | |
| tB (s) | CM | 3906 | 0.75 | 5.36 | 1.61 ± 0.51 |
| HX | 3906 | 0.73 | 5.26 | 1.62 ± 0.51 | |
| BR (bpm) | CM | 3906 | 11.2 | 73.0 | 40.5 ± 11.2 |
| HX | 3906 | 11.4 | 71.7 | 40.3 ± 11.2 | |
| ds (%) | CM | 3906 | 30.8 | 69.6 | 47.1 ± 5.0 |
| HX | 3906 | 28.3 | 73.2 | 49.9 ± 3.0 | |
| BRV (%) | CM | 3838 | 0.0 | 218.4 | 80.0 ± 32.1 |
| HX | 3838 | 0.0 | 208.8 | 77.6 ± 32.6 |
| p | TP | FP | FN | Precision | Recall | Lag (s) |
|---|---|---|---|---|---|---|
| P1 | 742 | 0 | 3 | 1.000 | 0.996 | 0.016 (−0.051,0.083) |
| P2 | 667 | 0 | 0 | 1.000 | 1.000 | 0.062 (0.013,0.112) |
| P3 | 496 | 1 | 0 | 0.998 | 1.000 | −0.011 (−0.046,0.024) |
| P4 | 887 | 5 | 1 | 0.994 | 0.999 | 0.037 (−0.056,0.131) |
| P5 | 674 | 0 | 0 | 1.000 | 1.000 | −0.064 (−0.109,−0.020) |
| P6 | 600 | 0 | 0 | 1.000 | 1.000 | 0.013 (−0.029,0.054) |
| P7 | 469 | 0 | 0 | 1.000 | 1.000 | 0.093 (0.027,0.160) |
| P8 | 479 | 0 | 2 | 1.000 | 0.996 | −0.107 (−0.196,−0.019) |
| P9 | 876 | 6 | 0 | 0.993 | 1.000 | 0.090 (0.042,0.138) |
| P10 | 527 | 0 | 4 | 1.000 | 0.992 | 0.002 (−0.063,0.068) |
| P11 | 598 | 3 | 1 | 0.995 | 0.998 | 0.007 (−0.049,0.063) |
| P12 | 801 | 0 | 0 | 1.000 | 1.000 | −0.101(−0.152,−0.050) |
| Pooled | 7816 | 15 | 11 | 0.998 | 0.998 | 0.018 (−0.067,0.104) |
| Variable | Bias | 95% LOA | Intercept | Slope | MRPE (%) | MAPE (%) | r |
|---|---|---|---|---|---|---|---|
| tI (s) | 0.051 (0.049,0.054) | (−0.112,0.215) | −0.026 (−0.038,−0.015) ** | 1.11 (1.09,1.12) ** | 6.45 (−2.85,15.76) | 8.65 (1.35,15.95) | 0.95 ** |
| tE (s) | −0.045 (−0.048,−0.041) | (−0.248,0.158) | 0.066 (0.056,0.076) ** | 0.87 (0.86,0.88) ** | −4.99 (−13.68,3.71) | 7.76 (1.42,14.1) | 0.94 ** |
| tB (s) | 0.007 (0.003,0.010) | (−0.184,0.197) | 0.002 (−0.009,0.013) | 1.00 (0.99,1.01) | 0.27 (−3.97,4.52) | 2.74 (0.00, 5.99) | 0.98 ** |
| ds (%) | 2.79 (2.64,2.94) | (−5.72,11.31) | 31.75 (28.94,34.55) ** | 0.39 (0.33,0.45) ** | 6.13 (−2.78,15.03) | 8.10 (0.94,15.26) | 0.50 ** |
| BR (bpm) | −0.19 (−0.27,−0.10) | (−4.89,4.52) | 0.148 (−0.092,0.387) ** | 0.99 (0.98,1.00) * | −0.27 (−4.52,3.97) | 2.74 (0.00,5.99) | 0.98 ** |
| BRV (%) | −0.23 (−0.34,−0.11) | (−6.72,6.26) | 0.24 (0.16,0.32) ** | 0.95 (0.92,0.97) ** | 0.77 (−49.85,51.38) | 36.24 (0.91,71.57) | 0.92 ** |
Publisher’s Note: MDPI stays neutral with regard to jurisdictional claims in published maps and institutional affiliations. |
© 2021 by the authors. Licensee MDPI, Basel, Switzerland. This article is an open access article distributed under the terms and conditions of the Creative Commons Attribution (CC BY) license (https://creativecommons.org/licenses/by/4.0/).
Share and Cite
Harbour, E.; Lasshofer, M.; Genitrini, M.; Schwameder, H. Enhanced Breathing Pattern Detection during Running Using Wearable Sensors. Sensors 2021, 21, 5606. https://doi.org/10.3390/s21165606
Harbour E, Lasshofer M, Genitrini M, Schwameder H. Enhanced Breathing Pattern Detection during Running Using Wearable Sensors. Sensors. 2021; 21(16):5606. https://doi.org/10.3390/s21165606
Chicago/Turabian StyleHarbour, Eric, Michael Lasshofer, Matteo Genitrini, and Hermann Schwameder. 2021. "Enhanced Breathing Pattern Detection during Running Using Wearable Sensors" Sensors 21, no. 16: 5606. https://doi.org/10.3390/s21165606
APA StyleHarbour, E., Lasshofer, M., Genitrini, M., & Schwameder, H. (2021). Enhanced Breathing Pattern Detection during Running Using Wearable Sensors. Sensors, 21(16), 5606. https://doi.org/10.3390/s21165606