Abstract
Over the past years, numerous Internet of Things (IoT)-based healthcare systems have been developed to monitor patient health conditions, but these traditional systems do not adapt to constraints imposed by revolutionized IoT technology. IoT-based healthcare systems are considered mission-critical applications whose missing deadlines cause critical situations. For example, in patients with chronic diseases or other fatal diseases, a missed task could lead to fatalities. This study presents a smart patient health monitoring system (PHMS) based on an optimized scheduling mechanism using IoT-tasks orchestration architecture to monitor vital signs data of remote patients. The proposed smart PHMS consists of two core modules: a healthcare task scheduling based on optimization and optimization of healthcare services using a real-time IoT-based task orchestration architecture. First, an optimized time-constraint-aware scheduling mechanism using a real-time IoT-based task orchestration architecture is developed to generate autonomous healthcare tasks and effectively handle the deployment of emergent healthcare tasks. Second, an optimization module is developed to optimize the services of the e-Health industry based on objective functions. Furthermore, our study uses Libelium e-Health toolkit to monitors the physiological data of remote patients continuously. The experimental results reveal that an optimized scheduling mechanism reduces the tasks starvation by 14% and tasks failure by 17% compared to a conventional fair emergency first (FEF) scheduling mechanism. The performance analysis results demonstrate the effectiveness of the proposed system, and it suggests that the proposed solution can be an effective and sustainable solution towards monitoring patient’s vital signs data in the IoT-based e-Health domain.
1. Introduction
Recently, Internet of things (IoT) has been defined as a revolutionary technology to develop tremendous IoT-based applications in various domains, such as smart healthcare, smart home, and smart city [1,2,3]. IoT is a huge network of connected devices, things, and objects, all of which collect and share data about how they are used and the environment around them. The main objective of the IoT platform is to allow humans and computers to interact and communicate with billions of things and objects [4]. IoT platforms for the healthcare domain are more comprehensive than traditional platforms, which use to provide better quality services to the healthcare industry [5]. IoT devices for the smart healthcare domain such as body and environmental sensors, actuators, and motion sensors work at the lowest layer. These connected devices are linked with devices of the communication layer, which use to collect sensing data from IoT devices and transfer it over the internet for further processing to address specific needs. Doctors and healthcare researchers carefully analyze the acquired sensing data using statistical analysis applications. Over the past years, various IoT-based healthcare applications have been developed to collect, process, and analyze vital signs data acquired from sensors equipped with patient’s body [6,7,8,9,10,11].
Today, electronic health (e-Health) is an emerging health service paradigm that uses information communication technologies (ICTs) to enhance traditional healthcare systems to provide better health services to remote patients. These systems are used to monitor the vital signs data of remote patients, which is transferred to the doctor through communication devices and processed for diagnosis. For instance, chronic disease patients are monitored regularly, such as patients with cardiac disease are monitored by sensing data of electrocardiogram (ECG), and patients with diabetes are monitored by sugar level. According to a study [12], half of the American adult population are diagnosed with at least one chronic condition, and one of three adults are suffering from two or more chronic diseases. Chronic diseases are causes of mortality. Out of 10 mortalities, 10 percent are caused due chronic diseases. Heart and cancer diseases are considered leading causes of death, which is reported 48% of total deaths. In traditional healthcare systems, a large number of healthcare resources, such as doctors, nurses, and therapists, continuously monitor the vital signs of patients. In recent years, different health monitoring systems have been developed and employed to collect and process vital signs data of patients using IoT devices [13,14,15]. IoT-based healthcare applications are more comprehensive to develop quality of service (QoS) requirements that differentiate them from other applications based on IoT technology.
However, there are different features such as delay sensitivity, time criticality, network cost efficiency, fault tolerance, collection, and processing of sensing data that are considered critical for real-time smart health applications based on different reasons [16]. For instance, vital signs data of patients are collected using body sensors that operate on different priorities level to monitor patient’s health conditions. In the medical domain, some of the patient’s vital signs data are considered critical [17]. Traditional healthcare systems are not well-structured to automatically generate healthcare tasks and handle the task allocation process efficiently and dynamically for high-priority healthcare tasks. Therefore, it is required to order healthcare tasks (including priority and event tasks) based on a time-constraint scheduling mechanism to minimize task allocation delays and increase throughput in terms of response time. It is also required to generate a new task in the case of emergent conditions to send notification alerts to concerned authorities in order to take appropriate actions.
Furthermore, safety is considered an essential element in smart e-Health systems. An e-Health service provider is said to be safe if it can self-diagnose sensors faults to provide reliable healthcare services to remote patients. On the other hand, the failure frequencies of sensors are also considered a challenging issue in the smart e-Health domain. If the failure frequency of sensing devices is high, then it causes to degrade the reliability of the smart e-Health system. Therefore, it is required to optimize information lost during context switching from a faulty sensor to a backup sensor and minimize sensors failure frequency to increase the reliability of the smart e-Health system.
In this study, a smart PHMS is developed to monitor the vital signs data of remote patients in the home as well as in the hospital and optimize healthcare services for providing reliable health services to remote patients. Our proposed smart PHMS consists of two main modules; healthcare tasks data monitoring using a real-time IoT-based tasks orchestration architecture and optimization of healthcare services. First, a real-time IoT-based task orchestration architecture is developed based on a self-management paradigm to monitor patient’s vital signs data effectively. Second, an optimization module is formulated using an optimization scheme based on objective function to provide reliable services to remote patients. The self-management task management architecture consists of the following steps; analysis and decomposition of complex problems into micro-problems, generation of healthcare tasks, healthcare tasks mapping, healthcare tasks scheduling using an optimized time-constraint aware scheduling, and deployment of healthcare tasks on physical devices. An optimized PSO-enabled time constraints-aware scheduling mechanism is developed to schedule healthcare tasks to handle emergent tasks effectively. The optimization module aims to optimize healthcare services based on objective function using a meta-heuristic technique to provide a reliable treatment to remote patients. The main objective of task orchestration architecture is to automatically generate healthcare tasks and dynamically handle the deployment of emergent tasks to tackle patient’s critical conditions effectively. The proposed smart PHMS is developed based on a self-management paradigm using web technology, such as front-end technology (CSS3, HTML5, and JavaScript) and backend technology (Python and Flask framework). Furthermore, for experiment purposes, a well-known Libelium e-health toolkit is used to monitor the following vital signs data of patients, such as body temperature, ECG, blood pressure, SpO2, and respiration rate. Moreover, the JMeter tool is used to record simulated data of virtual patients to conduct a series of experiments. Different performance analyses are used to evaluate the significance of the proposed smart PHMS, such as round trip time (RTT), latency, starvation, and drop rates of healthcare tasks.
The notable contributions of the proposed study is followed as:
- Development of a scheduling mechanism based on optimization and time-constraint-aware scheduling techniques using a real-time IoT-based task orchestration architecture to efficiently monitor vital signs data of remote patients;
- Development of an optimization module based on objective function to minimize information lost during context switching of sensing devices and minimize the sensor’s failure rate to improve recovery and reliability of the proposed smart PHMS;
- Development of a PSO-enabled Time-constraint aware scheduling mechanism using a real-time IoT-based task orchestration architecture to schedule healthcare tasks efficiently;
- Development of real-time IoT-based task orchestration architecture to handle the deployment of critical and emergent healthcare tasks effectively and dynamically;
- Utilization of different evaluation metrics are to evaluate the effectiveness of the proposed smart PHMS, such as RTT, latency, throughput, response time, and task drop and starvation rates.
The rest of the paper is divided into the following sections. Section 2 presents the related works; Section 3 presents architecture of the proposed smart PHMS, optimization functionality to overcome recovery and reliability challenges in smart e-Health domain, and a tasks orchestration mechanism. Section 4 presents experimental and implementation environment of the proposed smart PHMS. Section 5 discusses experimental results, performance analysis and comparison of the proposed system with state-of-art-techniques. Section 6 concludes the paper with possible future direction.
2. Related Work
This section presents existing studies related to remote patient health monitoring systems. Advancement in IoT technologies paved a revolution in e-Health systems to provide healthcare services to remote patients. Remote healthcare monitoring is today’s most vital protection system for patients who choose to stay at home for various reasons. Previously the doctor needs to check the patient in the form of physical examinations, and continuous monitoring was impossible. Hence in case of critical emergencies, continuous monitoring was impossible, which could be stressful for both patient and the doctor. In recent years, there are various IoT-based healthcare applications developed to facilitate remote patients in the healthcare domain [18,19,20,21,22]. All these IoT-based healthcare applications are used to monitor, process, and analyze the vital signs data of patients. However, there are different issues faced by traditional e-Health systems, for instance, high delay sensitivity, fault tolerance, network cost efficiency, to name a few. These systems are not consistent to handle tasks allocation process automatically to deploy healthcare tasks efficiently.
In [18], the authors presented an architecture for detection of symptoms associated with heart failure patients comprising of sensors, web servers and databases. This wireless sensor-based system detected symptoms related to heart disease to a greater extent. Jara et al. [19] utilized the sensing abilities of IoT devices and presented a mobile health framework to handle the emergency condition of patients. Another study presented in [23] to utilized smartphones for monitoring patient health status. In [20], the authors presented a detailed review on methods and techniques applied to the domain of health care services for data analysis from various wearable sensors. In [21,24], the authors developed a system for the detection of critical heart-related symptoms based on advanced remote monitoring. T. Klingeber et al. [22] presented an algorithm to improve the data fusion process to record large patient vital signs data precisely, such as ECG, blood pressure, skin temperature, to name of a few. In [25], the authors used a wireless sensor network (WSN) to monitor patient vital signs data. Another study presented in [26] integrated IoT technology in the health monitoring system to monitor and observe the health condition of remote elderly patients. In [27], the authors proposed a multi-parameters based fall detection model for elderly patients. An integrated model was proposed to combine smart-watch and accelerometer to recognize falls of elderly patients [28]. There are different existing studies attempted to utilize accelerometer, gyroscopes, and barometers to detect falls to improve the efficiency of IoT-based health monitoring systems [29,30]. The authors presented a WAN-based energy-efficient system for health care data analysis [31]. Furthermore, both [32,33] proposed two-fold encryption model to secure sensing data of remote patients to ensure data privacy and security.
Different researchers have proposed and developed cloud-based health monitoring systems to facilitate remote patients. In [34], the authors suggested an efficient health care monitoring system for elderly patients based on fog and cloud computing. The novel fog to cloud-based architecture facilitated the management of health data efficiently. In [35], the authors developed a reliable cloud-based system for ECG monitoring; the data is collected and transmitted to the IoT cloud through a wearable monitoring node. Another study presented in [36] suggested a cloud-based architecture to detect and monitor patients having Parkinson’s disease in developing countries. The developed architecture enabled healthcare practitioners to analyze voice samples of patients collected through their phones for detecting and diagnosing Parkinson’s disease. Experimental results demonstrated that the proposed architecture achieved an accuracy of 96.6%. Likewise, to detect heart rate variations, the authors presented an automated cloud-based system [37]. The system involves two databases: MIT Physionet database, and the second was composed of gathering data from thirty people through wearable sensors. In [38], the authors presented a Body-Cloud-based system involving body sensor networks for real-time monitoring of cardiac data.
Health monitoring systems are revolutionized by fog computing architecture, bringing significant improvements in telehealth and medicine. In literature, fog computing-based health monitoring architectures were proposed to address the problems of elderly patients suffering from chronic diseases. These architectures provide efficient network resource utilization, such as network bandwidth, etc. Hence, smart mobile device users are provided with real-time information close to the network edge. Based on these concepts, we can categorize the literature into two sections: fog computing-based patient health care monitoring system and remote health care monitoring system using IoT. In [39], the authors proposed an improved fog computing system based on the cloud. This system aids the real-time applications through analysis of biosignals at the fog server end. In [40], the authors implemented a gateway named smart e-health to be utilized in fog computing layers. A practical implementation of IoT-based early warning score related to health monitoring was also done to prove the efficient working of the system [41].
In IoT-based health applications, task scheduling is an essential process to order healthcare tasks correctly for efficient deployment. The dynamic task scheduling process helps to minimize latency and maximize throughput. However, traditional e-Health systems are developed based on static task generation and scheduling mechanisms to handle the health task allocation process [42]. The authors defined a task allocation problem as an integrated linear model, which aims to minimize latency during resources requested by a particular task. In [43], the authors proposed an event triggering-based model to process real-time data of patients. The authors defined various health tasks to acquire and process real-time patient data. In another study presented in [44], a prototype-based architecture was presented to consider speech motor disorders patient’s data as a case study. The authors focused on the static allocation of health tasks to acquire patients data to analyze and diagnosis for better treatment. In [45], the authors proposed a fall-detection algorithm to detect the fall of elderly patients based on a static task allocation mechanism.
Different researchers propose different task scheduling mechanisms to tackle the allocation process of tasks in different domains [46,47,48,49,50,51]. In [46], the authors developed an efficient IoT-based service delegation and resource allocator system for managing and delegating requests of users to their appropriate fog/cloud. The study presented in [47] utilized predict earliest finish time (PEFT) algorithm that works on the concept of optimistic cost table to prioritize tasks and selecting processor. In [48], the authors proposed a novel method of the clustering algorithm to schedule multi workflows in a cloud computing environment. In [49], the authors proposed a novel solution to the problem of fault tolerance, optimal resource allocation, and minimizing overflow of a resource based on an efficient resource allocator (ERA). In [50], a new scheduling strategy was developed to achieve a trade-off between the performance of the application (in terms of execution) and the associated cost of cloud resource usage to provide better quality services. In [51], the authors used data mining (using Apriori) techniques for task scheduling in Fog computing-based devices. Experimental findings state that the proposed algorithm has achieved better execution time and average wait time. Furthermore, Table 1 summarizes existing health monitoring systems based on different paradigms to facilitate remote patients in homes and hospitals.

Table 1.
Summary of the existing healthcare systems.
To the best of the author’s knowledge, all of the aforementioned IoT-based e-Health systems are developed based on static task scheduling and allocation. Moreover, all these existing are not well-structured to generate autonomous health tasks and handle the task allocation process for high priority health tasks dynamically. Furthermore, all these existing IoT-based e-Health systems faced different issues, such as delay sensitivity, time criticality, high fault tolerance, high network cost, to name a few. Therefore, a new solution is required to monitor patient health conditions based on efficient task orchestration architecture, which aims to minimize latency, maximize throughput, and handle emergent health tasks effectively. It is also required to optimize wireless network cost to drive optimal healthcare tasks scheduling decisions to provide cost-effective health services to remote patients. Furthermore, an ideal IoT-based smart PHMS should provide safety in terms of recovery and reliability.
3. Materials and Methods
This section presents materials and methods used for development of the proposed smart PHMS.
3.1. Design of Proposed Smart PHMS
This subsection presents proposed architecture of smart PHMS. Figure 1 presents a proposed architecture diagram of the proposed smart PHMS. The proposed smart PHMS architecture consists of the following layers: generation of healthcare tasks, optimization of healthcare services (solution layer), mapping healthcare tasks on virtual objects, optimized scheduling mechanism, deployment of healthcare tasks on physical IoT devices.
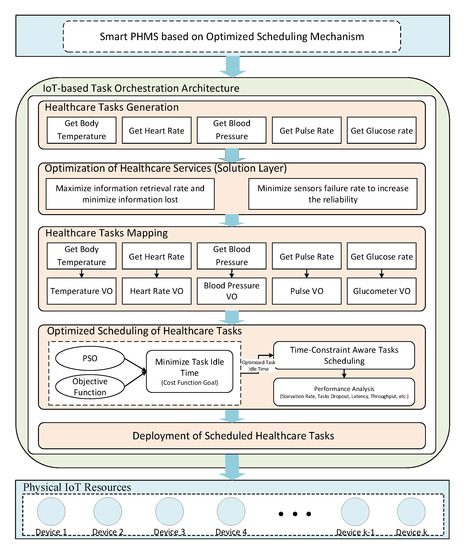
Figure 1.
Proposed architecture of Smart patient health monitoring systems (PHMS).
Task generation layer incorporates into following sub-layer to generate healthcare tasks. It includes the decomposition of the problem layer into multiple sub-problems. Each sub-problem is decomposed into healthcare tasks using natural language processing (NLP). In the solution layer, each sub-problem consists of one or many goals, such as proposed smart PHMS is said to be safe if it minimizes information lost during context switching process and sensors failure rate to increase the reliability of the developed system. The solution layer consists of the following mathematical formulations, which aim to minimize information lost during context switching of sensors and minimize sensors failure rate to provide a safe and reliable environment to remote patients. In the healthcare tasks mapping, generated healthcare tasks are mapped on virtual objects (VOs) to formulate tasks and VOs pairs. Next, an optimized task constraint-aware scheduling mechanism is developed based on objective function to optimize task idle time to enhance the scheduling process. In the virtualization layer, virtual objects are generated for physical devices to perform tasks related to the IoT environment. Finally, the physical resource layer consists of the physical IoT devices, such as sensors and actuators nodes. The sensing nodes are used to sense data from installed or equipped sensors with the patient body, while actuators are responsible for executing generated control commands through installed actuators. The ultimate goal of this work is to facilitate remote patients by providing a safe and reliable environment.
3.2. Mathematical Formulations for Smart PHMS
This subsection presents mathematical problem formulation to optimize health monitoring services to remote patients. The optimization module aims to minimize information lost during context switching of sensors and tasks failure frequency. The safety problem for remote patient’s health monitoring in both home and hospital is to self-diagnosis sensor fault to increase the reliability of health services for remote patients. This paper uses an optimization approach to formulate information loss recovery (ILR) to minimize information lost during context switching from a faulty sensor and backup sensor. Table 2 presents notations and symbols used in this problem formulation.
Table 2.
Description of notations and symbols used in the formulation.
There are several assumptions to formulate objective function, for example, N number of available sensors to collect data from patients , K number of additional sensors to tackle sensors replacement issues . Thus, ratio can be calculated as follows in Equation (1).
index is defined as the ratio of total retrieve information from each sensing device fault and the lost information for sensing device fault . Thus, the ratio is calculated as follows in Equation (2).
By integrating Equation (1) and Equation (2), we form an objective function, which aims to maximize information retrieval rate and minimize information lost during context switching from a faulty sensor to a backup sensor. The following Equation (3) is used to calculate the information loss recovery index:
Thus, an objective function is defined as an Equation (4) to minimize index during context switching of sensing devices.
The second problem is related to reliability is the failure frequencies of sensors. If the failure frequency is high, then the overall reliability of the system will be low. Therefore, we propose an optimized approach based on the objective function, which aims to minimize sensor’s failure frequency to increase the reliability of the sensing data of the proposed smart PHMS. It enables smart PHMS to verify that acquired sensing data are correct. It validates sensing data of each sensor by using upper and lower threshold values. If sensing values lie between upper and lower threshold values bounds, it ensures that acquired data is corrected; otherwise, it will be considered a sensor fault, and sensing data will not be considered for patient health analysis. There are following assumptions, such that the sensor of the patient health monitoring system collects n data samples in the time interval t, sequence of the data can be represented as , then the real data condition is defined as follows in Equation (5):
where and are threshold functions, such as lower and upper threshold functions of sensor at time interval t. Both threshold functions validate sensing data whether it lies in a valid range or not. In this way, It will enhance the reliability of the proposed smart PHMS if sensing values fall between lower and upper threshold functions. The performance of distortion fault of sensor discrete point data is defined based on the upper and lower threshold formula shown in Equation (6):
The mathematical formulation for sensor distortion fault is followed in Equation (7), where a indicates the average value of the ratio of maximum and minimum values of measurement signal data of sensor of proposed smart PHMS. The following Equation (7) is used to obtain sensor failure faults for sensing data x for sensor at time interval t.
The linear minimum mean variance of the corresponding fault signal is estimated to determine the threshold value of generalized quasi natural ratio [52] is shown in Equation (8).
Our objective function aims to minimize sensors failure rate is shown in Equation (9):
The final objective function is defined in Equation (10), which aims to minimize information lost during context switching process of faulty and backup sensors and minimize sensors failure to increase the reliability of the proposed smart PHMS. The and are the weighting parameters of the functions and .
3.3. Task Orchestration Architecture for Smart PHMS
This section presents a detailed architecture of the task orchestration in a health monitoring system, which aims to get sensing data from remote patients in an effective way.
The proposed task orchestration module consists of the five-layered architecture, such as service analysis and decomposition of services into microservices, task generation using NLP techniques, task/virtual object pair generation and mapping, optimal task scheduling, task allocation and deployment, as shown in Figure 2.
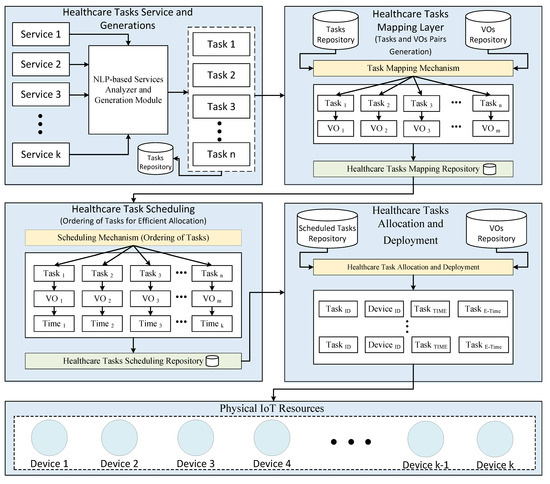
Figure 2.
Task Orchestration Architecture for Efficient Tasks Allocation in Smart PHMS.
Each layer performs a unique functionality towards the main functional goal. The main objective of the proposed architecture is to utilize task composition through NLP techniques and VOs mechanism to allocate the given health-related tasks on VOs in a smart health monitoring system efficiently. The physical IoT resource layer consists of installed physical devices, such as sensors and actuators. The installed sensors are used to sense and transfer remote patient’s health data to IoT servers. There are different sensors equipped with the patient body, for instance, temperature sensor, heart rate sensor, blood pressure sensor, pulse rate sensor, to name a few. In addition, the following actuators, such as alarm and notification actuators, are used to send alert messages to healthcare practitioners in an emergency.
3.3.1. Service Analysis and Decomposition of Health Tasks
This subsection presents the service analysis and decomposition layer of the proposed task orchestration architecture. In this layer, users use a self-management approach to enters service titles and concise descriptions. This layer is responsible for analyzing and decomposing services into micro-services based on NLP techniques using a service analyzer. The NLP techniques are the most commonly used techniques in text mining to discover hidden insights and useful information from text, such as tokenization, part of speech (POS) tagging, stemming, a bag of words, to name a few. These techniques also help the machine to understand and process the meaning of human languages. The service analyzer uses service title and description as an input and then decomposes the given service into multiple micro-services using NLP techniques. Furthermore, service analyzer uses parts of speech (POS) tagging mechanism to investigate service description to discover a verb, which is essential to identify the type of the micro-service. Finally, the micro-service analyzer is used to examine micro-service to generate input tasks based on a concise description of the micro-service using NLP techniques. The basic flow of the task generator manager (TGC) is illustrated in Figure 3.
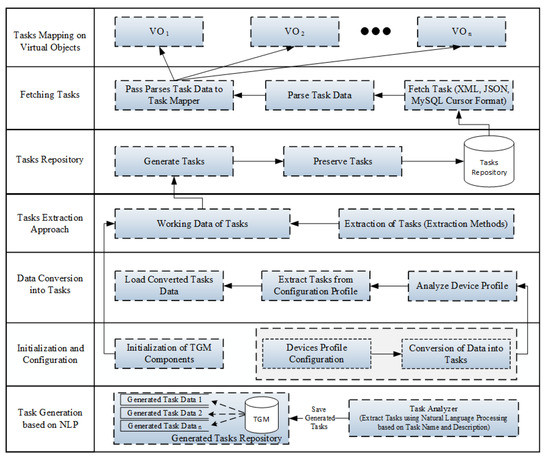
Figure 3.
Basic flow of automatic generation of health tasks.
Once input tasks are generated, TGC receives generated tasks from the micro-service analyzer and saves them into task data storage. The generated tasks are categorized as periodic or event based on the adverb, followed by the sentence’s main verb. For example, there are the following tasks extracted automatically from the service title and description, such as getting body temperature, getting heart rate, getting patient blood pressure, and getting pulse oximeter. In addition, there are the following tasks to transfer sensing data from sensing devices to doctor using IoT Server, such as report body temperature, report heart rate, report patient blood pressure, report pulse oximeter, etc.
3.3.2. Virtualization of IoT Resources
This layer is responsible for the virtualization of IoT resources, such as the virtualization of physical devices. The virtual resource manager (VRM) creates VOs and provides an interface for performing CURD operations on VOs. These VOs are used to act as physical objects (POs) and hold all the essential properties of the POs along with additional properties of the IoT virtualization environment. The behavior of the VOs is defined based on functions associated with POs and other information, such as URI and location. The VRM is also responsible for identifying communication protocol and other data properties, including data validation. VRM also provides graphical representation to visualize VOs, such as ECG icon graphical represents a heart rate sensor. Finally, we store created VOs through a virtualization mechanism in a virtual object repository.
3.3.3. Task/Virtual Object Pair Generation and Mapping
This layer is used to associate generated tasks with created VOs in order to generate best-matched pairs of input tasks and VOs. The generated tasks are retrieved from the tasks repository, and VOs are fetched from the VOs repository to generate best-matched pairs for the given tasks and VOs for the execution process. Each generated healthcare task is associated with one or more VOs. The combination of VOs and generated tasks are used to form URI. The URI contains information, which is used to measure the output of a certain process. The URI is also used to access physical devices in the proposed task orchestration architecture. The task mapping controller (TMC) is used as a design component to map the input tasks on VOs. It is also responsible for monitoring and managing the overall process of the mapping mechanism. It allows users to use a self-management approach to select a task from the given tasks list and map it on the related virtual object using the drag and drop feature to form a best-matched pair. The drag and drop feature provides a user interface to establish a connection between task and virtual object by dropping a solid line from a task in tasks list to a virtual object in the VOs list. TMC use to visualize the established connection between the tasks list and VOs list. Furthermore, it is used to store a mapping configuration in the task mapping repository for further processing. The typical task mapping entity consists of the following attributes: task id, virtual object id, and created timestamp at which the task mapping occurs. The output of the task mapping process is defined as a message, which contains the following parameters listed in Table 3.
Table 3.
Message profile parameters.
3.3.4. Healthcare Task Scheduling for Efficient Resource Utilization
The main objective of task scheduling is to schedule tasks on IoT devices efficiently and effectively. The task scheduler manager (TSM) is responsible for arranging the correct order of input tasks for efficient execution and resource utilization. TSM uses following task attributes, such as execution time, deadline, priority, urgency, sensing, and control tasks, to plan execution order for the given input tasks. TSM uses three-dimensional space to order tasks execution. The three-dimensional space consists of the following dimensions, such as input task T, virtual object (VO) on which the given task T is scheduled, and timestamp t at which the task T is scheduled on VO. TSM receives task list from task repository, VOs list from VOs repository, and output of TMC to initialize the scheduling process using scheduling algorithm. In this research study, an optimized time-constraint aware scheduling approach is used to plan the execution order of the mapping pairs. It is adequate and robust compared to other scheduling approaches because it executes tasks based on system and user constraints (i.e., idle task time, priorities) and different influential factors, such as current task starvation, missing rate, and delays rate, etc. The proposed optimized time-constraint-aware scheduling mechanism is proposed to minimize task idle time to enhance the performance of the scheduling process. To optimize task idle time, an objective function is developed to enhance the performance of the scheduling mechanism. Furthermore, we used an evolutionary technique, such as particle swarm optimization (PSO), to minimize task idle time based on objective function to provide reliable healthcare services to remote patients. PSO is a widely used population-based optimization technique inspired by the flying behavior of birds swarms in nature, such as swarm (group) of birds searching for food [53]. It is an SP technique based on swarm intelligence and can be adapted in many areas to search for the best possible solution in the given multidimensional space [54]. In PSO, each particle has been evaluated using an objective function (cost function) to determine local best and global best positions of particles. Then, it uses both and positions of particles to update the velocities and moved towards an optimal solution. Next, it uses a velocity vector to calculate particle speed and direction. Finally, each particle position has been updated to determine the global optima.
In a smart PHMS, there are two types of healthcare tasks: periodic and event-based healthcare tasks. Periodic healthcare tasks are categorized into two sub-types: priority tasks (PT) and normal tasks (NT). Similarly, event-based healthcare tasks are categorized into two sub-types: urgent event tasks (UET) and normal event tasks (NET). Therefore it is essential to propose an optimized scheduling mechanism to handle emergent healthcare tasks effectively. Hence, our work proposes a PSO-based optimized time-constraint aware scheduling mechanism to dynamically and effectively schedule emergent healthcare tasks. Furthermore, a PSO-assisted optimization model is developed based on objective function to minimize task idle time for enhancing time-constraint aware scheduling algorithm. Table 4 presents summary of the notations used in the optimization problem formulation.
Table 4.
Notations used in optimization problem formulation.
It can be observed that there are several observations, for example, there are N number of healthcare sensing devices and K number of healthcare tasks for each sensing device. Furthermore, different notations are used in the given formulation, for instance, start time, finish time, execution time, and task idle time, etc. The objective function is defined based on the listed notations to minimize task idle time. Task idle time is defined as the difference between and as shown in Equation (11).
Thus, task idle time is defined as follows in Equation (12):
Our defined objective function aims to minimize than predetermined value. The final objective function is presented in equation to minimize completion time of healthcare task to provide efficient healthcare services to remote patients.
There are following constraints with objective function to minimize for effective scheduling of healthcare tasks.
- must be greater than 0 and less than , For instance, .
- of healthcare task must be greater than 0 .
Furthermore, two decision measures, such urgency measure (UM) and failure measure (FM), are considered to formulate a decision on whether to execute a task or not. UM defines the priority of tasks at which arrived tasks will be executed. Furthermore, UM is calculated based on NET and periodic PT. It is defined as follows in Equation (14):
Similarly, Algorithm 1 presents a step by step flow to calculate FM between PTs. FM is calculated to decide execution of the given periodic task.
| Algorithm 1 Calculation of Failure Measure for Scheduling of Periodic Tasks. |
| function CALCULATEFAILUREMEASURE() |
| for do |
| end for |
| if then Return 1 |
| else |
| Return 0 |
| end if |
| end function |
It is defined based on periodic tasks to decide whether to execute a given periodic task or not. FM ensures that if the scheduler executes a low priority starved task at a given time slot i, it will not affect high-priority periodic task execution. Furthermore, it determines task slack for each given periodic task to ensures the safe execution of a task. Slack time can be calculated as the difference between task deadline time and task execution time. Moreover, if the slack time of the given periodic tasks is greater than 0, then FM will be set to 1; otherwise, it will be set to 0.
Algorithm 2 presents the flow of proposed optimized time-constraint aware scheduling mechanism.
Furthermore, Figure 4 presents a step-by-step flow of the proposed optimized time-constraint aware scheduling mechanism. In the first step, scheduler fetches healthcare tasks based on arrival times. If an arriving healthcare task is UET, then it executes at the given time interval. If the given healthcare task is NET and there is periodic PT, then task idle time is calculated and passed to the optimization module. PSO-based optimization module receives task idle time and minimizes it based on the objective function. If is minimal than , then schedular executes NET with the nearest deadline; otherwise, UM is calculated to verify that the given time slot can be allocated to a periodic PT or not. If UM is set to 0, then the schedular executes the given periodic PT; otherwise, NET will be executed in the given time slot.
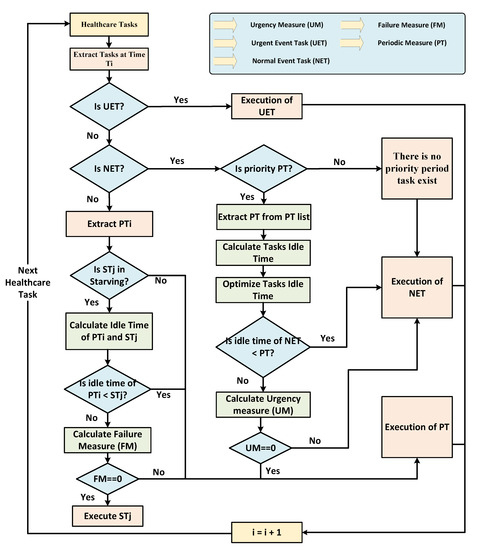
Figure 4.
Flow of the proposed time-constraint aware scheduling mechanism.
Next, if the given task is periodic PT and there are starved tasks in the starvation tasks list, then extracts starved task (ST) from the starvation list and idle time is calculated for both tasks to be passed to the optimization module aims to minimize task idle time. If the idle time of PT is lower than ST, then the scheduler executes PT at the given time slot; otherwise, FM is calculated to allocate the given slot to execute a starved task or not; otherwise, it executes periodic PT with high priority. FM is calculated using periodic tasks to decide the execution of periodic PT with high priority or execution of starving tasks. The scheduler uses tasks profile and history log data to calculate FM to determine whether to execute periodic PT or starvation tasks with low priority.
The scheduling process re-arranges the execution order of the mapping pairs and adds two additional attributes, such as task execution time and priority, to the existing task mapping process. Once the scheduling process is performed, TSM saves scheduling results in scheduling database in the following format <heathcare_task_id,virtual_object_id,scheduled_ task _time,healthcare_task_priority>.
| Algorithm 2 An Optimized Time-Constraint Aware Scheduling Mechanism | |
| function HEALTHCARETASKSSCHEDULING (, ) | |
| ▹ Input: Array of the given tasks and and is the time step at which tasks arrived in the queue for the execution. | |
| ▹ Urgency measure | |
| ▹ Failure measure | |
| if then | ▹ Urgent Event Task (UET) |
| Execute the UET | |
| else if then | ▹ Normal Event Task (NET) |
| if then | ▹ Periodic Task(PT) |
| Extract at time slot i from | |
| Calculate and using Equation (12) | |
| if then | |
| Execute the NET with nearest deadline | |
| else | |
| Calculate using Equation (14) | |
| if then | |
| Execute the with nearest deadline | |
| else | |
| Execute the NET with nearest deadline | |
| end if | |
| end if | |
| else | |
| Execute the NET with nearest deadline | |
| end if | |
| else if then | |
| if then | ▹ represents starved task |
| Extract at time interval i from | |
| Calculate and using Equation (12) | |
| if then | |
| Execute the High Priority PT | |
| else | |
| Calculate using Algorithm 1 | |
| if then | |
| Execute Low Priority Starving Task | |
| else | |
| Execute the High Priority PT | |
| end if | |
| end if | |
| else | |
| Execute the High Priority PT | |
| end if | |
| else | |
| Invalid Task Type | |
| end if | |
| end function | |
3.3.5. Allocation and Deployment Process of Scheduled Healthcare Tasks
The task allocation manager (TAM) uses scheduling results to allocate the input task on a designated physical IoT device. It is also used to save task/device allocation information. For allocation purposes, TAM uses information from the following repositories, such as task repository, VOs repository, and scheduling repository, to allocate the tasks on the IoT devices; sensors and actuators. Furthermore, TAM uses virtual object ID to track down the status of physical IoT devices in the task allocation process. Finally, a task deployer is used to deploy the task on the corresponding IoT device. It uses to allocate and deploy the tasks based on the order received from the task scheduling manager for allocation purposes. For example, TAM deploys healthcare tasks on corresponding physical devices based on the healthcare tasks scheduling results of the optimized time-constraint aware scheduling mechanism. The URI attribute of the VO is used to access the corresponding physical device.
4. Experimental Environment of Proposed Smart PHMS
This section presents the development and experimental environment of the proposed smart PHMS. The proposed smart PHMS uses python as the core programming language for implementing the proposed task orchestration architecture. Python is a high-level, general-purpose programming language. Different researchers and programmers widely use it to develop projects because it is easy to learn, robust and scalable due to frequent version releases [55]. This work uses PyCharm Professional 2020 as an IDE for python programming. Flask framework has been utilized as a web-based lightweight framework to enable customization and accelerate the implementation process. Flask is a lightweight and efficient web-based framework as compared to other frameworks [55,56]. The well-known JavaScript library JSPlumb is used to map tasks on VOs to generate best-matched pairs. Furthermore, MySQL is used as persistence storage, whereas JSON and XML are utilized to fetch data from MySQL to the front-end application. Moreover, Bootstrap has used Bootstrap as a front-end framework to develop a front-end application to achieve dynamic behavior. In Table 5, an implementation environment of the proposed smart PHMS is presented.
Table 5.
Development Environment of Proposed Smart PHMS.
Figure 5 presents experimental testbed of the proposed smart PHMS. In this work, a Libelium toolkit is used to monitor remote patients health conditions. The e-health toolkit provides nine different sensors for monitoring the real-time health state of remote patients. The information acquired using the e-Health sensor shield can be used to monitor remote patient vital signs or used to acquire sensitive data for analyzing for medical diagnosis. In this work, we have used five different sensors in order to monitor the health conditions of remote patients, such as body temperature, electrocardiogram, pulse oximeter, airflow, and sphygmomanometer sensors. Furthermore, e-Health toolkit provides an open-source API to get sensing data from sensors equipped with remote patients body. In this work, all five healthcare sensors are equipped with remote patients to acquire healthcare data and send sensed data to health service providers, such as hospital, doctors, and nurses. Furthermore, Aurdino is connected with a personal computer (PC) to store sensing data into a database. PC is used to store vital signs data from the Aurdino. Moreover, healthcare sensors are connected with Aurdino to read the vital signs data of patients. The vital signs data of the following sensors like temperature, ECG, blood pressure, pulse oximeter, and airflow are received and processed to monitor patient health. Suppose the reading values of patients and vital signs are abnormal. In that case, event listeners are activated to send alarm notifications in the form of text and voice to the doctor and nurse practitioner to take appropriate action.
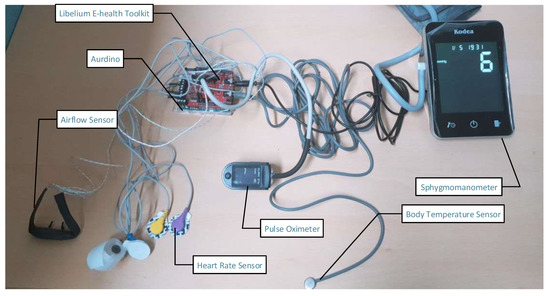
Figure 5.
Experimental testbed of proposed smart PHMS.
Table 6 summarizes the installed healthcare sensors with certain parameters. The certain parameters are normal range, abnormal range, and the main objective of the installed sensors in order to collect valid data from remote patients. The normal range of temperature sensor is from 36.5 °C to 37.5 °C (97.7 °F–99.5 °F), whereas the abnormal range of patient body temperature is from 40.0 °C to 41.5 °C (104–106.7 °F). Similarly, a heart rate sensor is used to measure the electrical activity or rhythm of the heart. The normal range of patient heart rate must be up to 120 ms, whereas the abnormal range must be less than 120 ms. The SpO2 or pulse oximeter sensor monitors the amount of saturation oxygen in the patient’s blood. The normal reading of the pulse oximeter sensor should be between 94% and 100%, whereas if it is less than 90%, then it denotes as abnormal. Similarly, an airflow-based sensor is used to measure the total number of breaths a patient takes per minute. The normal respiration rate should be between 15 bpm and 30 bpm, whereas resting is considered as the abnormal readings. Furthermore, a sphygmomanometer sensor is used to measure blood pressure. It is used to record both systolic and diastolic pressures. The normal range of systolic pressure should be from 90 mm Hg to 119 mm Hg, whereas the normal range of diastolic pressure should be from 60 mm Hg to 79 mm Hg. The abnormal range of systolic pressure is above 119 mm Hg, whereas the abnormal range of diastolic is above 80 mm Hg.
Table 6.
Threshold for reading vital signs data.
Furthermore, Figure 6 presents a visualization of vital sign data of remote patients using the Libelium sensors toolkit as discussed earlier in the testbed scenario. In this study, reading of the following vital signs data is visualized, such as temperature, heart rate, blood pressure, pulse oximeter, and respiration rate. It can be observed that the body temperature data varies mostly between the valid temperature ranges (97.8 °F to 106 °F). The normal temperature is 98 °F, and the abnormal temperature is 106 °F. Similarly, It can also be observed that the data of the patient’s heart rate (ECG) varies mostly between the following ranges (0 ms to 200 ms). Normal resting heart rate is 60 to 100 beats per minute (bpm). Abnormal heart rhythms can be described as a heart beating too fast (above 100 bpm) or slow (below 60 bpm). Likewise, reading of patient’s blood pressure data are visualized; it has been analyzed that the blood pressure data varies between 70 mm Hg and 120 mm Hg. The blood pressure data of patients can be classified into the following six categories using systolic and diastolic blood pressures: hypotension, desired, prehypertension, stage 1 hypertension, stage 2 hypertension, and hypertensive crisis. Equation (15) specified the categories of blood pressure using systolic blood pressure and diastolic blood pressure readings.
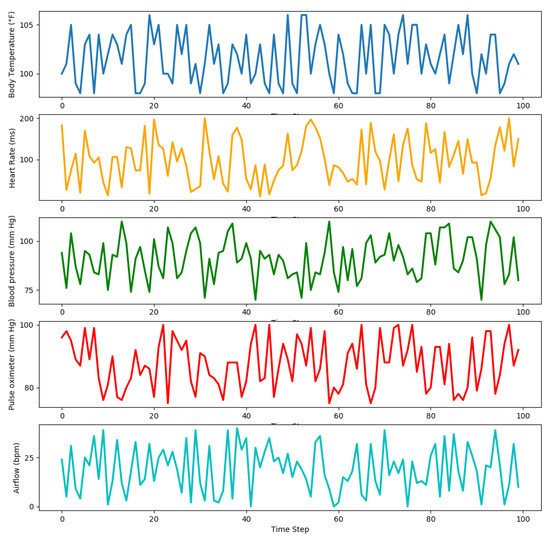
Figure 6.
Visualization of healthcare tasks reading data using different sensors.
Furthermore, SpO2 readings are also visualized to analyze pulse and oxygen quantity in patient blood. The normal SpO2 varies between 95% and 100%, as shown below the graph. Normal pulse oximeter readings usually range from 95 to 100 percent. Values under 90 percent are considered low. Abnormal values can be considered as a pulse oximeter is too low (<90). Moreover, readings of the respiration rate of patients are also visualized. The airflow sensor readings show that respiration rate varies between normal and abnormal ranges. For example, the patient’s respiration rate is normal if the reading of the airflow sensor varies between 15 bpm and 30 bpm; otherwise, it will be abnormal. Different vital signs data of patients are received and analyzed to monitor the health status of patients. In case of abnormal readings, our proposed system will alert healthcare practitioners to take appropriate action. In our proposed smart PHMS, event listeners are deployed in the system to inform healthcare practitioners about the emergencies.
5. Performance and Comparative Analysis
This section presents performance and comparative analysis results of the proposed smart PHMS.
5.1. Performance Analysis
This subsection presents RTT, throughput, latency, and response time analysis to evaluate the performance of the proposed smart PHMS. In this research study, a benchmark tool known as Apache JMeter has been utilized to evaluate the performance of the proposed mechanism [58,59,60]. For the simulation of subjects, we used Locust. There are three different subject sets defined, such as 30 subjects, 40 subjects, and 50 subjects, to evaluate the performance of the proposed system. The RTT is defined as the total time takes by the system from the generation of healthcare tasks to the deployment process and response of IoT devices back to the self-management application. Figure 7 is used to present RTT-based statistical analysis, such as minimum RTT, maximum RTT, and average RTT for each given healthcare task. It is evident that the average RTT is 4.6 ms in the case of event-driven healthcare tasks, for instance, ’NotifyViaLED’. On the other hand, the minimum, maximum, and average RTT for the ’GetECG’ task are 16 ms, 32 ms, and 25.2 ms, respectively. Thus, the average RTT is 13.02 for all the executed healthcare tasks, which shows the effectiveness of the proposed smart PHMS. The minimum RTT for the given tasks is 3 ms, and maximum RTT is 32 ms.
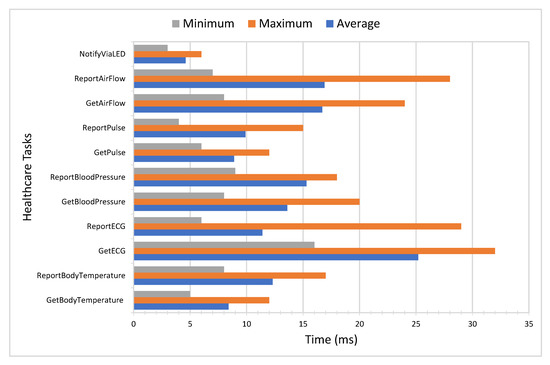
Figure 7.
Performance analysis of proposed architecture in terms of round trip time.
Figure 8 presents different statistical measures to evaluate the throughput of the proposed system using a different set of subjects. The x-axis represents different subjects groups, whereas the y-axis represents throughput as the total number of healthcare tasks executed per second.
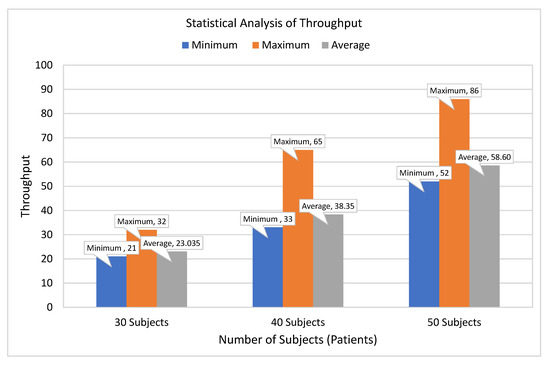
Figure 8.
Statistical analysis of healthcare executed tasks per second.
It can be observed that minimum, maximum, and average throughput for 30 subjects is 21, 32, and 23 tasks per second. It can also be observed that the throughput of the system improved as the number of subjects increased. It has been analyzed that the throughput of the system gets enhanced as the number of subjects increases from 30 to 40 subjects. Finally, the average throughput for 50 subjects is approximately 59 tasks per second, which shows the usability of the proposed system.
Figure 9 is used to evaluate the performance of the proposed system in terms of tasks latency. To evaluate tasks latency, we have considered three different subjects to evaluate the latency of executed healthcare tasks in terms of minimum, maximum, and average latency. The average latency for 30 subjects is 15.49 ms, whereas minimum and maximum latency for 30 subjects are 4.28 and 37.52 ms, respectively. Similarly, in the case of 40 subjects, the average latency of executed tasks also get increased from 15.49 ms to 21.72 ms. Furthermore, the average latency of executed tasks for 50 subjects is 37.18 ms. Thus, the statistical analysis shows that the average latency of executed tasks increases slightly as the number of subjects increases, which indicates the significance and reliance of the proposed smart PHMS.
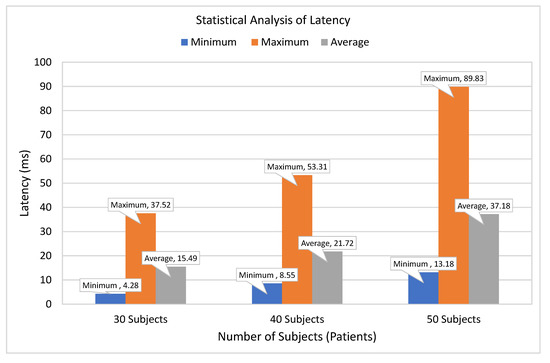
Figure 9.
Latency of healthcare tasks deployment.
In Figure 10, another performance metric is utilized to evaluate the performance of the executed tasks in terms of response time. A comparative analysis is presented to evaluate executed healthcare tasks in terms of average response time. The average response time values of periodic healthcare tasks fluctuate between 62 ms to 150 ms. In contrast, the average response time values of the event-based task are varied between 27 ms to 93 ms. The comparative analysis shows that the average response time of event tasks is slightly low compared to periodic tasks because event-driven tasks have high priority compared to the sensing healthcare tasks.

Figure 10.
Performance analysis of event and periodic healthcare tasks in terms of Response Time.
In Figure 11, a comparative analysis is presented to compare baseline scheduling mechanisms with an optimized scheduling mechanism to demonstrate the significance of the proposed smart PHMS. The performance analysis of the proposed optimized scheduling mechanism is compared with fair emergency first (FEF) scheduling and rate monotonic (RM) scheduling schemes. The comparative analysis is performed based on the reading of vital signs data of remote patients. The following essential metrics are taken into account to analyze the performance of the scheduling mechanism, such as starvation and drop rate of healthcare tasks.
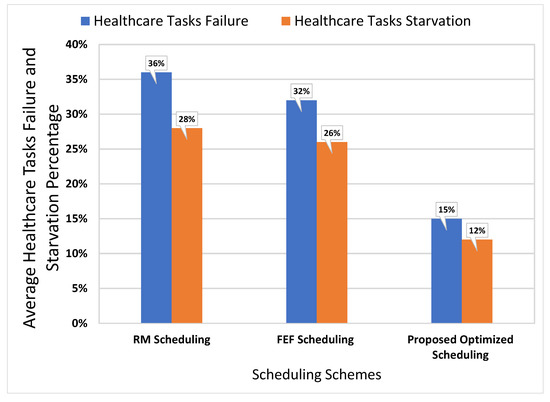
Figure 11.
Performance analysis of event and periodic healthcare tasks in terms of Response Time.
It is evident that the failure and starvation rate of healthcare tasks using an optimized scheduling mechanism is minimal compared to the FEF and RM scheduling mechanisms. The starvation rate and a dropout rate of our proposed optimized scheduling mechanism are 12% and 15%, respectively. In contrast, starvation and tasks failure rates of the baseline RM scheduling mechanism are 28% and 36%, respectively. Similarly, starvation rate and drop rate of healthcare tasks of the baseline FEF scheduling scheme are 26% and 32%, respectively. Based on the analysis, it is found that the proposed optimized scheduling mechanism reduces tasks starvation rate by 16% and tasks failure rate by 21% compared to the baseline RM scheduling scheme. It can also be analyzed that the proposed scheduling scheme reduces the starvation rate of healthcare tasks by 14% and tasks failure rate by 17%. Thus, the comparative analysis demonstrates that an optimized scheduling mechanism minimizes the starvation and failure rates of healthcare tasks and increases the overall performance of the proposed smart PHMS.
Figure 12 depicts a comparison of actual recovery time and optimized recovery time of sensors from faults. The y-axis represents the actual and optimized recovery time in which a faulty sensor is replaced with a backup sensor to monitor a patient’s data effectively. The x-axis represents a simulated number of sensing devices used to monitor a patient’s health conditions. The main objective of the optimization module is to minimize the ILR index based on the time taken (in terms of minutes) by sensing devices to recover from the faults. As a result, it can be observed that the recovery time of the faulty sensors is minimized as compared to actual recovery time, which significantly increases the information retrieval ratio and decreases the information lost ratio during the context switching process of the faulty sensor to the backup sensor. The average recovery time of the baseline scheme is 37 min (m), and the average optimized recovery time using stochastic programming (SP) is 30 m. The comparison results proved that our proposed SP approach significantly minimizes the recovery time of the sensors from fault failure and improves the information retrieval ratio for better health data analysis.

Figure 12.
Comparative Analysis of Actual and Optimized Sensors Failure Recovery Time (m).
Similarly, Figure 13 presents a comparison of actual and optimized sensors failure frequency on an annual basis. The y-axis represents the average and optimized sensors failure frequency. The x-axis represents a simulated number of sensors. The main objective of the proposed optimization module is to minimize the sensor’s failure frequency to improves the reliability of the proposed system to provide reliable health services to remote patients. It can be observed that sensors failure frequency is significantly reduced using the optimization scheme compared to the actual annual frequency of sensors failure faults. The average actual frequency of sensors failure is 306, and the average optimized sensors failure frequency is 157 on an annual basis. The comparison results revealed that our proposed SP approach significantly improves the reliability of the proposed PHMS.
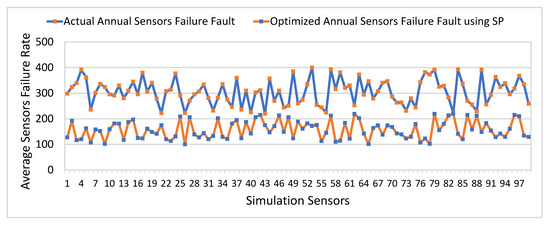
Figure 13.
Comparative Analysis of Actual and Optimized Sensors Failure Frequency (Annually).
5.2. Comparative Analysis
This subsection presents a comparative analysis of the proposed smart PHMS with existing IoT-based e-Health systems. To the best of the author’s knowledge, our proposed smart PHMS is the first-ever attempt from the e-Health industry to utilize task orchestration and optimization-based mechanisms to provide reliable and cost-effective health services to patients. There are essential features are considered to demonstrate the effectiveness and significance of the proposed work. These vital features include self-management support, type of application, the simulation of patients data, tasks level management including tasks allocation and tasks scheduling mechanisms, and optimization functionalities to provide reliable and cost-effective health care services. The existing IoT-based e-Health systems, such as H-IOT [8], PHMS [22], HAMS [24], WSN [25], VSM [43], and HI-IOT [61] are developed based on static tasks allocation and tasks scheduling mechanism to monitor patients vital signs data, which cause high latency, low throughput, and high tasks failure. All these existing IoT-based e-Health systems are not well structured to tackle high priority (emergent healthcare tasks) effectively and dynamically. Furthermore, all these existing IoT-based e-Health systems do not support user interfaces for service customization and tasks level management to automatically generate healthcare tasks and schedule tasks to tackle high-priority healthcare tasks effectively. Furthermore, none of the mentioned IoT-based healthcare systems attempted to utilize optimization-based strategies to minimize tasks failure and connection cost to provide reliable health services to patients.
In contrast, our proposed smart PHMS is developed based on tasks orchestration architecture and optimization schemes to monitor patient’s vital signs data, minimize tasks failure, and network connection costs to provide reliable health services. Furthermore, our proposed smart PHMS is well-structured to generate autonomous healthcare tasks based on NLP techniques and a dynamic scheduling approach to handle high-priority health tasks effectively. Moreover, it supports the self-management approach to allow users to interact with a user-friendly interface to customize services related to the healthcare domain. The proposed system is flexible because it supports employing different algorithms for tasks generation, scheduling, and allocation process. Dynamic scheduling, self-management approach, and optimization functionalities make our solution effective and significant in the IoT-based remote healthcare domain. Table 7 presents a detailed analysis of the proposed smart with existing IoT-based healthcare systems.
Table 7.
Comparative analysis of the proposed smart PHMS with existing e-Heath Systems.
6. Conclusions and Future Work
The provisioning of a cost-effective and reliable health facility is essential for remote patients and is considered the most effective and significant measure for human lives. The vital signs data of patients are used to indicate the status of vital functions of the patient’s body, and thus these vital signs have been used to predict various diseases. The real-time IoT-based systems are an emerging field to support the development of healthcare applications in the IoT context and enable the connection of a vast network of connected devices, which aimed to monitor, process, and analyze patient’s vital signs data to provide better health services. This paper presented a smart PHMS to collect vital signs data of patients in a real-time IoT-based task orchestration architecture using optimized time-constraint-aware scheduling mechanisms. The proposed smart PHMS integrated two core modules: optimized scheduling and optimization of healthcare services modules, using a real-time IoT-based task orchestration to monitor vital signs data of remote patients. An optimized time-constraint scheduling module is developed using a real-time IoT-based task orchestration architecture to generate autonomous healthcare tasks, schedule healthcare tasks in the time domain, and dynamically handle the deployment process for high-priority healthcare tasks. The optimization module is developed using optimization schemes to optimize e-Health services based on objective function to provide cost-effective and reliable services to remote patients. This work utilized the Libelium e-Health toolkit to monitor the vital signs data of remote patients. Additionally, a self-management plane was developed to allow health service providers to customize their services, such as mapping healthcare tasks on corresponding virtual objects. Different performance analysis metrics were utilized to evaluate the significance of the proposed smart PHMS, such as RTT, latency, throughput, response time, and task drop and starvation rates. The experimental results proved that an optimized scheduling mechanism reduces the starvation and failure rate of the healthcare tasks to increase the efficiency of the proposed smart PHMS. The starvation rate of the proposed optimized scheduling mechanism is 12%. In contrast, tasks starvation rate of baseline RM and FEF scheduling mechanism is starvation rate is 28% and 26%, respectively, which indicates that the proposed scheduling mechanism significantly improves the overall performance of healthcare tasks. Similarly, the tasks drop rate of the proposed optimized scheduling mechanism is 15%, which is minimal compared to the RM and FEF scheduling algorithms. Overall, our proposed optimized scheduling mechanism reduced tasks starvation rate by 16% and 14% compared to the RM and FEF scheduling schemes. Furthermore, our optimized scheduling mechanism reduced tasks drop rate by 21% compared to the baseline RM scheduling and 17% compared to the FEF scheduling. The performance analysis reveals that the proposed smart PHMS is an effective and sustainable solution towards a real-time IoT-based e-Health industry to handle the allocation process of emergent healthcare tasks effectively and dynamically. Furthermore, a comparative analysis is performed based on vital factors to demonstrate the effectiveness of the proposed smart PHMS with existing IoT-based e-Health systems. The future direction of the proposed work can be considered to integrate predictive analytics with IoT to predict vital signs data to improve the performance of IoT-based healthcare services. The proposed smart PHMS can also be enhanced by considering more vital signs data to provide reliable healthcare services.
Author Contributions
N.I. conceived the idea for this paper, designed the experiments, and wrote the paper. I. assisted in the experimental design, and editing. S.A. and R.A. assisted in review and editing. D.-H.K. supervised and proof-read the study of scheduling mechanism based on optimization using IoT-tasks orchestration for efficient patient health monitoring. All authors have read and agreed to the published version of the manuscript.
Funding
This research was supported by Energy Cloud R&D Program through the National Research Foundation of Korea (NRF) funded by the Ministry of Science, ICT (2019M3F2A1073387), and this research was supported by the MSIT(Ministry of Science and ICT), Korea, under the ITRC (Information Technology Research Center) support program (IITP-2020-2016-0-00313) supervised by the IITP (Institute for Information & communications Technology Planning & Evaluation). Any correspondence related to this paper should be addressed to Dohyeun Kim.
Conflicts of Interest
The authors declare no conflict of interest.
References
- Imran; Ghaffar, Z.; Alshahrani, A.; Fayaz, M.; Alghamdi, A.M.; Gwak, J. A Topical Review on Machine Learning, Software Defined Networking, Internet of Things Applications: Research Limitations and Challenges. Electronics 2021, 10, 880. [Google Scholar] [CrossRef]
- Sicari, S.; Rizzardi, A.; Grieco, L.A.; Coen-Porisini, A. Security, privacy and trust in Internet of Things: The road ahead. Comput. Netw. 2015, 76, 146–164. [Google Scholar] [CrossRef]
- Zanella, A.; Bui, N.; Castellani, A.; Vangelista, L.; Zorzi, M. Internet of things for smart cities. IEEE Internet Things J. 2014, 1, 22–32. [Google Scholar] [CrossRef]
- Zheng, J.; Simplot-Ryl, D.; Bisdikian, C.; Mouftah, H.T. The internet of things [Guest Editorial]. IEEE Commun. Mag. 2011, 49, 30–31. [Google Scholar] [CrossRef]
- Abdelmoneem, R.M.; Benslimane, A.; Shaaban, E. Mobility-Aware Task Scheduling in Cloud-Fog IoT-Based Healthcare Architectures. Comput. Netw. 2020, 107348. [Google Scholar] [CrossRef]
- Catarinucci, L.; De Donno, D.; Mainetti, L.; Palano, L.; Patrono, L.; Stefanizzi, M.L.; Tarricone, L. An IoT-aware architecture for smart healthcare systems. IEEE Internet Things J. 2015, 2, 515–526. [Google Scholar] [CrossRef]
- Chernbumroong, S.; Cang, S.; Atkins, A.; Yu, H. Elderly activities recognition and classification for applications in assisted living. Expert Syst. Appl. 2013, 40, 1662–1674. [Google Scholar] [CrossRef]
- Jamil, F.; Ahmad, S.; Iqbal, N.; Kim, D.H. Towards a Remote Monitoring of Patient Vital Signs Based on IoT-Based Blockchain Integrity Management Platforms in Smart Hospitals. Sensors 2020, 20, 2195. [Google Scholar] [CrossRef] [PubMed] [Green Version]
- Kumar, P.M.; Gandhi, U.D. A novel three-tier Internet of Things architecture with machine learning algorithm for early detection of heart diseases. Comput. Electr. Eng. 2018, 65, 222–235. [Google Scholar] [CrossRef]
- Farahani, B.; Firouzi, F.; Chakrabarty, K. Healthcare iot. In Intelligent Internet of Things; Springer: Berlin/Heidelberg, Germany, 2020; pp. 515–545. [Google Scholar]
- Imran; Iqbal, N.; Ahmad, S.; Kim, D.H. Health Monitoring System for Elderly Patients Using Intelligent Task Mapping Mechanism in Closed Loop Healthcare Environment. Symmetry 2021, 13, 357. [Google Scholar] [CrossRef]
- Majumder, S.; Aghayi, E.; Noferesti, M.; Memarzadeh-Tehran, H.; Mondal, T.; Pang, Z.; Deen, M.J. Smart homes for elderly healthcare—Recent advances and research challenges. Sensors 2017, 17, 2496. [Google Scholar] [CrossRef] [Green Version]
- Swaroop, K.N.; Chandu, K.; Gorrepotu, R.; Deb, S. A health monitoring system for vital signs using IoT. Internet Things 2019, 5, 116–129. [Google Scholar] [CrossRef]
- Wu, F.; Wu, T.; Yuce, M.R. An internet-of-things (IoT) network system for connected safety and health monitoring applications. Sensors 2019, 19, 21. [Google Scholar] [CrossRef] [Green Version]
- Misbahuddin, S.; Zubairi, J.A.; Alahdal, A.R.; Malik, M.A. IoT-Based Ambulatory Vital Signs Data Transfer System. J. Comput. Netw. Commun. 2018, 2018. [Google Scholar] [CrossRef]
- Maksimović, M.; Vujović, V. Internet of Things based e-health systems: Ideas, expectations and concerns. In Handbook of Large-Scale Distributed Computing in Smart Healthcare; Springer: Berlin/Heidelberg, Germany, 2017; pp. 241–280. [Google Scholar]
- Abdelmoneem, R.M.; Shaaban, E.; Benslimane, A. A Survey on Multi-Sensor Fusion Techniques in IoT for Healthcare. In Proceedings of the 2018 13th International Conference on Computer Engineering and Systems (ICCES), Cairo, Egypt, 18–19 December 2018; pp. 157–162. [Google Scholar]
- Suh, M.k.; Chen, C.A.; Woodbridge, J.; Tu, M.K.; Kim, J.I.; Nahapetian, A.; Evangelista, L.S.; Sarrafzadeh, M. A remote patient monitoring system for congestive heart failure. J. Med Syst. 2011, 35, 1165–1179. [Google Scholar] [CrossRef] [Green Version]
- Jara, A.J.; Zamora-Izquierdo, M.A.; Skarmeta, A.F. Interconnection framework for mHealth and remote monitoring based on the internet of things. IEEE J. Sel. Areas Commun. 2013, 31, 47–65. [Google Scholar] [CrossRef]
- Banaee, H.; Ahmed, M.U.; Loutfi, A. Data mining for wearable sensors in health monitoring systems: A review of recent trends and challenges. Sensors 2013, 13, 17472–17500. [Google Scholar] [CrossRef] [Green Version]
- Bansal, A.; Kumar, S.; Bajpai, A.; Tiwari, V.N.; Nayak, M.; Venkatesan, S.; Narayanan, R. Remote health monitoring system for detecting cardiac disorders. IET Syst. Biol. 2015, 9, 309–314. [Google Scholar] [CrossRef] [PubMed]
- Klingeberg, T.; Schilling, M. Mobile wearable device for long term monitoring of vital signs. Comput. Methods Programs Biomed. 2012, 106, 89–96. [Google Scholar] [CrossRef] [PubMed]
- Ahmad, N.; Han, L.; Iqbal, K.; Ahmad, R.; Abid, M.A.; Iqbal, N. SARM: Salah activities recognition model based on smartphone. Electronics 2019, 8, 881. [Google Scholar] [CrossRef] [Green Version]
- Kakria, P.; Tripathi, N.; Kitipawang, P. A real-time health monitoring system for remote cardiac patients using smartphone and wearable sensors. Int. J. Telemed. Appl. 2015, 2015. [Google Scholar] [CrossRef] [Green Version]
- Hagargund, A.G.; Srivastav, A.; Nayak, C.K.; Singh, M.K. Smart and Automatic Health Monitoring of Patient Using Wireless Sensor Network. In Proceedings of the 2018 9th International Conference on Computing, Communication and Networking Technologies (ICCCNT), Bengaluru, India, 10–12 July 2018; pp. 1–7. [Google Scholar]
- Mahmood, D.; Fadhil, A.; Rafaa, M.M. IoT based on Health Caring Systems Survey. Int. J. Comput. Digit. Syst. 2020, 10, 1–10. [Google Scholar]
- Noury, N.; Rumeau, P.; Bourke, A.; ÓLaighin, G.; Lundy, J. A proposal for the classification and evaluation of fall detectors. Irbm 2008, 29, 340–349. [Google Scholar] [CrossRef]
- Giorgi, G.; Galli, A.; Narduzzi, C. Smartphone-based IOT systems for personal health monitoring. IEEE Instrum. Meas. Mag. 2020, 23, 41–47. [Google Scholar] [CrossRef]
- Pandya, B.; Pourabdollah, A.; Lotfi, A. Fuzzy logic web services for real-time fall detection using wearable accelerometer and gyroscope sensors. In Proceedings of the 13th ACM International Conference on PErvasive Technologies Related to Assistive Environments, Corfu Greece, 30 Julne–3 July 2020; pp. 1–7. [Google Scholar]
- Bet, P.; Castro, P.C.; Ponti, M.A. Fall detection and fall risk assessment in older person using wearable sensors: A systematic review. Int. J. Med. Inform. 2019, 130, 103946. [Google Scholar] [CrossRef] [PubMed]
- Mdhaffar, A.; Chaari, T.; Larbi, K.; Jmaiel, M.; Freisleben, B. IoT-based health monitoring via LoRaWAN. In Proceedings of the IEEE EUROCON 2017-17th International Conference on Smart Technologies, Ohrid, North Macedonia, 6–8 July 2017; pp. 519–524. [Google Scholar]
- Selvaraj, S.; Sundaravaradhan, S. Challenges and opportunities in IoT healthcare systems: A systematic review. SN Appl. Sci. 2020, 2, 139. [Google Scholar] [CrossRef] [Green Version]
- Djelouat, H.; Amira, A.; Bensaali, F.; Boukhennoufa, I. Secure compressive sensing for ECG monitoring. Comput. Secur. 2020, 88, 101649. [Google Scholar] [CrossRef]
- Saidi, H.; Labraoui, N.; Ari, A.A.A.; Bouida, D. Remote health monitoring system of elderly based on Fog to Cloud (F2C) computing. In Proceedings of the 2020 International Conference on Intelligent Systems and Computer Vision (ISCV), Fez, Morocco, 2–4 April 2020; pp. 1–7. [Google Scholar]
- Yang, Z.; Zhou, Q.; Lei, L.; Zheng, K.; Xiang, W. An IoT-cloud based wearable ECG monitoring system for smart healthcare. J. Med Syst. 2016, 40, 1–11. [Google Scholar] [CrossRef] [PubMed]
- Al Mamun, K.A.; Alhussein, M.; Sailunaz, K.; Islam, M.S. Cloud based framework for Parkinson’s disease diagnosis and monitoring system for remote healthcare applications. Future Gener. Comput. Syst. 2017, 66, 36–47. [Google Scholar] [CrossRef]
- Hussein, A.F.; Burbano-Fernandez, M.; Ramírez-González, G.; Abdulhay, E.; De Albuquerque, V.H.C. An automated remote cloud-based heart rate variability monitoring system. IEEE Access 2018, 6, 77055–77064. [Google Scholar] [CrossRef]
- Fortino, G.; Parisi, D.; Pirrone, V.; Di Fatta, G. BodyCloud: A SaaS approach for community body sensor networks. Future Gener. Comput. Syst. 2014, 35, 62–79. [Google Scholar] [CrossRef] [Green Version]
- Gia, T.N.; Jiang, M.; Rahmani, A.M.; Westerlund, T.; Liljeberg, P.; Tenhunen, H. Fog Computing in Healthcare internet of Things: A Case Study on ecg Feature Extraction. In Proceedings of the 2015 IEEE International Conference on Computer and Information Technology; Ubiquitous Computing and Communications; Dependable, Autonomic and Secure Computing; Pervasive Intelligence and Computing, Liverpool, UK, 26–28 October 2015; pp. 356–363. [Google Scholar]
- Negash, B.; Gia, T.N.; Anzanpour, A.; Azimi, I.; Jiang, M.; Westerlund, T.; Rahmani, A.M.; Liljeberg, P.; Tenhunen, H. Leveraging fog computing for healthcare IoT. In Fog Computing in the Internet of Things; Springer: Berlin, Germany, 2018; pp. 145–169. [Google Scholar]
- Rahmani, A.M.; Gia, T.N.; Negash, B.; Anzanpour, A.; Azimi, I.; Jiang, M.; Liljeberg, P. Exploiting smart e-Health gateways at the edge of healthcare Internet-of-Things: A fog computing approach. Future Gener. Comput. Syst. 2018, 78, 641–658. [Google Scholar] [CrossRef]
- Mutlag, A.A.; Abd Ghani, M.K.; Arunkumar, N.a.; Mohammed, M.A.; Mohd, O. Enabling technologies for fog computing in healthcare IoT systems. Future Gener. Comput. Syst. 2019, 90, 62–78. [Google Scholar] [CrossRef]
- Verma, P.; Sood, S.K. Fog assisted-IoT enabled patient health monitoring in smart homes. IEEE Internet Things J. 2018, 5, 1789–1796. [Google Scholar] [CrossRef]
- Dubey, H.; Yang, J.; Constant, N.; Amiri, A.M.; Yang, Q.; Makodiya, K. Fog data: Enhancing telehealth big data through fog computing. In Proceedings of the ASE Bigdata & Socialinformatics, New York, NY, USA, 7 October 2015; pp. 1–6. [Google Scholar]
- Craciunescu, R.; Mihovska, A.; Mihaylov, M.; Kyriazakos, S.; Prasad, R.; Halunga, S. Implementation of Fog computing for reliable E-health applications. In Proceedings of the 2015 49th Asilomar Conference on Signals, Systems and Computers, Grove, CA, USA, 8–11 November; pp. 459–463.
- Alsaffar, A.A.; Pham, H.P.; Hong, C.S.; Huh, E.N.; Aazam, M. An architecture of iot service delegation and resource allocation based on collaboration between fog and cloud computing. Mob. Inf. Syst. 2016, 2016. [Google Scholar] [CrossRef] [Green Version]
- Arabnejad, H.; Barbosa, J.G. List scheduling algorithm for heterogeneous systems by an optimistic cost table. IEEE Trans. Parallel Distrib. Syst. 2013, 25, 682–694. [Google Scholar] [CrossRef]
- Jiang, H.J.; Huang, K.C.; Chang, H.Y.; Gu, D.S.; Shih, P.J. Scheduling concurrent workflows in HPC cloud through exploiting schedule gaps. In International Conference on Algorithms and Architectures for Parallel Processing; Springer: Berlin, Germany, 2011; pp. 282–293. [Google Scholar]
- Agarwal, S.; Yadav, S.; Yadav, A.K. An efficient architecture and algorithm for resource provisioning in fog computing. Int. J. Inf. Eng. Electron. Bus. 2016, 8, 48. [Google Scholar] [CrossRef]
- Pham, X.Q.; Man, N.D.; Tri, N.D.T.; Thai, N.Q.; Huh, E.N. A cost-and performance-effective approach for task scheduling based on collaboration between cloud and fog computing. Int. J. Distrib. Sens. Netw. 2017, 13, 1550147717742073. [Google Scholar] [CrossRef] [Green Version]
- Liu, L.; Qi, D.; Zhou, N.; Wu, Y. A task scheduling algorithm based on classification mining in fog computing environment. Wirel. Commun. Mob. Comput. 2018, 2018. [Google Scholar] [CrossRef] [Green Version]
- Artalejo, J.R.; Lopez-Herrero, M. Quasi-stationary and ratio of expectations distributions: A comparative study. J. Theor. Biol. 2010, 266, 264–274. [Google Scholar] [CrossRef] [Green Version]
- Sahab, M.G.; Toropov, V.V.; Gandomi, A.H. A review on traditional and modern structural optimization: Problems and techniques. Metaheuristic Appl. Struct. Infrastruct. 2013, 25–47. [Google Scholar]
- Rath, M.; Darwish, A.; Pati, B.; Pattanayak, B.K.; Panigrahi, C.R. Swarm intelligence as a solution for technological problems associated with Internet of Things. In Swarm Intelligence for Resource Management in Internet of Things; Elsevier: Amsterdam, The Netherlands, 2020; pp. 21–45. [Google Scholar]
- Ahmad, S.; Mehmood, F.; Kim, D.H. A DIY approach for the design of mission-planning architecture using autonomous task–object mapping and the deployment model in mission-critical IoT systems. Sustainability 2019, 11, 3647. [Google Scholar] [CrossRef] [Green Version]
- Ahmad, S.; Hang, L.; Kim, D.H. Design and implementation of cloud-centric configuration repository for DIY IoT applications. Sensors 2018, 18, 474. [Google Scholar] [CrossRef] [Green Version]
- Vital Signs Data. Available online: https://healthjade.net/vital-signs/ (accessed on 5 November 2020).
- Imran; Ahmad, S.; Kim, D. Design and Implementation of Thermal Comfort System based on Tasks Allocation Mechanism in Smart Homes. Sustainability 2019, 11, 5849. [Google Scholar] [CrossRef] [Green Version]
- Imran; Ahmad, S.; Kim, D.H. A Task Orchestration Approach for Efficient Mountain Fire Detection Based on Microservice and Predictive Analysis in IoT Environment. J. Intell. Fuzzy Syst. 2021, 40, 5681–5696. [Google Scholar] [CrossRef]
- Imran; Iqbal, N.; Ahmad, S.; Kim, D.H. Towards mountain fire safety using fire spread predictive analytics and mountain fire containment in iot environment. Sustainability 2021, 13, 2461. [Google Scholar] [CrossRef]
- Qamar, S.; Abdelrehman, A.M.; Elshafie, H.E.; Mohiuddin, K. Sensor Based IoT Industrial Healthcare. Int. J. Sci. Eng. Sci. 2018, 2, 29–34. [Google Scholar]
- Brezulianu, A.; Geman, O.; Zbancioc, M.D.; Hagan, M.; Aghion, C.; Hemanth, D.J.; Son, L.H. IoT based heart activity monitoring using inductive sensors. Sensors 2019, 19, 3284. [Google Scholar] [CrossRef] [PubMed] [Green Version]
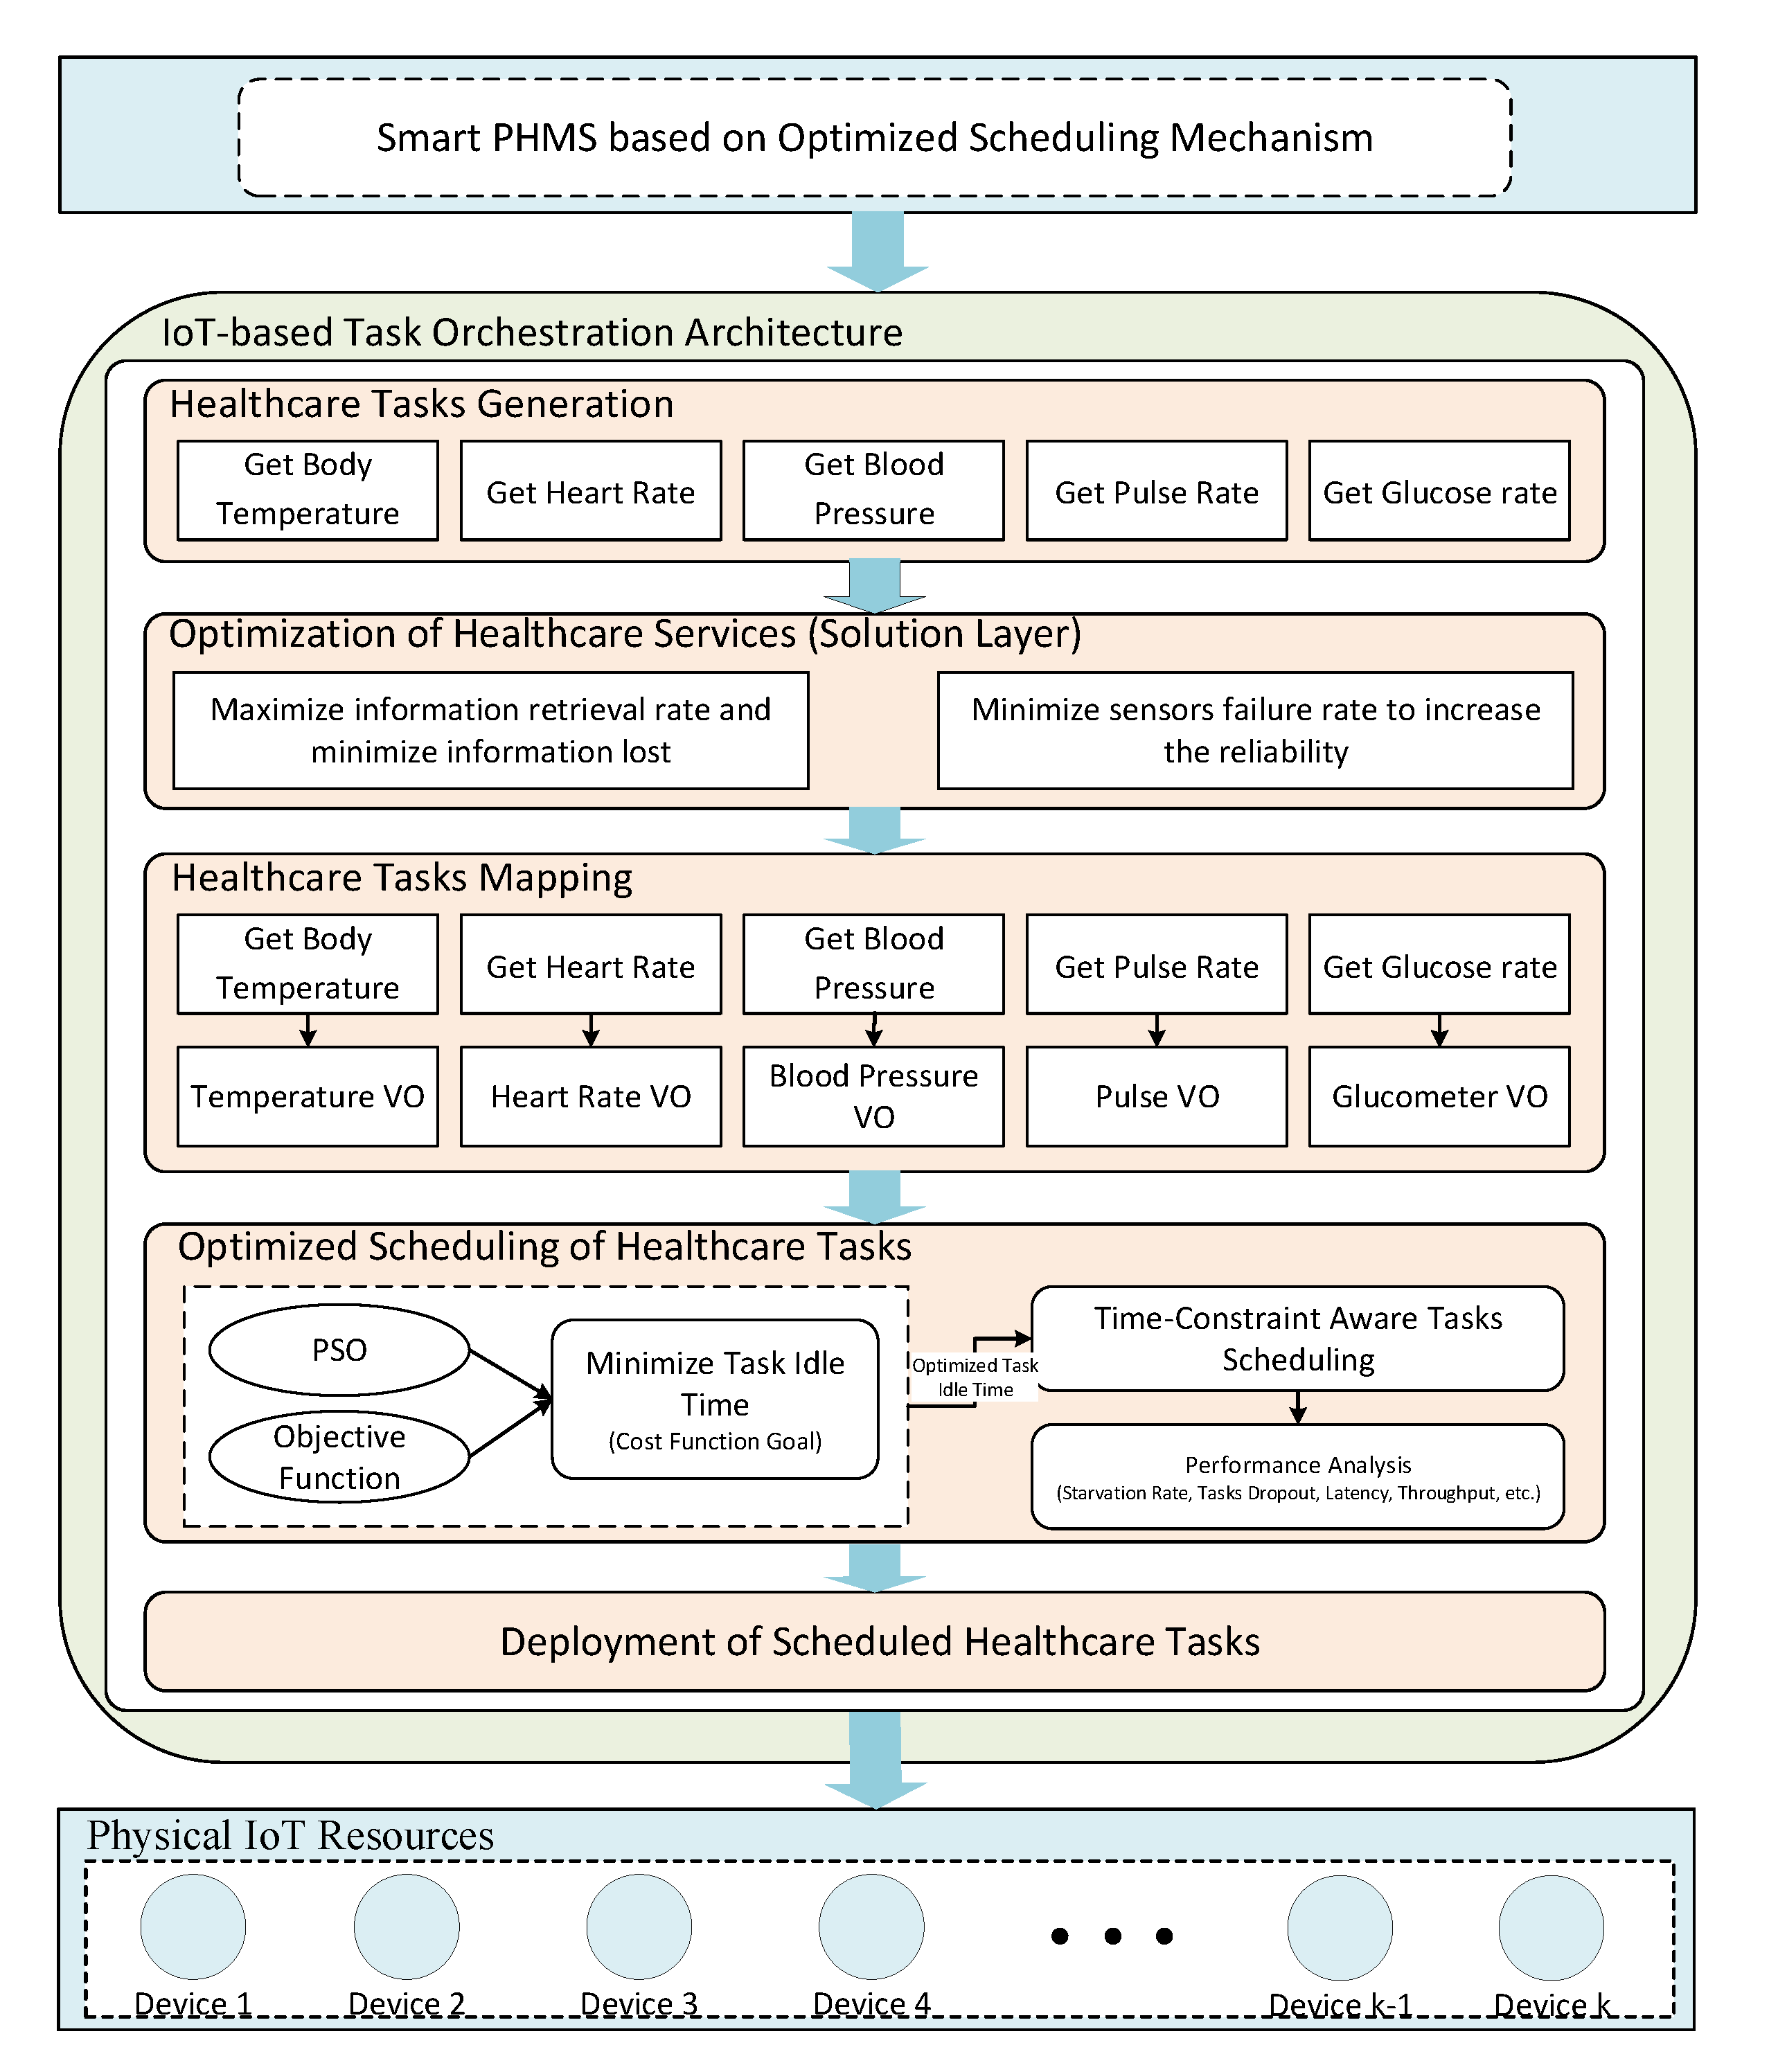
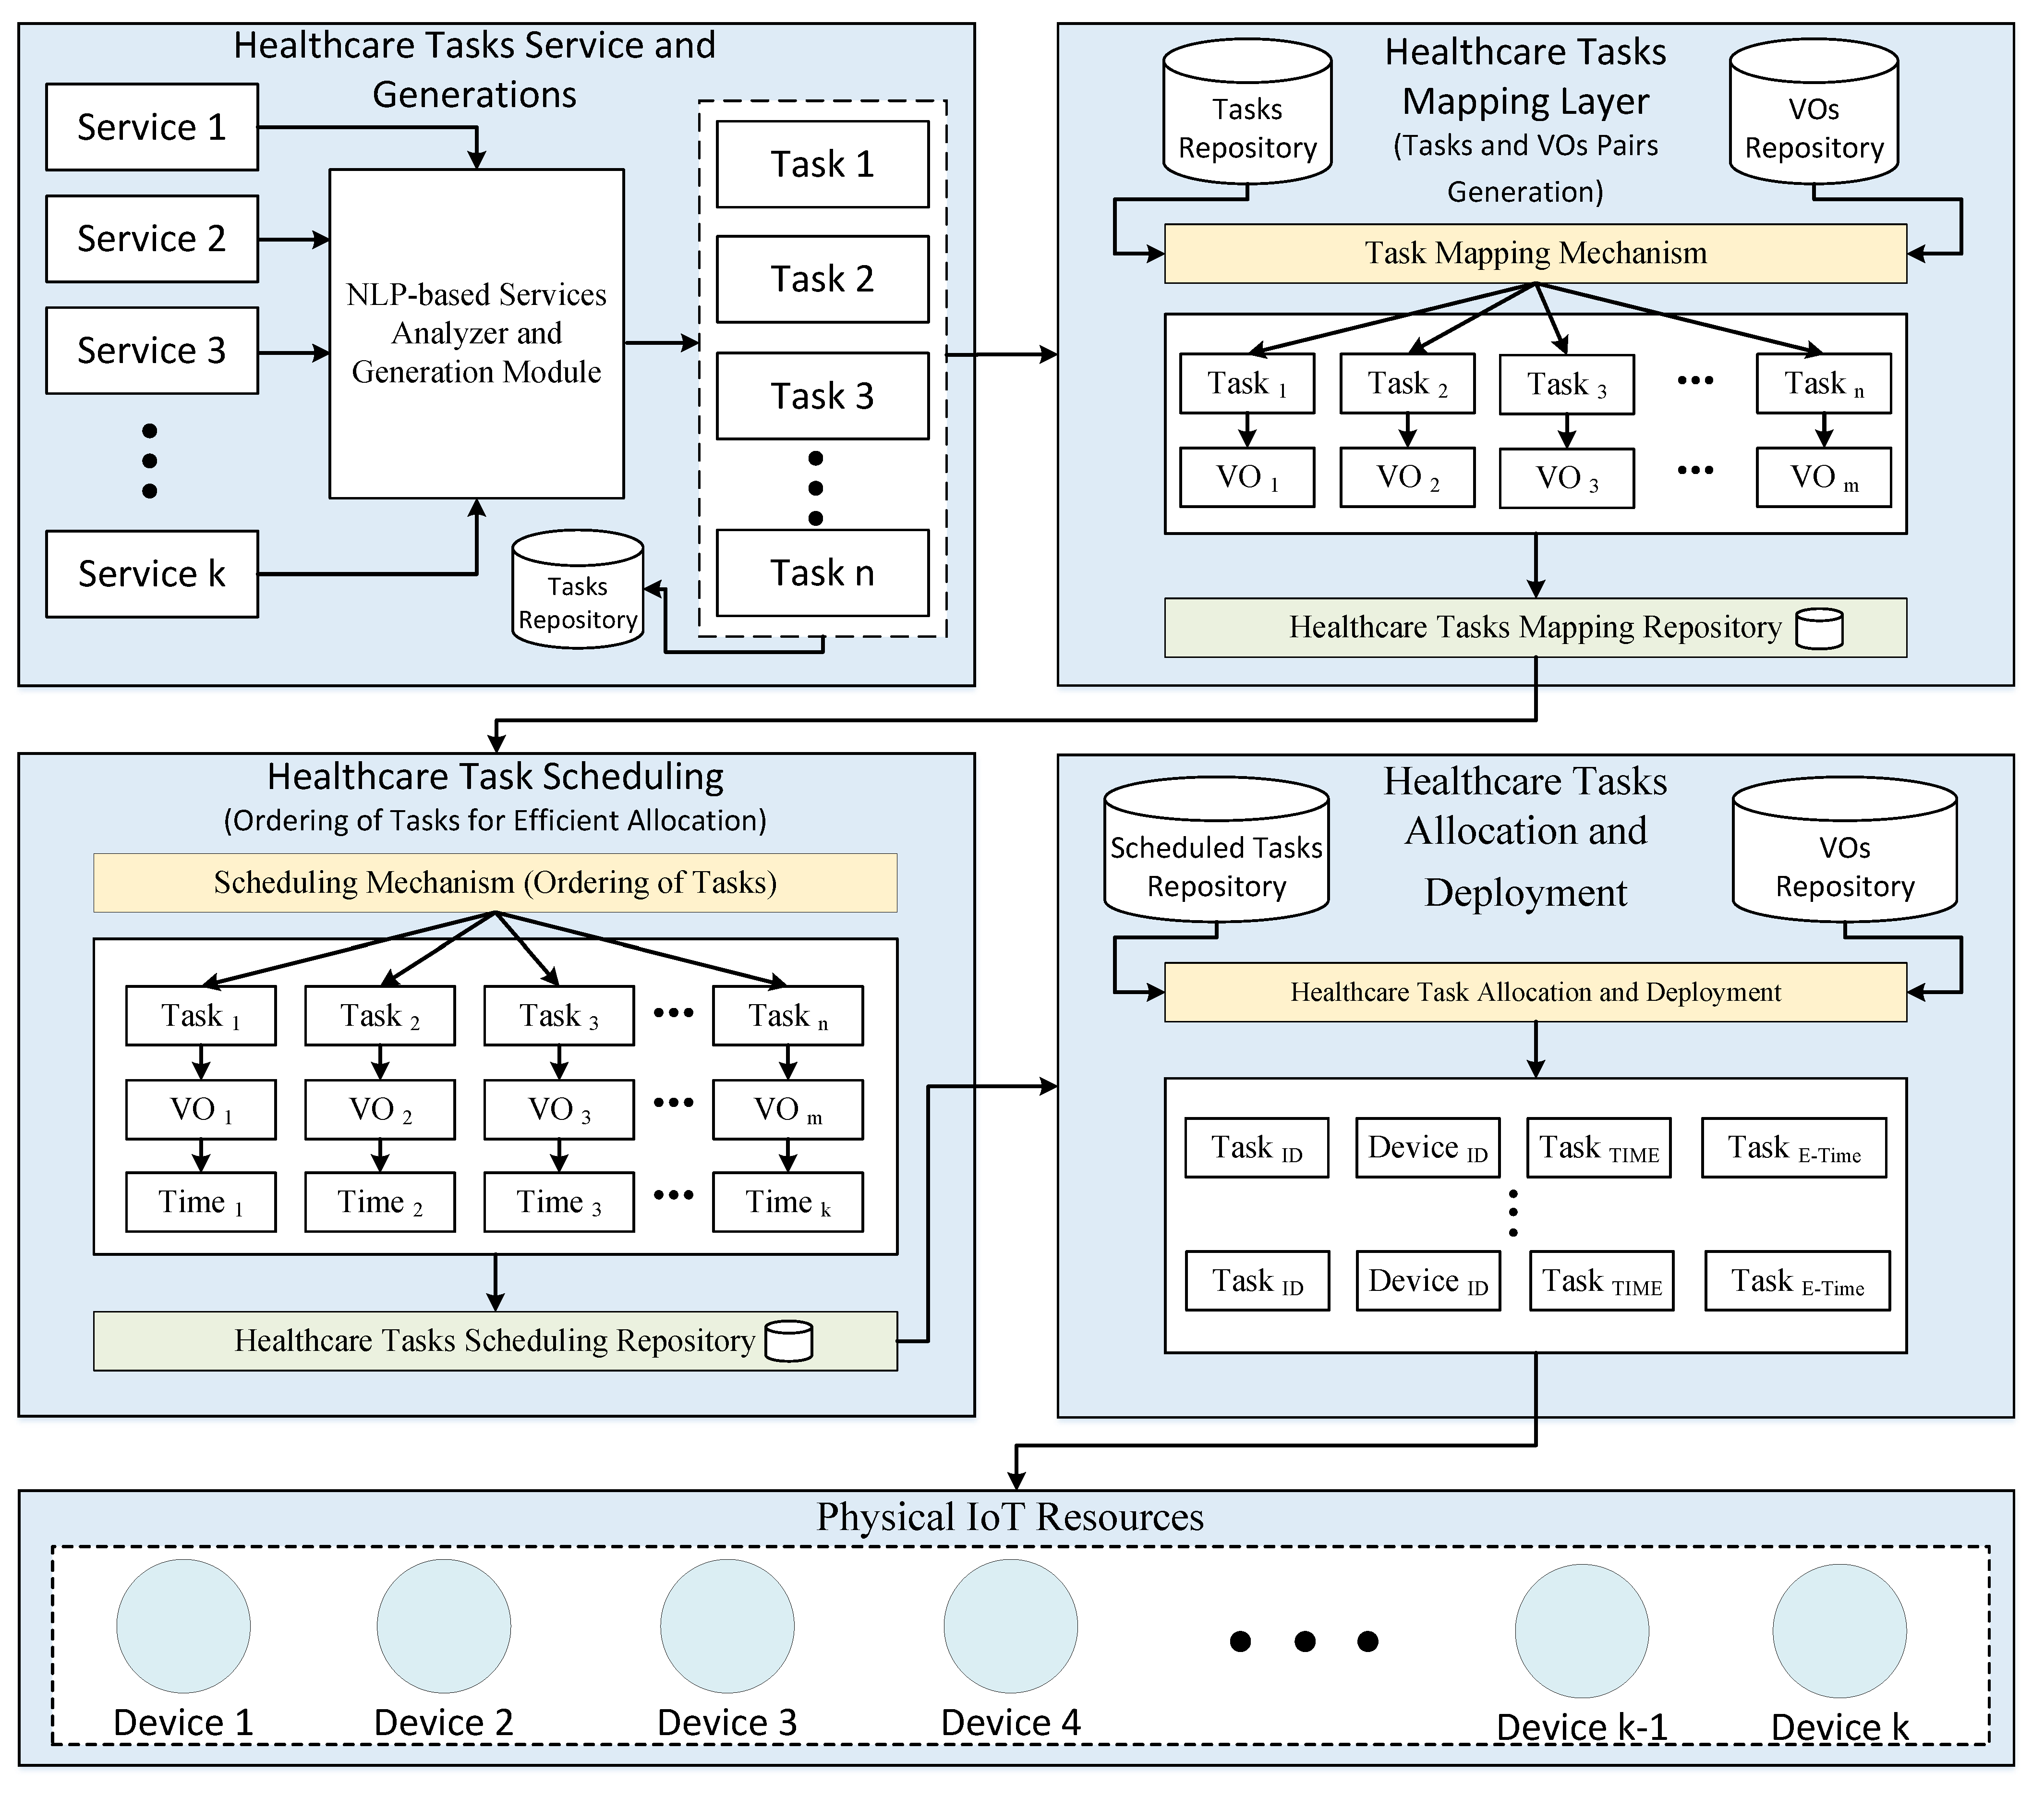
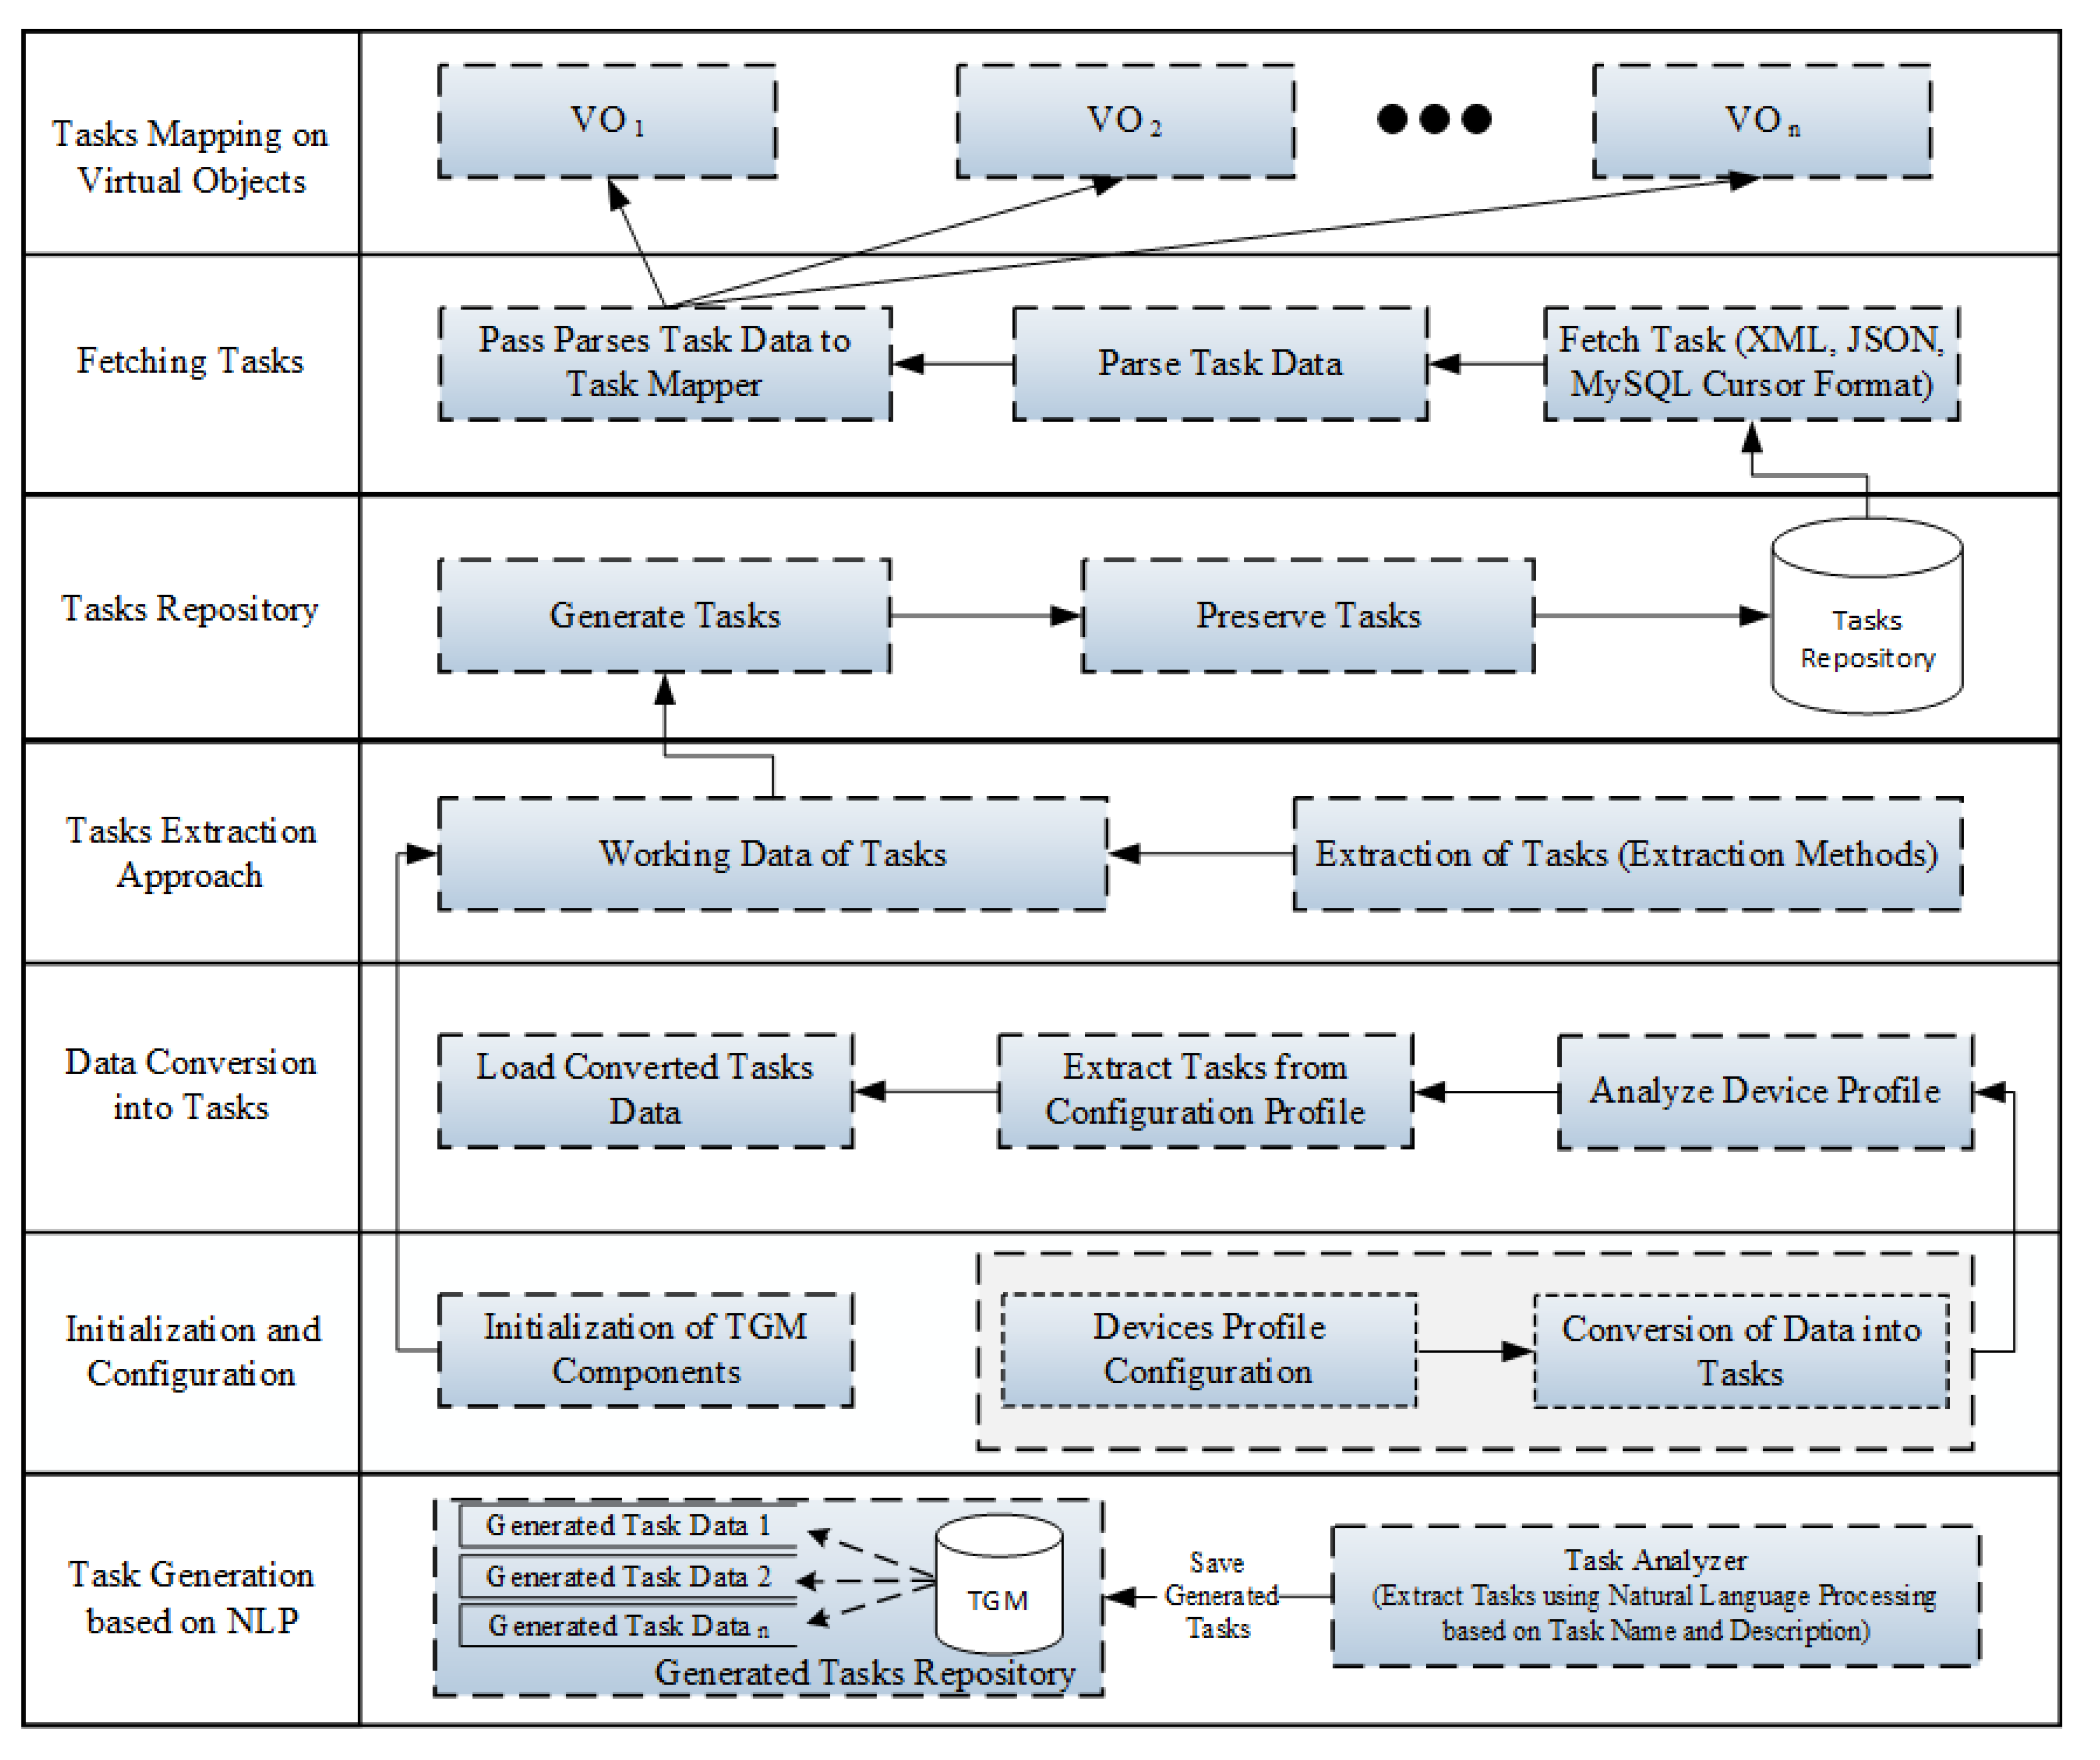
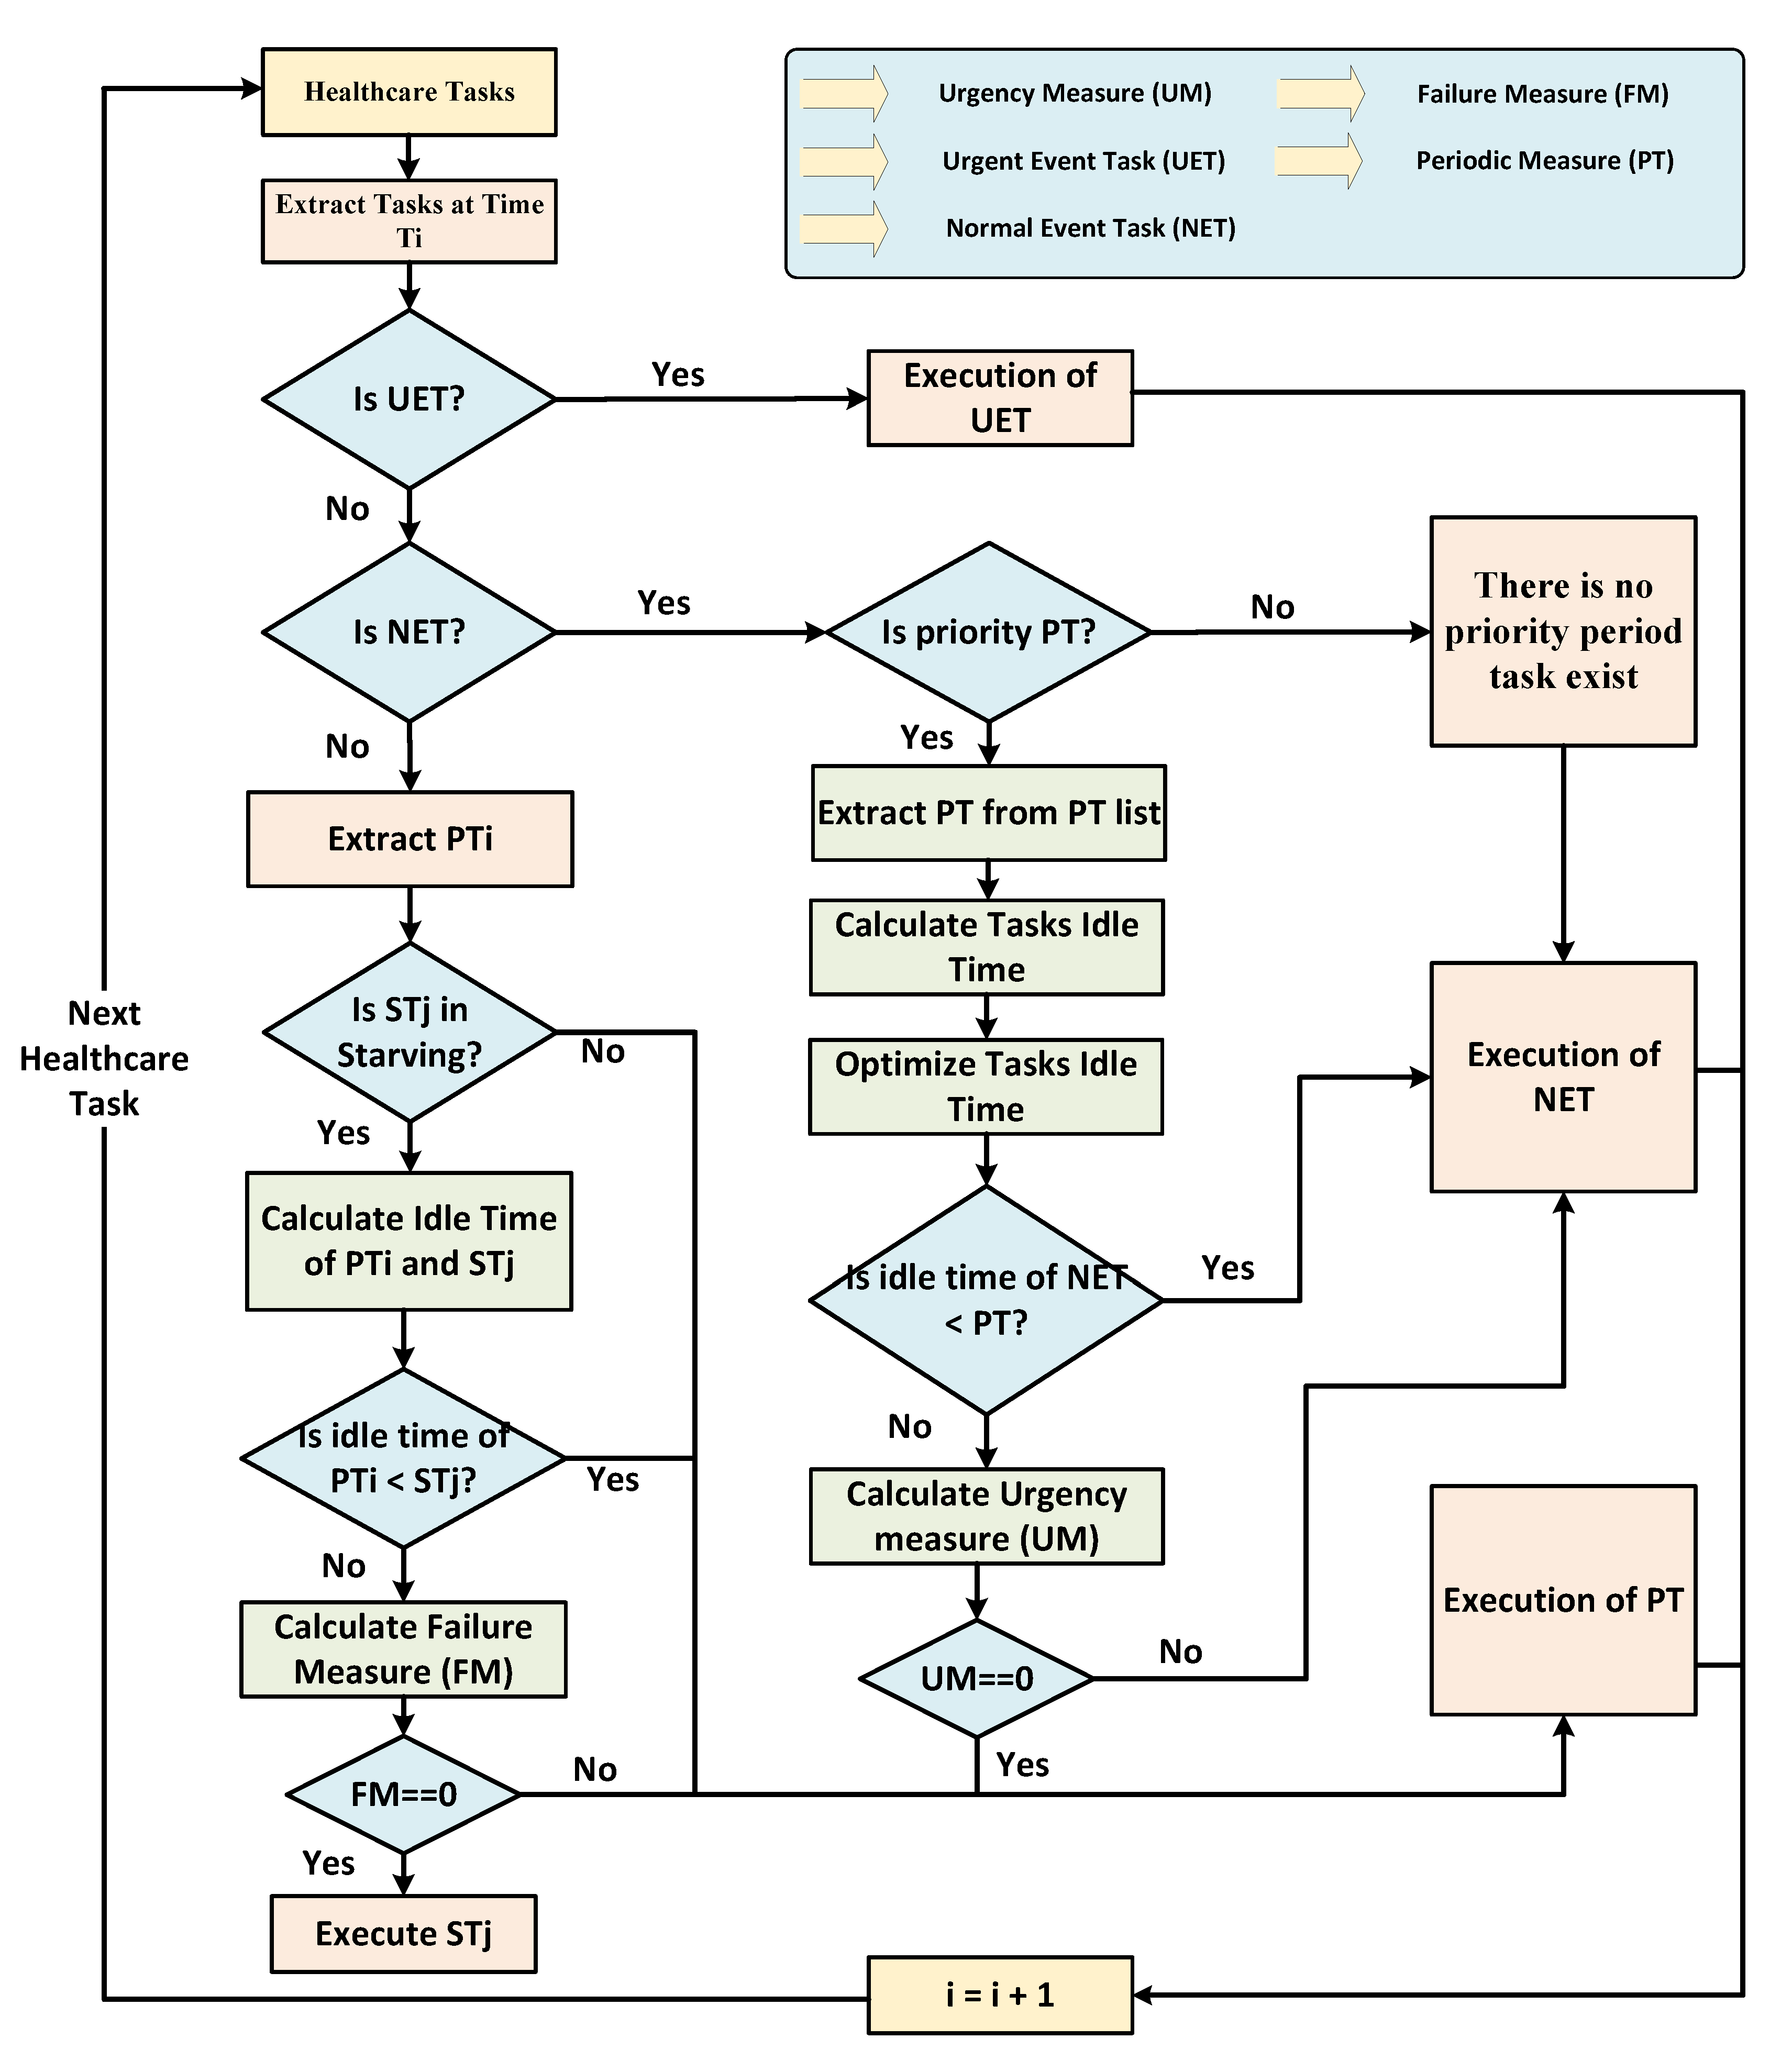

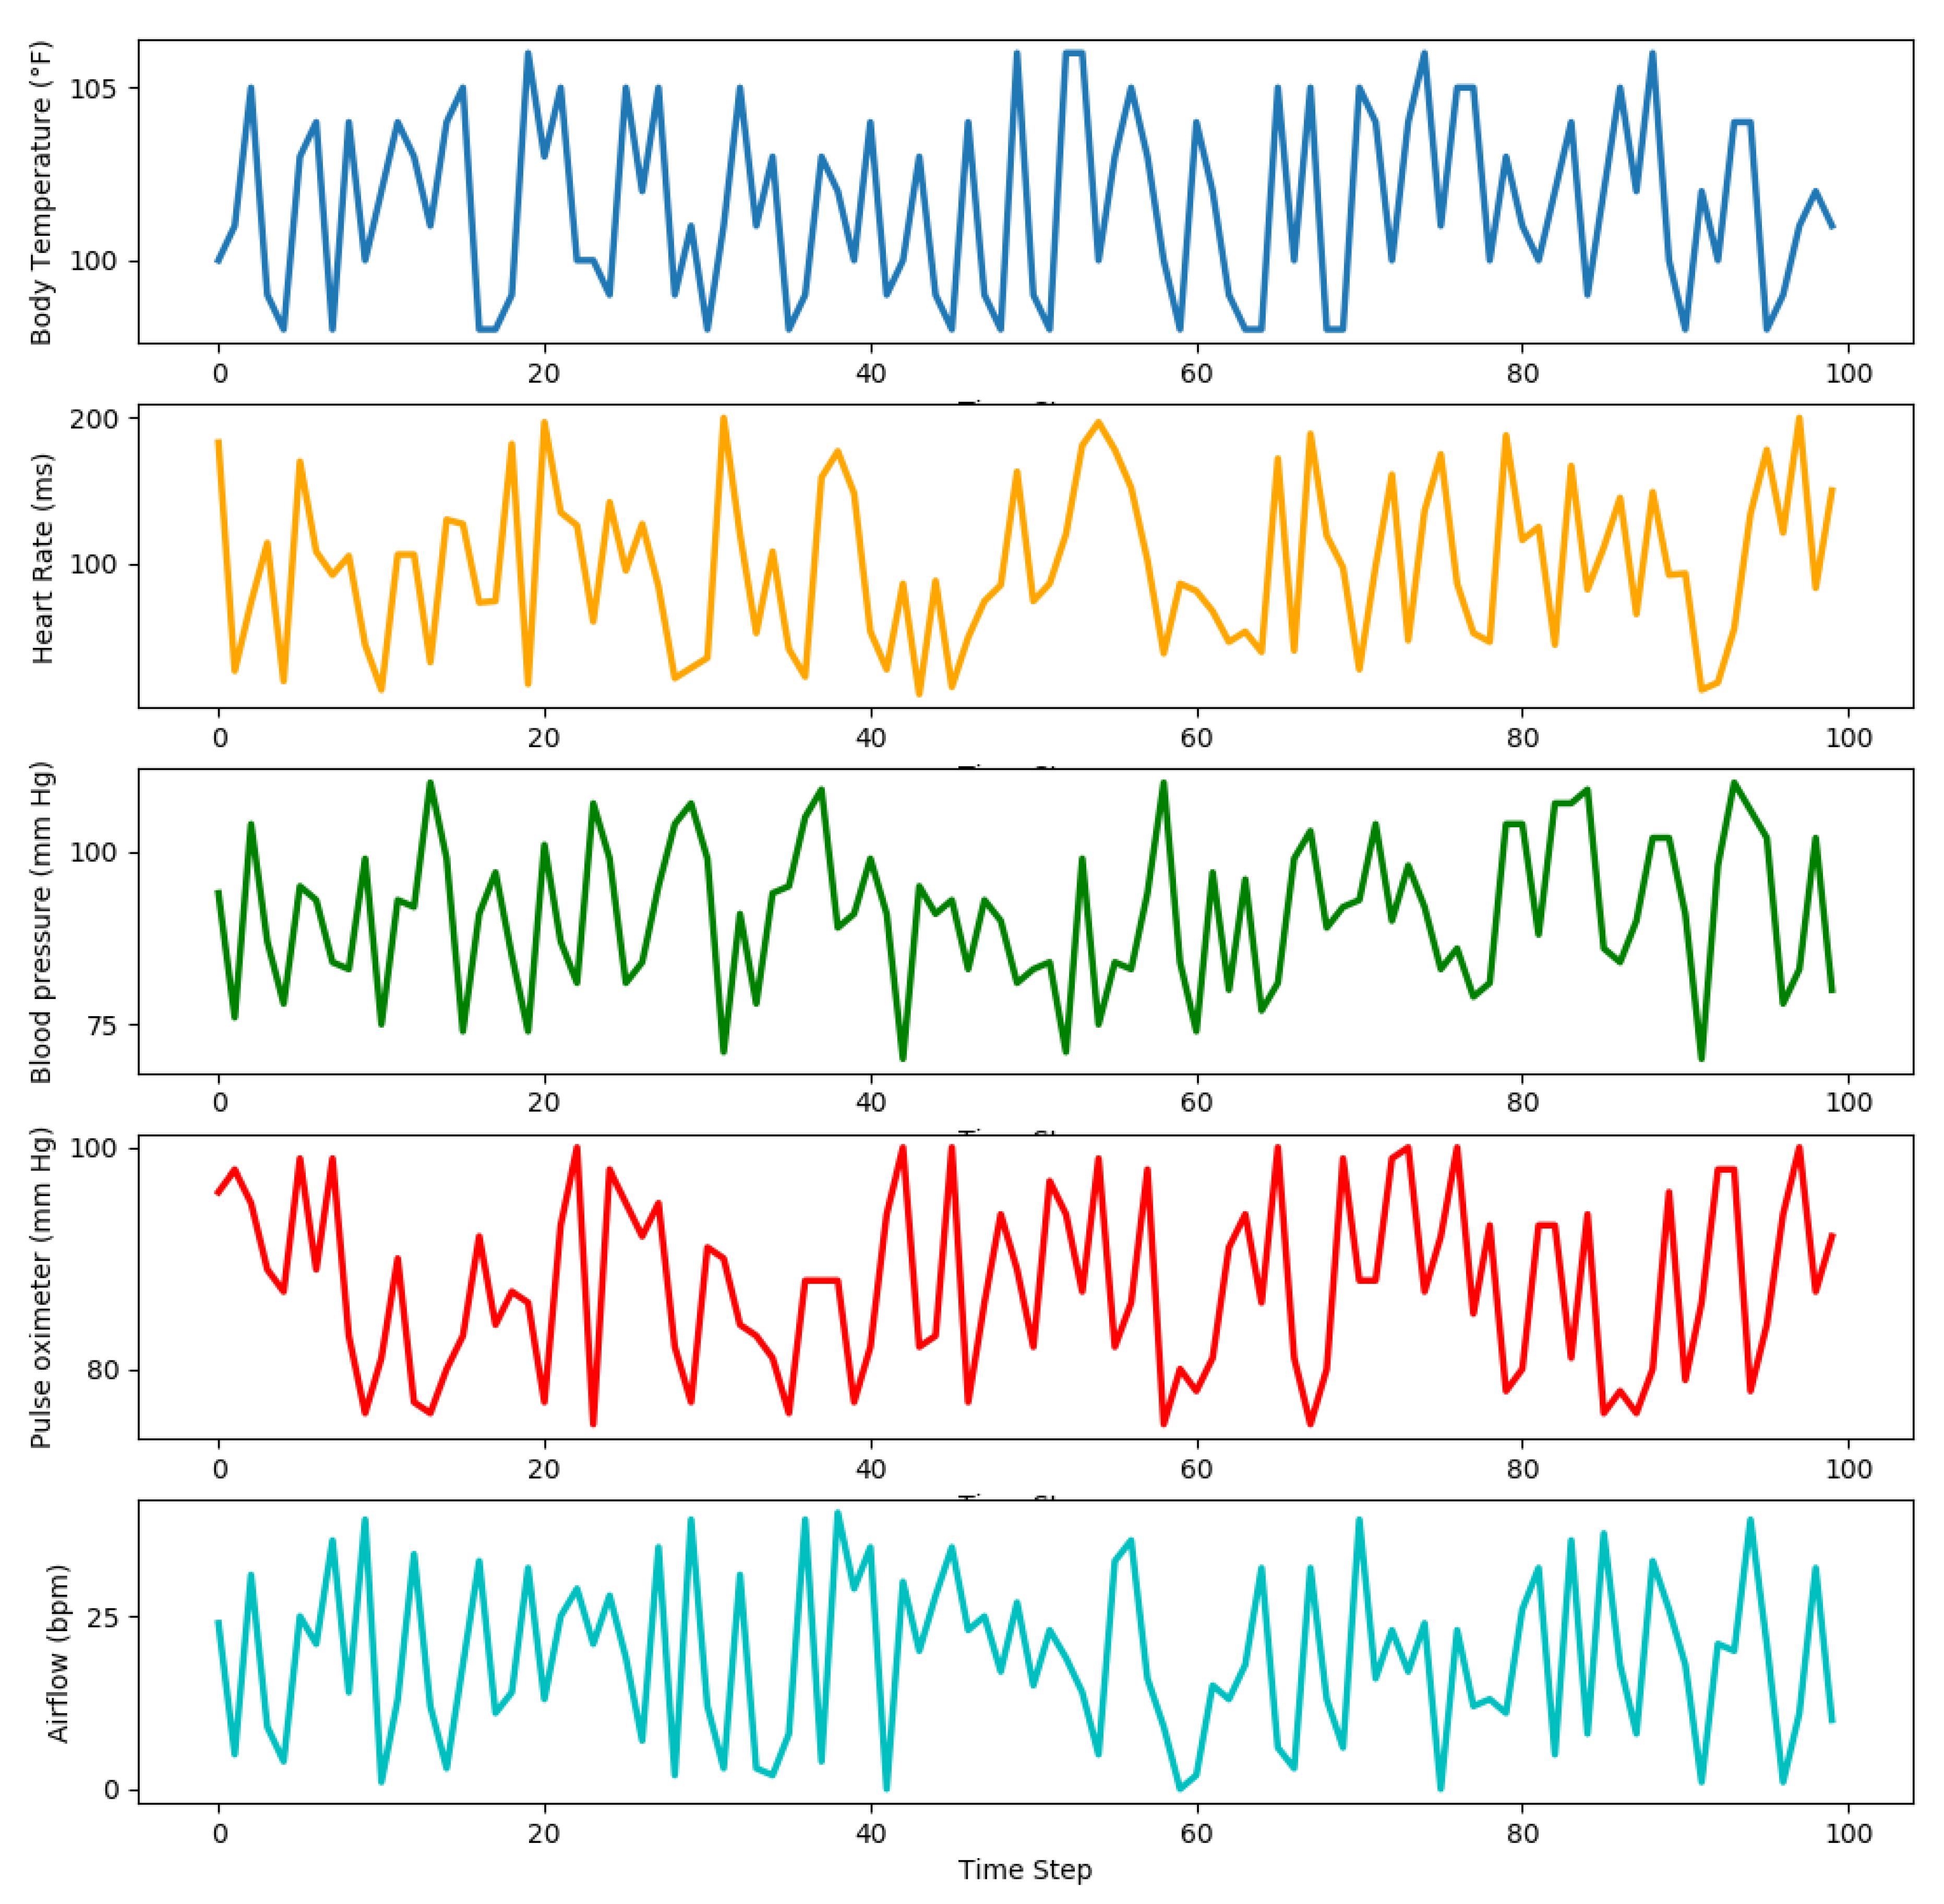


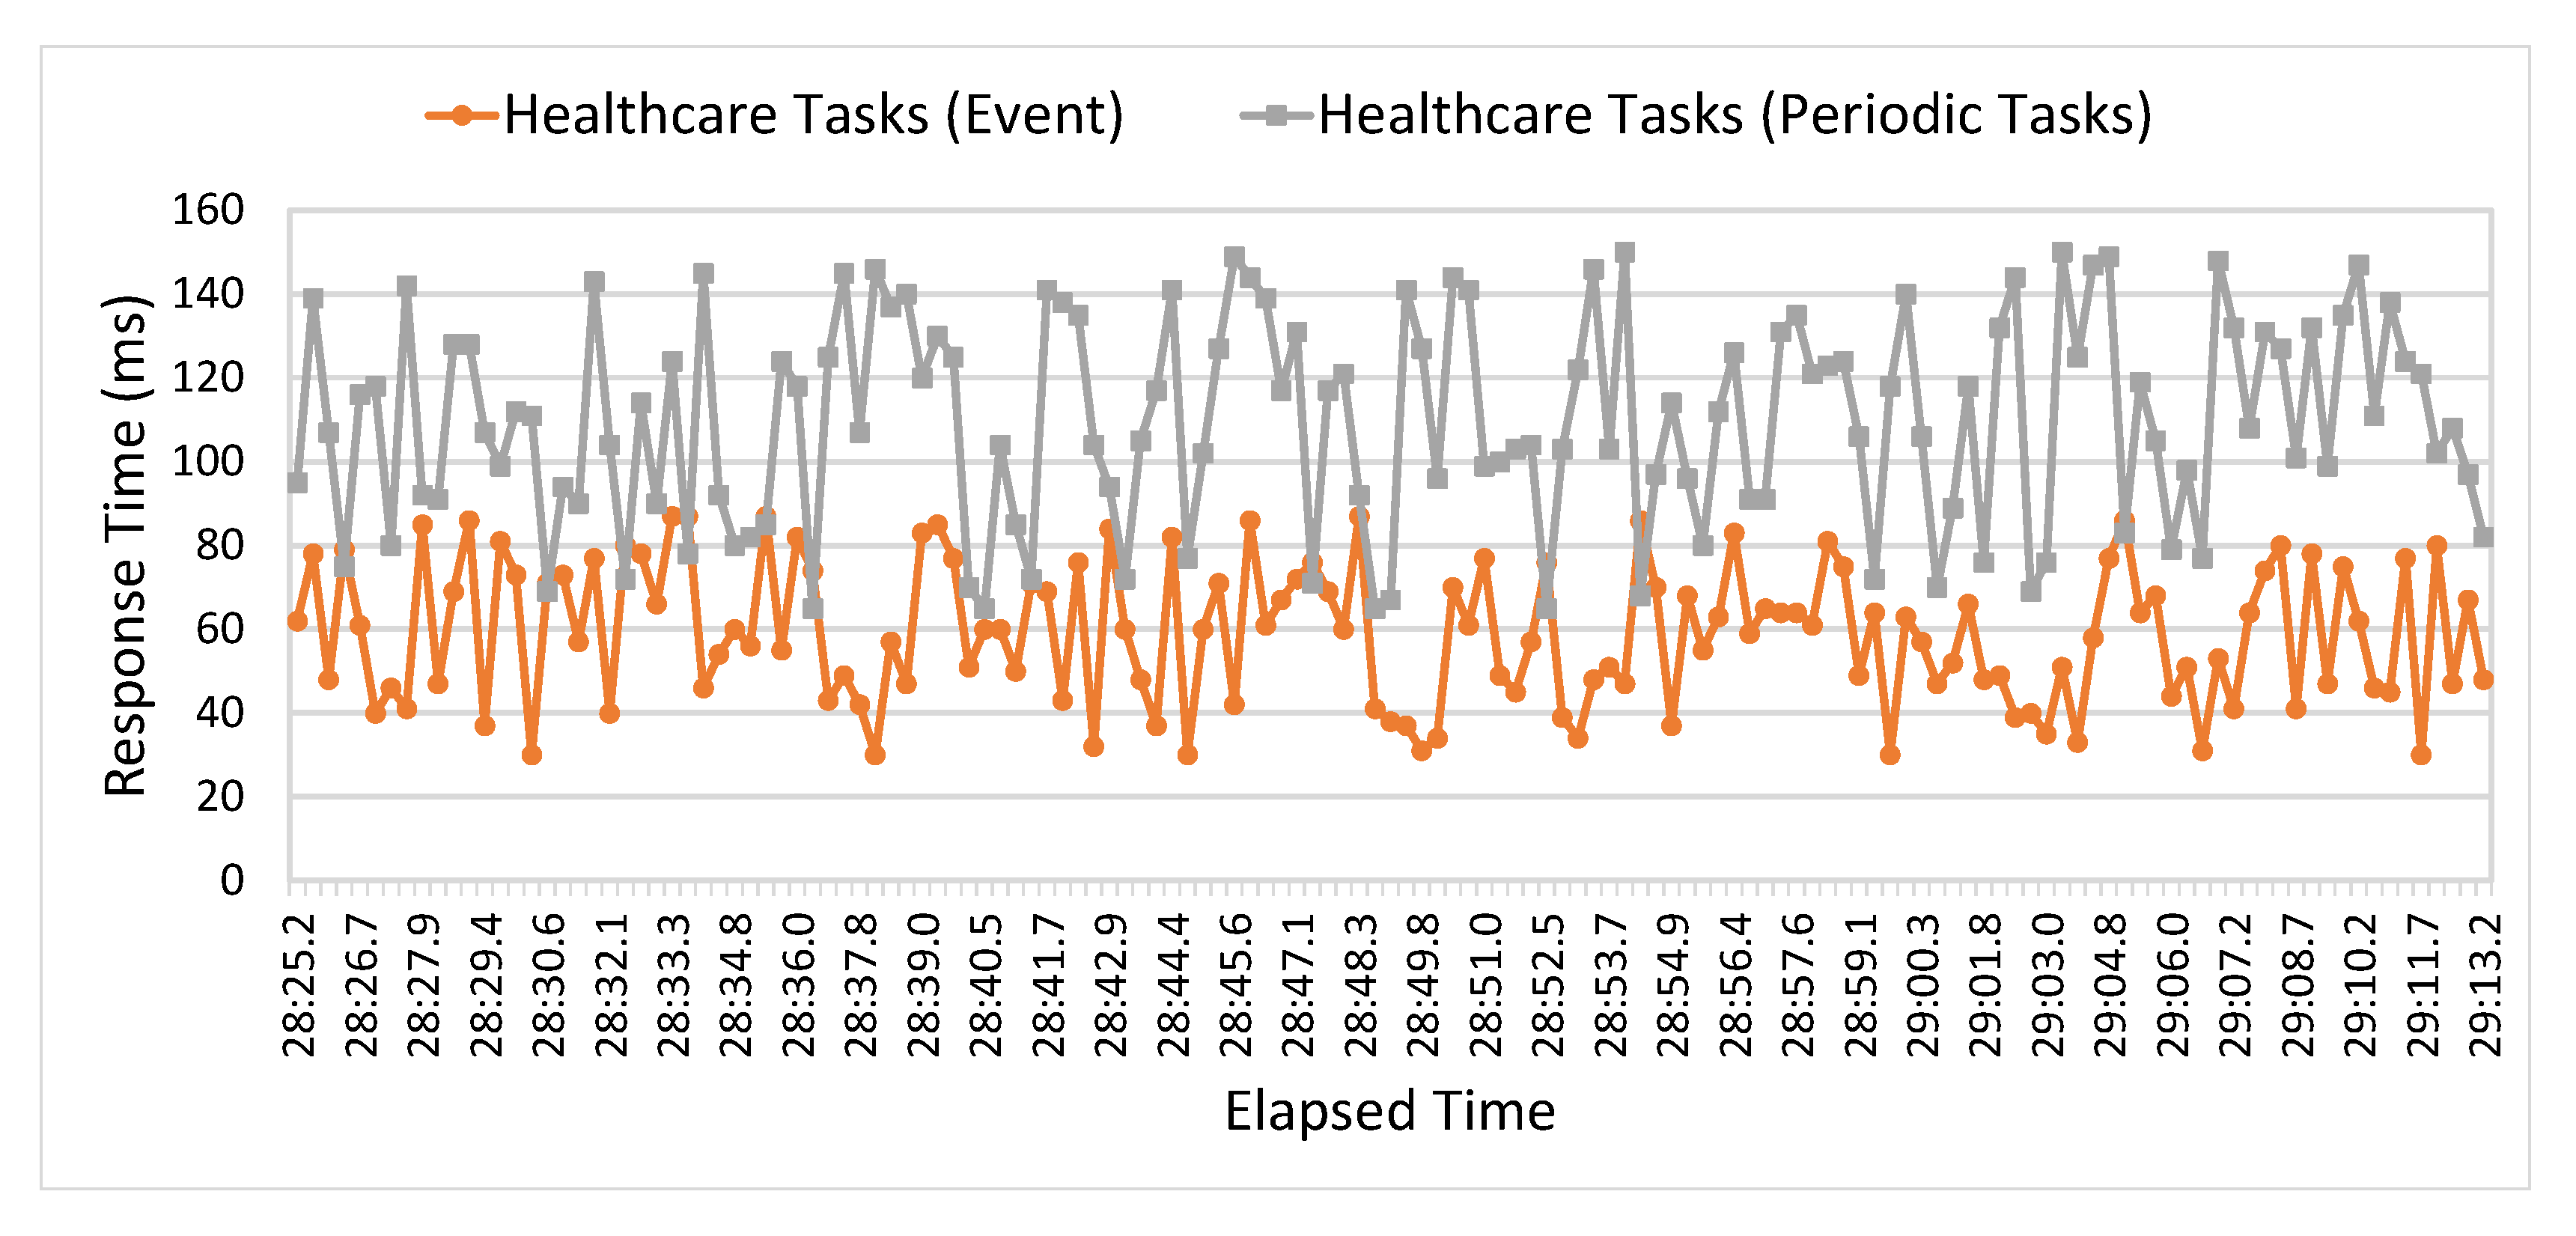
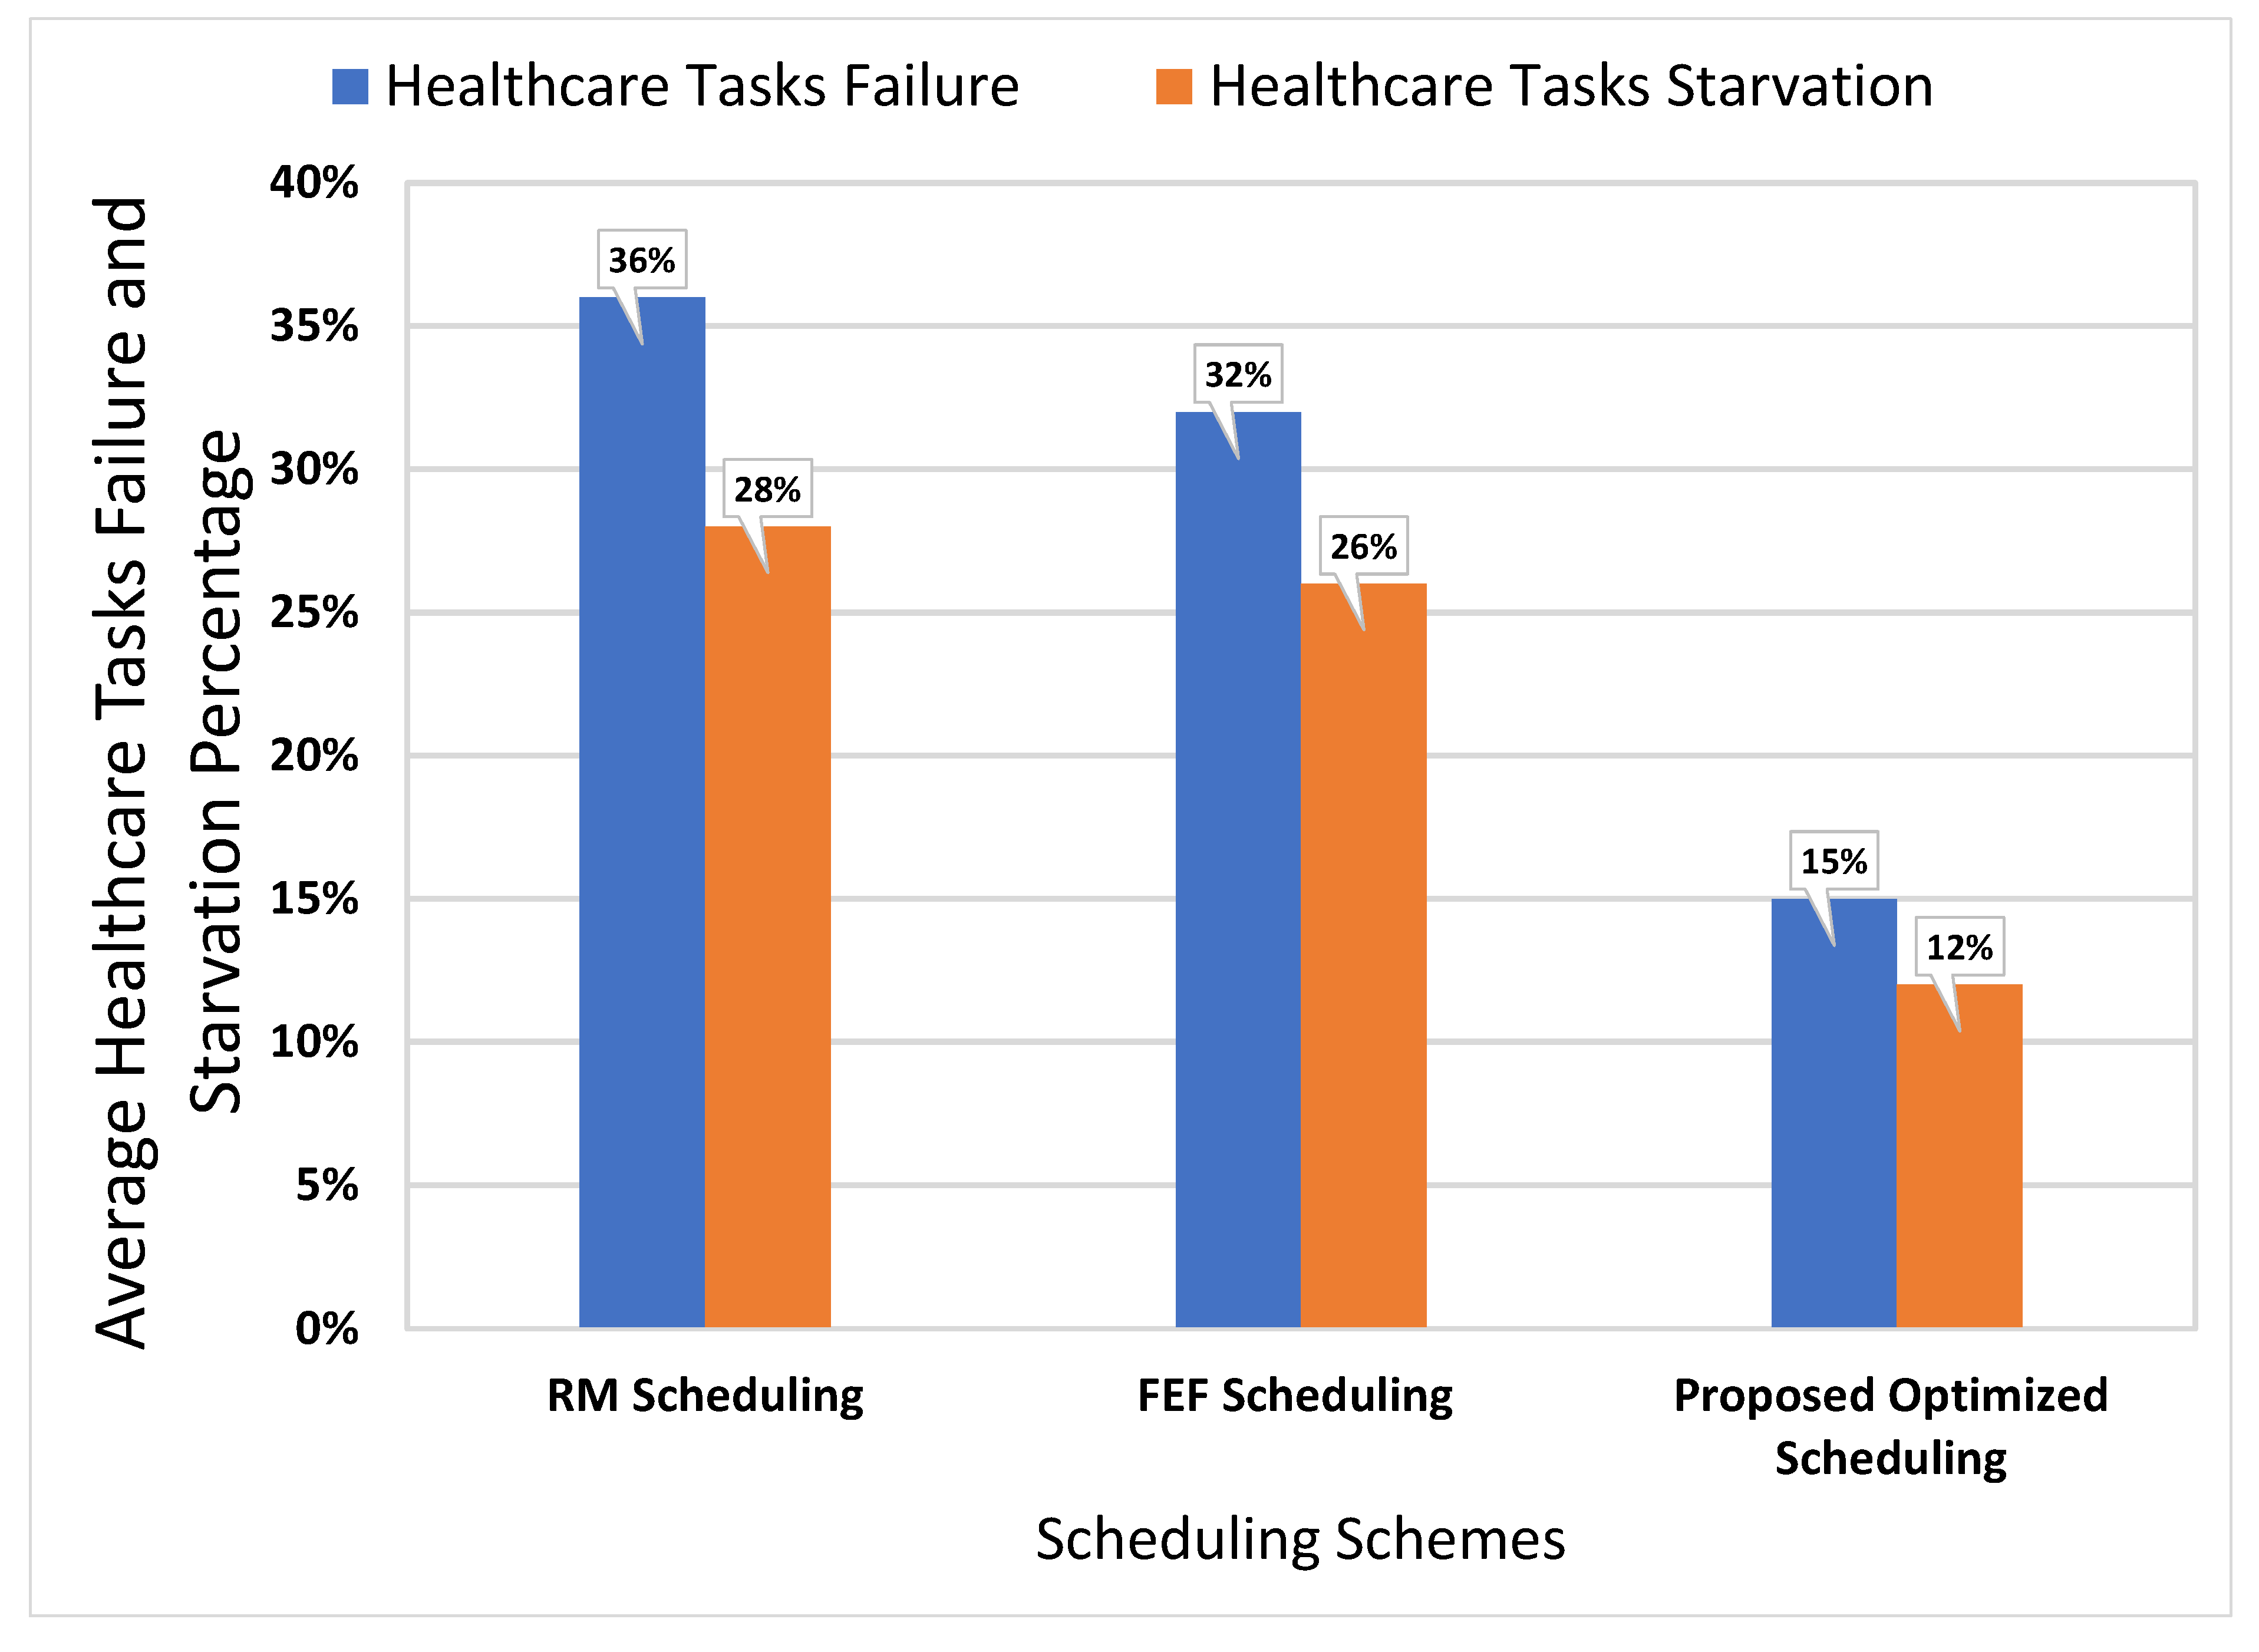
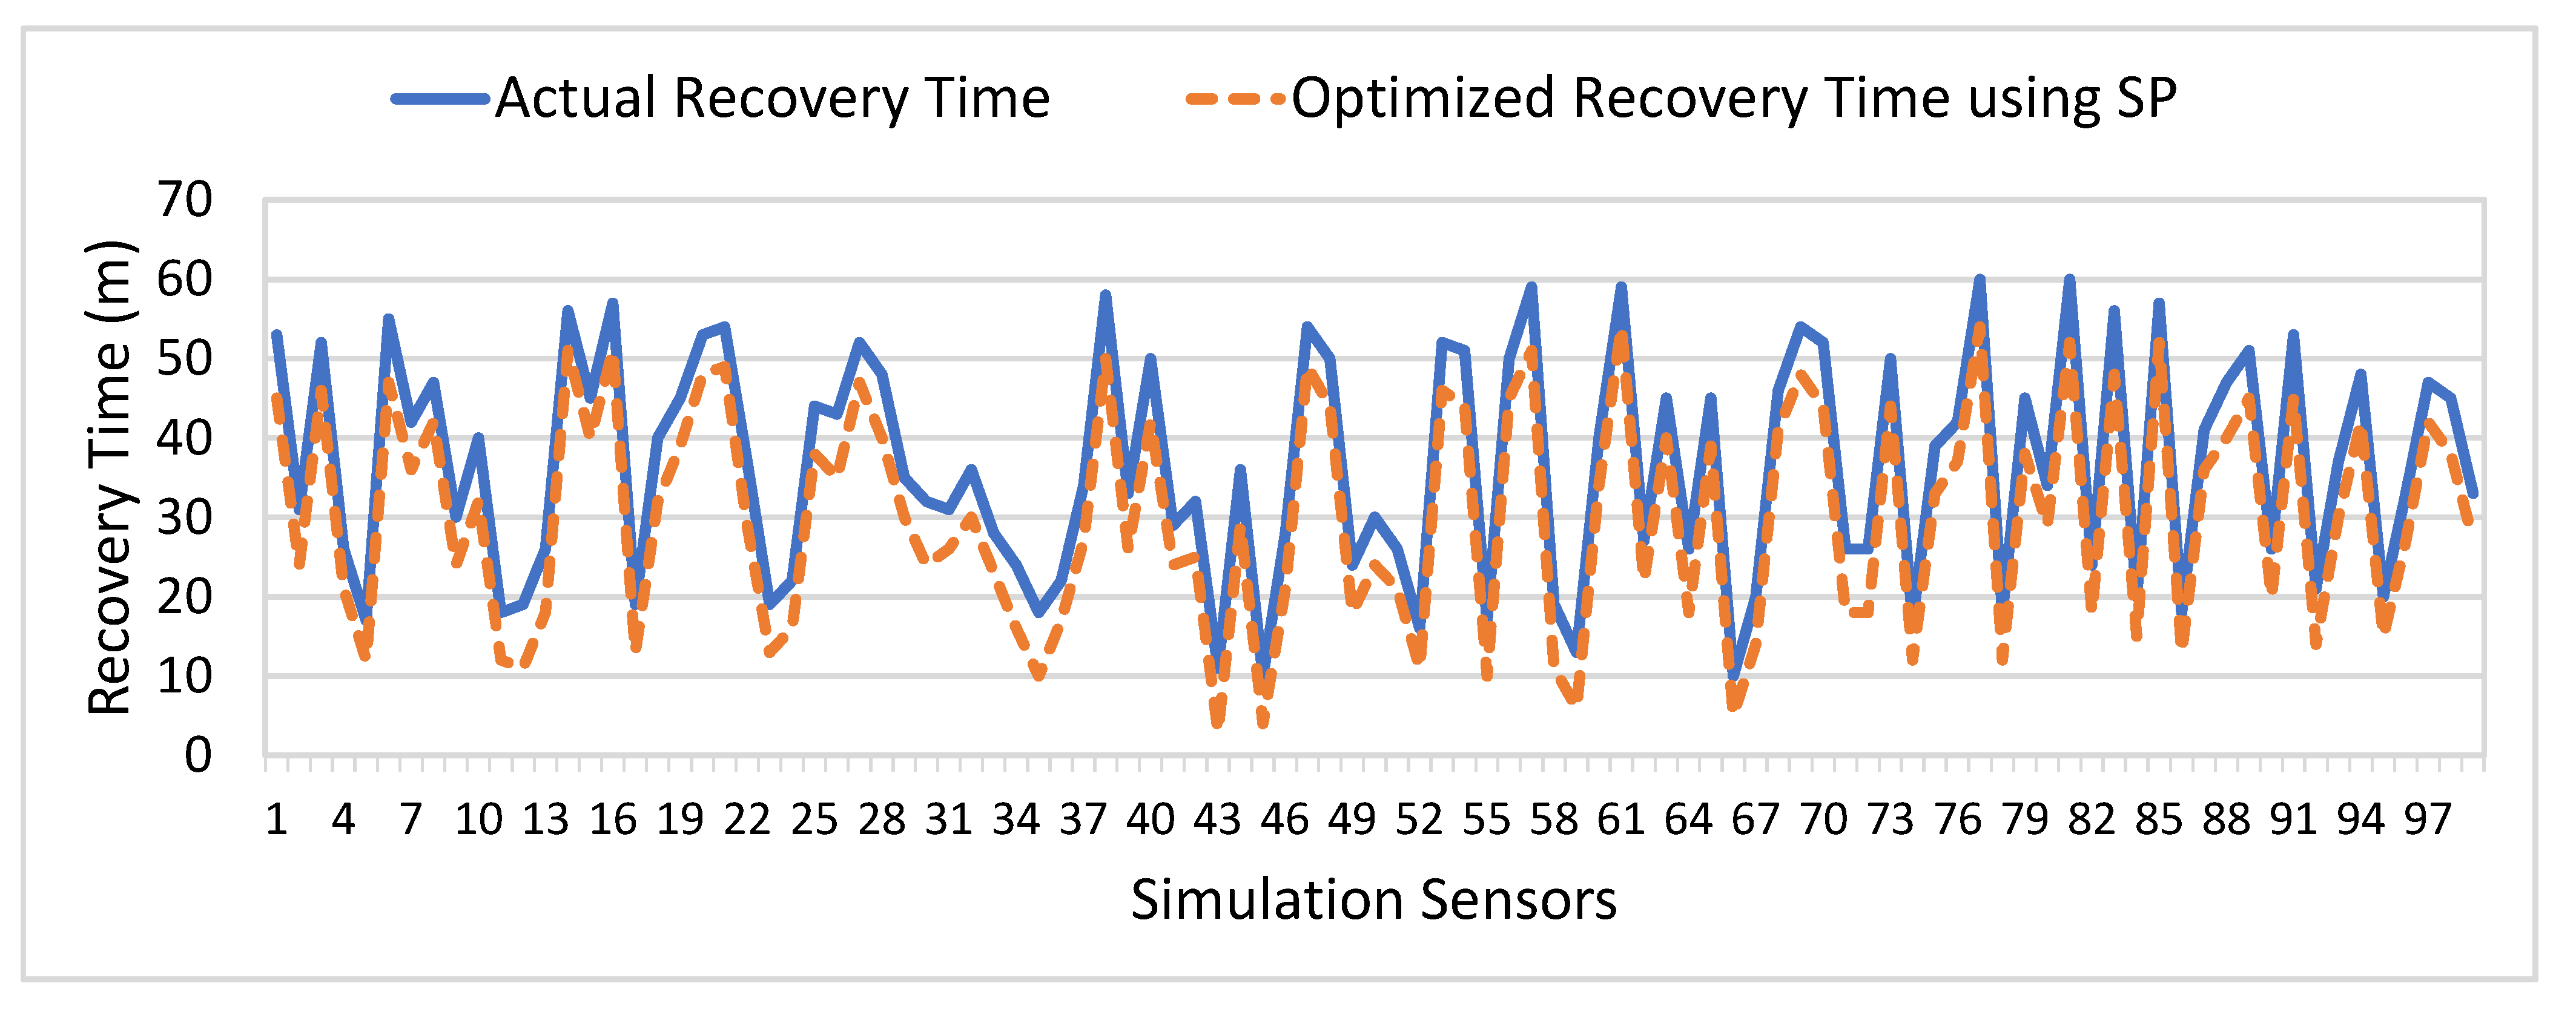
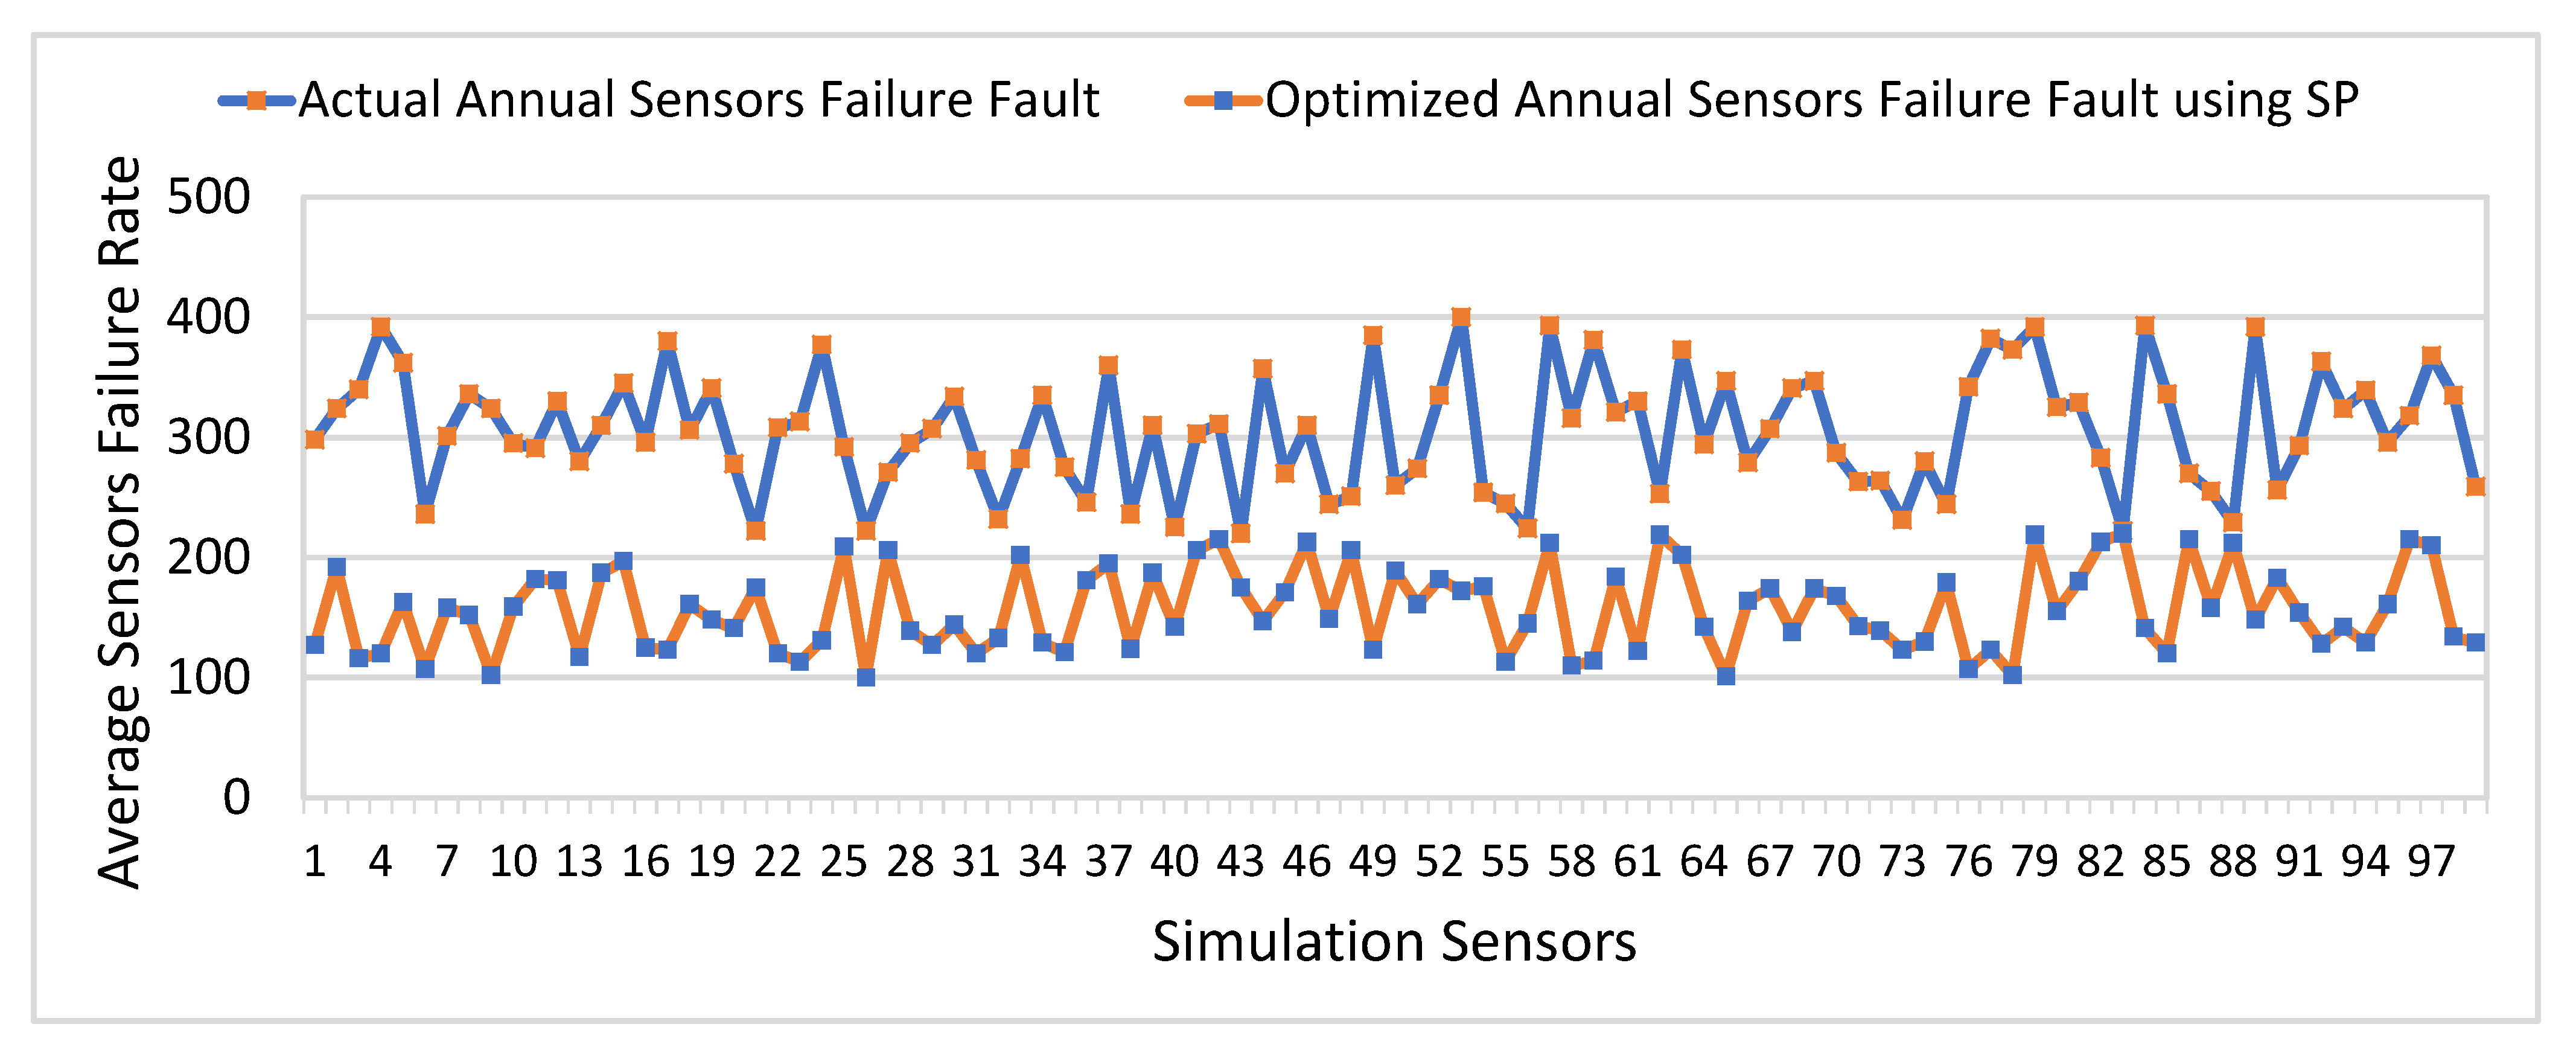
Publisher’s Note: MDPI stays neutral with regard to jurisdictional claims in published maps and institutional affiliations. |
© 2021 by the authors. Licensee MDPI, Basel, Switzerland. This article is an open access article distributed under the terms and conditions of the Creative Commons Attribution (CC BY) license (https://creativecommons.org/licenses/by/4.0/).