
Optimizing the Performance of Pure ALOHA for LoRa-Based ESL


Abstract
:1. Introduction
2. Related Work
3. Methodology
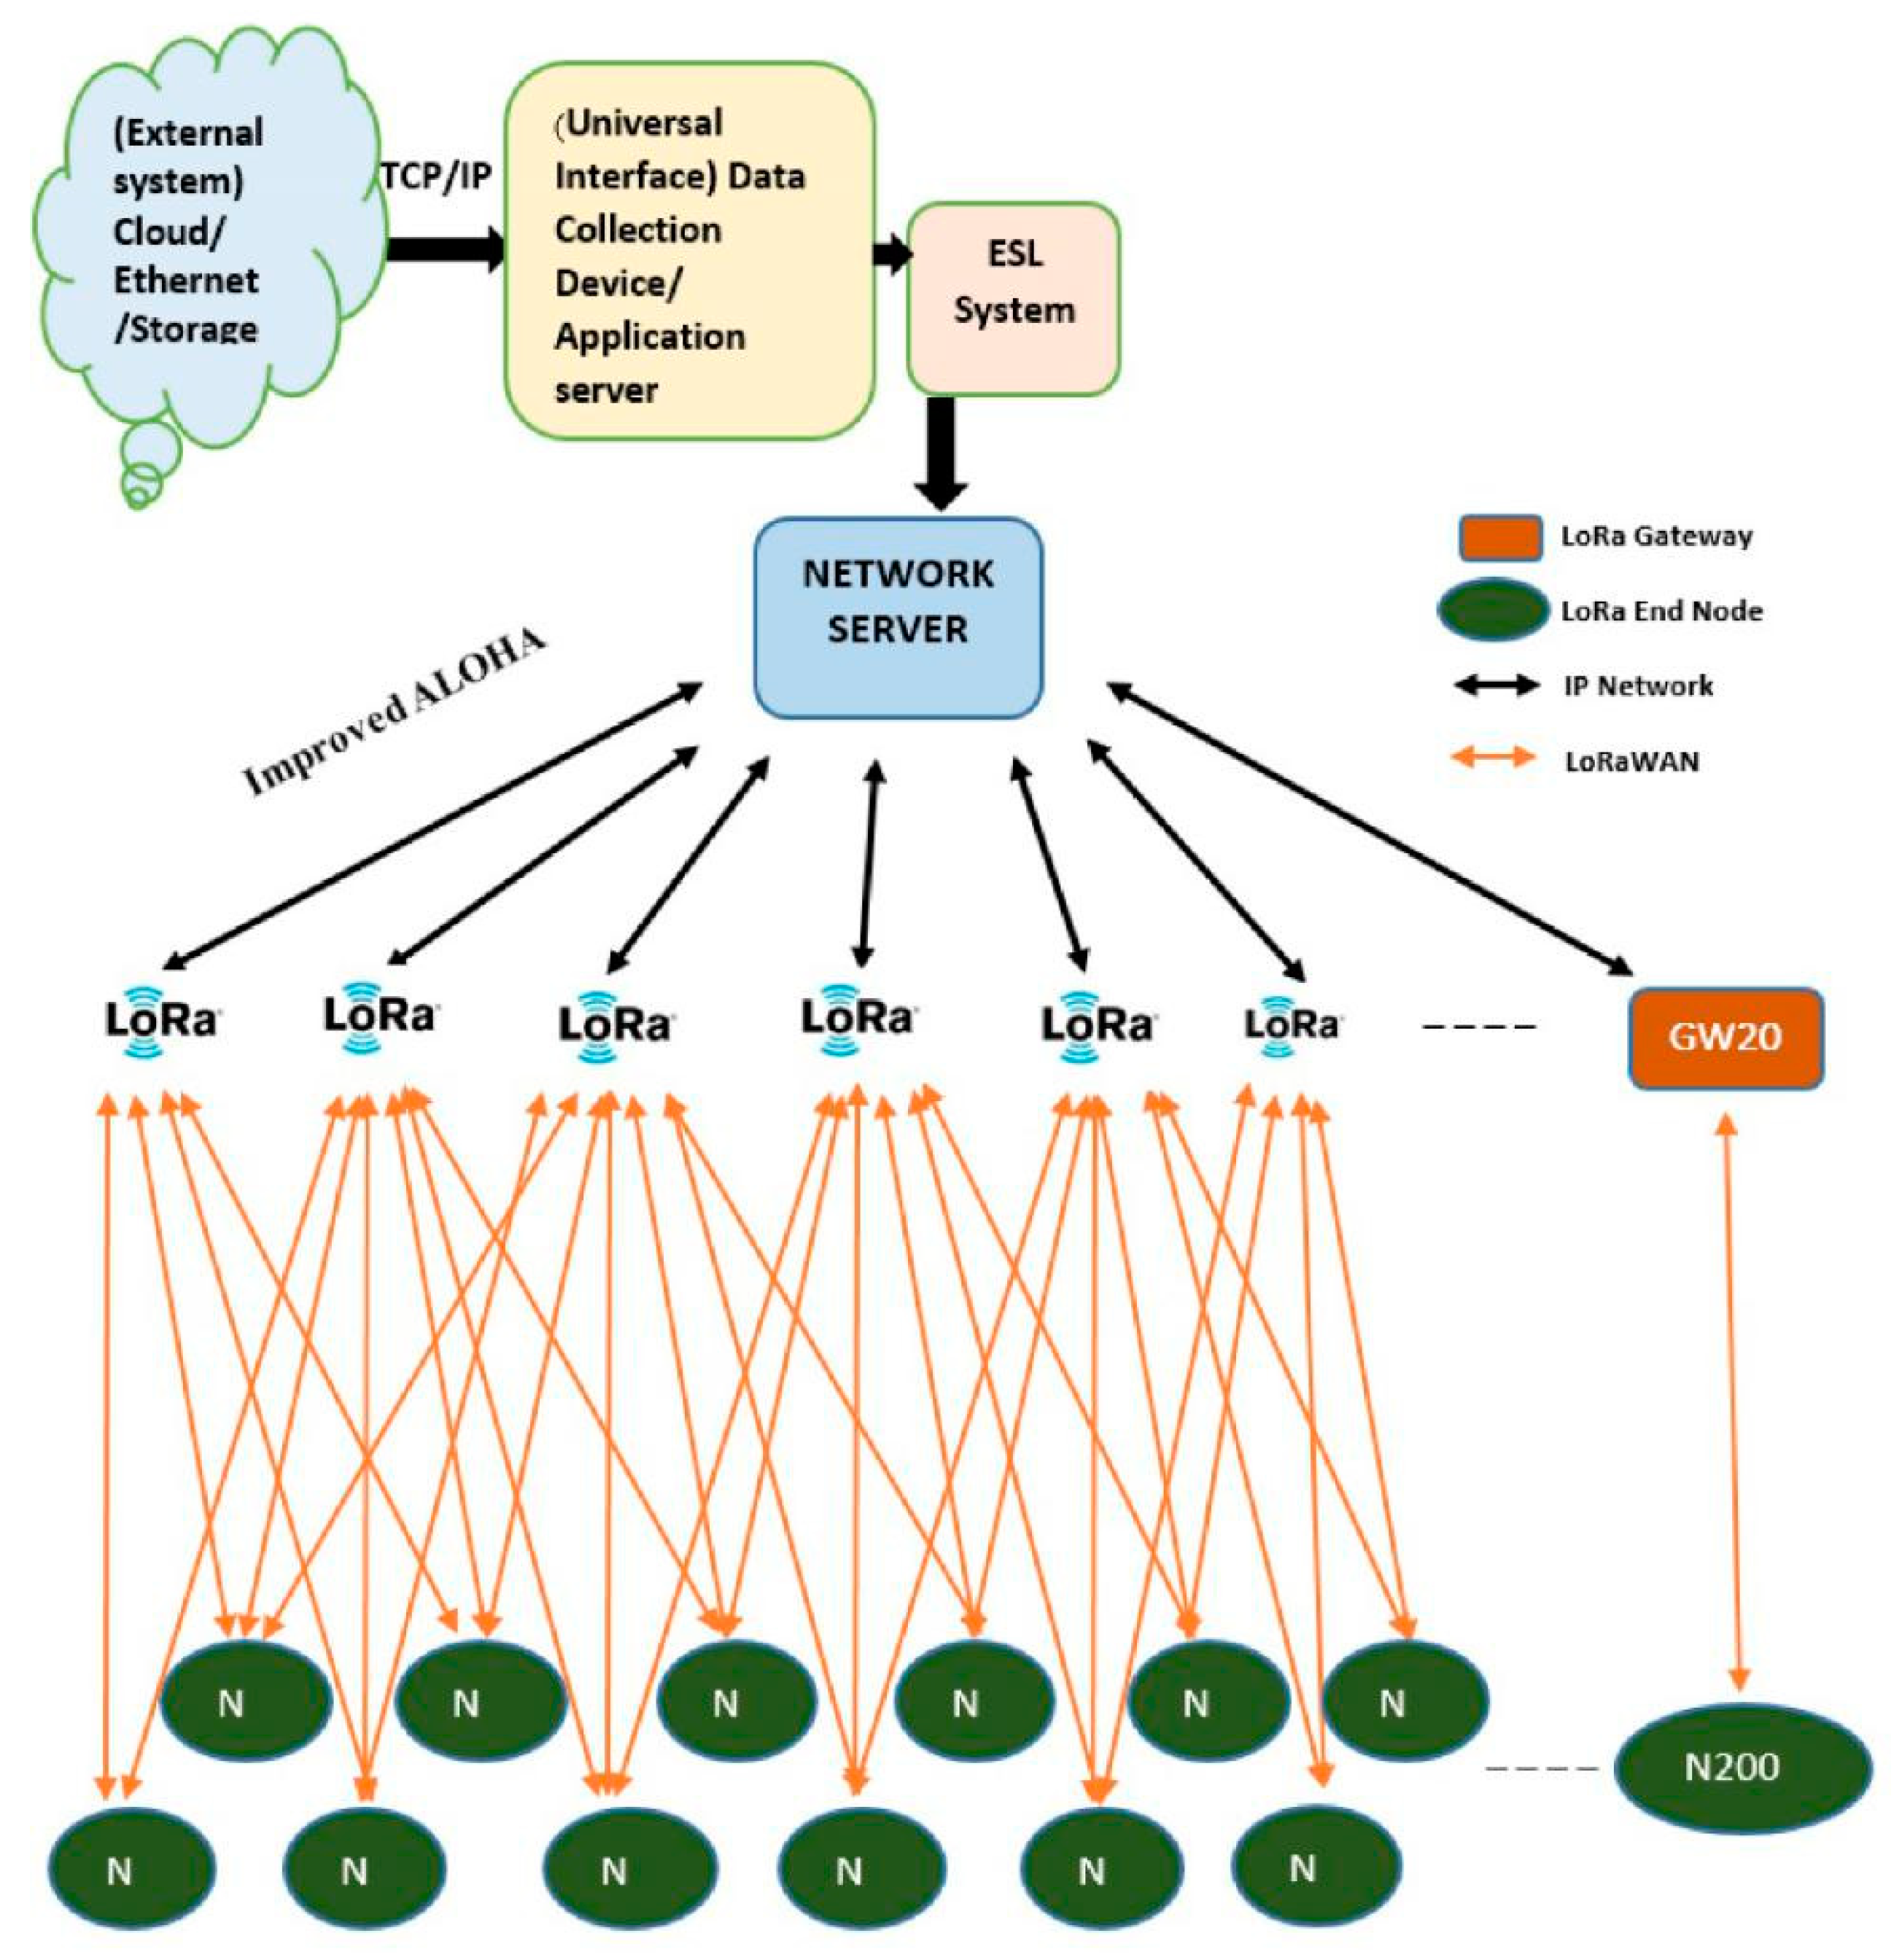
3.1. Improved ALOHA
| Algorithm 1. ALOHA |
| Input: ENs, GWs, D, DC Initialize: t, λ, BW, RSSI Ensure: for t = 7,8,…,12 do Calculate ENs’ RSSI for each cluster via Table 5 Estimate ENs’ using each combination of GWs via Table 6 if (DCLimit > DC) and (ToAMLA > ToAt) then GW transmits data to EN else if (DC == DCLimit) & (ToAMLA > DC) then Higher the BW else if (Sat.MLA > Sat.Limit) & (ToAMLA < DC) then Lower the BW else alert unsuccessful transmission end if end for ACK==ACKLimit GW synchronizes EN |
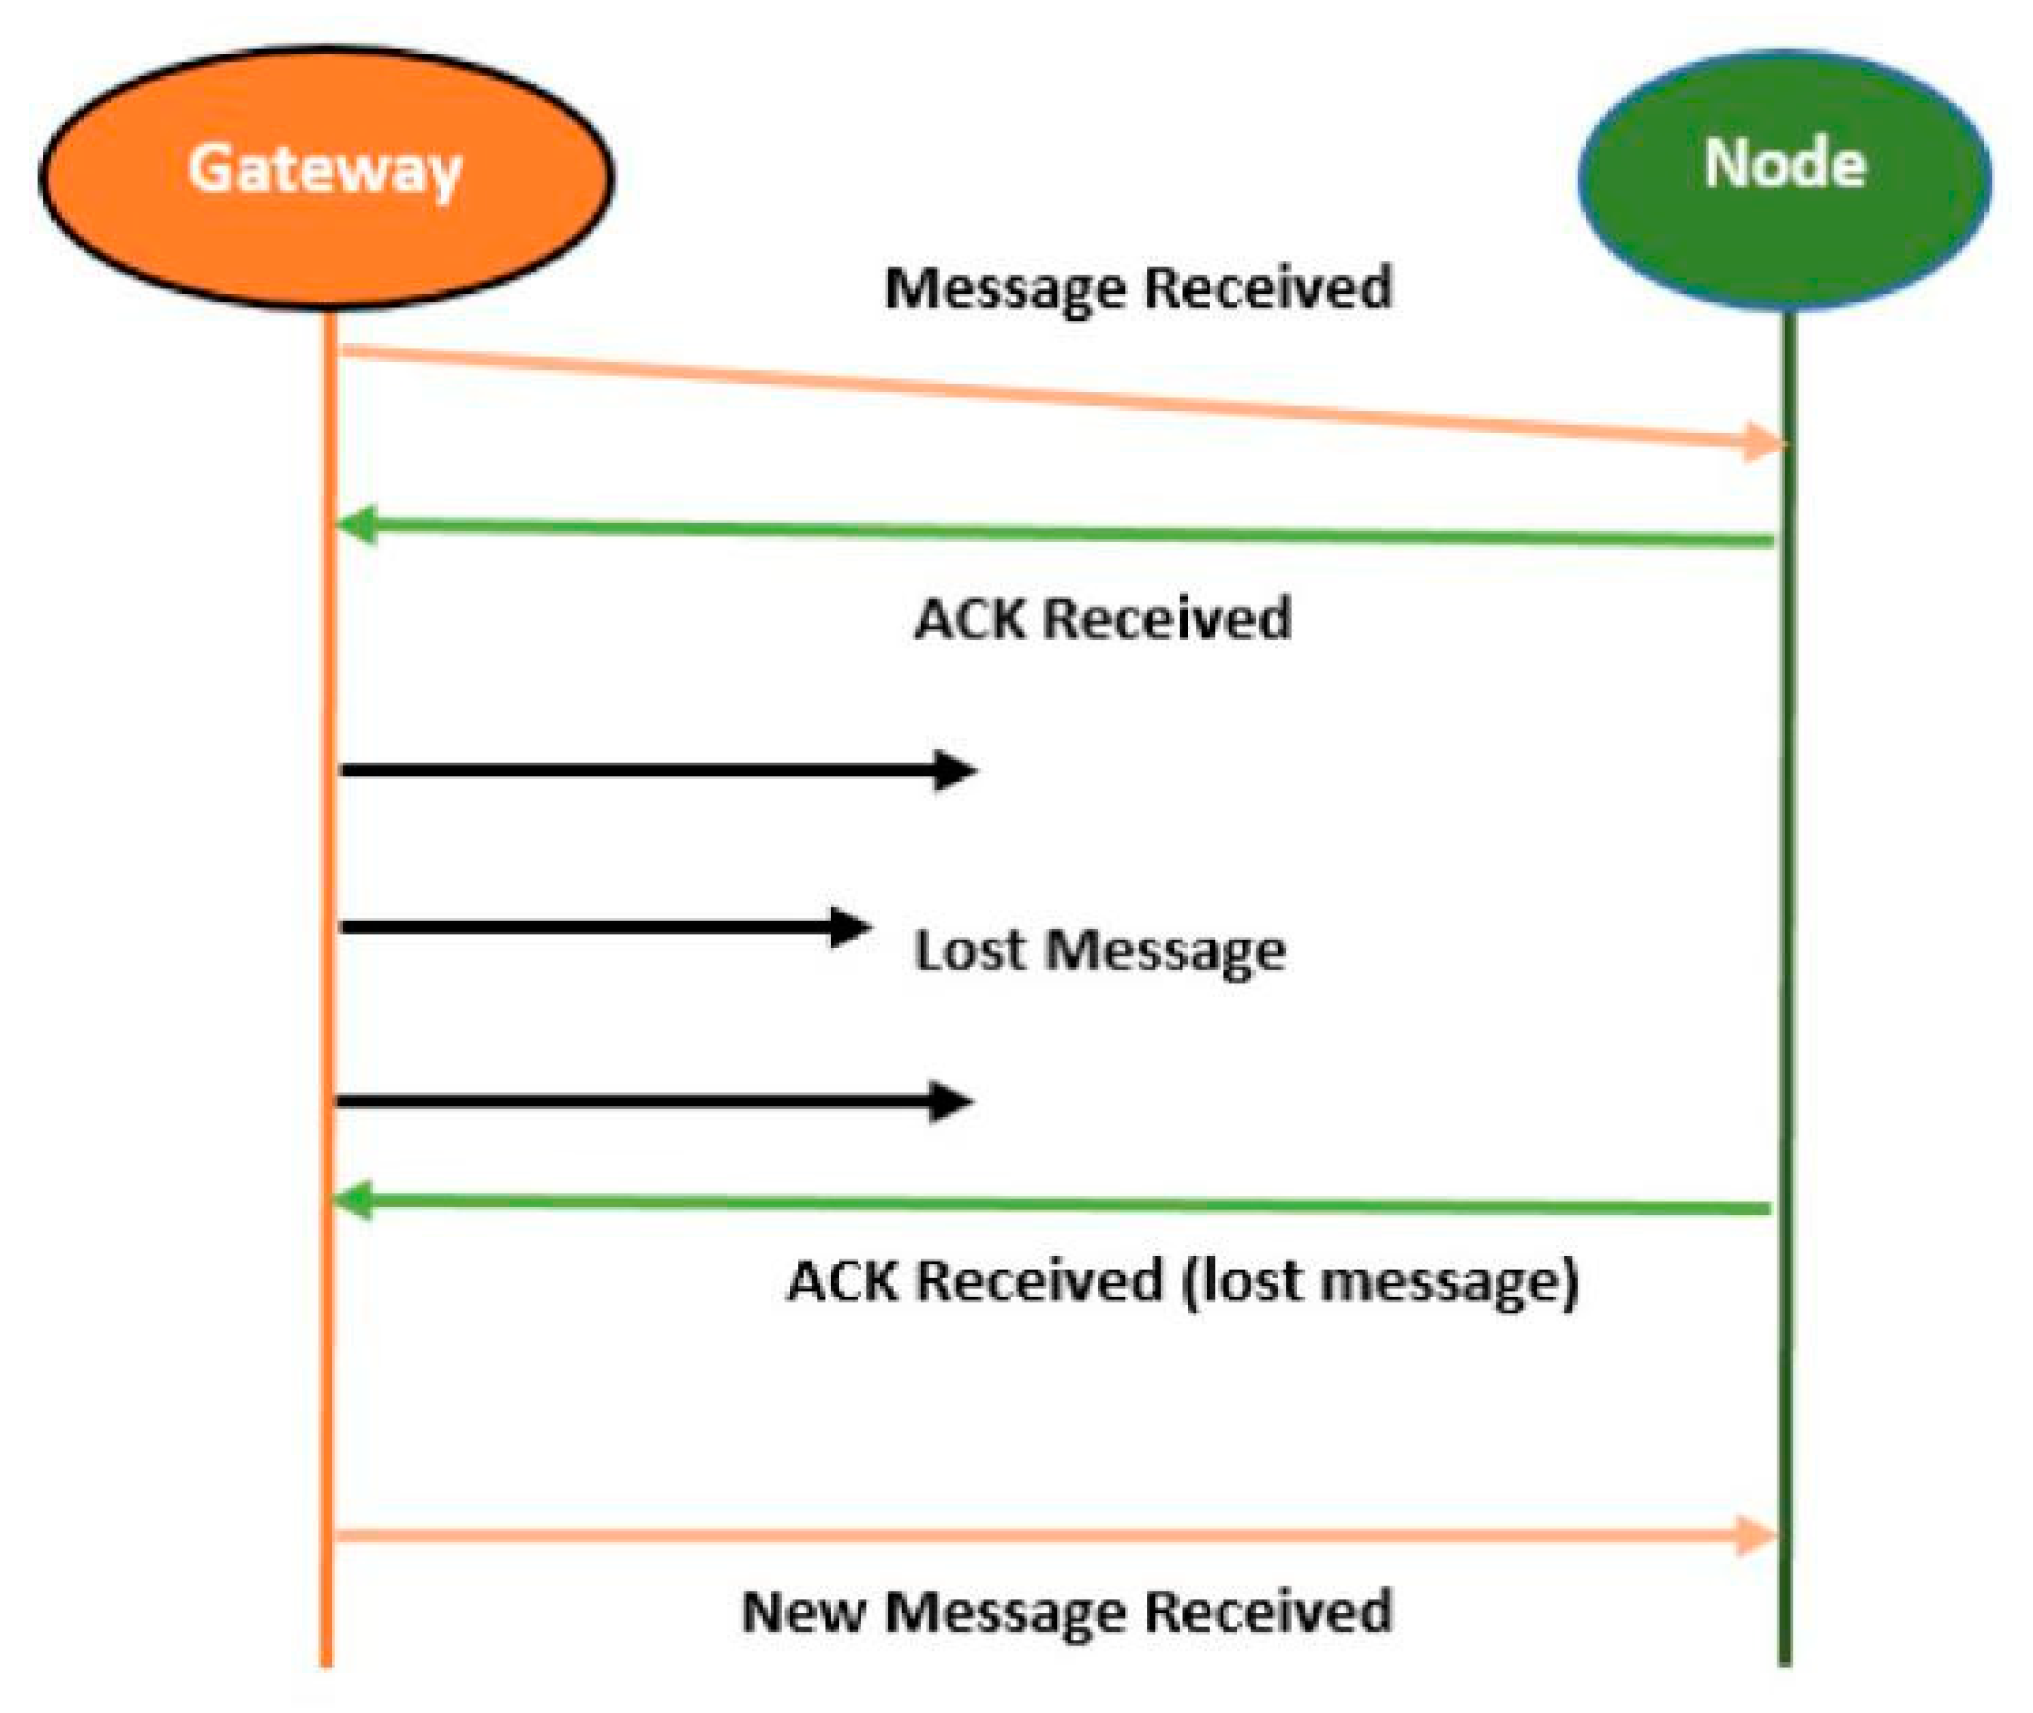
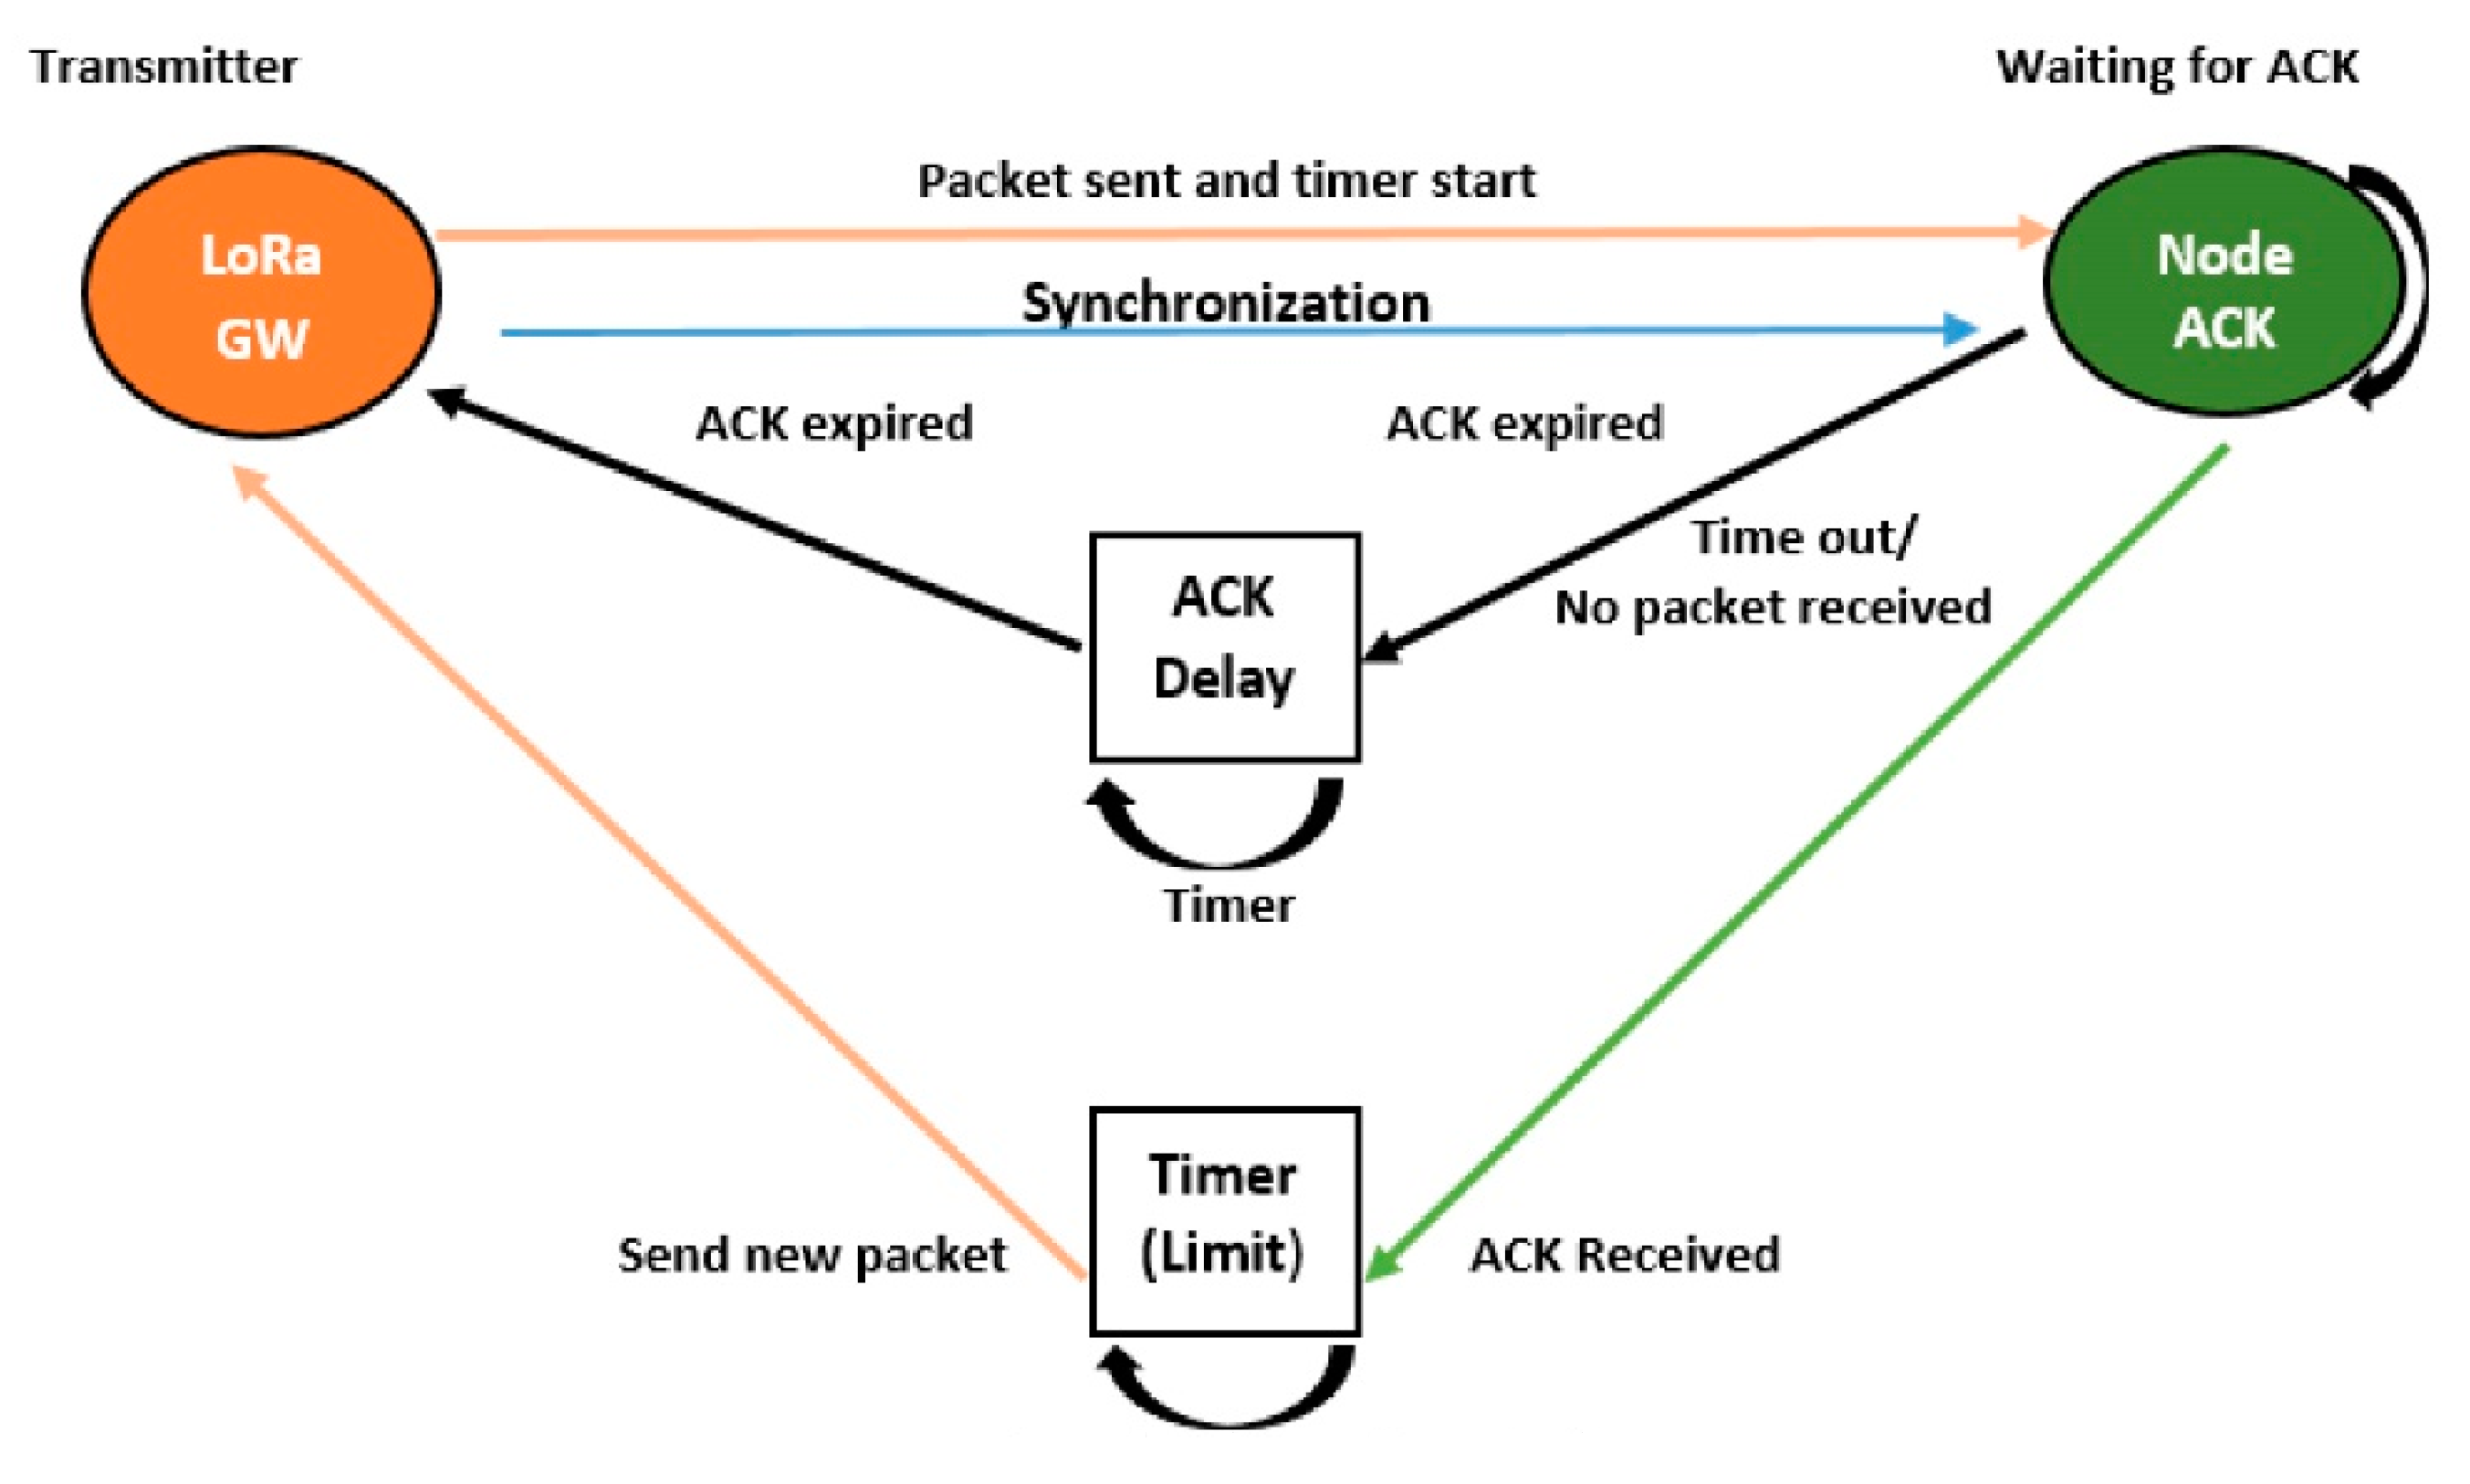
3.2. Improved Acknowledgment
| Algorithm 2. Acknowledgment |
| Input: DC, D Initialize: ENs/SF to GW via Table 2 ACKLimit = ToA + ACK’s time + Synchro. via Figure 5 Ensure: ACKCNT = 0 for all ENs in the range of GW for UL transmission do ACKCNT = ToA + ACK’s time ACK not received then ACKCNT== ACKLimit NS sends six symbols of preamble for Synchronization via Table 3 end for for ACKCNT ≥ ACKLimit + Synchro. do RSSI Estimation to find the locality of EN via Table 4 end for for DL transmission received do ACKCNT = 0 end for |
4. Implementations and Results
4.1. Configurations and Conditions for ALOHA
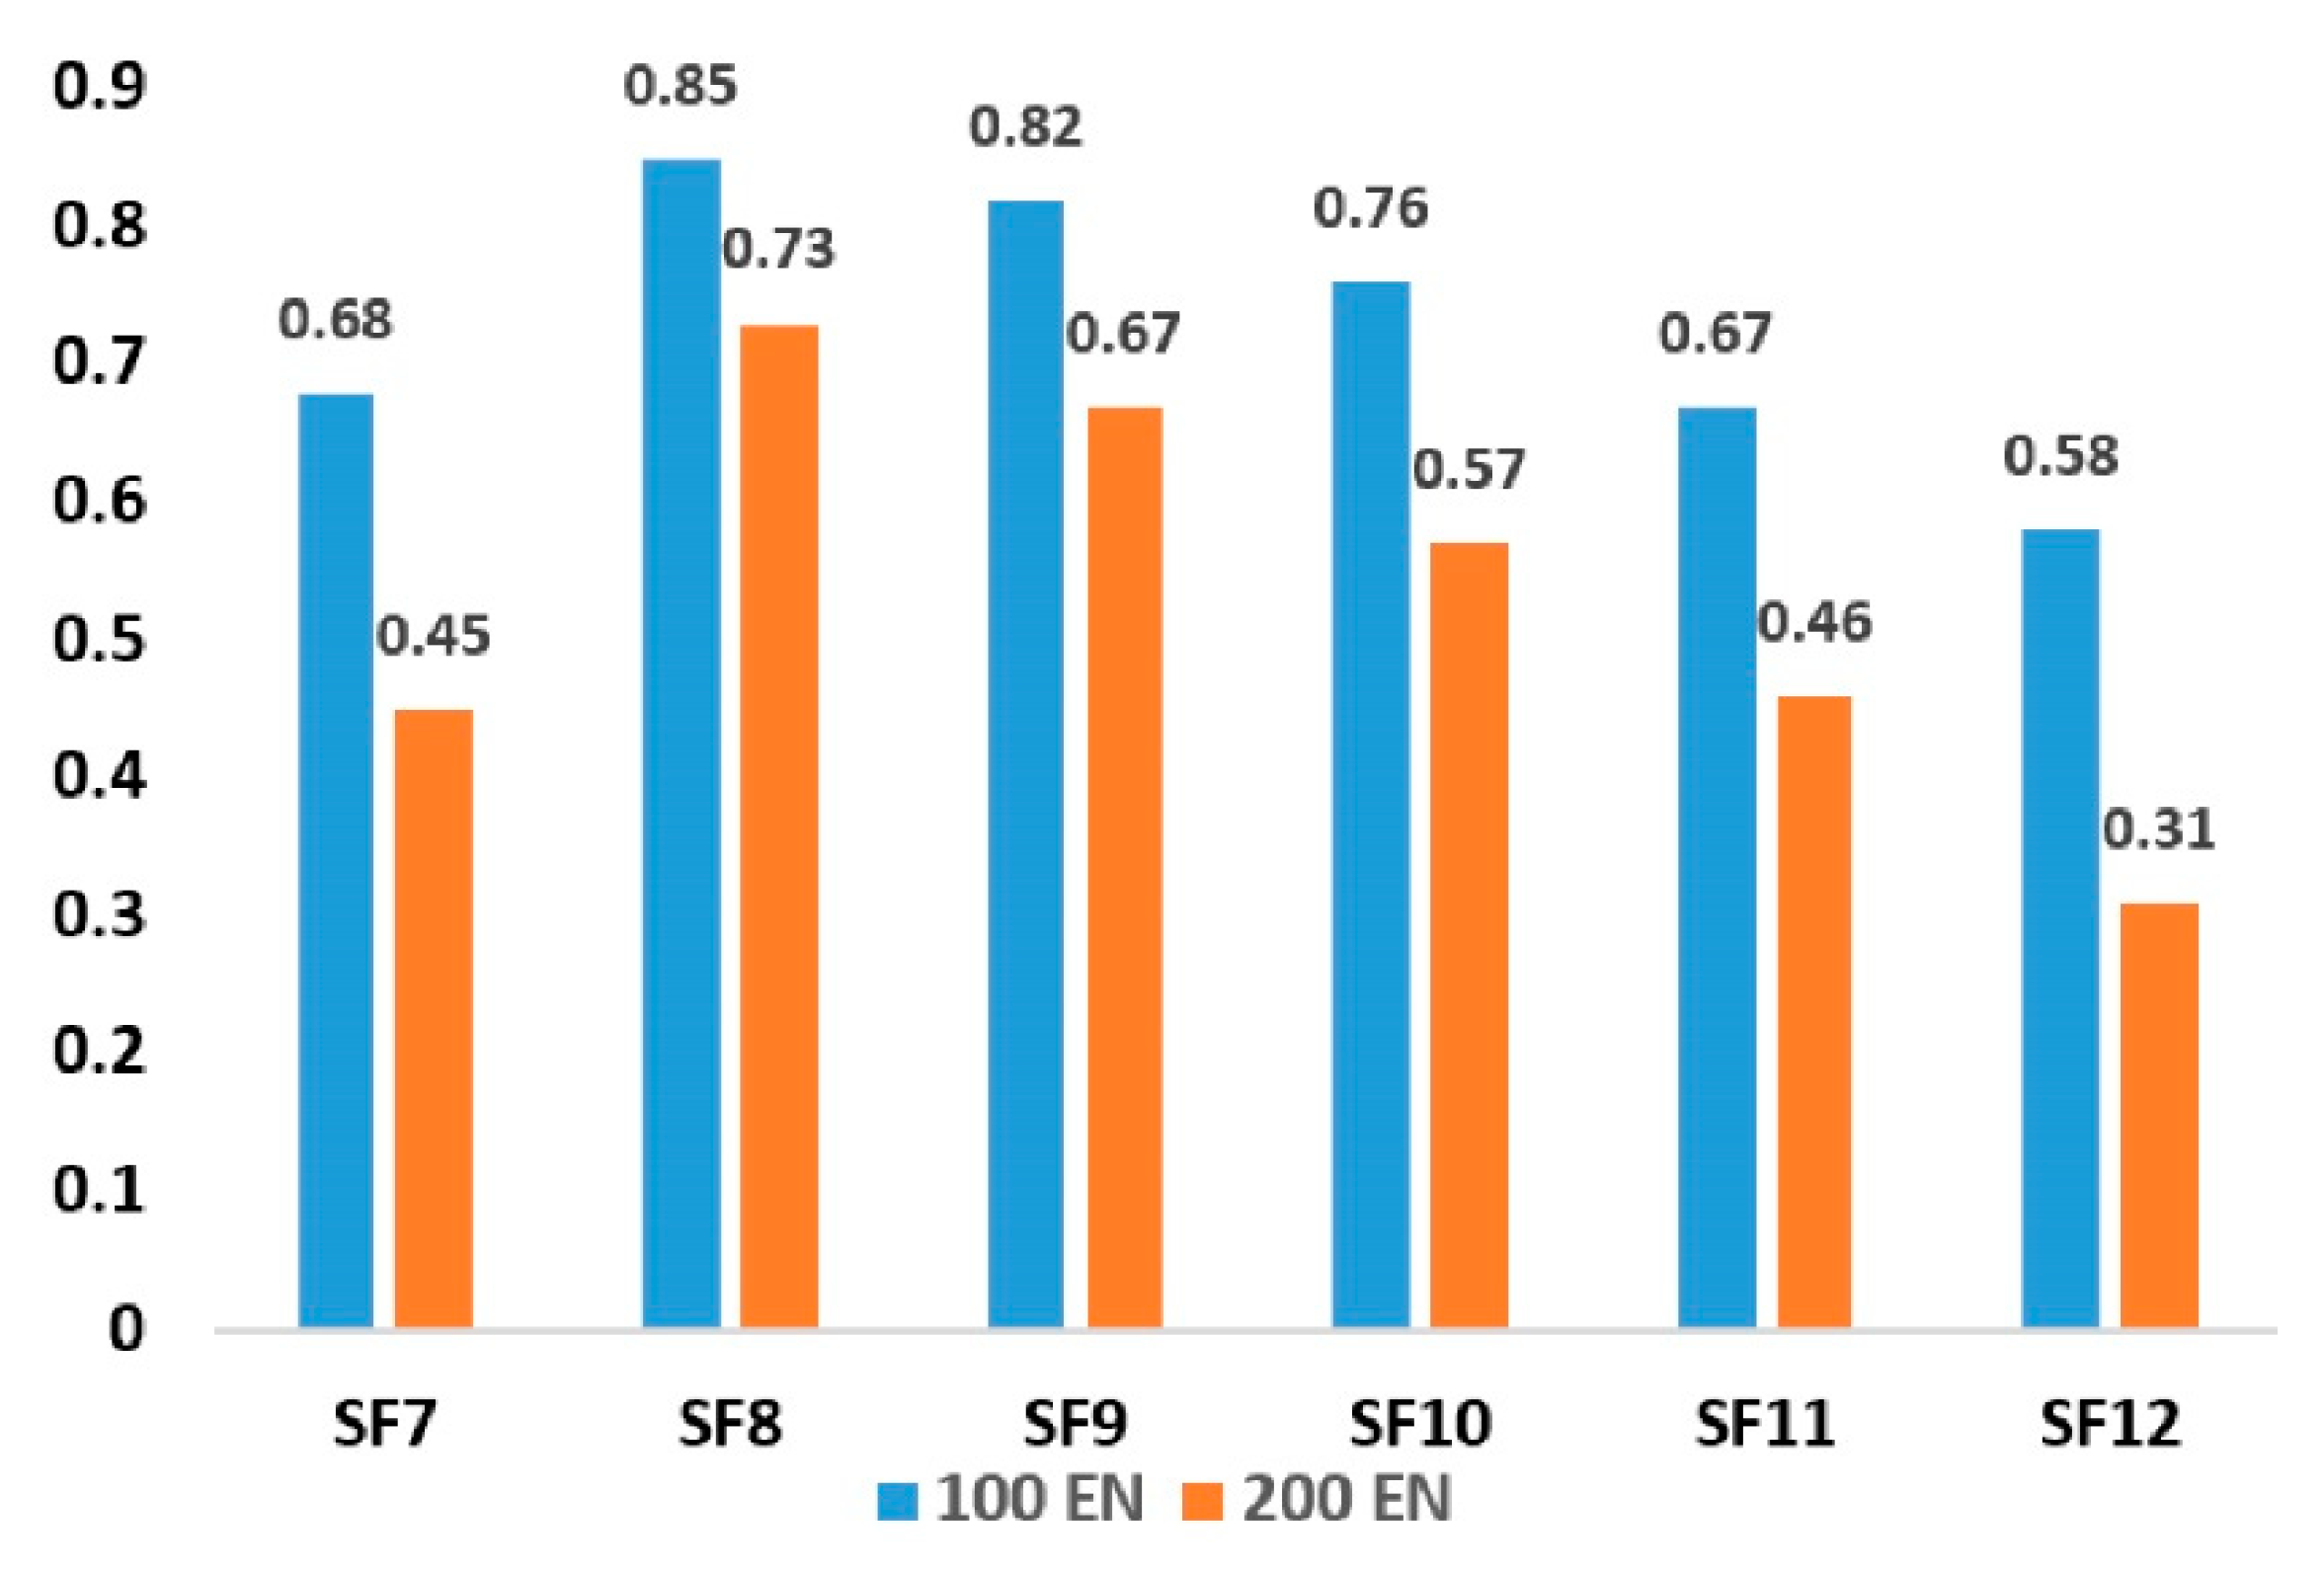
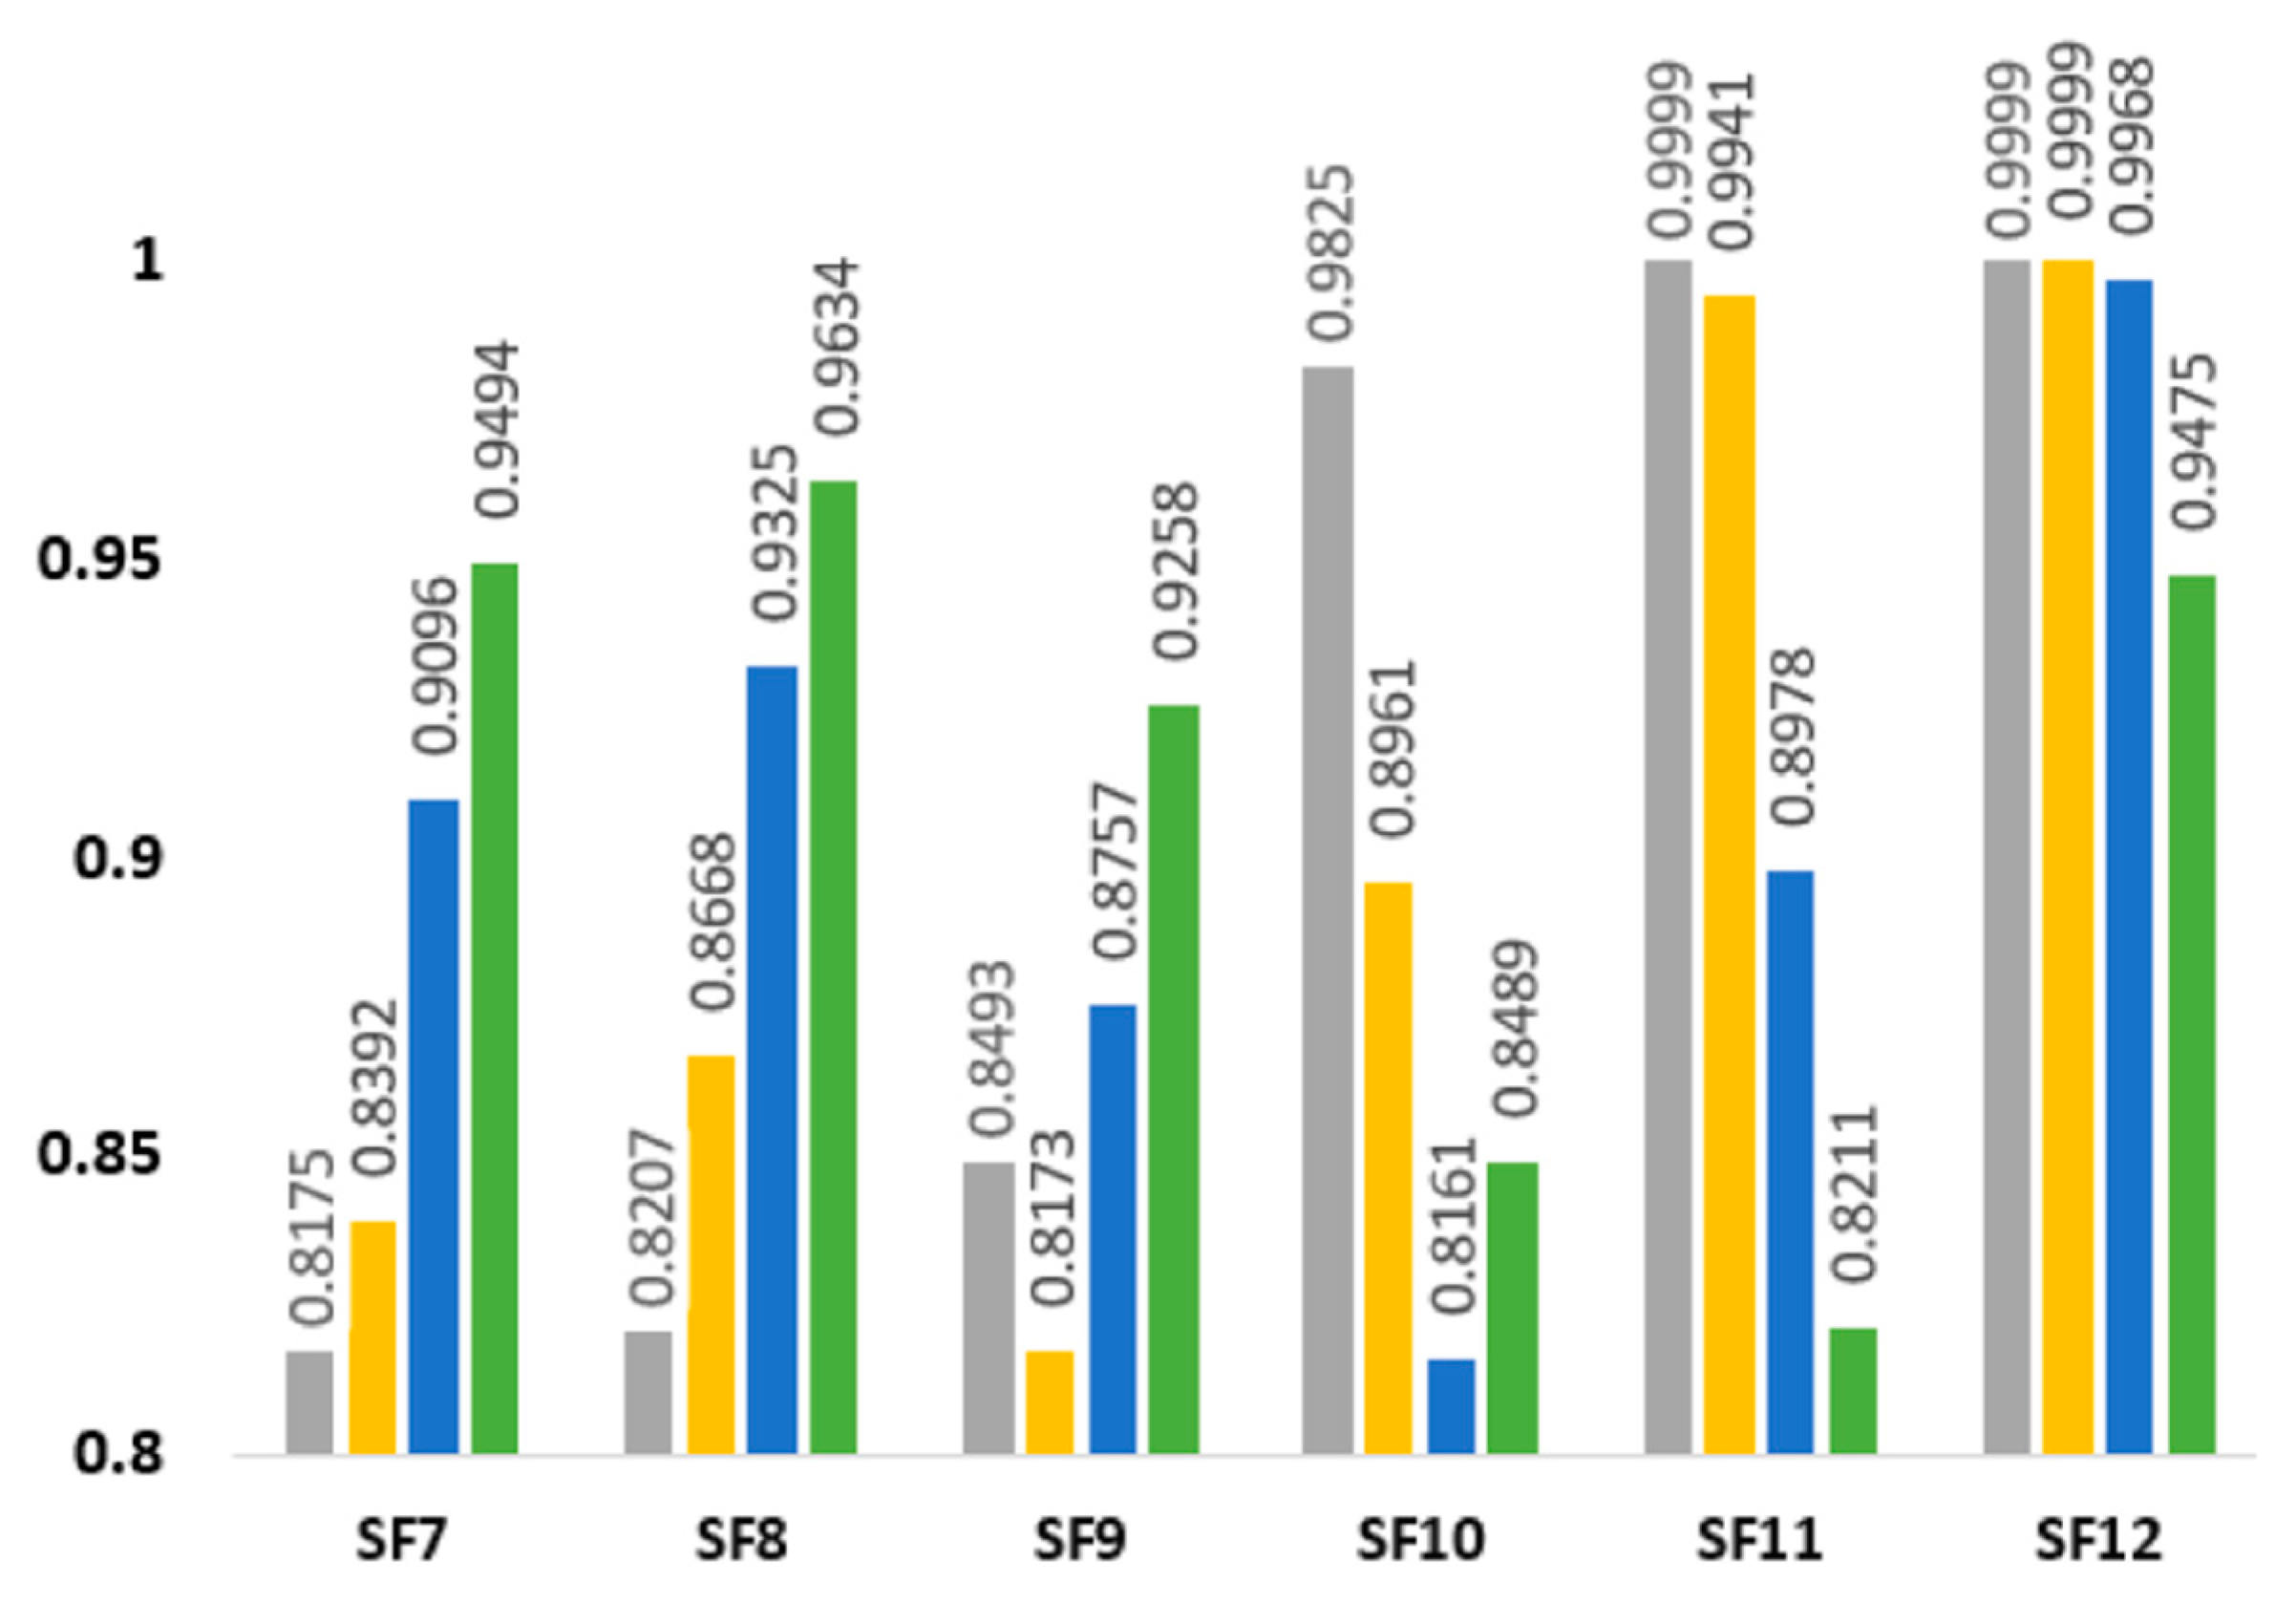
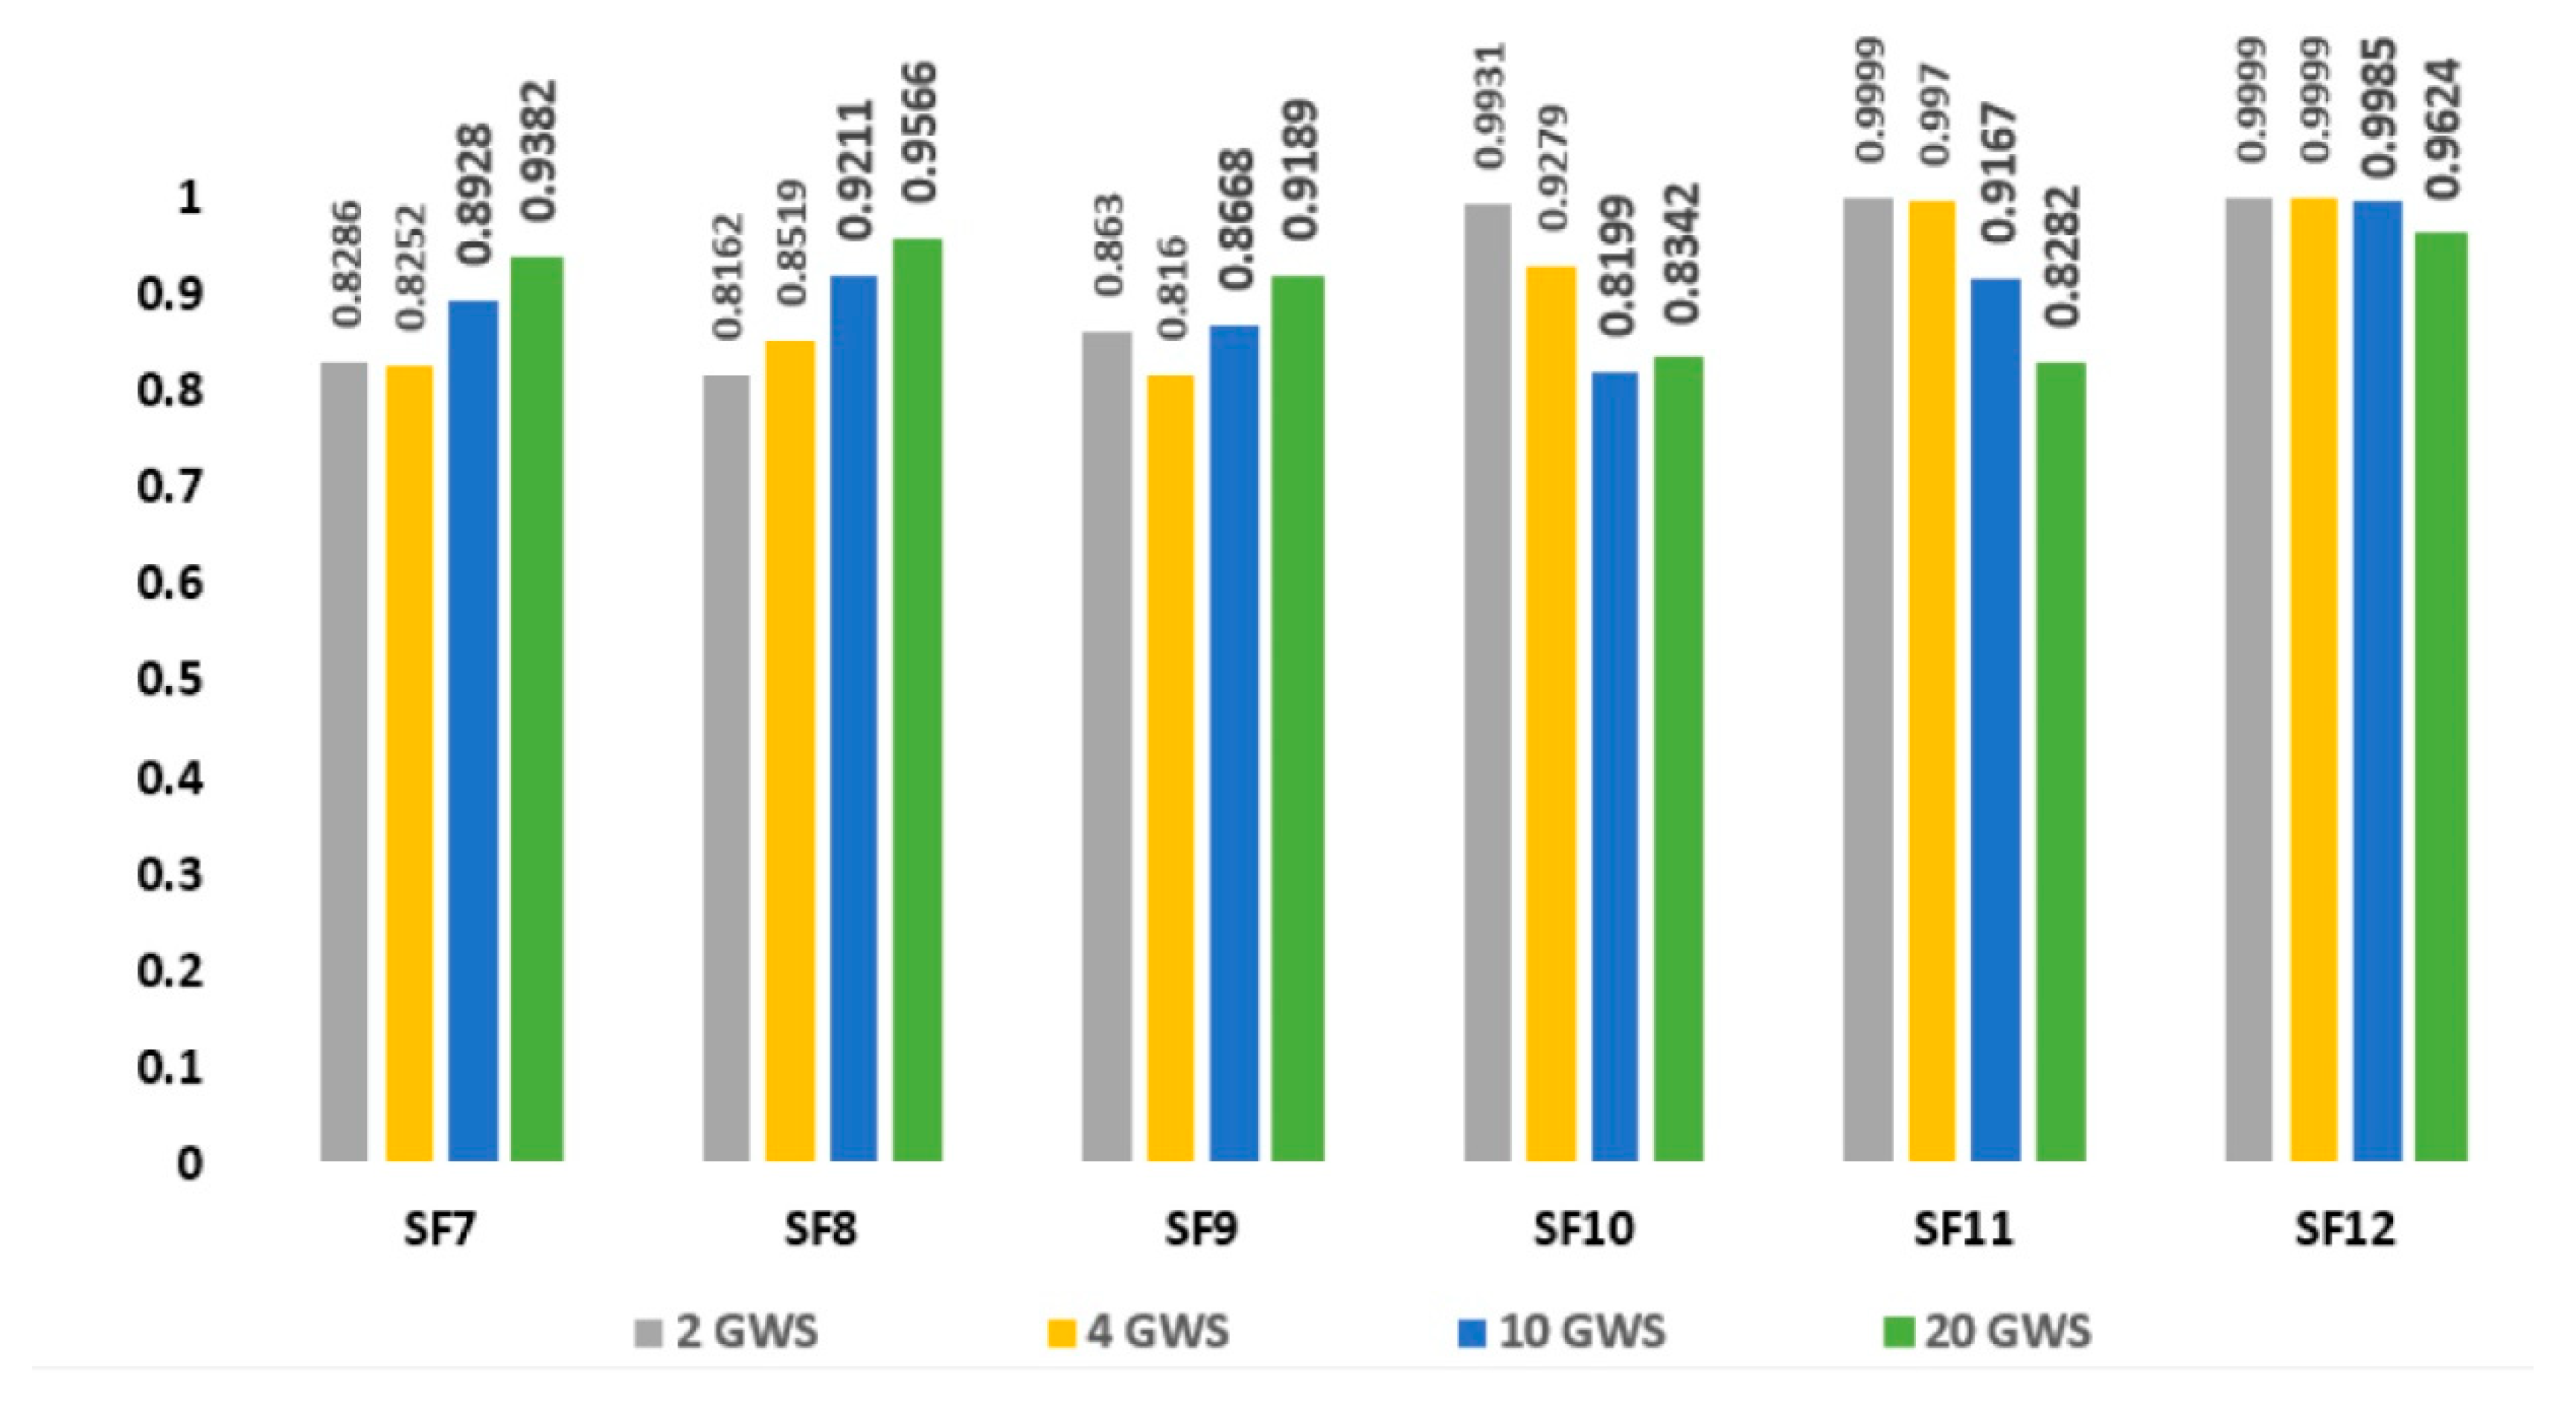
4.2. Implementations and Results
5. Conclusions
Author Contributions
Funding
Institutional Review Board Statement
Informed Consent Statement
Data Availability Statement
Acknowledgments
Conflicts of Interest
References
- Khan, M.A.A.; Lian, X.; Mirani, I.K.; Tan, L. Research on key technologies of electronic shelf labels based on LoRa. J. Big Data 2021, 3, 49–63. [Google Scholar]
- Fernández-Caramés, T.M.; Fraga-Lamas, P. A review on human-centered IoT-connected smart labels for the industry 4.0. IEEE Access 2018, 6, 25939–25957. [Google Scholar] [CrossRef]
- Srinidhi, N.N.; Dilip Kumar, S.M.; Venugopal, K.R. Network optimizations in the Internet of Things: A review. Eng. Sci. Technol. Int. J. 2019, 22, 1–21. [Google Scholar] [CrossRef]
- Kim, S.; Yoo, Y. Contention-aware adaptive data rate for throughput optimization in LoRaWAN. Sensors 2018, 18, 1716. [Google Scholar] [CrossRef] [PubMed] [Green Version]
- Park, G.; Lee, W.; Joe, I. Network resource optimization with reinforcement learning for low power wide area networks. EURASIP J. Wirel. Commun. Netw. 2020, 2020, 176. [Google Scholar] [CrossRef]
- Zorbas, D.; Abdelfadeel, K.Q.; Cionca, V.; Pesch, D.; O’Flynn, B. Offline scheduling algorithms for time-slotted lora-based bulk data transmission. In Proceedings of the IEEE 5th World Forum on Internet of Things, Limerick, Ireland, 15–18 April 2019; pp. 949–954. [Google Scholar]
- Haxhibeqiri, J.; Van den Abeele, F.; Moerman, I.; Hoebeke, J. LoRa scalability: A simulation model based on interference measurements. Sensors 2017, 17, 1193. [Google Scholar] [CrossRef] [PubMed] [Green Version]
- Polonelli, T.; Brunelli, D.; Marzocchi, A.; Benini, L. Slotted aloha on lorawan-design, analysis, and deployment. Sensors 2019, 19, 838. [Google Scholar] [CrossRef] [PubMed] [Green Version]
- Rahmadhani, A.; Kuipers, F. When lorawan frames collide. In Proceedings of the 12th International Workshop on Wireless Network Testbeds, Experimental Evaluation & Characterization, New Delhi, India, 2 November 2018; pp. 89–97. [Google Scholar]
- Adelantado, F.; Vilajosana, X.; Tuset-Peiro, P.; Martinez, B.; Melia-Segui, J.; Watteyne, T. Understanding the limits of LoRaWAN. IEEE Commun. Mag. 2017, 55, 34–40. [Google Scholar] [CrossRef] [Green Version]
- Harwahyu, R.; Huang, C.C.; Cheng, R.G.; Sari, R.F. Impact of backoff algorithm on IoT over multichannel slotted aloha system. IOP Earth Environ. Sci. 2019, 248, 012088. [Google Scholar] [CrossRef]
- Hu, H.; Yan, H. Study on ALOHA anti-collision algorithm based on LoRa for internet of things. In Proceedings of the IEEE 3rd International Conference on Smart City and Systems Engineering (ICSCSE), Xiamen, China, 29–30 December 2018; pp. 652–654. [Google Scholar]
- Magrin, D.; Capuzzo, M.; Zanella, A.; Zorzi, M. A complete LoRaWAN model for single-gateway scenarios. arXiv 2019, arXiv:1912.01285. [Google Scholar]
- Augustin, A.; Yi, J.; Clausen, T.; Townsley, W.M. A study of LoRa: Long range & low power networks for the internet of things. Sensors 2016, 16, 1466. [Google Scholar]
- Magrin, D.; Capuzzo, M.; Zanella, A. A thorough study of LoRaWAN performance under different parameter settings. IEEE Internet Things J. 2019, 7, 116–127. [Google Scholar] [CrossRef] [Green Version]
- Liando, J.C.; Gamage, A.; Tengourtius, A.W.; Li, M. Known and unknown facts of LoRa: Experiences from a large-scale measurement study. ACM Trans. Sens. Netw. 2019, 15, 1–35. [Google Scholar] [CrossRef]
- Mroue, H.; Parrein, B.; Hamrioui, S.; Bakowski, P.; Nasser, A.; Cruz, E.M.; Vince, W. LoRa+: An extension of LoRaWAN protocol to reduce infrastructure costs by improving the Quality of Service. Internet Things 2020, 9, 100176. [Google Scholar] [CrossRef]
- Ayele, E.D.; Hakkenberg, C.; Meijers, J.P.; Zhang, K.; Meratnia, N.; Havinga, P.J. Performance analysis of LoRa radio for an indoor IoT applications. In Proceedings of the IEEE International Conference on Internet of Things for the Global Community, Funchal, Portugal, 10–13 July 2017; pp. 1–8. [Google Scholar]
- Xu, W.; Kim, J.Y.; Huang, W.; Kanhere, S.S.; Jha, S.K.; Hu, W. Measurement, characterization, and modeling of lora technology in multifloor buildings. IEEE Internet Things J. 2019, 7, 298–310. [Google Scholar] [CrossRef] [Green Version]
- Sallum, E.; Pereira, N.; Alves, M.; Santos, M. Improving quality-of-service in LoRa low-power wide-area networks through optimized radio resource management. Sens. Actuator Netw. 2020, 9, 10. [Google Scholar] [CrossRef] [Green Version]
- Carlsson, A.; Kuzminykh, I.; Franksson, R.; Liljegren, A. Measuring a LoRa network: Performance, possibilities and limitations. In Internet of Things, Smart Spaces, and Next Generation Networks and Systems; Springer: Cham, Switzerland, 2018; pp. 116–128. [Google Scholar]
- Sanchez-Iborra, R.; Sanchez-Gomez, J.; Ballesta-Viñas, J.; Cano, M.D.; Skarmeta, A.F. Performance evaluation of LoRa considering scenario conditions. Sensors 2018, 18, 772. [Google Scholar] [CrossRef] [PubMed] [Green Version]
- Cuomo, F.; César, J.; Gámez, C.; Maurizio, A.; Scipione, L.; Campo, M.; Caponi, A.; Bianchi, G.; Rossini, G.; Pisani, P. Towards traffic-oriented spreading factor allocations in LoRaWAN systems. In Proceedings of the IEEE 17th Annual Mediterranean Ad Hoc Networking Workshop (Med-Hoc-Net), Capri Island, Italy, 20–22 June 2018; pp. 55–63. [Google Scholar]
- Asad Ullah, M.; Iqbal, J.; Hoeller, A.; Souza, R.D.; Alves, H. K-means spreading factor allocation for large-scale LoRa networks. Sensors 2019, 19, 4723. [Google Scholar] [CrossRef] [PubMed] [Green Version]
- Dawaliby, S.; Bradai, A.; Pousset, Y. Adaptive dynamic network slicing in LoRa networks. Future Gener. Comput. Syst. 2019, 98, 697–707. [Google Scholar] [CrossRef]
- Dawaliby, S.; Bradai, A.; Pousset, Y. A neural network propagation model for LoRaWAN and critical analysis with real-world measurements. Big Data Cogn. Comput. 2017, 1, 7. [Google Scholar]

| SF | 7 | 8 | 9 | 10 | 11 | 12 | 7 | 8 | 9 | 10 | 11 | 12 | |
| BW | 125 | 125 | 125 | 125 | 125 | 125 | 250 | 250 | 250 | 250 | 250 | 250 | |
| 7 | 125 | X | X | ||||||||||
| 8 | 125 | X | X | ||||||||||
| 9 | 125 | X | X | ||||||||||
| 10 | 125 | X | X | ||||||||||
| 11 | 125 | X | |||||||||||
| 12 | 125 | X | |||||||||||
| 7 | 250 | X | |||||||||||
| 8 | 250 | X | |||||||||||
| 9 | 250 | X | X | ||||||||||
| 10 | 250 | X | X | ||||||||||
| 11 | 250 | X | X | ||||||||||
| 12 | 250 | X | X |
| Parameter | Value |
|---|---|
| CF | 868 MHz |
| BW | 125 kHz, 250 kHz |
| SF | 7–12 |
| Transmission power (PTX) | 14 dBm |
| Payload | 16 bytes |
| ENs/SF | 100, 200 |
| GWs | 1,2,4,10,20 |
| Medium loss (LPL) | 127.84 dB |
| Gain (GTX) | 2.15 dBi |
| DC | 2000 ms, 1090 ms, 1000 ms |
| SF | Bit Rate (bps) | ToAPayload + CRC (ms) | ToAPayload (ms) | TPreamble (ms) | TSymbol (ms) | ToAt (ms) |
|---|---|---|---|---|---|---|
| 7 | 5468.75 | 44.29 | 39.17 | 10.50 | 1.02 | 55.81 |
| 8 | 3125 | 78.34 | 78.34 | 20.89 | 2.05 | 101.28 |
| 9 | 1757.81 | 156.67 | 136.19 | 41.98 | 4.10 | 202.75 |
| 10 | 976.56 | 272.38 | 272.38 | 83.97 | 8.19 | 364.54 |
| 11 | 537.11 | 544.77 | 544.77 | 167.94 | 16.38 | 729.09 |
| 12 | 292.97 | 1089.54 | 925.7 | 335.87 | 335.8 | 1761.21 |
| SF (125 KHz) | D (km) | ToAMKA (ms) | Receiver RSSI (dBm) | Received RSSI (dBm) |
|---|---|---|---|---|
| 7 | 0.7 | 59.65 | −109 | −108.6651 |
| 8 | 0.9 | 98.82 | −112 | −112.0519 |
| 9 | 1.1 | 177.15 | −115 | −115.0773 |
| 10 | 1.5 | 354.3 | −118 | −118.4322 |
| 11 | 1.6 | 626.69 | −120.5 | −120.8336 |
| 12 | 2.1 | 1253.38 | −123 | −124.6885 |
| SF | D (km) | 2 GWs RSSI (dBm) | 4 GWs RSSI (dBm) | 10 GWs RSSI (dBm) | 20 GWs RSSI (dBm) |
|---|---|---|---|---|---|
| 7 | 0.7 | −112.2239 | −111.242 | −107.096 | −107.551 |
| 8 | 0.9 | −115.8398 | −110.644 | −111.835 | −112.139 |
| 9 | 1.1 | −115.5934 | −112.924 | −112.996 | −114.134 |
| 10 | 1.5 | −116.3864 | −118.250 | −116.812 | −116.040 |
| 11 | 1.6 | −120.7323 | −119.240 | −119.912 | −120.090 |
| 12 | 2.1 | −121.8479 | −122.614 | −126.787 | −104.131 |
| SF | D (km) | 1 GWs | 2 GWs | 4 GWs | 10 GWs | 20 GWs |
|---|---|---|---|---|---|---|
| 7 | 0.7 | 0.18 | 0.095 | 0.048 | 0.019 | 0.009 |
| 8 | 0.9 | 0.08 | 0.040 | 0.020 | 0.008 | 0.004 |
| 9 | 1.1 | 0.11 | 0.055 | 0.275 | 0.011 | 0.0055 |
| 10 | 1.5 | 0.15 | 0.075 | 0.375 | 0.015 | 0.0075 |
| 11 | 1.6 | 0.21 | 0.100 | 0.050 | 0.020 | 0.0100 |
| 12 | 2.1 | 0.30 | 0.140 | 0.070 | 0.028 | 0.014 |
| SF (125 kHz) | Bit Rate (bps) | ToAPayload + CRC | ToAMLA(Payload) | TPreamble (ms) | TSymbol (ms) | ToAMLA (ms) |
|---|---|---|---|---|---|---|
| 7 | 10,937.5 | 22.14 | 37.5 | 5.25 | 0.51 | 43.26 |
| 8 | 6250 | 39.17 | 59.65 | 10.50 | 1.02 | 71.17 |
| 9 | 3515.63 | 78.34 | 98.82 | 20.99 | 2.05 | 121.86 |
| 10 | 1953.13 | 136.19 | 218.11 | 41.98 | 4.10 | 264.19 |
| 11 | 1074.22 | 272.38 | 354.3 | 83.97 | 8.19 | 446.46 |
| 12 | 585.94 | 544.77 | 708.61 | 167.94 | 16.38 | 892.93 |
| SF | Saturation 125 kHz | MLA Saturation 125 kHz | MLA Saturation 250 kHz |
|---|---|---|---|
| 7 | 33.06 | 12.11 | 12.88 |
| 8 | 25.49 | 10.42 | 11.36 |
| 9 | 36.33 | 13.30 | 13.38 |
| 10 | 46.95 | 11.41 | 10.62 |
| 11 | 59.13 | 7.72 | 6.50 |
| 12 | 57.83 | 1.40 | 0.98 |
| SF | MLA(DC = 2 s) 125 kHz | MLA (DC = 1 s) 250 kHz | MLA(DC = 1.09 s) 125 kHz |
|---|---|---|---|
| 7 | 4731.5 | 3618.5 | 2384.7 |
| 8 | 2570.9 | 1916.1 | 1292.2 |
| 9 | 1325.8 | 965.3 | 665.4 |
| 10 | 664.6 | 474.0 | 333.3 |
| 11 | 328.5 | 230.0 | 164.7 |
| 12 | 161.21 | 111.01 | 88.01 |
Publisher’s Note: MDPI stays neutral with regard to jurisdictional claims in published maps and institutional affiliations. |
© 2021 by the authors. Licensee MDPI, Basel, Switzerland. This article is an open access article distributed under the terms and conditions of the Creative Commons Attribution (CC BY) license (https://creativecommons.org/licenses/by/4.0/).
Share and Cite
Khan, M.A.A.; Ma, H.; Aamir, S.M.; Jin, Y. Optimizing the Performance of Pure ALOHA for LoRa-Based ESL. Sensors 2021, 21, 5060. https://doi.org/10.3390/s21155060
Khan MAA, Ma H, Aamir SM, Jin Y. Optimizing the Performance of Pure ALOHA for LoRa-Based ESL. Sensors. 2021; 21(15):5060. https://doi.org/10.3390/s21155060
Chicago/Turabian StyleKhan, Malak Abid Ali, Hongbin Ma, Syed Muhammad Aamir, and Ying Jin. 2021. "Optimizing the Performance of Pure ALOHA for LoRa-Based ESL" Sensors 21, no. 15: 5060. https://doi.org/10.3390/s21155060
APA StyleKhan, M. A. A., Ma, H., Aamir, S. M., & Jin, Y. (2021). Optimizing the Performance of Pure ALOHA for LoRa-Based ESL. Sensors, 21(15), 5060. https://doi.org/10.3390/s21155060