
Fabry–Perot Resonance in 2D Dielectric Grating for Figure of Merit Enhancement in Refractive Index Sensing


Abstract
:1. Introduction
2. Materials and Methods
2.1. 2D FP Grating Structures
- (1)
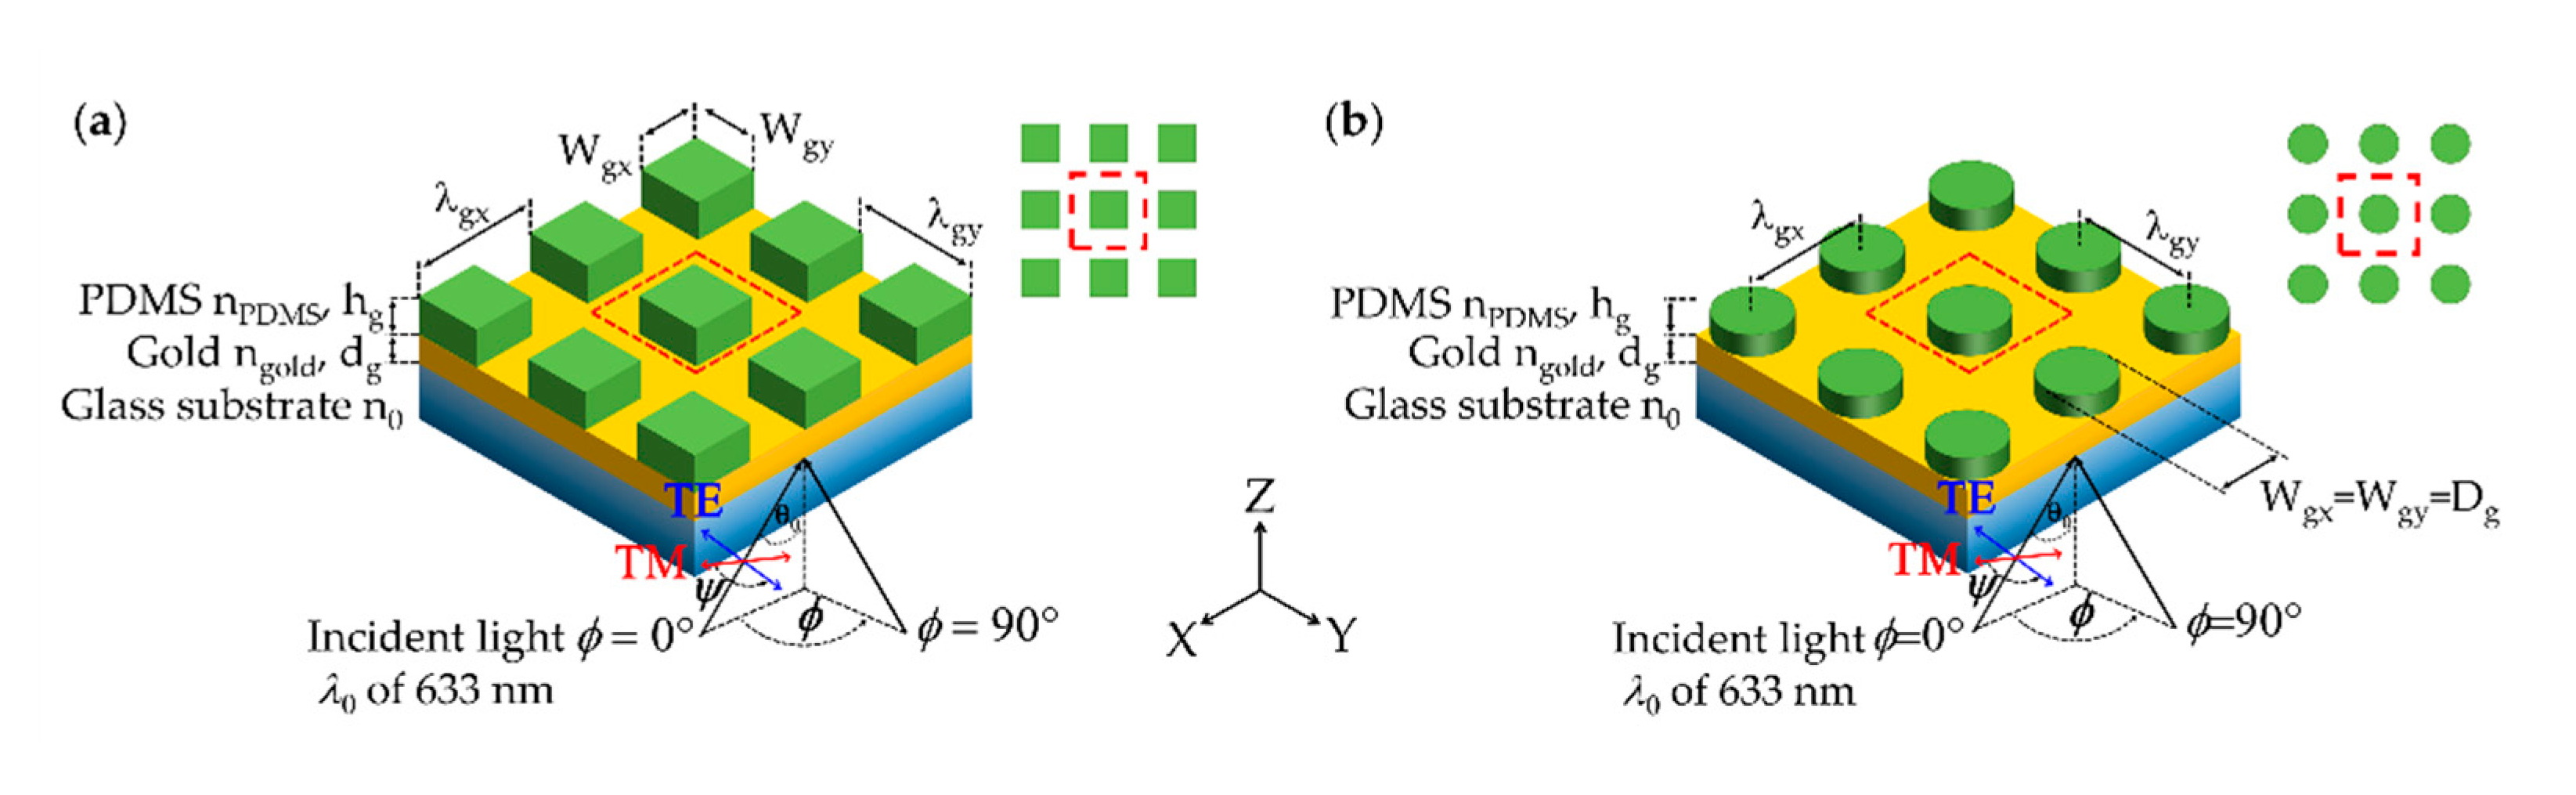
- Rectangular pillars made of PDMS with of 1.4283 [29] coated plasmonic gold sensor with thickness dg and refractive index of 0.18344 + 3.4332i [21] on a standard BK7 glass coverslip with the refractive index n0 of 1.52. The rectangular grating was on a rectangular grid with the grating height of hg, the grating periods along the x-axis and y-axis with the width of deposited PDMS along the x-axis and y-axis , respectively as shown in Figure 2a. The sensing region is on the top of the structure with the sample refractive index of ns. Grating fill factors along the x-axis FFx and the y-axis FFy are defined as Wgx/λgx and Wgy/λgy.
- (2)
- Circular pillars made of PDMS with of 1.4283 [29] coated plasmonic gold sensor with thickness dg and refractive index of 0.18344 + 3.4332i [21] on a standard BK7 glass coverslip with the refractive index n0 of 1.52. The circular grating was on a rectangular grid with the grating height of hg, the grating periods along the x-axis and the y-axis are the same for the circular pillars. The diameter of deposited PDMS pillars is defined by Dg, as shown in Figure 2b. The sensing region is on the top of the structure with the sample refractive index of ns. Grating fill factor along the x-axis FFx, and the y-axis FFy are the same and defined as Dg/λgx and Dg/λgy.
2.2. Optical Detection and Optical Simulation
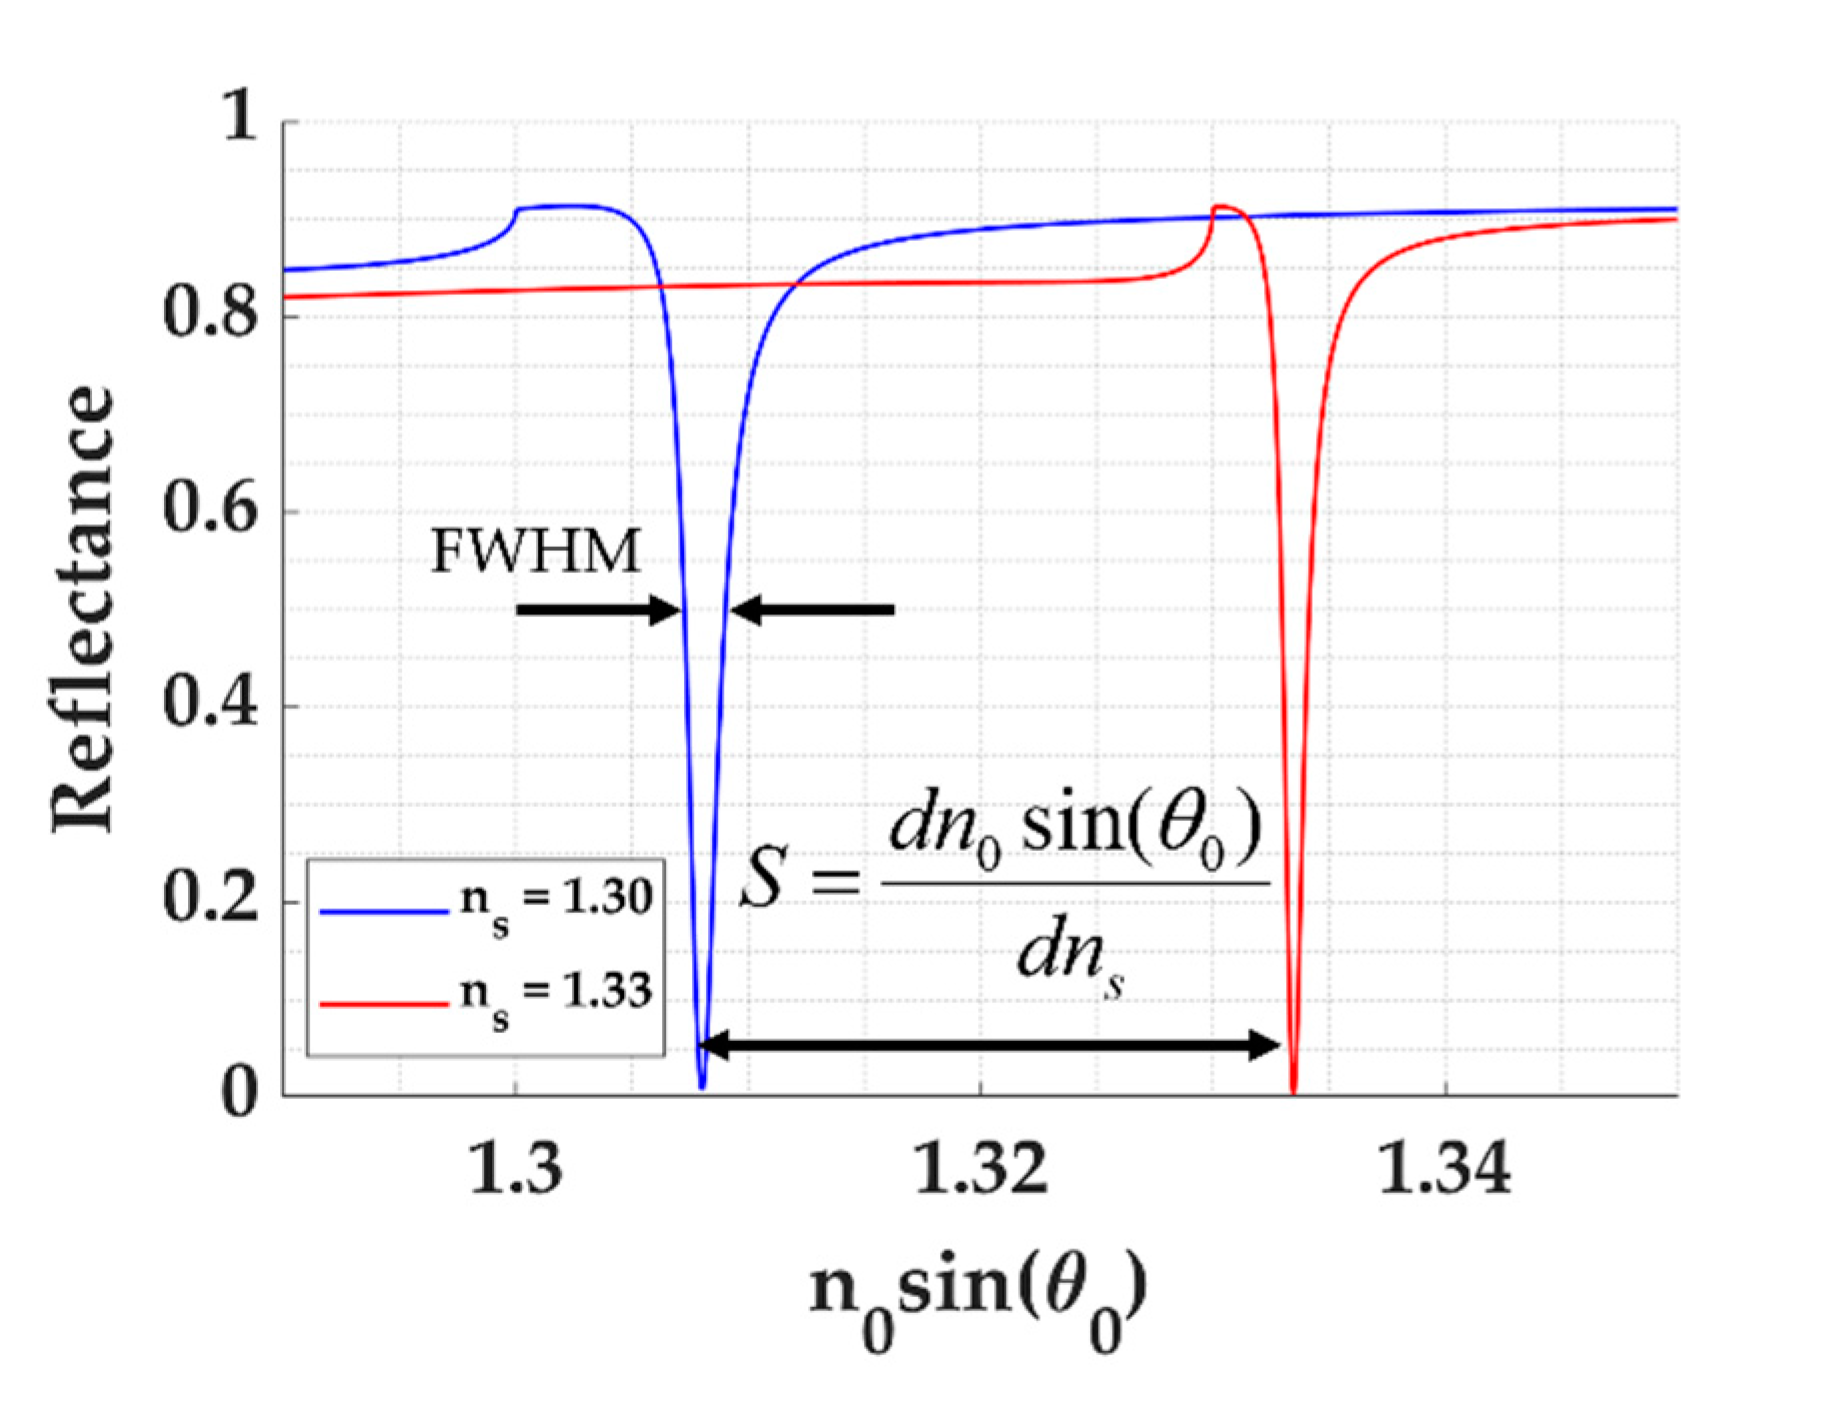
2.3. Quantitative Performance Parameters
3. Results
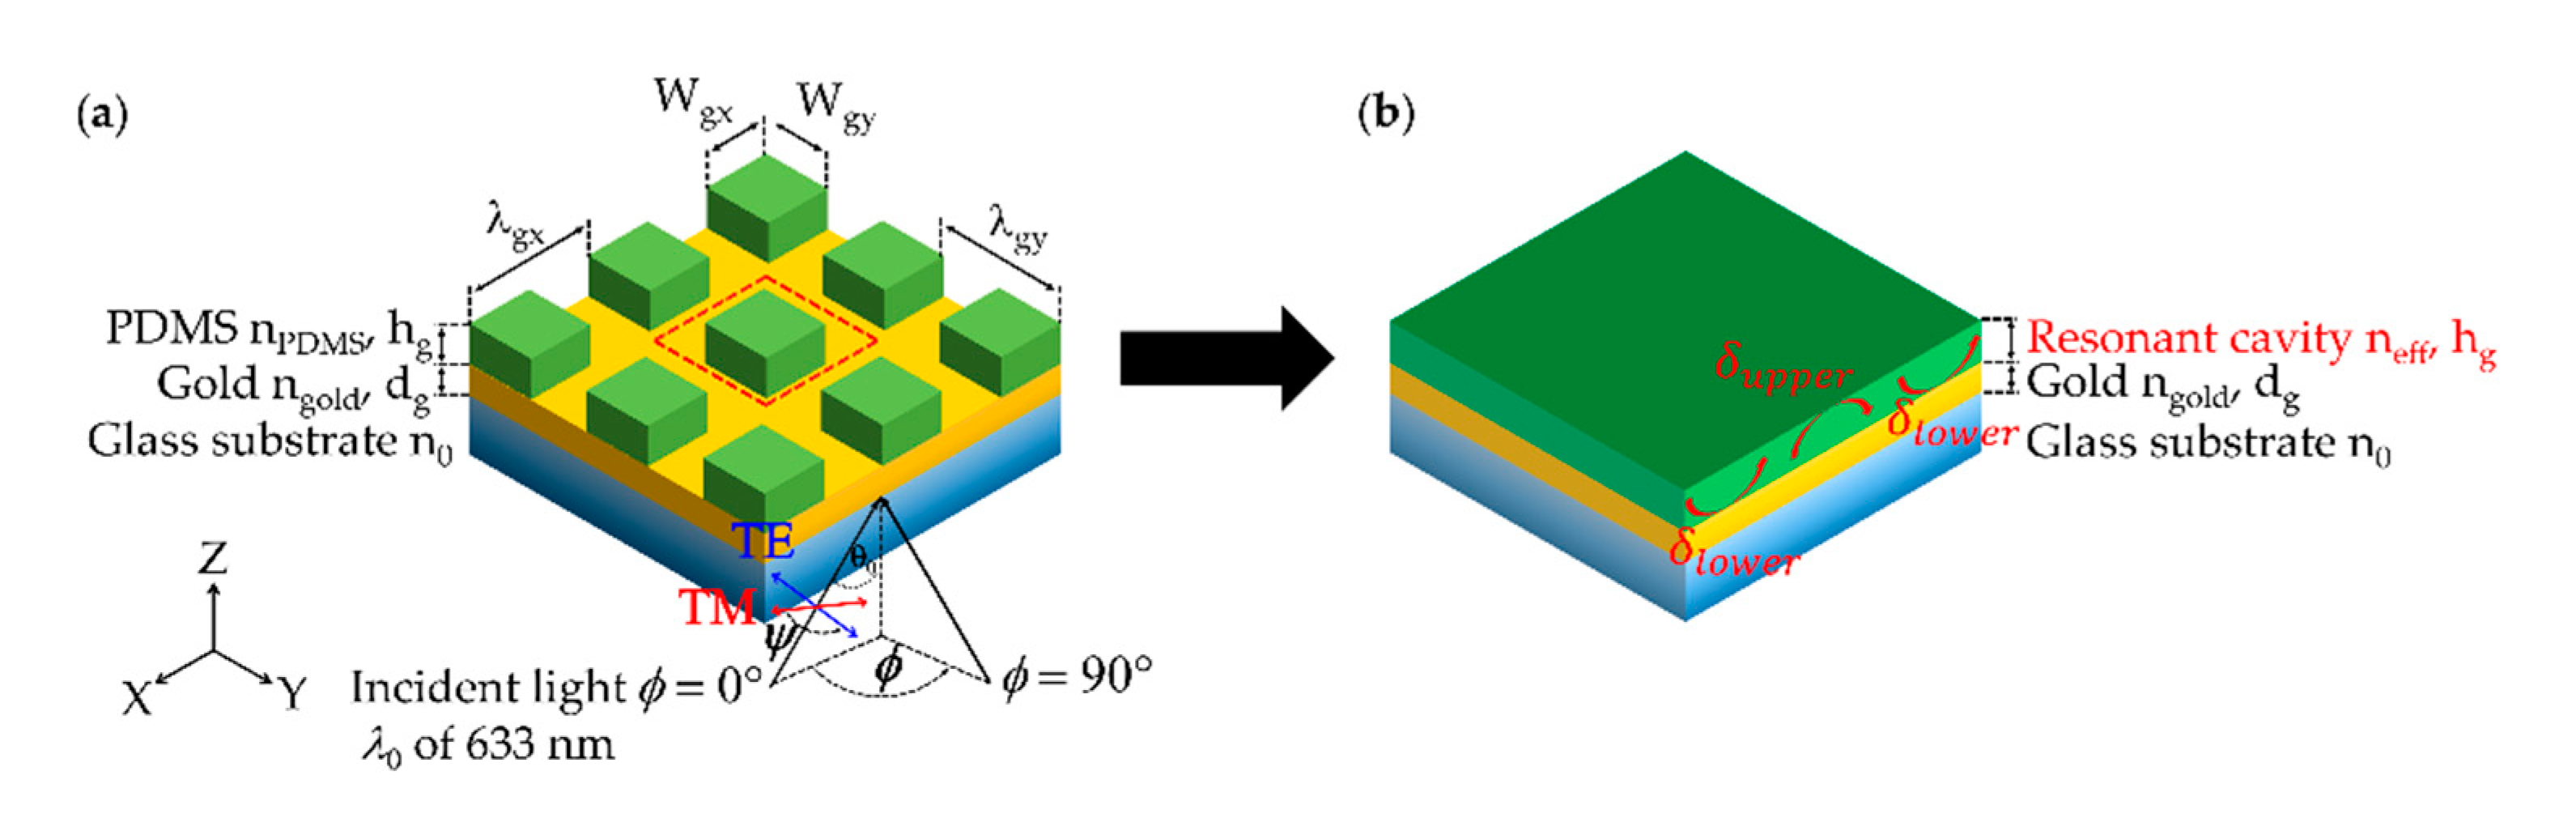
3.1. Effective Refractive Index Model
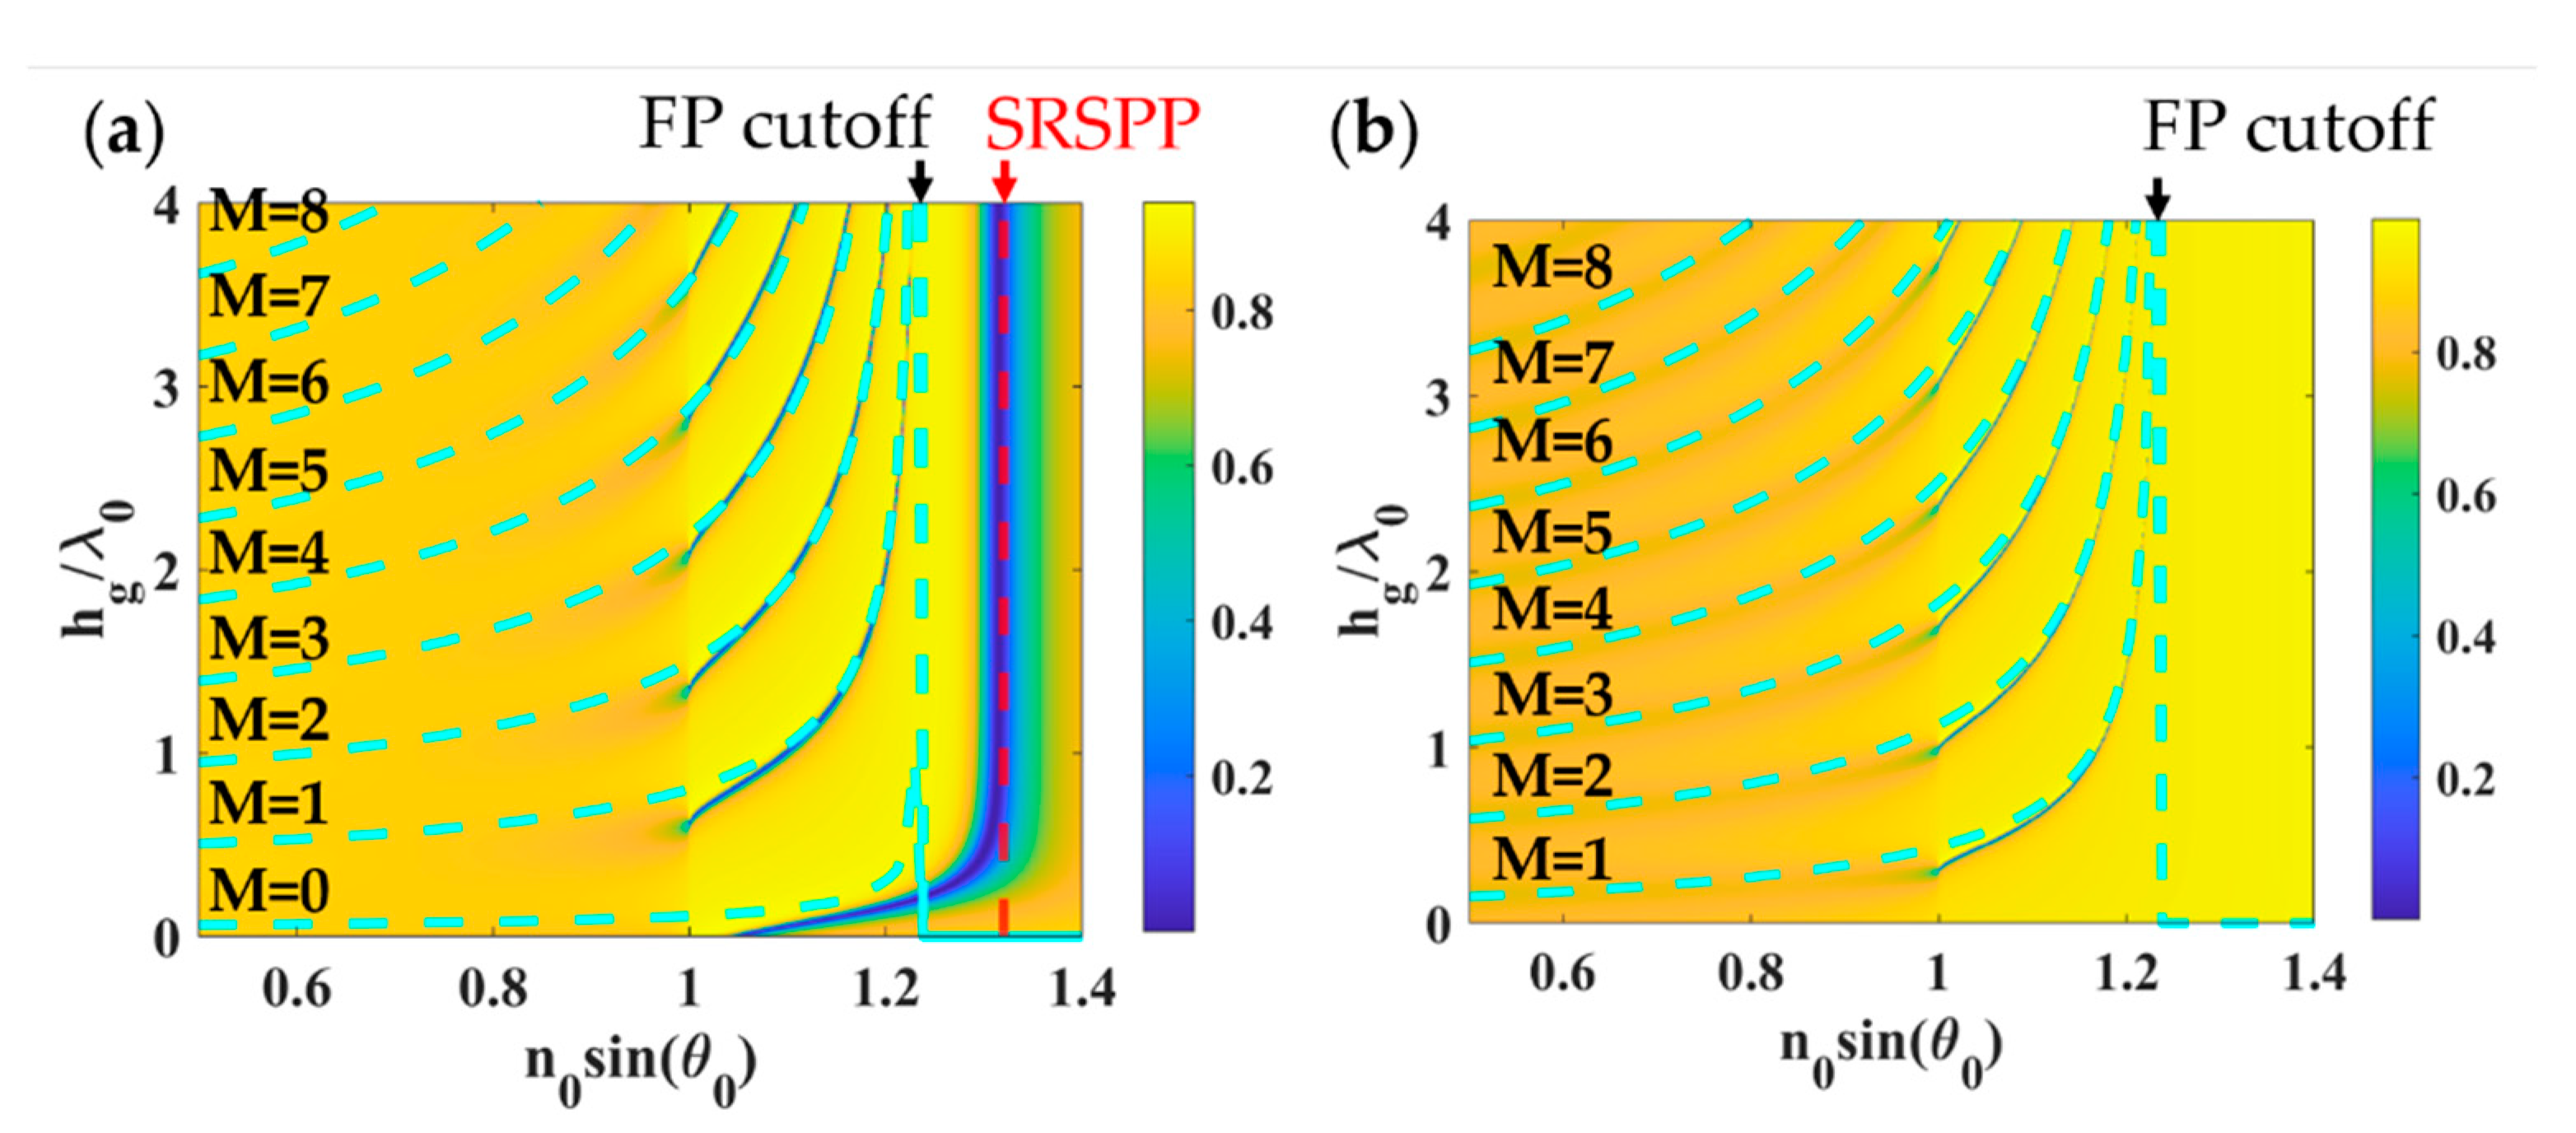
3.1.1. D Rectangular Grating
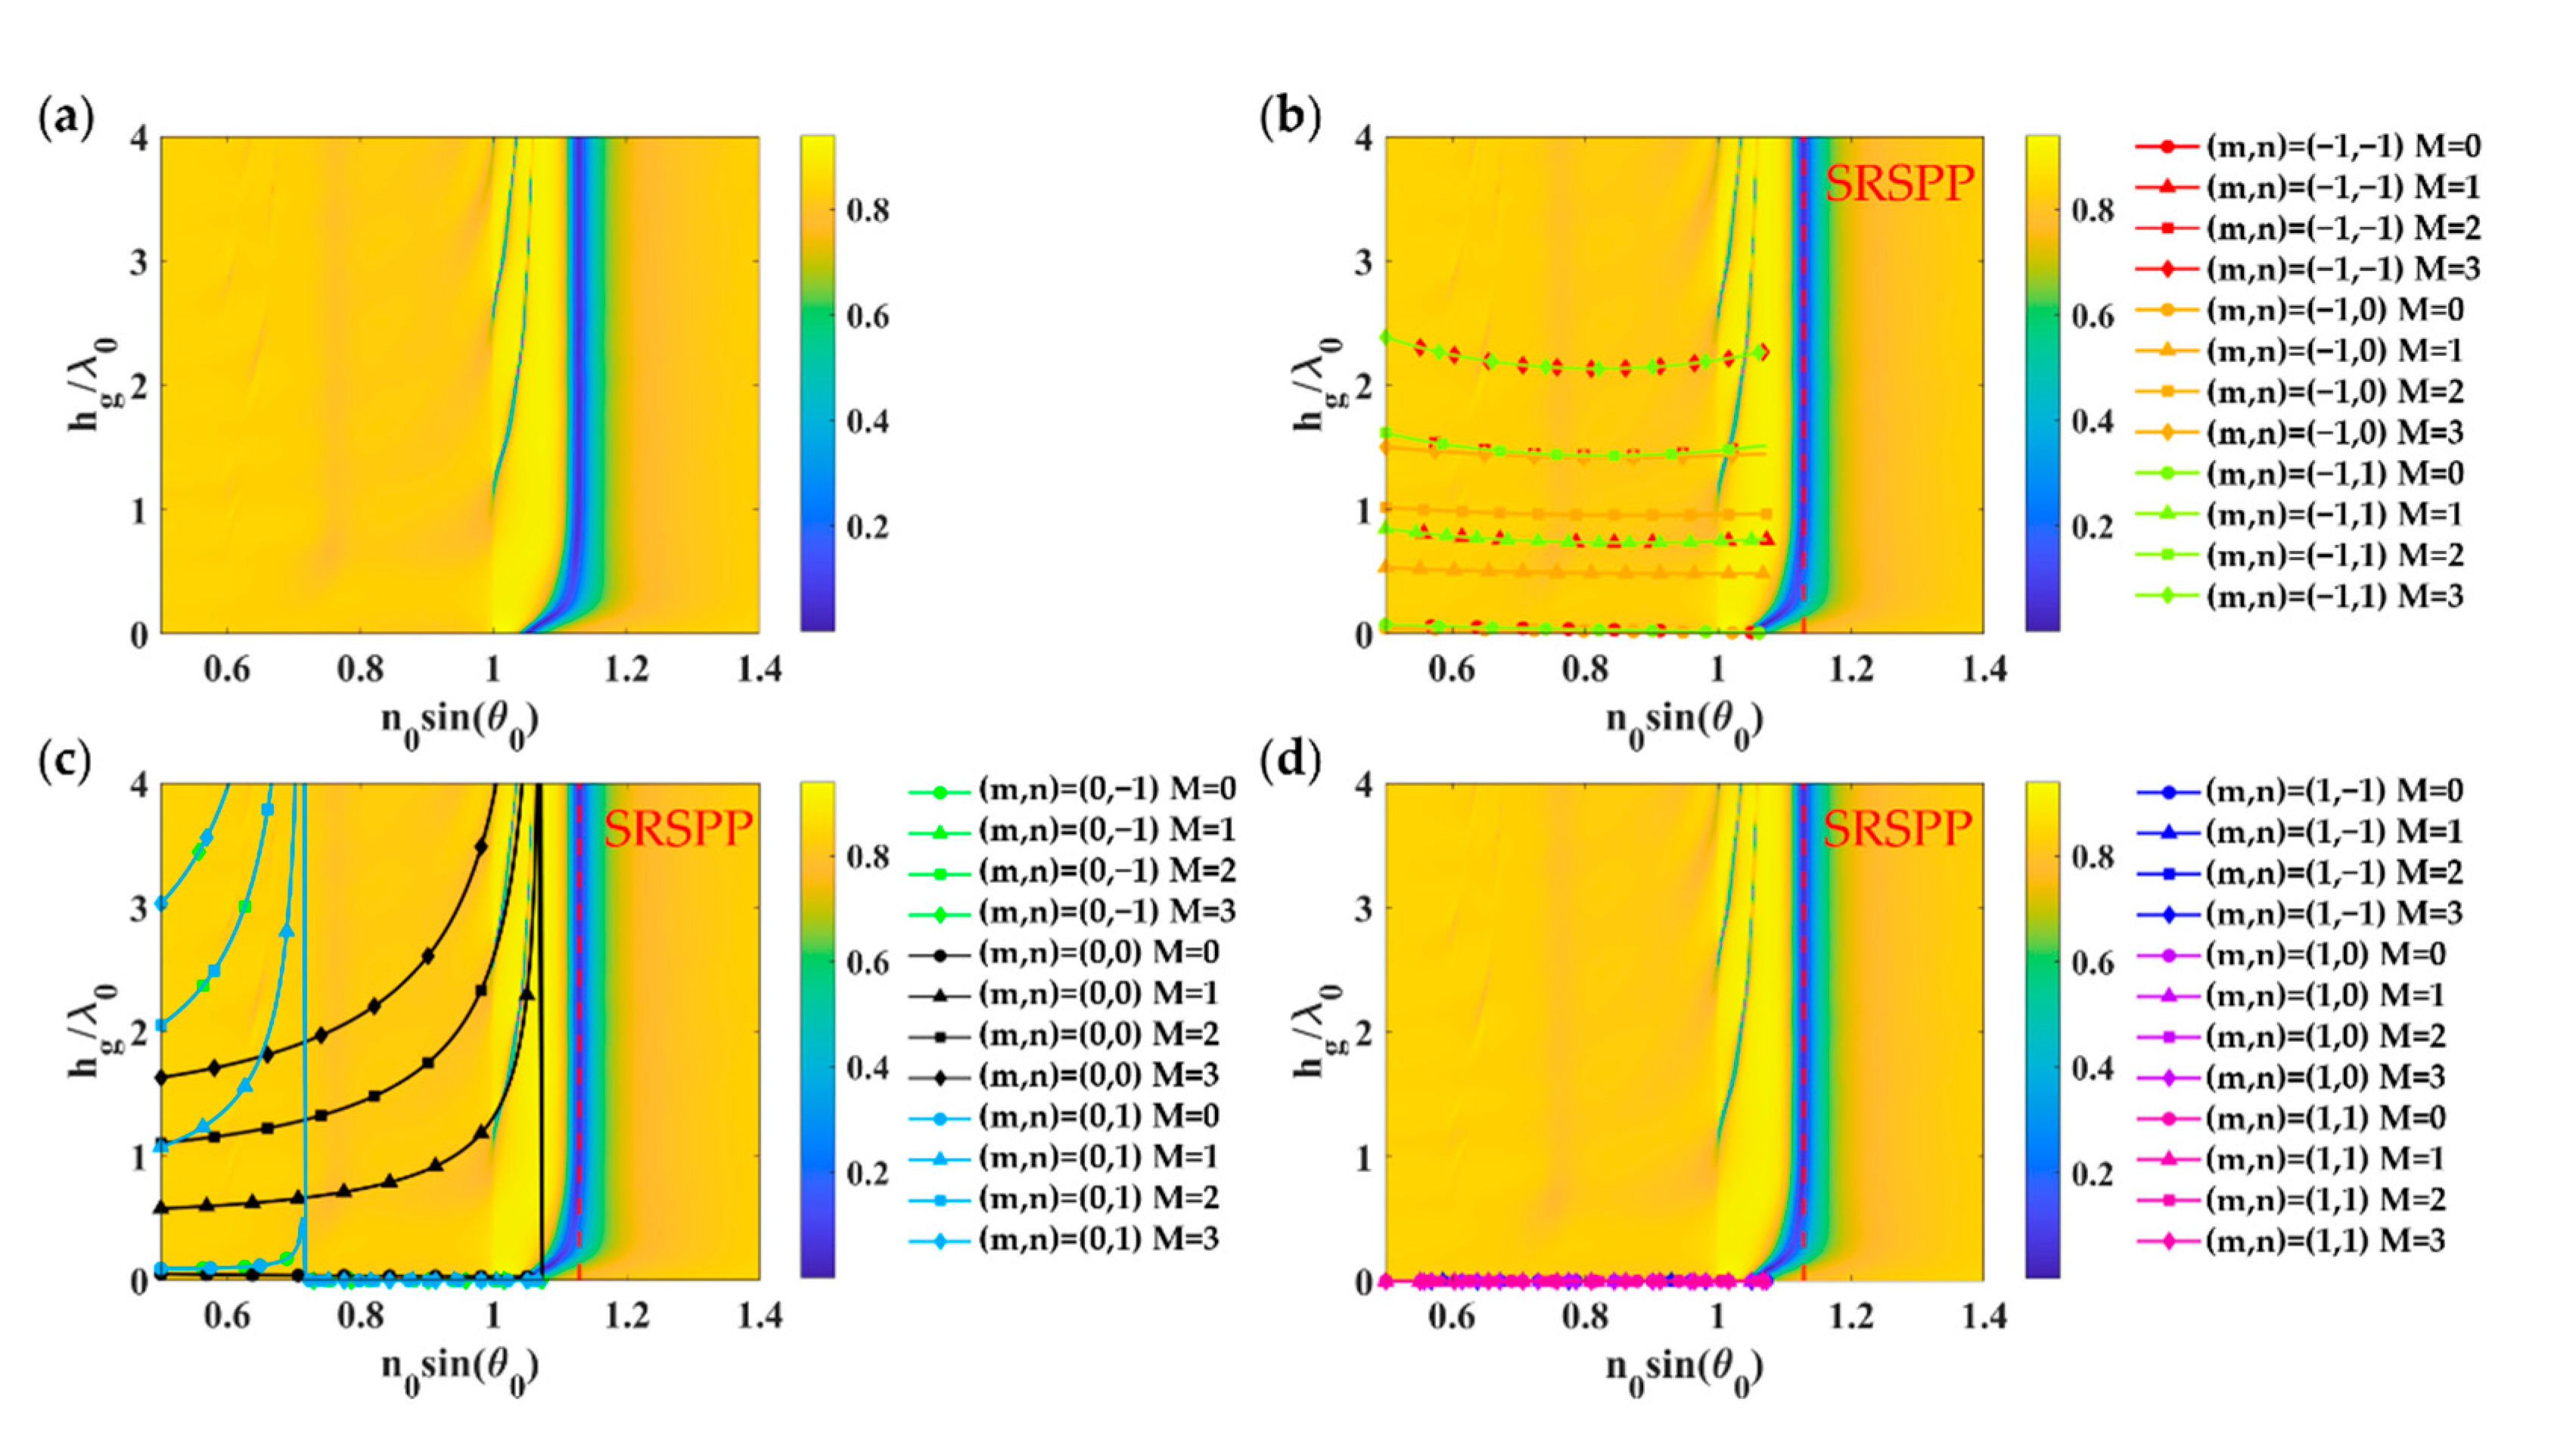
3.1.2. D Gratings
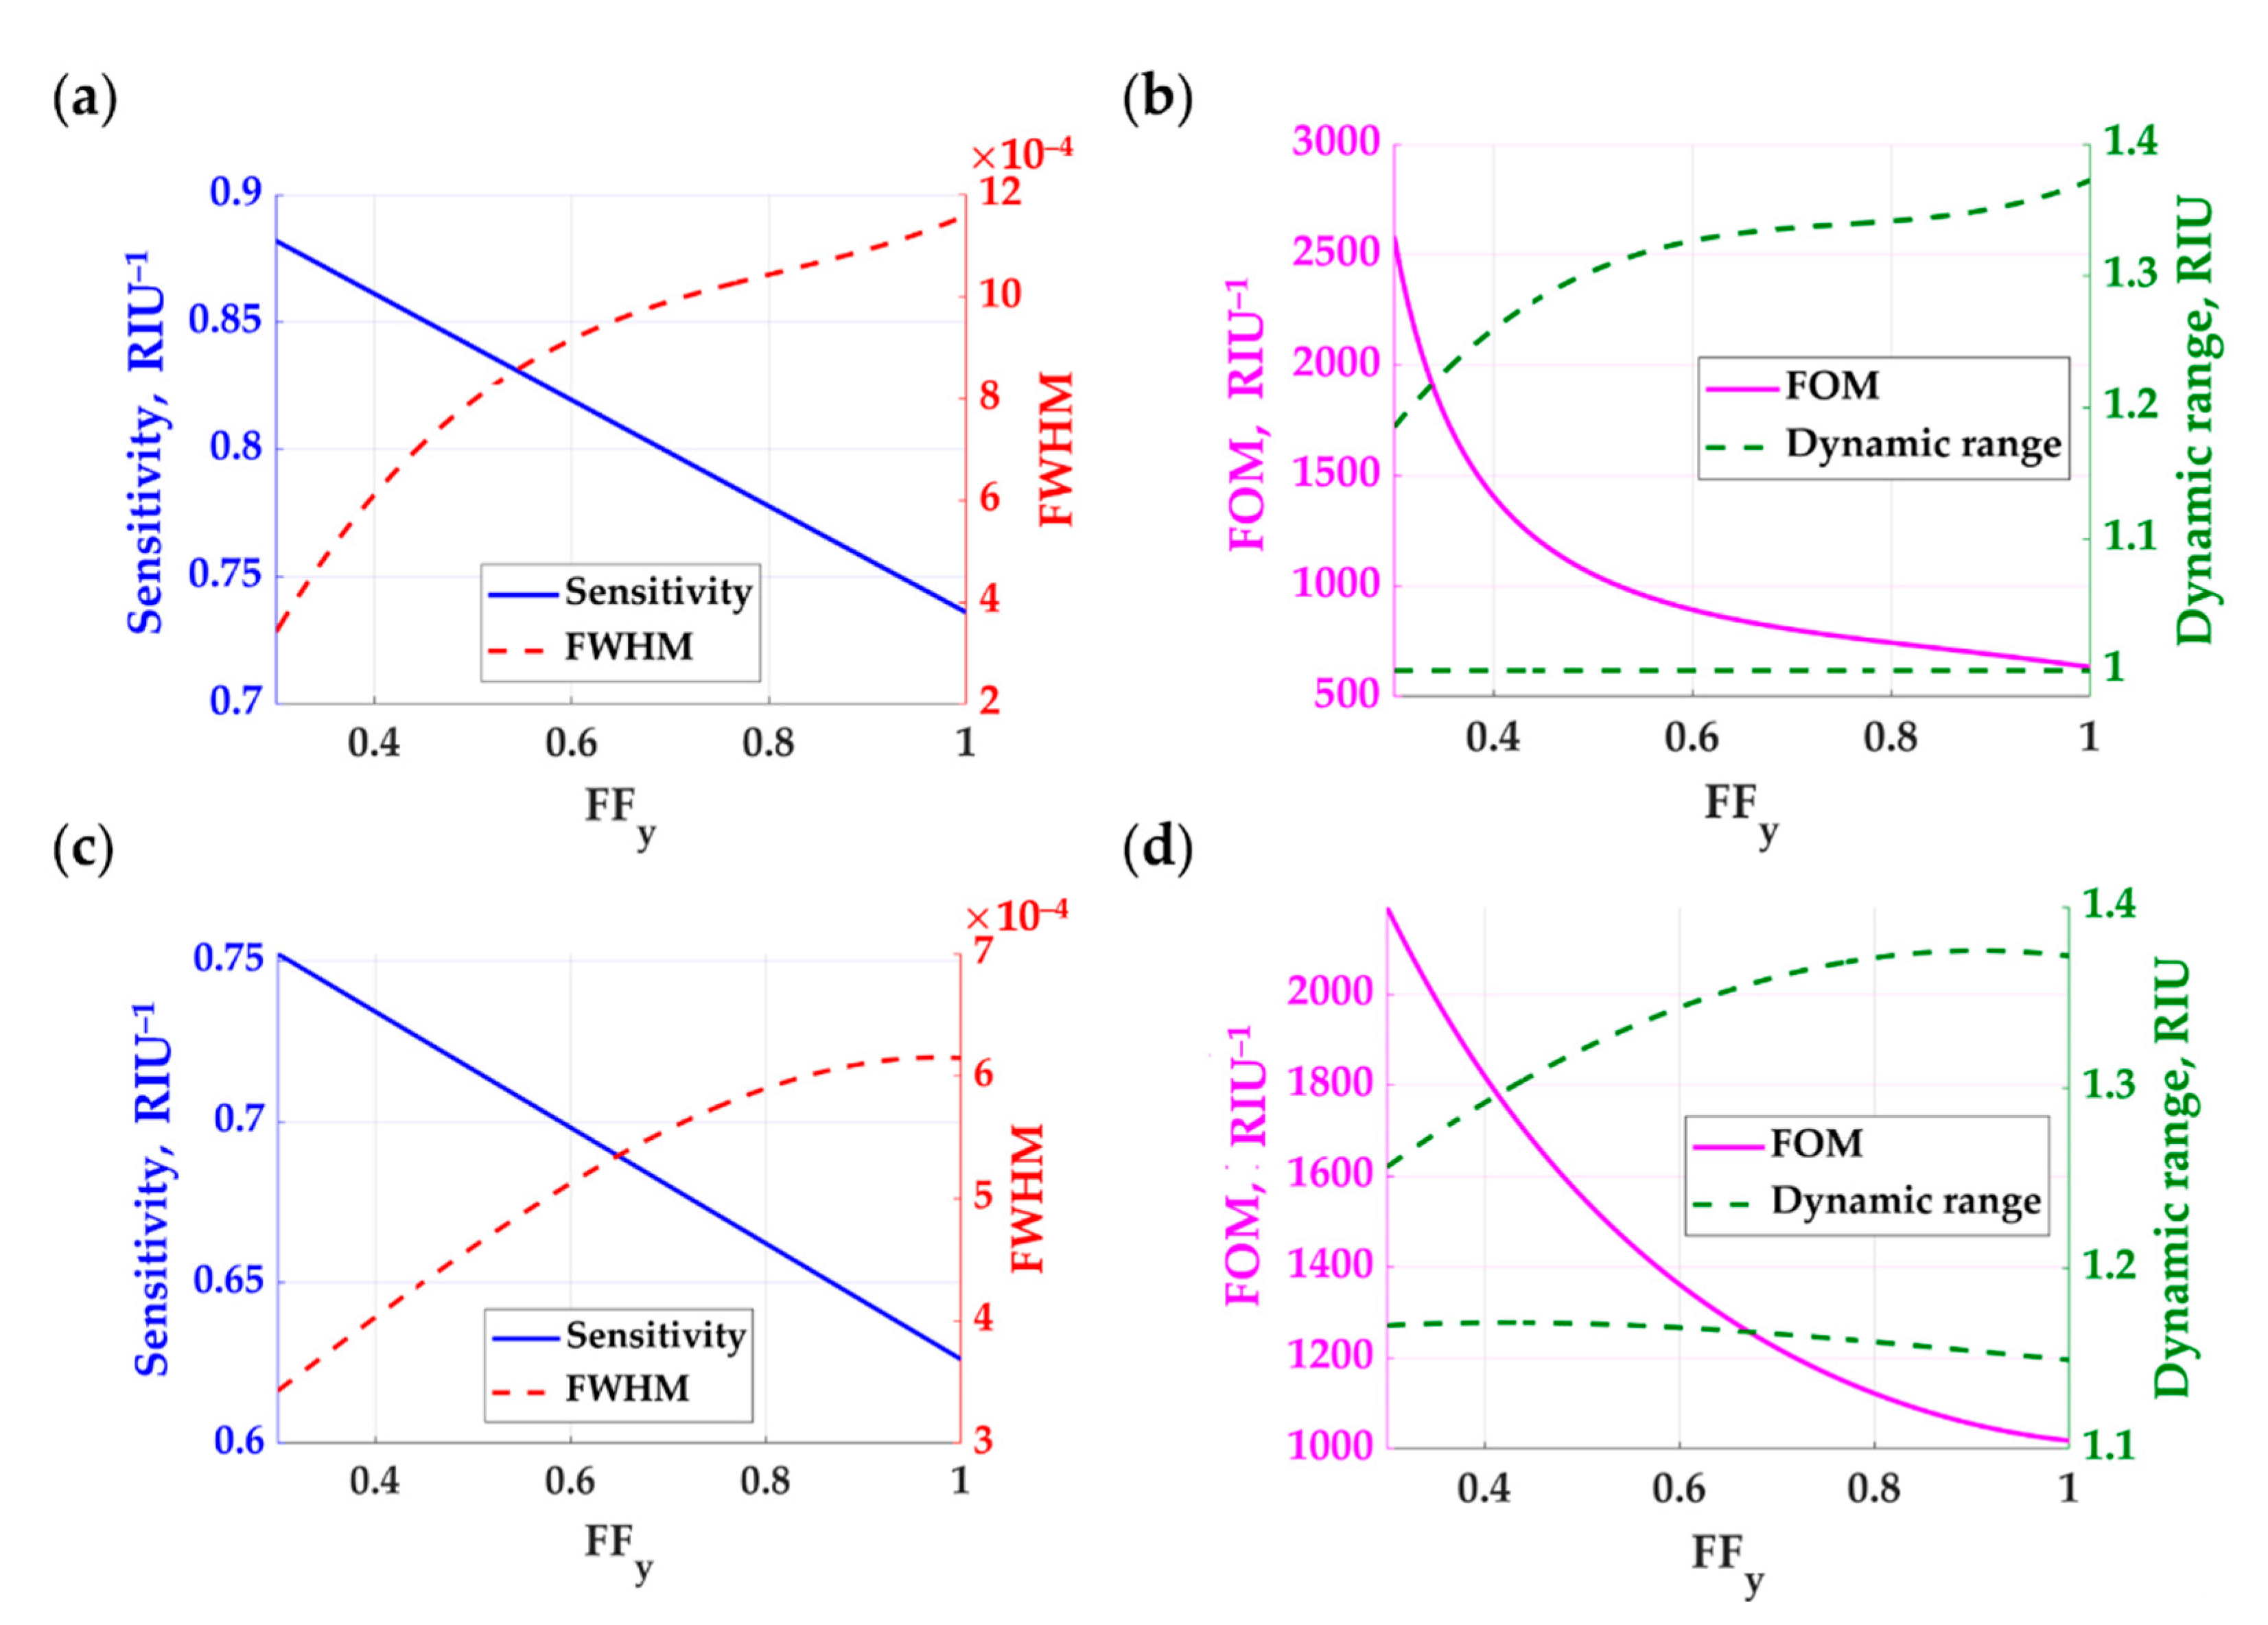
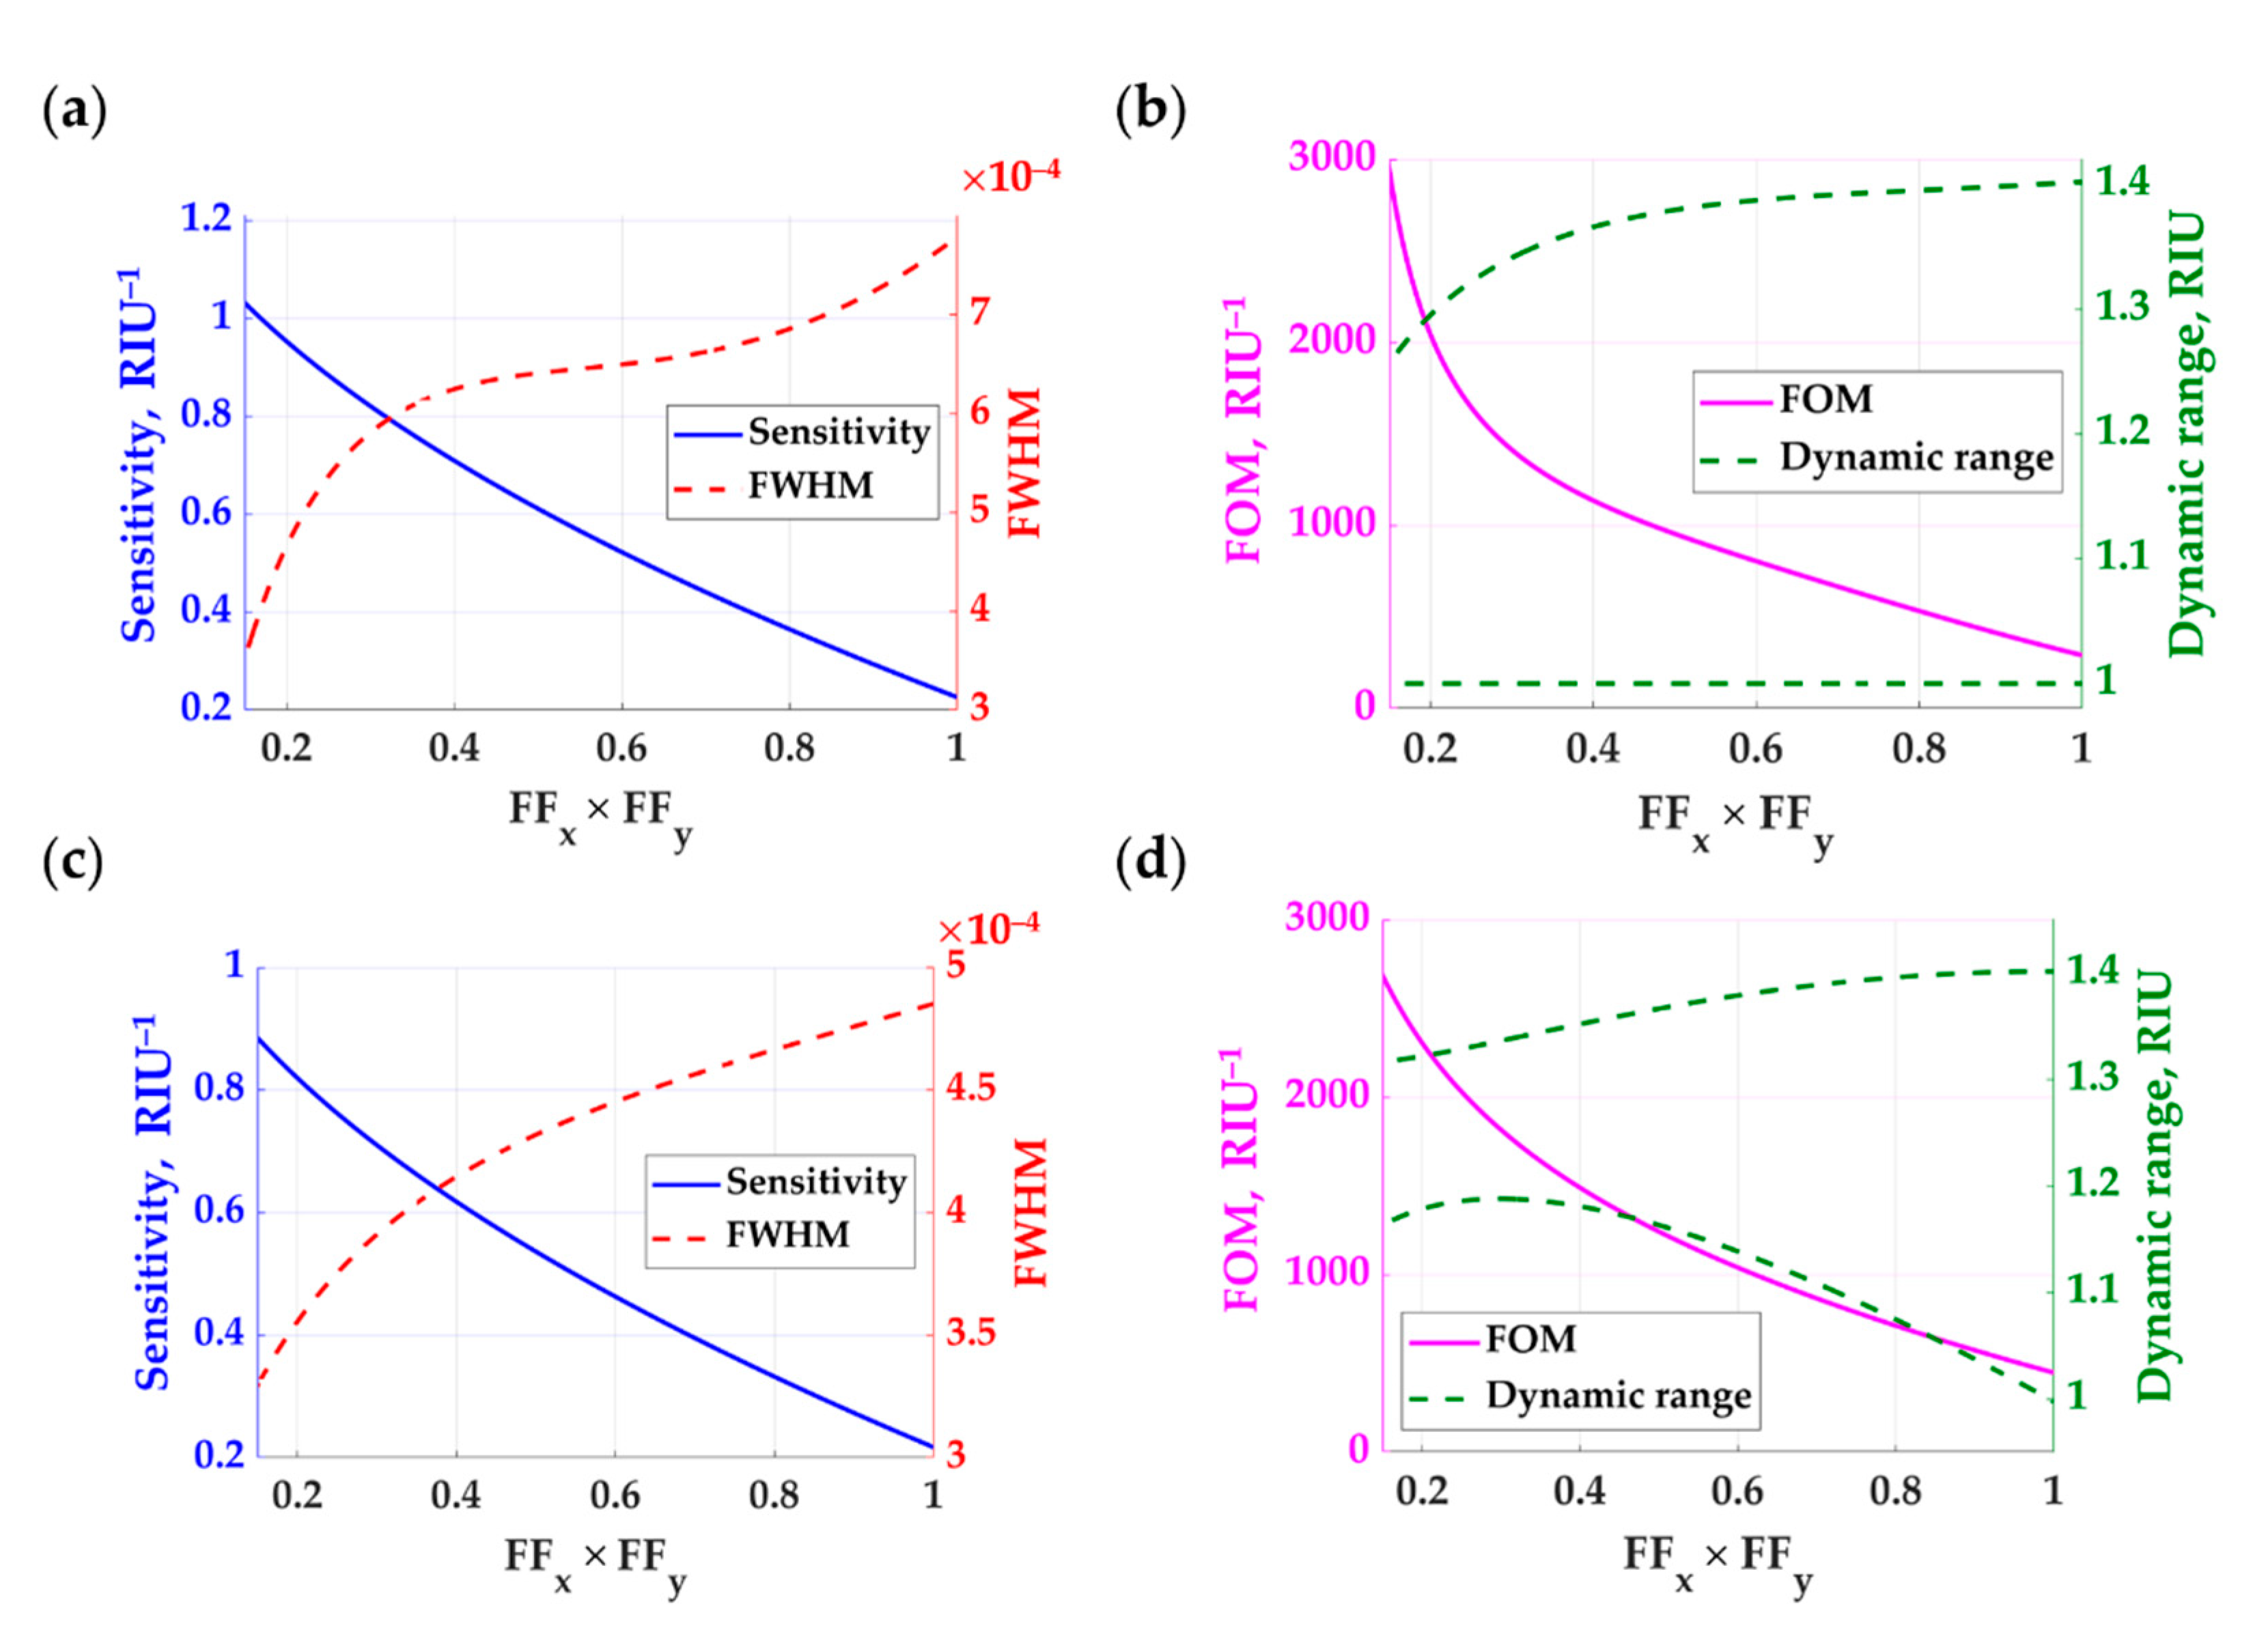
3.2. Refractive Index Sensing Performance of 2D Gratings
- (1)
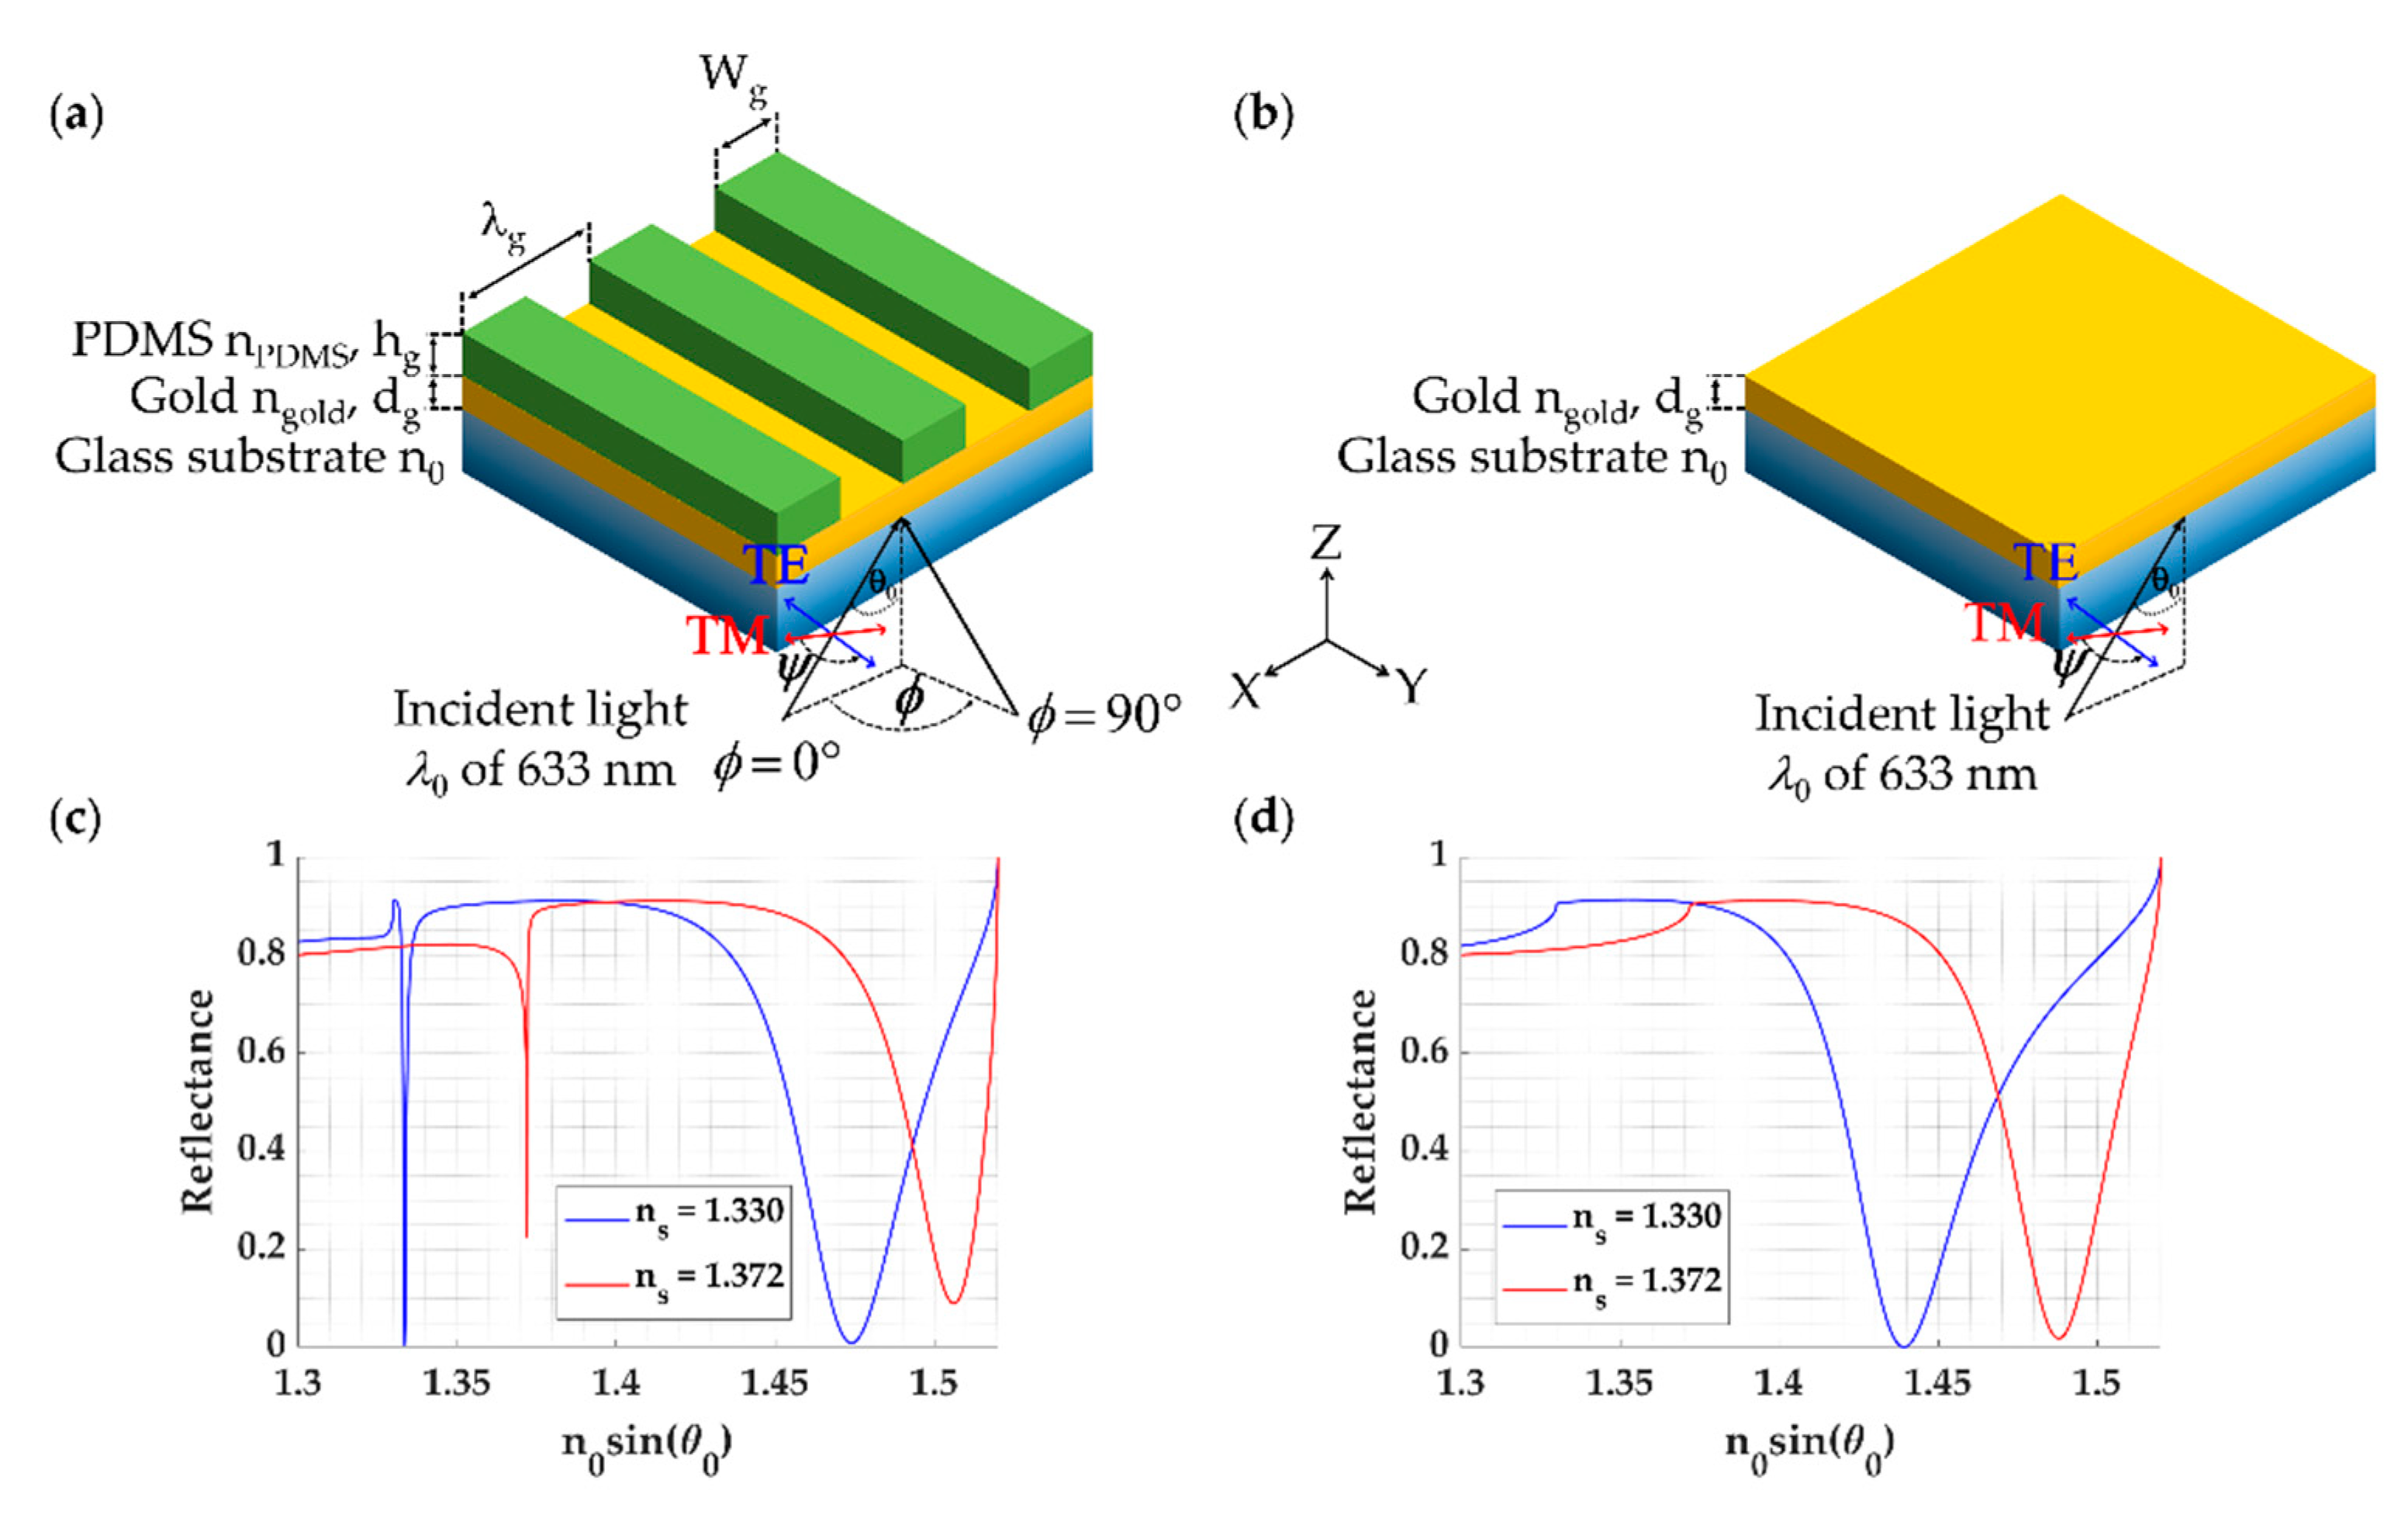
- SPR sensor with 50 nm thick uniform gold layer coated on a uniform BK7 glass substrate with TM polarization illumination.
- (2)
- Closed FP structure consisting of a sensing region sandwiched by two gold mirrors with the thickness of 45 nm and 90 nm [13].
- (3)
- Closed FP structure consisting of a sensing region sandwiched by 2 Bragg mirrors with alternating refractive indices made of nlow with the MgF2 refractive index of 1.37 [36] and nhigh with the TiO2 refractive index of 2.4 [37], and with the layer thickness of λ0/(4nlow) and λ0/(4nhigh) for nlow and nhigh, respectively. The Bragg mirror’s top and bottom consist of nhigh, nlow, nhigh, nlow, and nhigh stacking.
- (4)
- Open FP structure using 1D grating with FF of 0.3, hg of 900 nm, λgx and λgy of 1.25λ0, and dg of 48 nm with TM polarization illumination.
- (5)
- Open FP structure using 1D grating with FF of 0.3, hg of 900 nm, λgx and λgy of 1.25λ0, and dg of 38 nm with TE polarization illumination.
- (6)
- Open FP structure using 2D rectangular pillar grating with FFx and FFy of 0.3, hg of 900 nm, λgx and λgy of 1.25λ0, and dg of 48 nm with TM polarization illumination.
- (7)
- Open FP structure using 2D rectangular pillar grating with FFx and FFy of 0.3, hg of 900 nm, λgx and λgy of 1.25λ0, and dg of 38 nm with TE polarization illumination.
- (8)
- Open FP structure using 2D circular pillar grating with Dg of 300 nm, FFx and FFy of 0.38, hg of 900 nm, λgx and λgy of 1.25λ0, and dg of 48 nm TM polarization illumination.
- (9)
- Open FP structure using 2D circular pillar grating with Dg of 300 nm, FFx and FFy of 0.38, hg of 900 nm, λgx and λgy of 1.25λ0, and dg of 38 nm TE polarization illumination.
4. Conclusions
Author Contributions
Funding
Institutional Review Board Statement
Informed Consent Statement
Data Availability Statement
Acknowledgments
Conflicts of Interest
References
- Pongruengkiat, W.; Pechprasarn, S. Whispering-gallery mode resonators for detecting cancer. Sensors 2017, 17, 2095. [Google Scholar] [CrossRef] [PubMed] [Green Version]
- Pechprasarn, S.; Learkthanakhachon, S.; Zheng, G.; Shen, H.; Lei, D.Y.; Somekh, M.G. Grating-coupled Otto configuration for hybridized surface phonon polariton excitation for local refractive index sensitivity enhancement. Opt. Express 2016, 24, 19517–19530. [Google Scholar] [CrossRef]
- Soria, S.; Berneschi, S.; Brenci, M.; Cosi, F.; Nunzi Conti, G.; Pelli, S.; Righini, G.C. Optical microspherical resonators for biomedical sensing. Sensors 2011, 11, 785–805. [Google Scholar] [CrossRef]
- Chandran, S.; Gupta, R.K.; Das, B.K. Dispersion enhanced critically coupled ring resonator for wide range refractive index sensing. IEEE J. Sel. Top. Quantum Electron. 2016, 23, 424–432. [Google Scholar] [CrossRef]
- Learkthanakhachon, S.; Pechprasarn, S.; Somekh, M.G. Optical detection of ultrasound by lateral shearing interference of a transparent PDMS thin film. Opt. Lett. 2018, 43, 5797–5800. [Google Scholar] [CrossRef] [PubMed]
- Sukkasem, C.; Sasivimolkul, S.; Suvarnaphaet, P.; Pechprasarn, S. Analysis of Embedded Optical Interferometry in Transparent Elastic Grating for Optical Detection of Ultrasonic Waves. Sensors 2021, 21, 2787. [Google Scholar] [CrossRef] [PubMed]
- Pechprasarn, S.; Sukkasem, C.; Suvarnaphaet, P. Analysis of Dielectric Waveguide Grating and Fabry–Perot Modes in Elastic Grating in Optical Detection of Ultrasound. Sensors 2021, 21, 4081. [Google Scholar] [CrossRef]
- Shen, M.; Learkthanakhachon, S.; Pechprasarn, S.; Zhang, Y.; Somekh, M.G. Adjustable microscopic measurement of nanogap waveguide and plasmonic structures. Appl. Opt. 2018, 57, 3453–3462. [Google Scholar] [CrossRef]
- Luchansky, M.S.; Bailey, R.C. High-Q optical sensors for chemical and biological analysis. Anal. Chem. 2012, 84, 793–821. [Google Scholar] [CrossRef] [Green Version]
- Peng, J.; Lyu, D.; Qu, Y.; Wang, W.; Sun, T.; Yang, M. Thin films based one-dimensional photonic crystal for refractive index sensing. Optik 2018, 158, 1512–1518. [Google Scholar] [CrossRef]
- Butt, M.; Khonina, S.; Kazanskiy, N. Hybrid plasmonic waveguide-assisted Metal–Insulator–Metal ring resonator for refractive index sensing. J. Mod. Opt. 2018, 65, 1135–1140. [Google Scholar] [CrossRef]
- Rosenblatt, D.; Sharon, A.; Friesem, A.A. Resonant grating waveguide structures. IEEE J. Quantum Electron. 1997, 33, 2038–2059. [Google Scholar] [CrossRef]
- Sasivimolkul, S.; Pechprasarn, S.; Somekh, M.G. Analysis of Open Grating-Based Fabry–Pérot Resonance Structures With Potential Applications for Ultrasensitive Refractive Index Sensing. IEEE Sens. J. 2021, 21, 10628–10636. [Google Scholar] [CrossRef]
- Somekh, M.G.; Pechprasarn, S. Surface plasmon, surface wave, and enhanced evanescent wave microscopy. In Handbook of Photonics for Biomedical Engineering; Springer: Dordrecht, The Netherlands, 2017; pp. 503–543. [Google Scholar]
- Suvarnaphaet, P.; Pechprasarn, S. Quantitative Cross-Platform Performance Comparison between Different Detection Mechanisms in Surface Plasmon Sensors for Voltage Sensing. Sensors 2018, 18, 3136. [Google Scholar] [CrossRef] [PubMed] [Green Version]
- Chow, T.W.; Lun, D.P.; Pechprasarn, S.; Somekh, M.G. Defocus leakage radiation microscopy for single shot surface plasmon measurement. Meas. Sci. Technol. 2020, 31, 075401. [Google Scholar] [CrossRef]
- Veldhuis, G.; Berends, J.; Heideman, R.; Lambeck, P. An integrated optical Bragg-reflector used as a chemo-optical sensor. Pure Appl. Opt. J. Eur. Opt. Soc. Part A 1998, 7, L23. [Google Scholar] [CrossRef]
- Liang, W.; Huang, Y.; Xu, Y.; Lee, R.K.; Yariv, A. Highly sensitive fiber Bragg grating refractive index sensors. Appl. Phys. Lett. 2005, 86, 151122. [Google Scholar] [CrossRef]
- Pechprasarn, S.; Chow, T.W.; Somekh, M.G. Application of confocal surface wave microscope to self-calibrated attenuation coefficient measurement by Goos-Hänchen phase shift modulation. Sci. Rep. 2018, 8, 1–14. [Google Scholar]
- Schneider, F.; Draheim, J.; Kamberger, R.; Wallrabe, U. Process and material properties of polydimethylsiloxane (PDMS) for Optical MEMS. Sens. Actuators A Phys. 2009, 151, 95–99. [Google Scholar] [CrossRef]
- Johnson, P.B.; Christy, R.-W. Optical constants of the noble metals. Phys. Rev. B 1972, 6, 4370. [Google Scholar] [CrossRef]
- McNally, K.M.; Sorg, B.S.; Bhavaraju, N.C.; Ducros, M.G.; Welch, A.J.; Dawes, J.M. Optical and thermal characterization of albumin protein solders. Appl. Opt. 1999, 38, 6661–6672. [Google Scholar] [CrossRef] [PubMed]
- Wang, Z.; Hou, Y. Ultra-multiband absorption enhancement of graphene in a metal-dielectric-graphene sandwich structure covering terahertz to mid-infrared regime. Opt. Express 2017, 25, 19185–19194. [Google Scholar] [CrossRef] [PubMed]
- Buchmann, J.; Zhang, E.; Scharfenorth, C.; Spannekrebs, B.; Villringer, C.; Laufer, J. Evaluation of Fabry-Perot Polymer Film Sensors Made Using Hard Dielectric Mirror Deposition. In Proceedings of the SPIE BiOS 2016, San Francisco, CA, USA, 13–14 February 2016; International Society for Optics and Photonics: Bellingham, WA, USA, 2016; p. 970856. [Google Scholar]
- Zhang, E.; Laufer, J.; Beard, P. Backward-mode multiwavelength photoacoustic scanner using a planar Fabry-Perot polymer film ultrasound sensor for high-resolution three-dimensional imaging of biological tissues. Appl. Opt. 2008, 47, 561–577. [Google Scholar] [CrossRef]
- Han, M.; Guo, F.; Lu, Y. Optical fiber refractometer based on cladding-mode Bragg grating. Opt. Lett. 2010, 35, 399–401. [Google Scholar] [CrossRef]
- Kikuta, H.; Ohira, Y.; Kubo, H.; Iwata, K. Effective medium theory of two-dimensional subwavelength gratings in the non-quasi-static limit. JOSA A 1998, 15, 1577–1585. [Google Scholar] [CrossRef]
- Lalanne, P.; Lemercier-Lalanne, D. On the effective medium theory of subwavelength periodic structures. J. Mod. Opt. 1996, 43, 2063–2085. [Google Scholar] [CrossRef]
- Sultanova, N.; Kasarova, S.; Nikolov, I. Dispersion properties of optical polymers. Acta Phys. Pol. Ser. A Gen. Phys. 2009, 116, 585. [Google Scholar] [CrossRef]
- Li, L. New formulation of the Fourier modal method for crossed surface-relief gratings. JOSA 1997, 14, 2758–2767. [Google Scholar] [CrossRef]
- Pechprasarn, S.; Somekh, M.G. Detection limits of confocal surface plasmon microscopy. Biomed. Opt. Express 2014, 5, 1744–1756. [Google Scholar] [CrossRef] [Green Version]
- Yariv, A. Coupled-mode theory for guided-wave optics. IEEE J. Quantum Electron. 1973, 9, 919–933. [Google Scholar] [CrossRef] [Green Version]
- Polky, J.N.; Mitchell, G.L. Metal-clad planar dielectric waveguide for integrated optics. JOSA 1974, 64, 274–279. [Google Scholar] [CrossRef]
- Chang, S.-W.; Lin, T.-R.; Chuang, S.L. Theory of plasmonic Fabry-Perot nanolasers. Opt. Express 2010, 18, 15039–15053. [Google Scholar] [CrossRef] [PubMed]
- Shen, M.; Somekh, M.G. A General Description of the Performance of Surface Plasmon Sensors Using a Transmission Line Resonant Circuit Model. IEEE Sens. J. 2019, 19, 11281–11288. [Google Scholar] [CrossRef]
- Dodge, M.J. Refractive properties of magnesium fluoride. Appl. Opt. 1984, 23, 1980–1985. [Google Scholar] [CrossRef] [PubMed]
- Franta, D.; Nečas, D.; Ohlídal, I. Universal dispersion model for characterization of optical thin films over a wide spectral range: Application to hafnia. Appl. Opt. 2015, 54, 9108–9119. [Google Scholar] [CrossRef] [PubMed]


| Structure | Effective Refractive Index | |
|---|---|---|
| Rectangle pillar | ||
| TM polarization | (6) | |
| TE polarization | (7) | |
| Circular pillar | ||
| TM polarization | (8) | |
| TE polarization | (9) |
| Structure | Sensitivity, RIU−1 | FWHM | FOM, RIU−1 | Dynamic Range, RIU |
|---|---|---|---|---|
| Conventional SPR [13] | 1.1870 | 0.0349 | 34 | 1.00–1.40 |
| Two metallic [13] | 9.0811 | 0.0248 | 365 | 1.23–1.36 |
| Bragg mirrors [13] | 13.0490 | 0.0307 | 426 | 1.10–1.27 |
| 1D grating with TM polarization [13] | 0.7236 | 0.0011 | 680 | 1.00–1.38 |
| 1D grating with TE polarization [13] | 0.6287 | 0.0006 | 902 | 1.00–1.35 |
| Rectangular 2D grating with TM polarization | 0.8820 | 0.0003 | 2580 | 1.00–1.18 |
| Rectangular 2D grating with TE polarization | 0.7522 | 0.0003 | 2190 | 1.17–1.26 |
| Circular 2D grating with TM polarization | 1.0298 | 0.0003 | 3040 | 1.00–1.25 |
| Circular 2D grating with TE polarization | 0.8902 | 0.0003 | 2720 | 1.16–1.32 |
Publisher’s Note: MDPI stays neutral with regard to jurisdictional claims in published maps and institutional affiliations. |
© 2021 by the authors. Licensee MDPI, Basel, Switzerland. This article is an open access article distributed under the terms and conditions of the Creative Commons Attribution (CC BY) license (https://creativecommons.org/licenses/by/4.0/).
Share and Cite
Pechprasarn, S.; Sasivimolkul, S.; Suvarnaphaet, P. Fabry–Perot Resonance in 2D Dielectric Grating for Figure of Merit Enhancement in Refractive Index Sensing. Sensors 2021, 21, 4958. https://doi.org/10.3390/s21154958
Pechprasarn S, Sasivimolkul S, Suvarnaphaet P. Fabry–Perot Resonance in 2D Dielectric Grating for Figure of Merit Enhancement in Refractive Index Sensing. Sensors. 2021; 21(15):4958. https://doi.org/10.3390/s21154958
Chicago/Turabian StylePechprasarn, Suejit, Suvicha Sasivimolkul, and Phitsini Suvarnaphaet. 2021. "Fabry–Perot Resonance in 2D Dielectric Grating for Figure of Merit Enhancement in Refractive Index Sensing" Sensors 21, no. 15: 4958. https://doi.org/10.3390/s21154958
APA StylePechprasarn, S., Sasivimolkul, S., & Suvarnaphaet, P. (2021). Fabry–Perot Resonance in 2D Dielectric Grating for Figure of Merit Enhancement in Refractive Index Sensing. Sensors, 21(15), 4958. https://doi.org/10.3390/s21154958