
Accuracy of a Low-Cost 3D-Printed Wearable Goniometer for Measuring Wrist Motion


Abstract
:1. Introduction
2. Materials and Methods
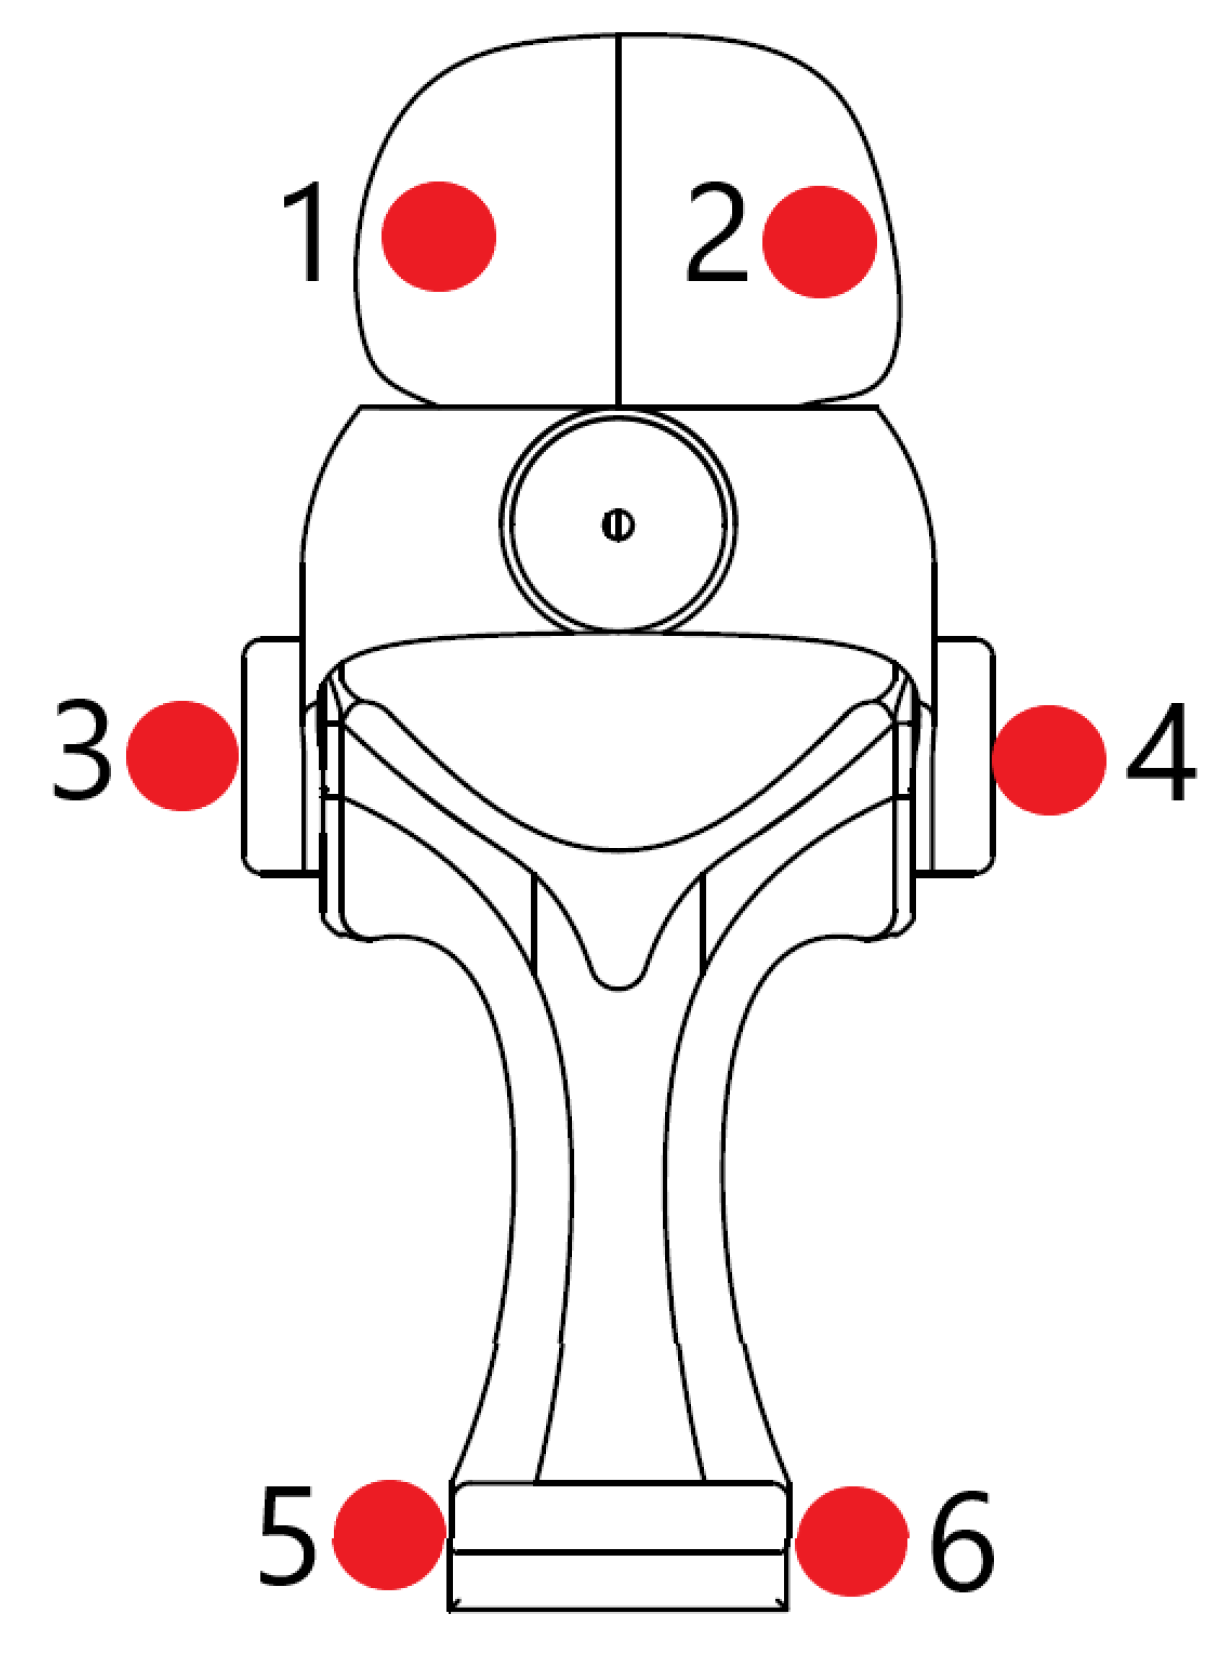
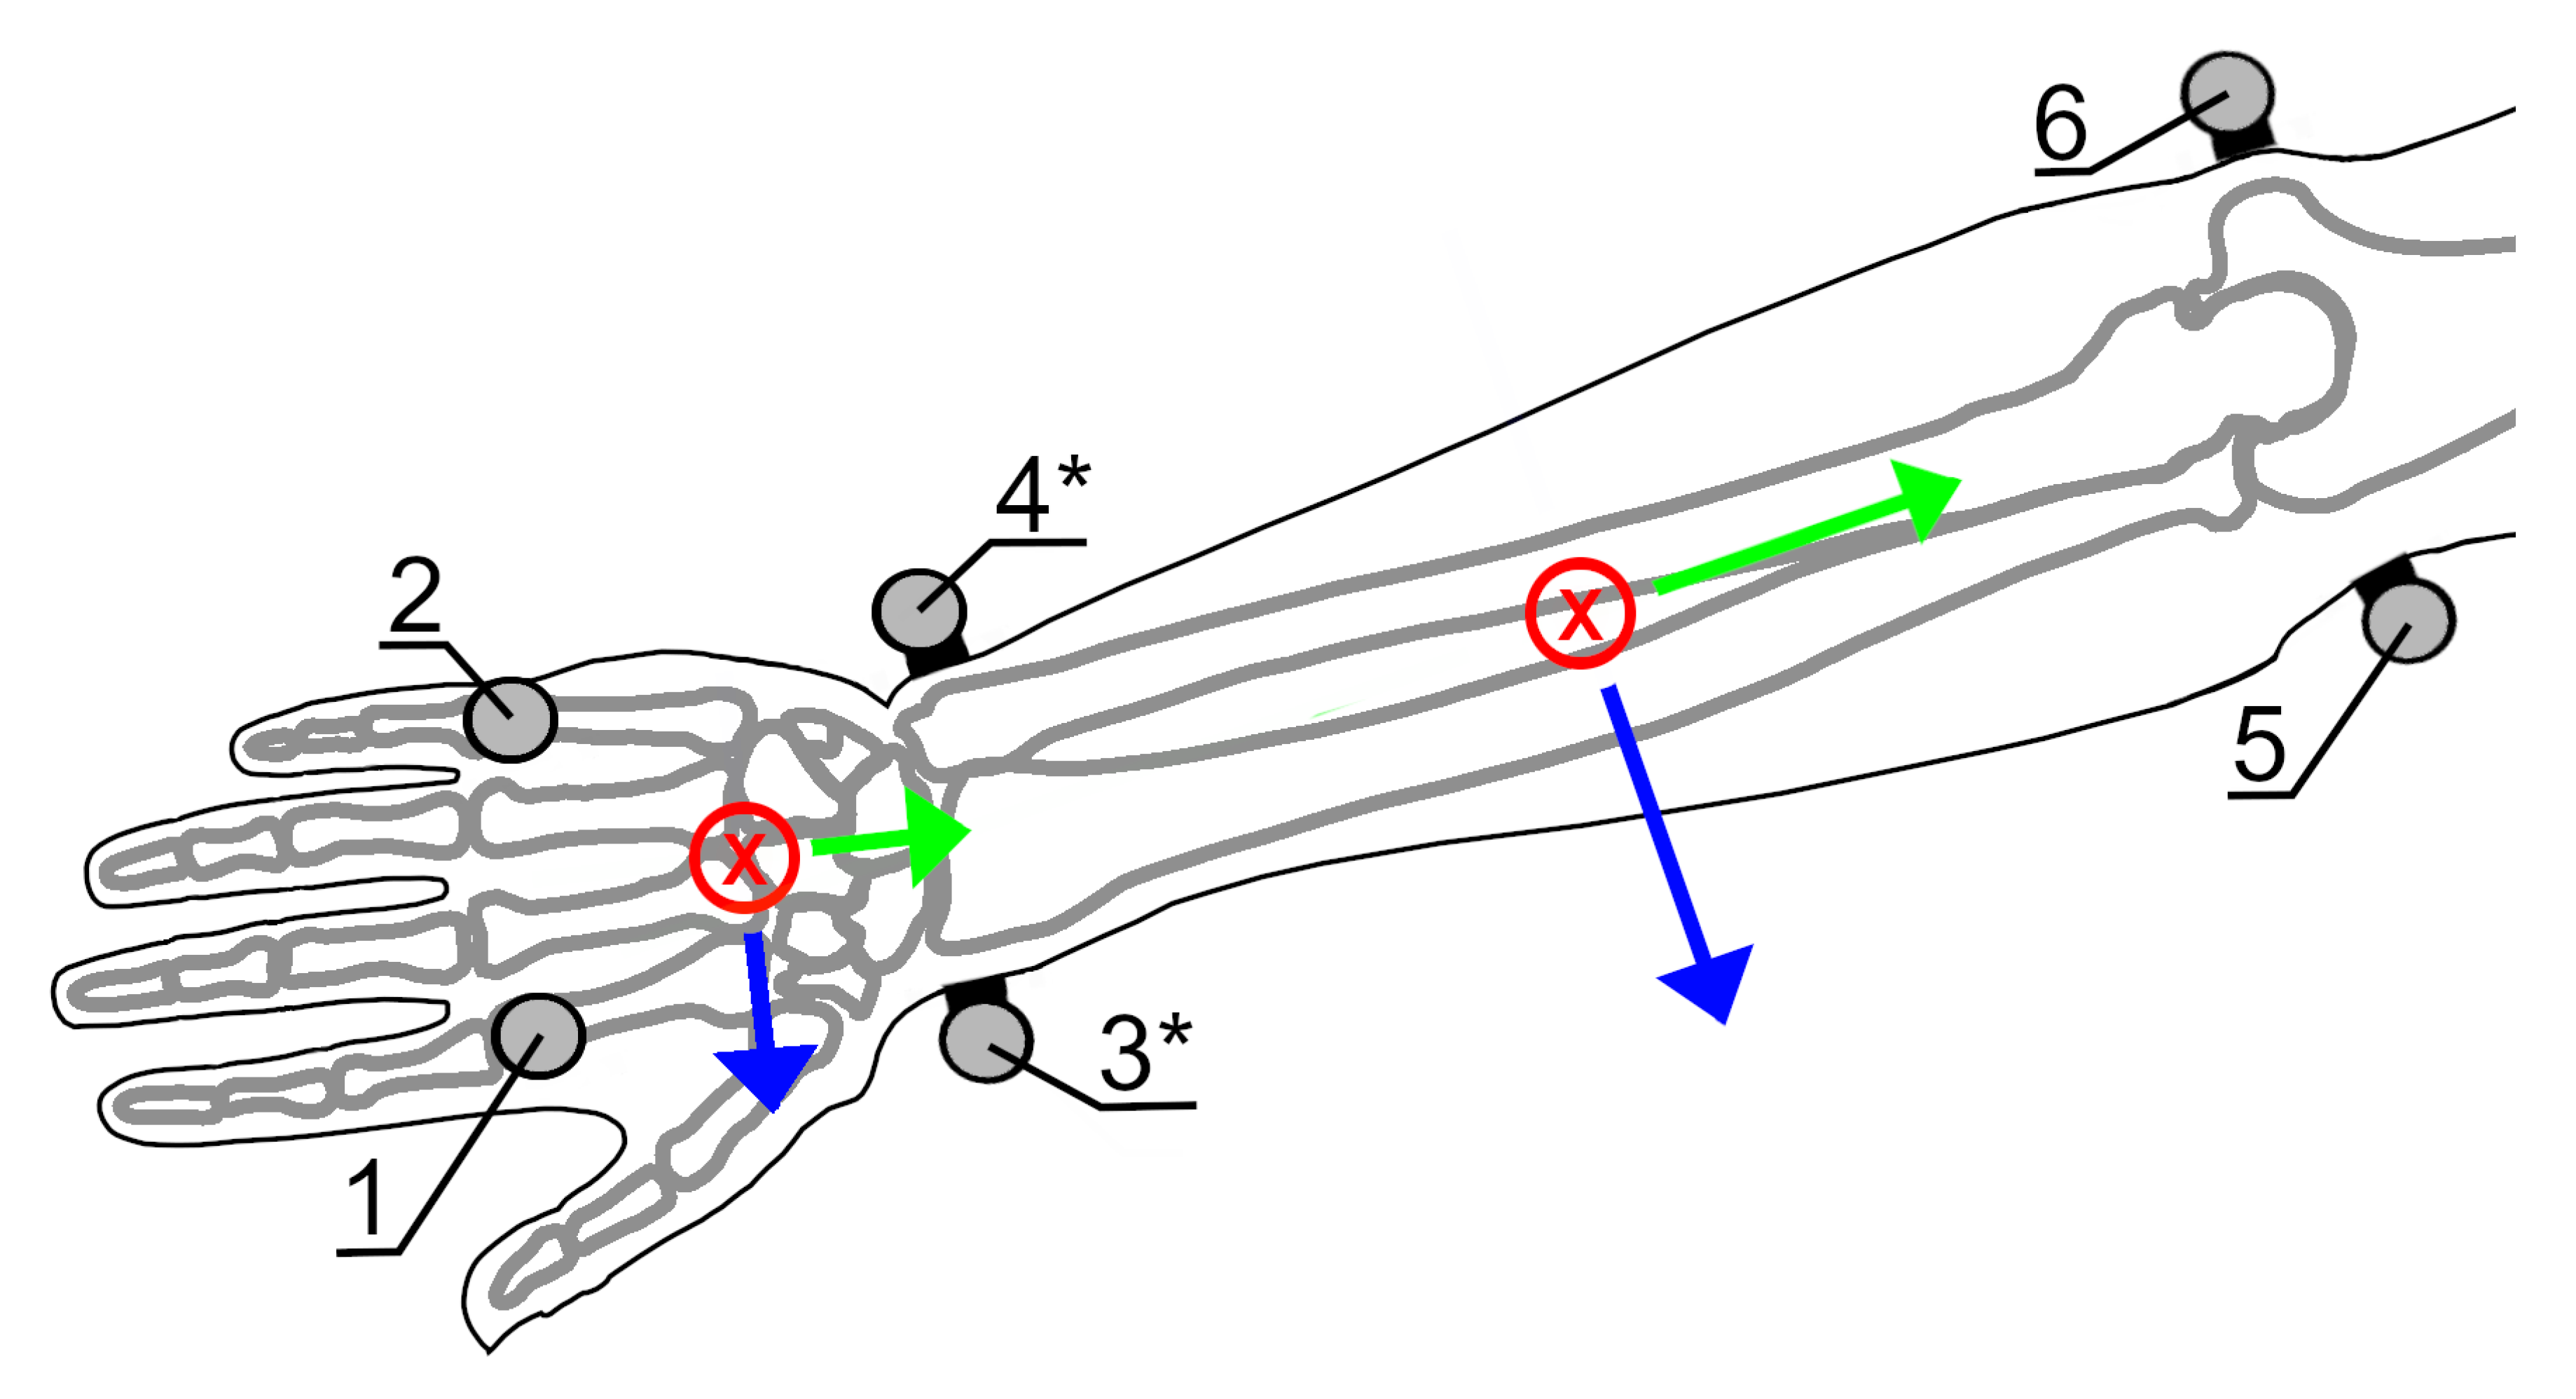
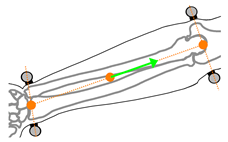
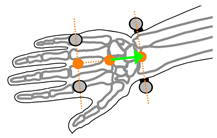
2.1. Device Design
2.2. Benchtop Test Procedures
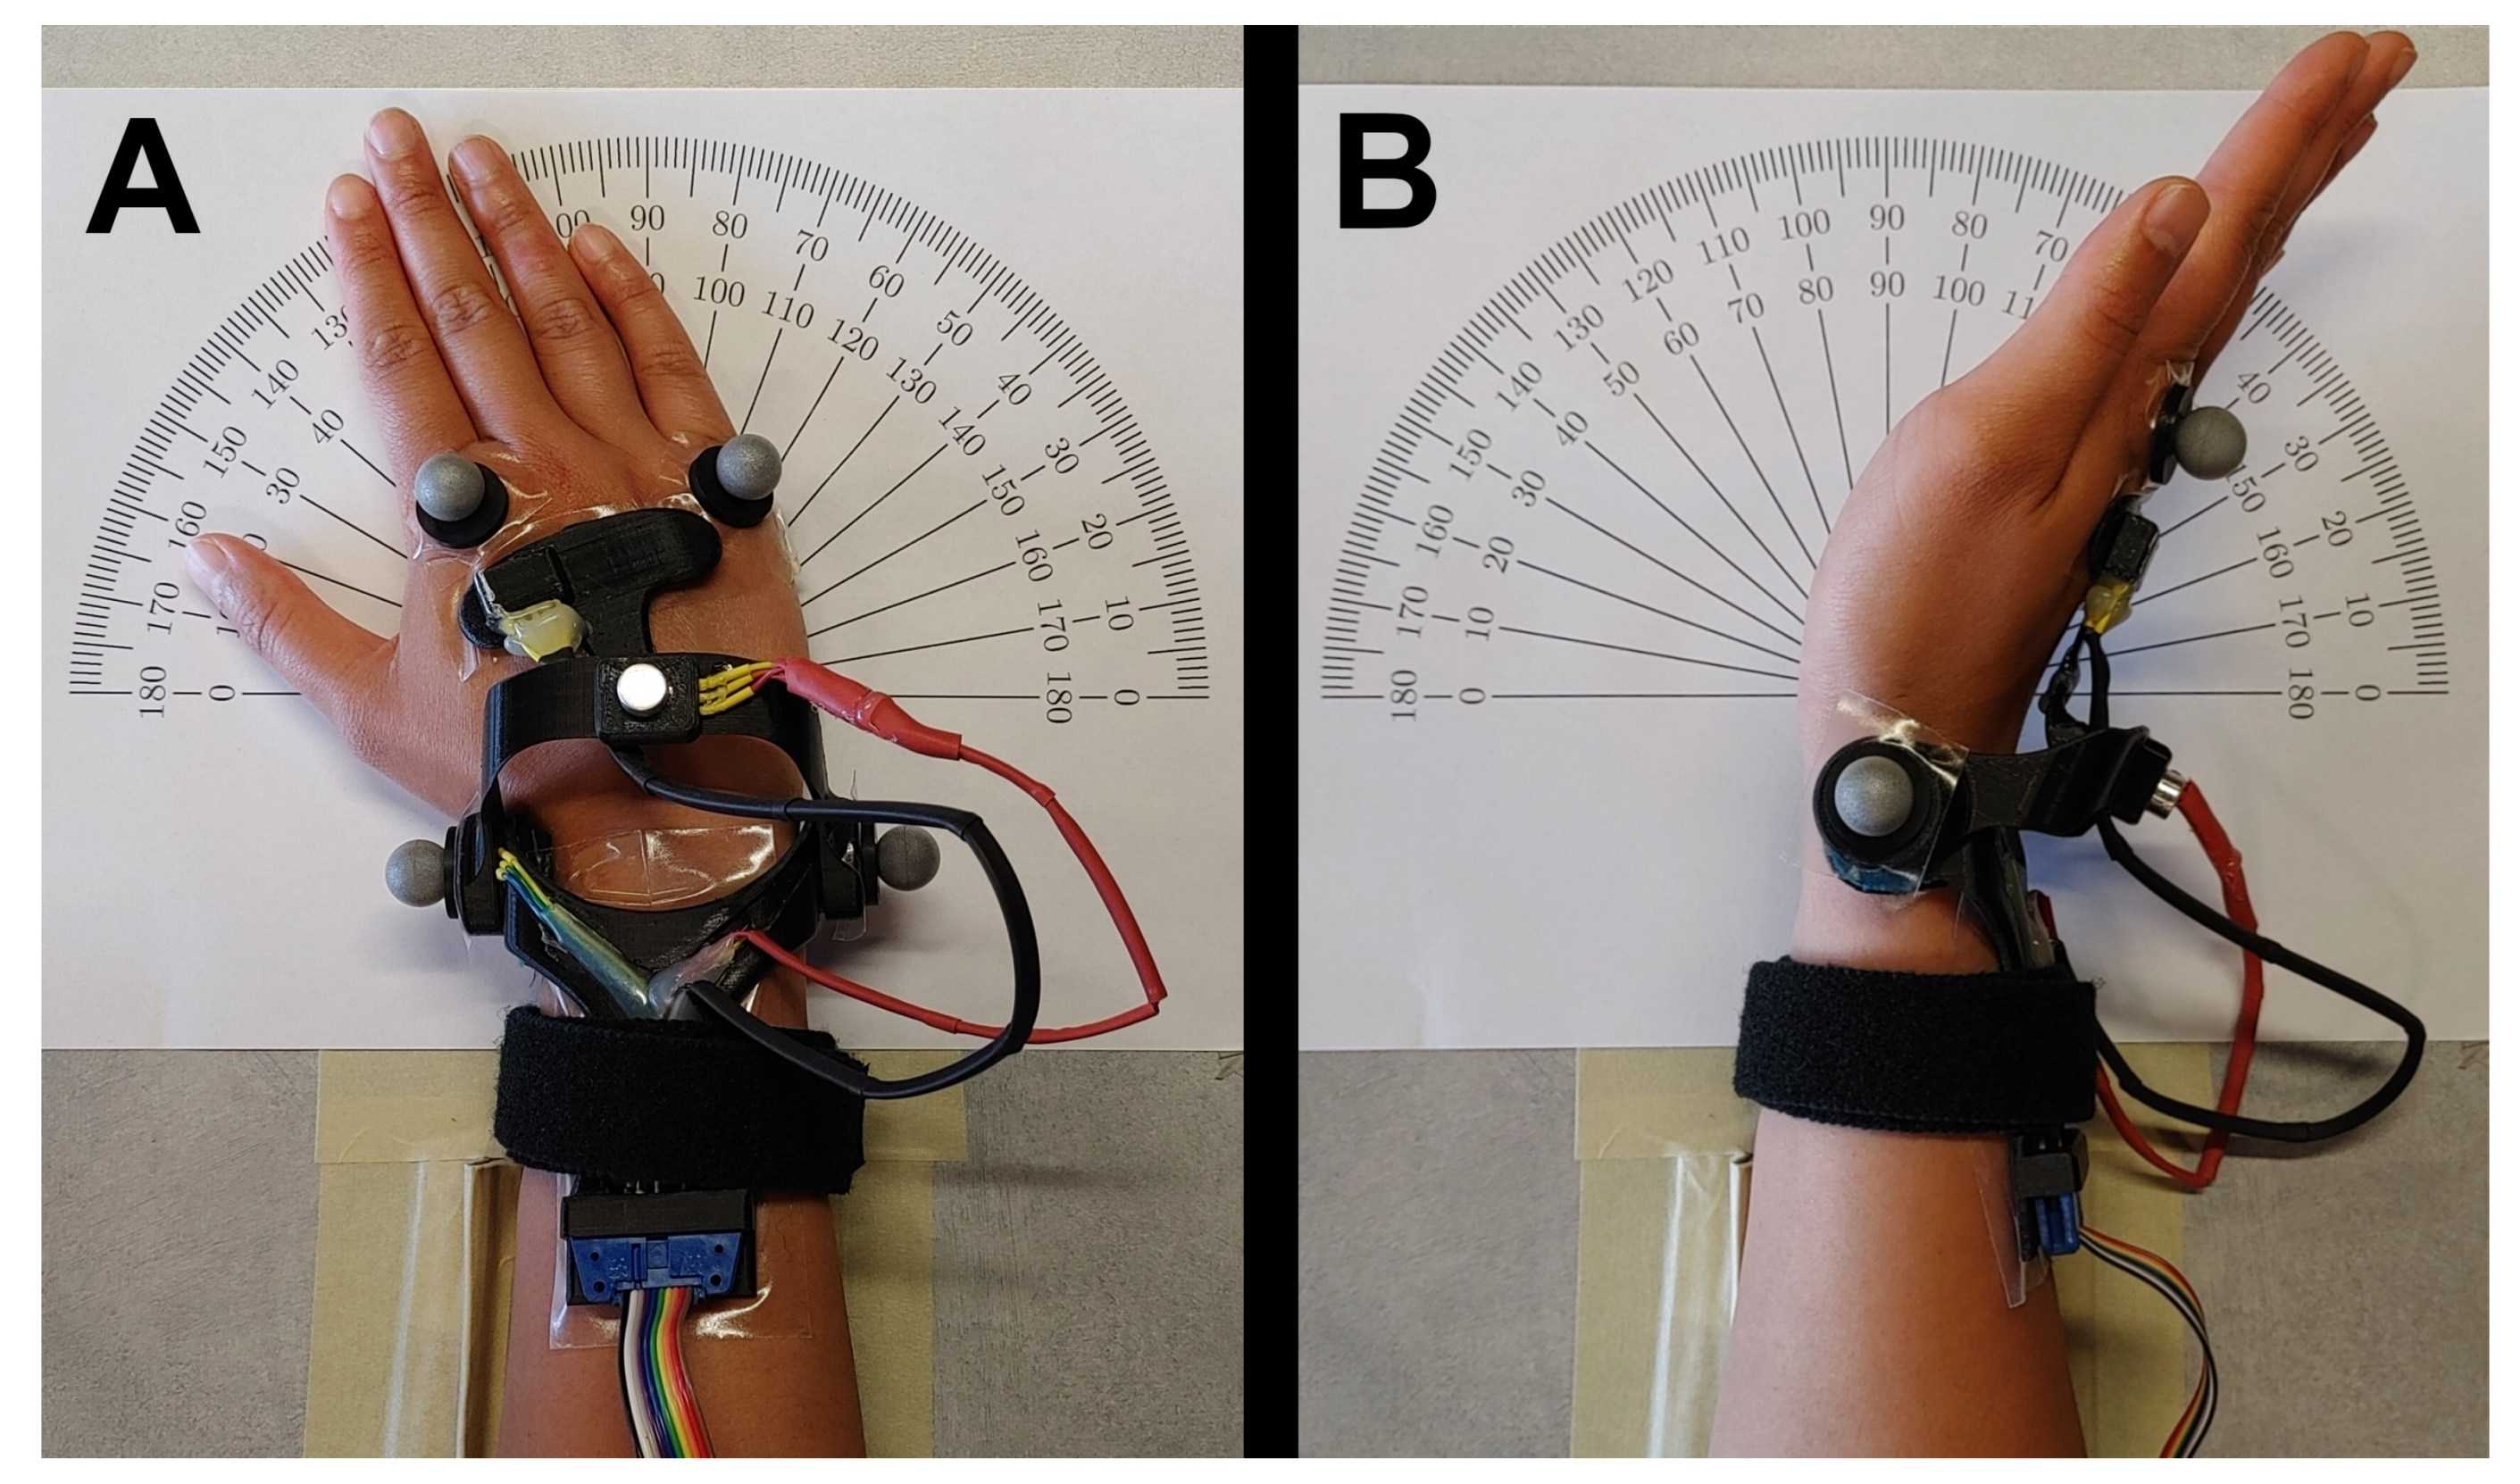
2.3. In Vivo Experimental Procedures
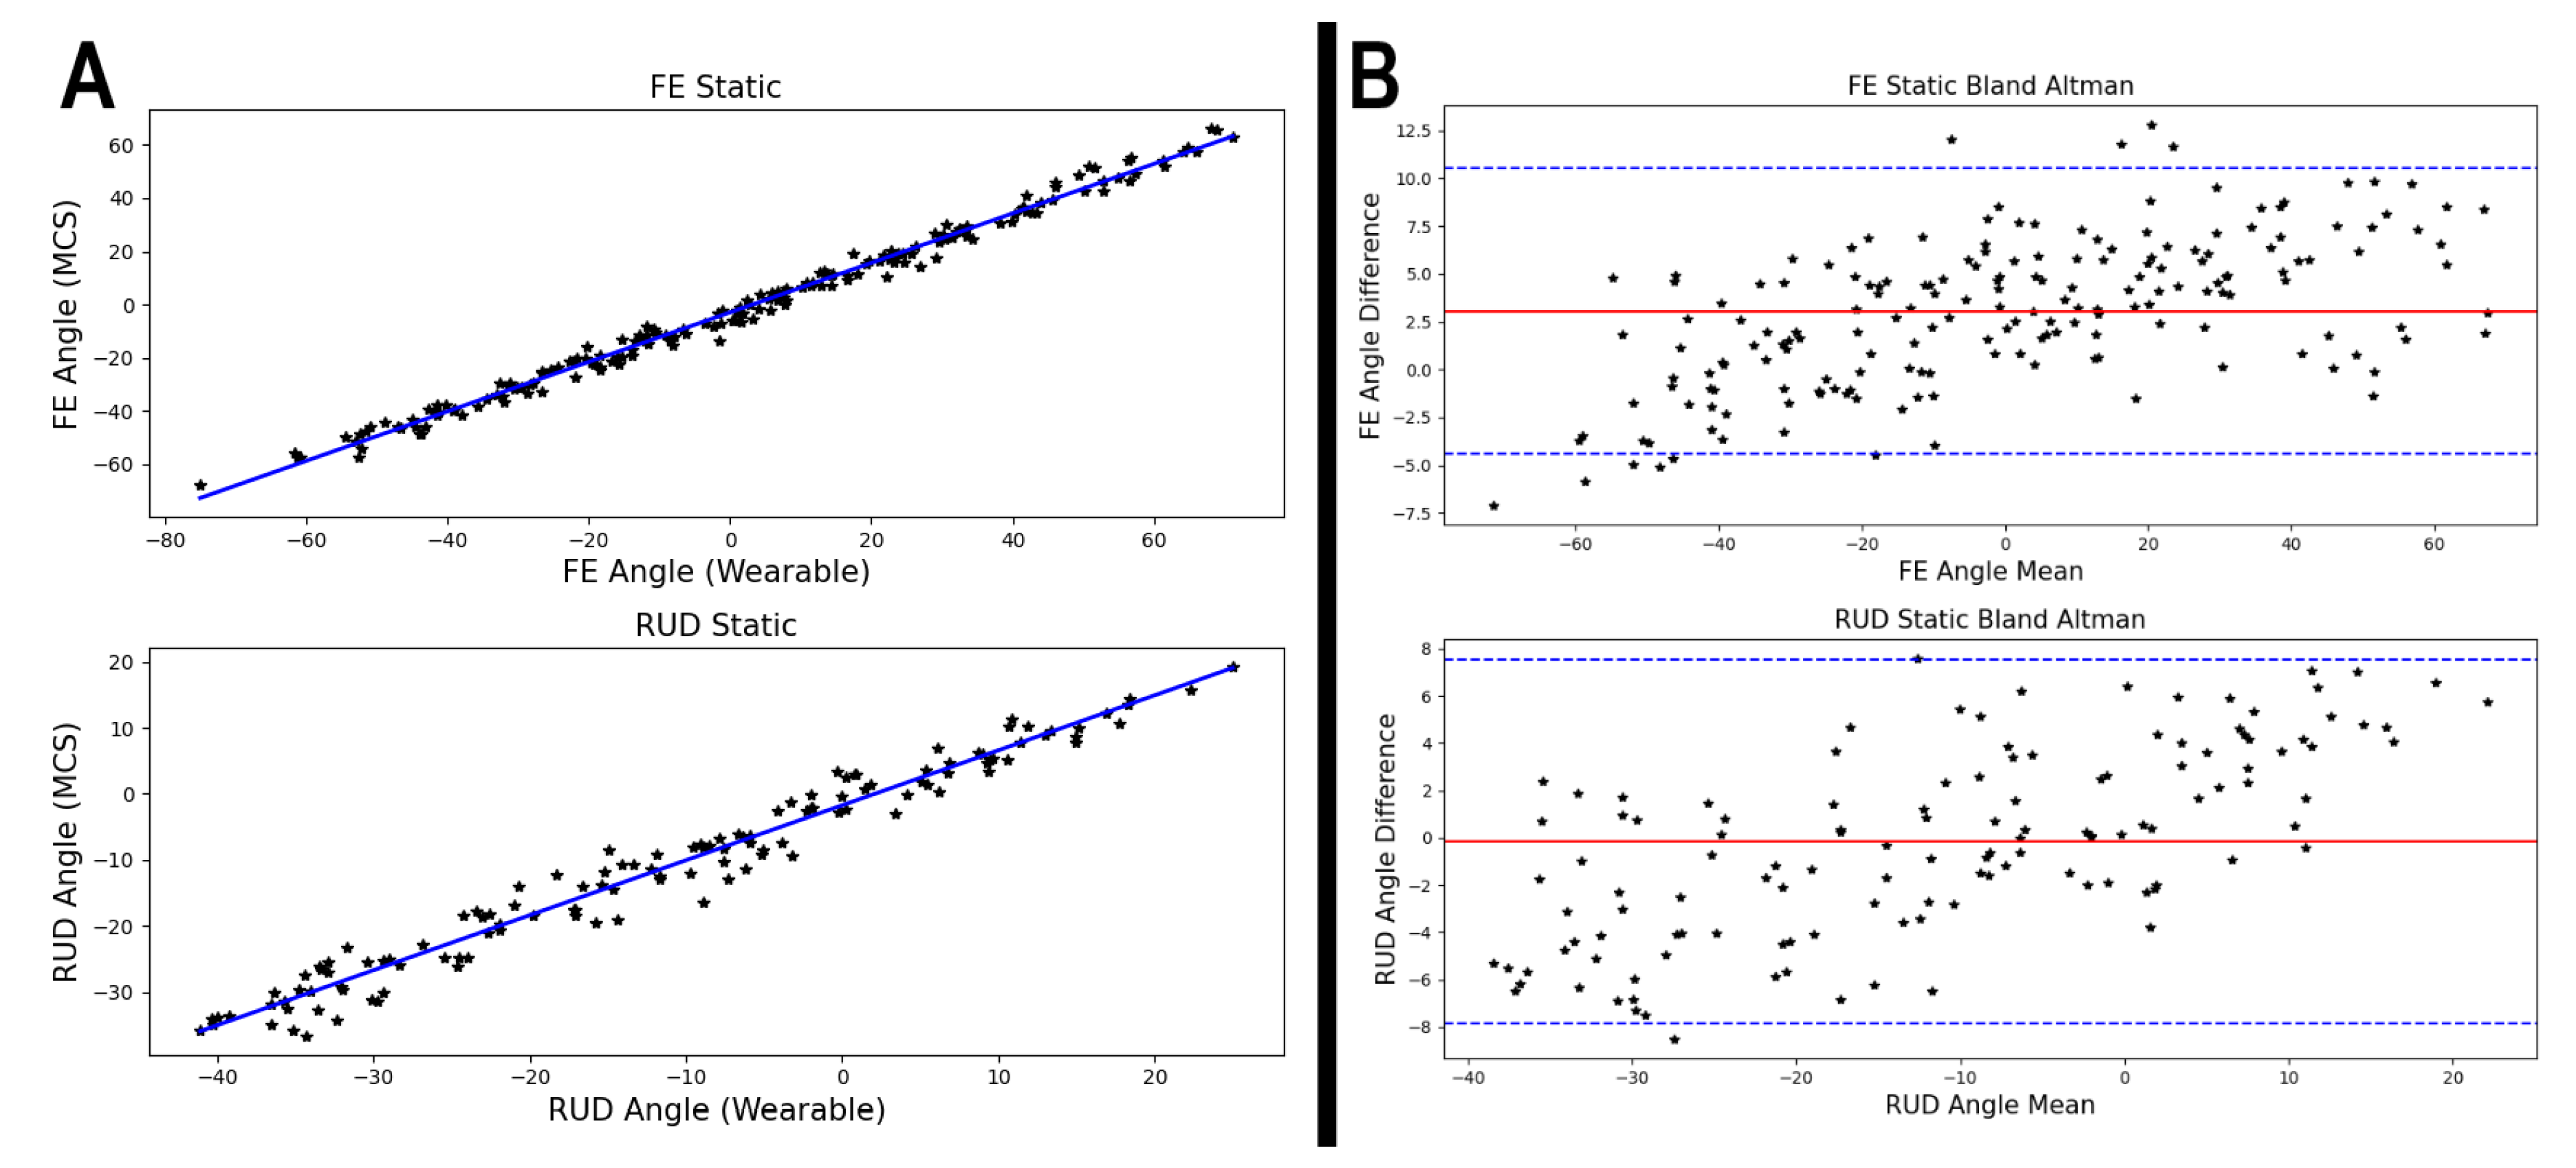
2.4. Data Analysis
3. Results
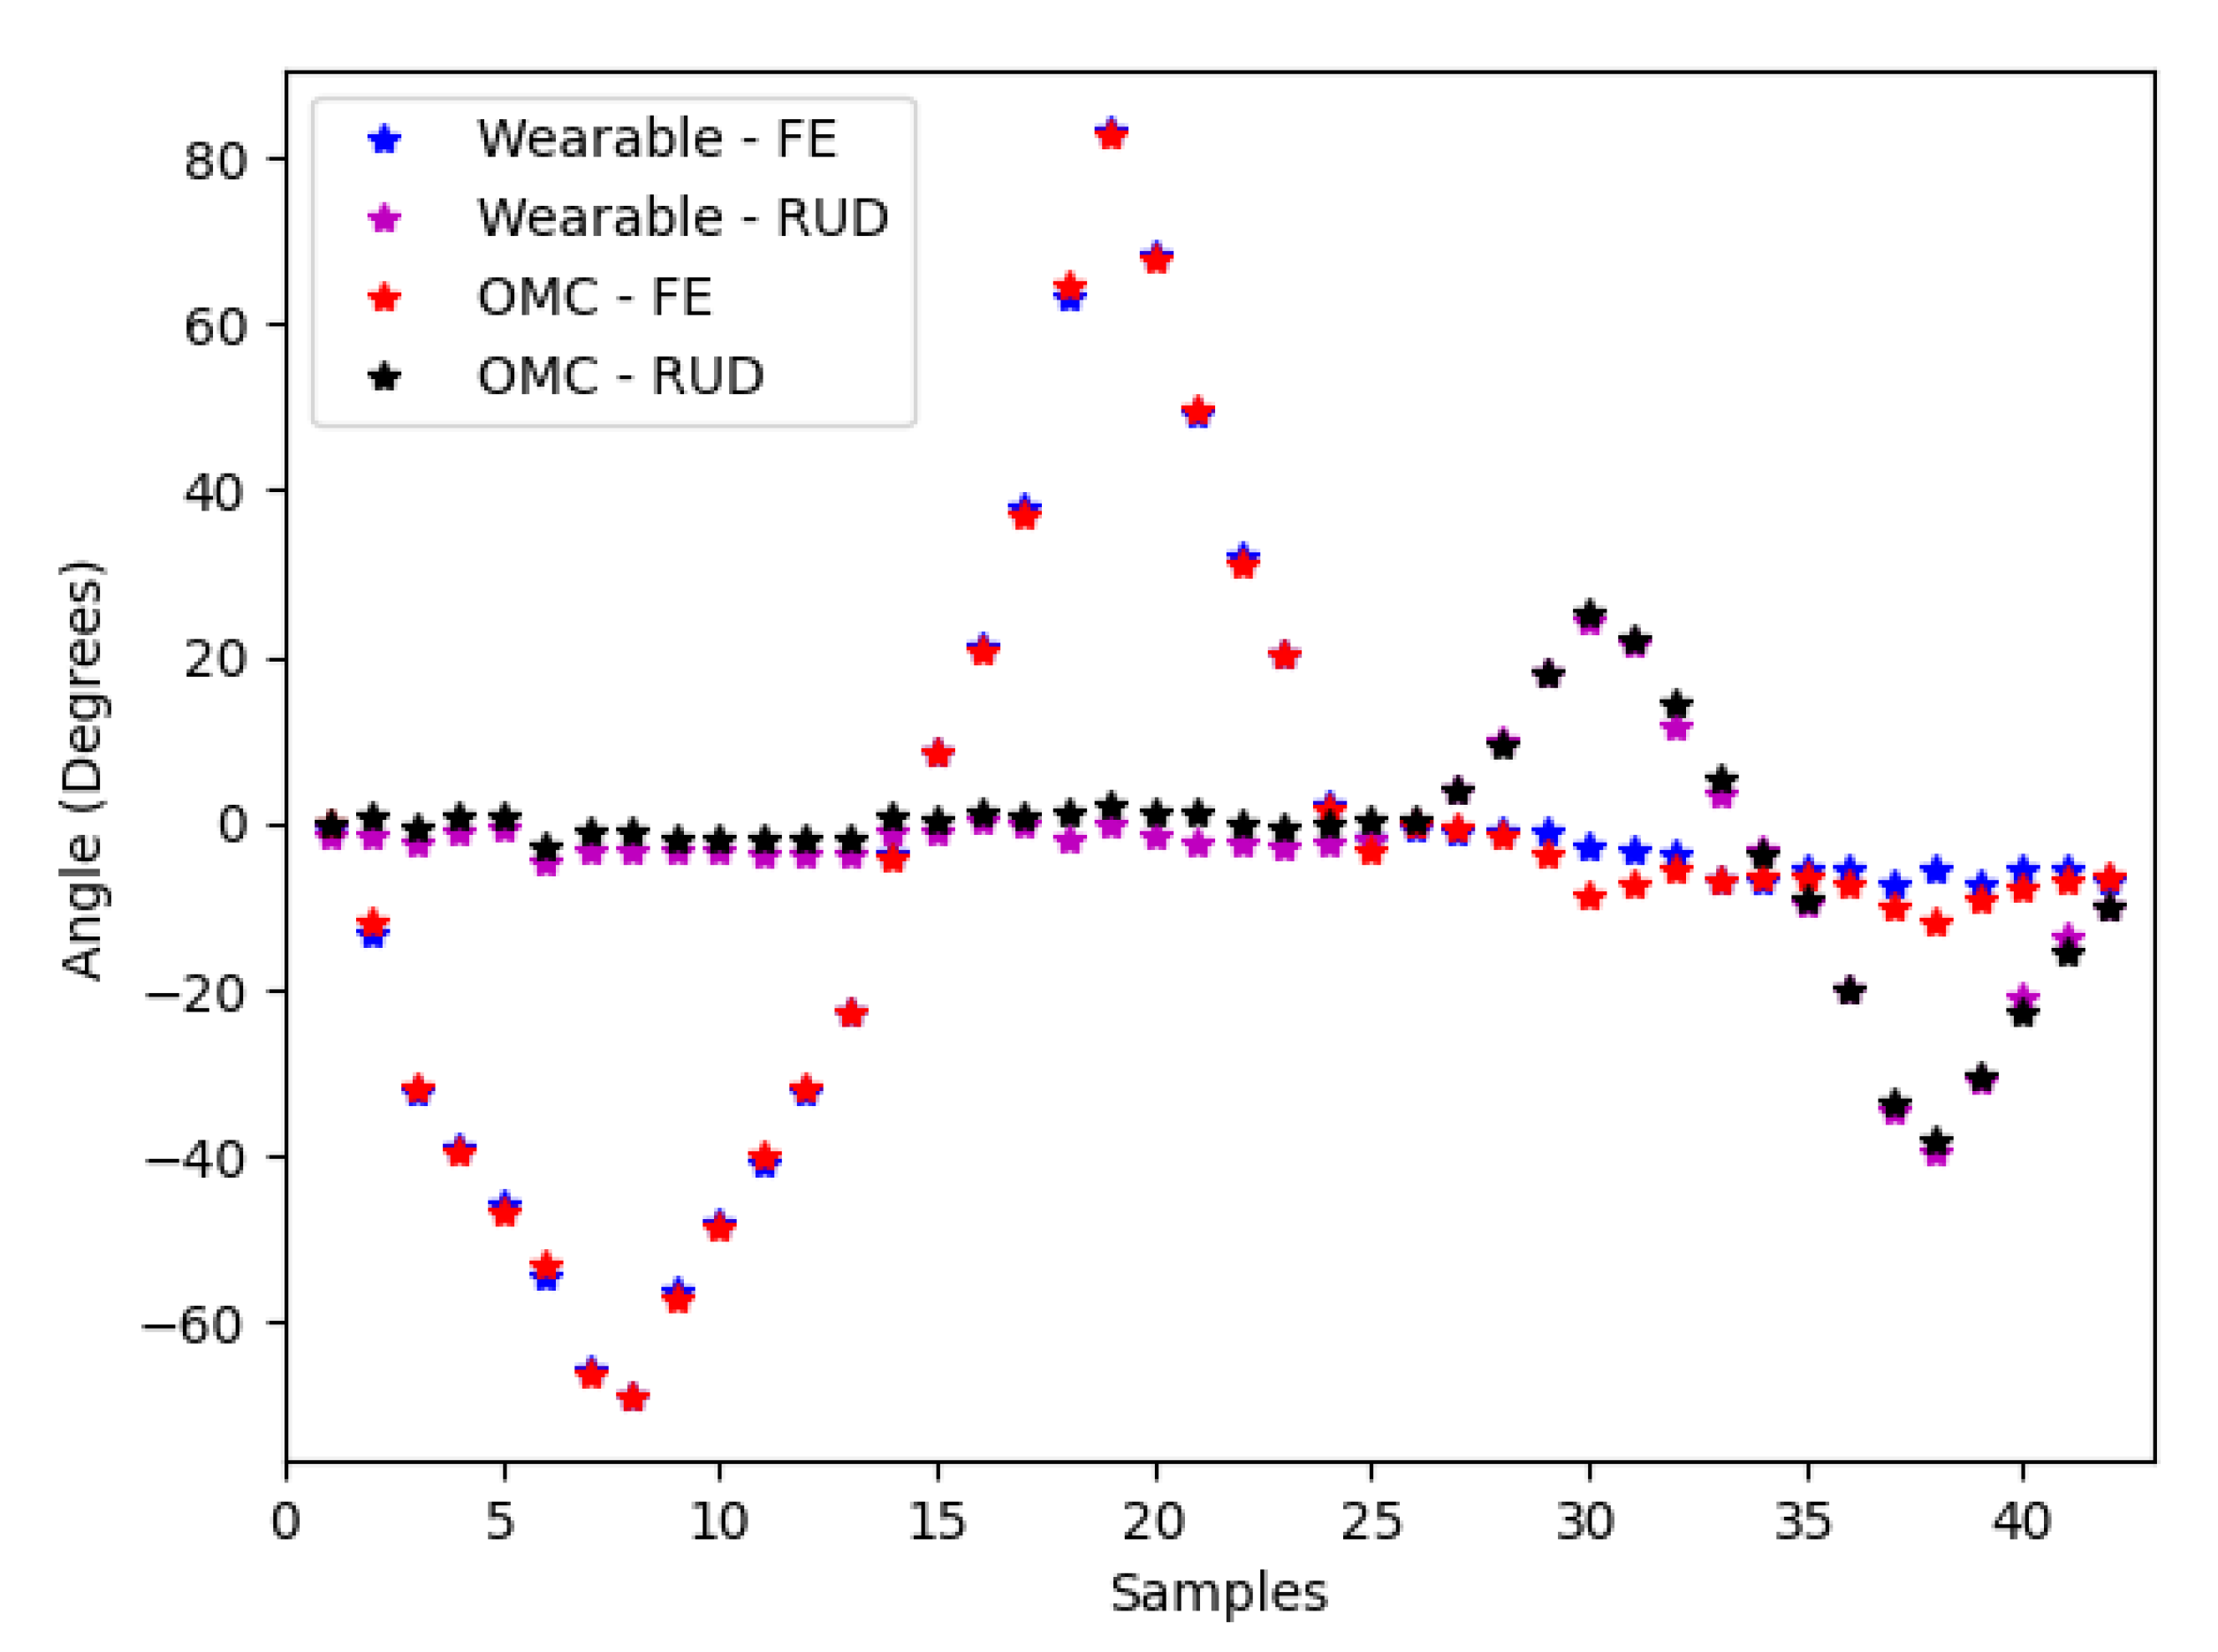
3.1. Benchtop Test
3.2. In Vivo Test
4. Discussion
Author Contributions
Funding
Institutional Review Board Statement
Informed Consent Statement
Data Availability Statement
Acknowledgments
Conflicts of Interest
Abbreviations
| FE | Flexion/extension |
| RUD | Radial/ulnar deviation |
| OMC | Optical motion capture |
| IMU | Inertial measurement unit |
References
- McHugh, B.P.; Morton, A.M.; Akhbari, B.; Molino, J.; Crisco, J.J. Accuracy of an electrogoniometer relative to optical motion tracking for quantifying wrist range of motion. J. Med. Eng. Technol. 2020, 44, 49–54. [Google Scholar] [CrossRef] [PubMed]
- Simon, S.R. Quantification of human motion: Gait analysis—Benefits and limitations to its application to clinical problems. J. Biomech. 2004, 37, 1869–1880. [Google Scholar] [CrossRef] [PubMed]
- McKinnon, C.D.; Ehmke, S.; Kociolek, A.M.; Callaghan, J.P.; Keir, P.J. Wrist Posture Estimation Differences and Reliability between Video Analysis and Electrogoniometer Methods. Hum. Factors 2020. [Google Scholar] [CrossRef] [PubMed]
- McAtamney, L.; Corlett, E.N. RULA: A survey method for the investigation of work-related upper limb disorders. Appl. Ergon. 1993, 24, 91–99. [Google Scholar] [CrossRef]
- Hignett, S.; McAtamney, L. Rapid Entire Body Assessment (Handbook of Human Factors and Ergonomics Methods; CRC Press: Boca Raton, FL, USA, 2004; pp. 97–108. [Google Scholar]
- Steven Moore, J.; Garg, A. The strain index: A proposed method to analyze jobs for risk of distal upper extremity disorders. Am. Ind. Hyg. Assoc. J. 1995, 56, 443–458. [Google Scholar] [CrossRef] [PubMed]
- Ranavolo, A.; Draicchio, F.; Varrecchia, T.; Silvetti, A.; Iavicoli, S. Wearable Monitoring Devices for Biomechanical Risk Assessment at Work: Current Status and Future Challenges—A Systematic Review. Int. J. Environ. Res. Public Health 2018, 15, 2001. [Google Scholar] [CrossRef] [PubMed] [Green Version]
- Schoenmarklin, R.W.; Marras, W.S. Validation of a hand/wrist electromechanical goniometer. In Proceedings of the Human Factors Society Annual Meeting, Denver, CO, USA, 16–20 October 1989; SAGE Publications: Los Angeles, CA, USA, 1989; Volume 33, pp. 718–722. [Google Scholar]
- Ryu, J.; Cooney, W.P., III; Askew, L.J.; An, K.N.; Chao, E.Y. Functional ranges of motion of the wrist joint. J. Hand Surg. 1991, 16, 409–419. [Google Scholar] [CrossRef]
- Tesio, L.; Monzani, M.; Gatti, R.; Franchignoni, F. Flexible electrogoniometers: Kinesiological advantages with respect to potentiometric goniometers. Clin. Biomech. 1995, 10, 275–277. [Google Scholar] [CrossRef]
- Jonsson, P.; Johnson, P.W. Comparison of measurement accuracy between two types of wrist goniometer systems. Appl. Ergon. 2001, 32, 599–607. [Google Scholar] [CrossRef]
- Hansson, G.Å.; Balogh, I.; Ohlsson, K.; Skerfving, S. Measurements of wrist and forearm positions and movements: Effect of, and compensation for, goniometer crosstalk. J. Electromyogr. Kines. 2004, 14, 355–367. [Google Scholar] [CrossRef] [PubMed]
- Poitras, I.; Dupuis, F.; Bielmann, M.; Campeau-Lecours, A.; Mercier, C.; Bouyer, L.J.; Roy, J.S. Validity and reliability of wearable sensors for joint angle estimation: A systematic review. Sensors 2019, 19, 1555. [Google Scholar] [CrossRef] [PubMed] [Green Version]
- Robert-Lachaine, X.; Mecheri, H.; Larue, C.; Plamondon, A. Validation of inertial measurement units with an optoelectronic system for whole-body motion analysis. Med. Biol. Eng. Comput. 2017, 55, 609–619. [Google Scholar] [CrossRef] [PubMed]
- Schall, M.C., Jr.; Sesek, R.F.; Cavuoto, L.A. Barriers to the adoption of wearable sensors in the workplace: A survey of occupational safety and health professionals. Hum. Factors 2018, 60, 351–362. [Google Scholar] [CrossRef] [PubMed]
- Schoenmarklin, R.W.; Marras, W.S. Wrist motions in industry: Variance between jobs and subjects. In Proceedings of the Human Factors and Ergonomics Society Annual Meeting, Seattle, WA, USA, 11–15 October 1993; SAGE Publications: Los Angeles, CA, USA, 1993; Volume 37, pp. 649–653. [Google Scholar]
- Tilley, A.R. The Measure of Man and Woman: Human Factors in Design; John Wiley & Sons: Hoboken, NJ, USA, 2001. [Google Scholar]
- Wu, G.; Van der Helm, F.C.; Veeger, H.D.; Makhsous, M.; Van Roy, P.; Anglin, C.; Nagels, J.; Karduna, A.R.; McQuade, K.; Wang, X.; et al. ISB recommendation on definitions of joint coordinate systems of various joints for the reporting of human joint motion—Part II: Shoulder, elbow, wrist and hand. J. Biomech. 2005, 38, 981–992. [Google Scholar] [CrossRef] [PubMed]
- Grood, E.S.; Suntay, W.J. A joint coordinate system for the clinical description of three-dimensional motions: Application to the knee. J. Biomech. Eng. 1983, 105, 136–144. [Google Scholar] [CrossRef] [PubMed]
- Bland, J.M.; Altman, D. Statistical methods for assessing agreement between two methods of clinical measurement. Lancet 1986, 327, 307–310. [Google Scholar] [CrossRef]
- Kociolek, A.M.; Keir, P.J. Reliability of distal upper extremity posture matching using slow-motion and frame-by-frame video methods. Hum. Factors 2010, 52, 441–455. [Google Scholar] [CrossRef] [PubMed]
- Akinnola, O.O.; Vardakastani, V.; Kedgley, A.E. The effect of planar constraint on the definition of the wrist axes of rotation. J. Biomech. 2020, 113, 110083. [Google Scholar] [CrossRef] [PubMed]
- Ranavolo, A.; Ajoudani, A.; Cherubini, A.; Bianchi, M.; Fritzsche, L.; Iavicoli, S.; Sartori, M.; Silvetti, A.; Vanderborght, B.; Varrecchia, T.; et al. The sensor-based biomechanical risk assessment at the base of the need for revising of standards for human ergonomics. Sensors 2020, 20, 5750. [Google Scholar] [CrossRef] [PubMed]


| Y-Axis | X-Axis | Z-Axis |
|---|---|---|
| Forearm | ||
 Vector between the midpoint of the radial and ulnar styloid processes and the midpoint of the medial and lateral epicondyles of the elbow |  Vector normal to the plane formed by the radial and ulnar styloid processes and the midpoint of the medial and lateral epicondyles of the elbow | 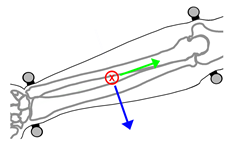 Cross product of the X-axis of the forearm and Y-axis of the forearm |
| Hand | ||
 Vector between the midpoint of radial and ulnar styloid processes, and the midpoint of the second and fifth metacarpal-phalangeal joints |  Vector normal to the plane formed by the radial and ulnar styloid processes and the midpoint of the second and fifth metacarpal-phalangeal joints | 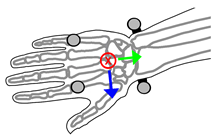 Cross product of the X-axis of the hand and Y-axis of the hand |
| Participant | Flexion/Extension | Radial/Ulnar Deviation | ||
|---|---|---|---|---|
| R | RMSE (°) | R | RMSE (°) | |
| Participant 1 | 0.998 | 3.0 | 0.973 | 3.9 |
| Participant 2 | 0.995 | 3.0 | 0.976 | 3.4 |
| Participant 3 | 0.991 | 7.4 | 0.980 | 4.6 |
| Participant 4 | 0.986 | 5.2 | 0.992 | 4.5 |
| Participant 5 | 0.994 | 4.6 | 0.992 | 4.5 |
| Participant 6 | 0.992 | 6.2 | 0.975 | 5.3 |
| Participant 7 | 0.992 | 5.7 | 0.987 | 1.9 |
| Participant 8 | 0.994 | 3.6 | 0.996 | 5.3 |
| Participant 9 | 0.997 | 5.5 | 0.995 | 2.9 |
| Participant 10 | 0.998 | 5.0 | 0.990 | 2.0 |
| Cumulative Performance | 0.991 | 4.7 | 0.966 | 3.9 |
Publisher’s Note: MDPI stays neutral with regard to jurisdictional claims in published maps and institutional affiliations. |
© 2021 by the authors. Licensee MDPI, Basel, Switzerland. This article is an open access article distributed under the terms and conditions of the Creative Commons Attribution (CC BY) license (https://creativecommons.org/licenses/by/4.0/).
Share and Cite
Young, C.; DeDecker, S.; Anderson, D.; Oliver, M.L.; Gordon, K.D. Accuracy of a Low-Cost 3D-Printed Wearable Goniometer for Measuring Wrist Motion. Sensors 2021, 21, 4799. https://doi.org/10.3390/s21144799
Young C, DeDecker S, Anderson D, Oliver ML, Gordon KD. Accuracy of a Low-Cost 3D-Printed Wearable Goniometer for Measuring Wrist Motion. Sensors. 2021; 21(14):4799. https://doi.org/10.3390/s21144799
Chicago/Turabian StyleYoung, Calvin, Sarah DeDecker, Drew Anderson, Michele L. Oliver, and Karen D. Gordon. 2021. "Accuracy of a Low-Cost 3D-Printed Wearable Goniometer for Measuring Wrist Motion" Sensors 21, no. 14: 4799. https://doi.org/10.3390/s21144799
APA StyleYoung, C., DeDecker, S., Anderson, D., Oliver, M. L., & Gordon, K. D. (2021). Accuracy of a Low-Cost 3D-Printed Wearable Goniometer for Measuring Wrist Motion. Sensors, 21(14), 4799. https://doi.org/10.3390/s21144799