
Affective Colormap Design for Accurate Visual Comprehension in Industrial Tomography †


Abstract
1. Introduction
- Investigating how different colormaps affect task accuracy in the context of MWT by a quantitative evaluation and obtaining the colormaps yielding the best accuracy.
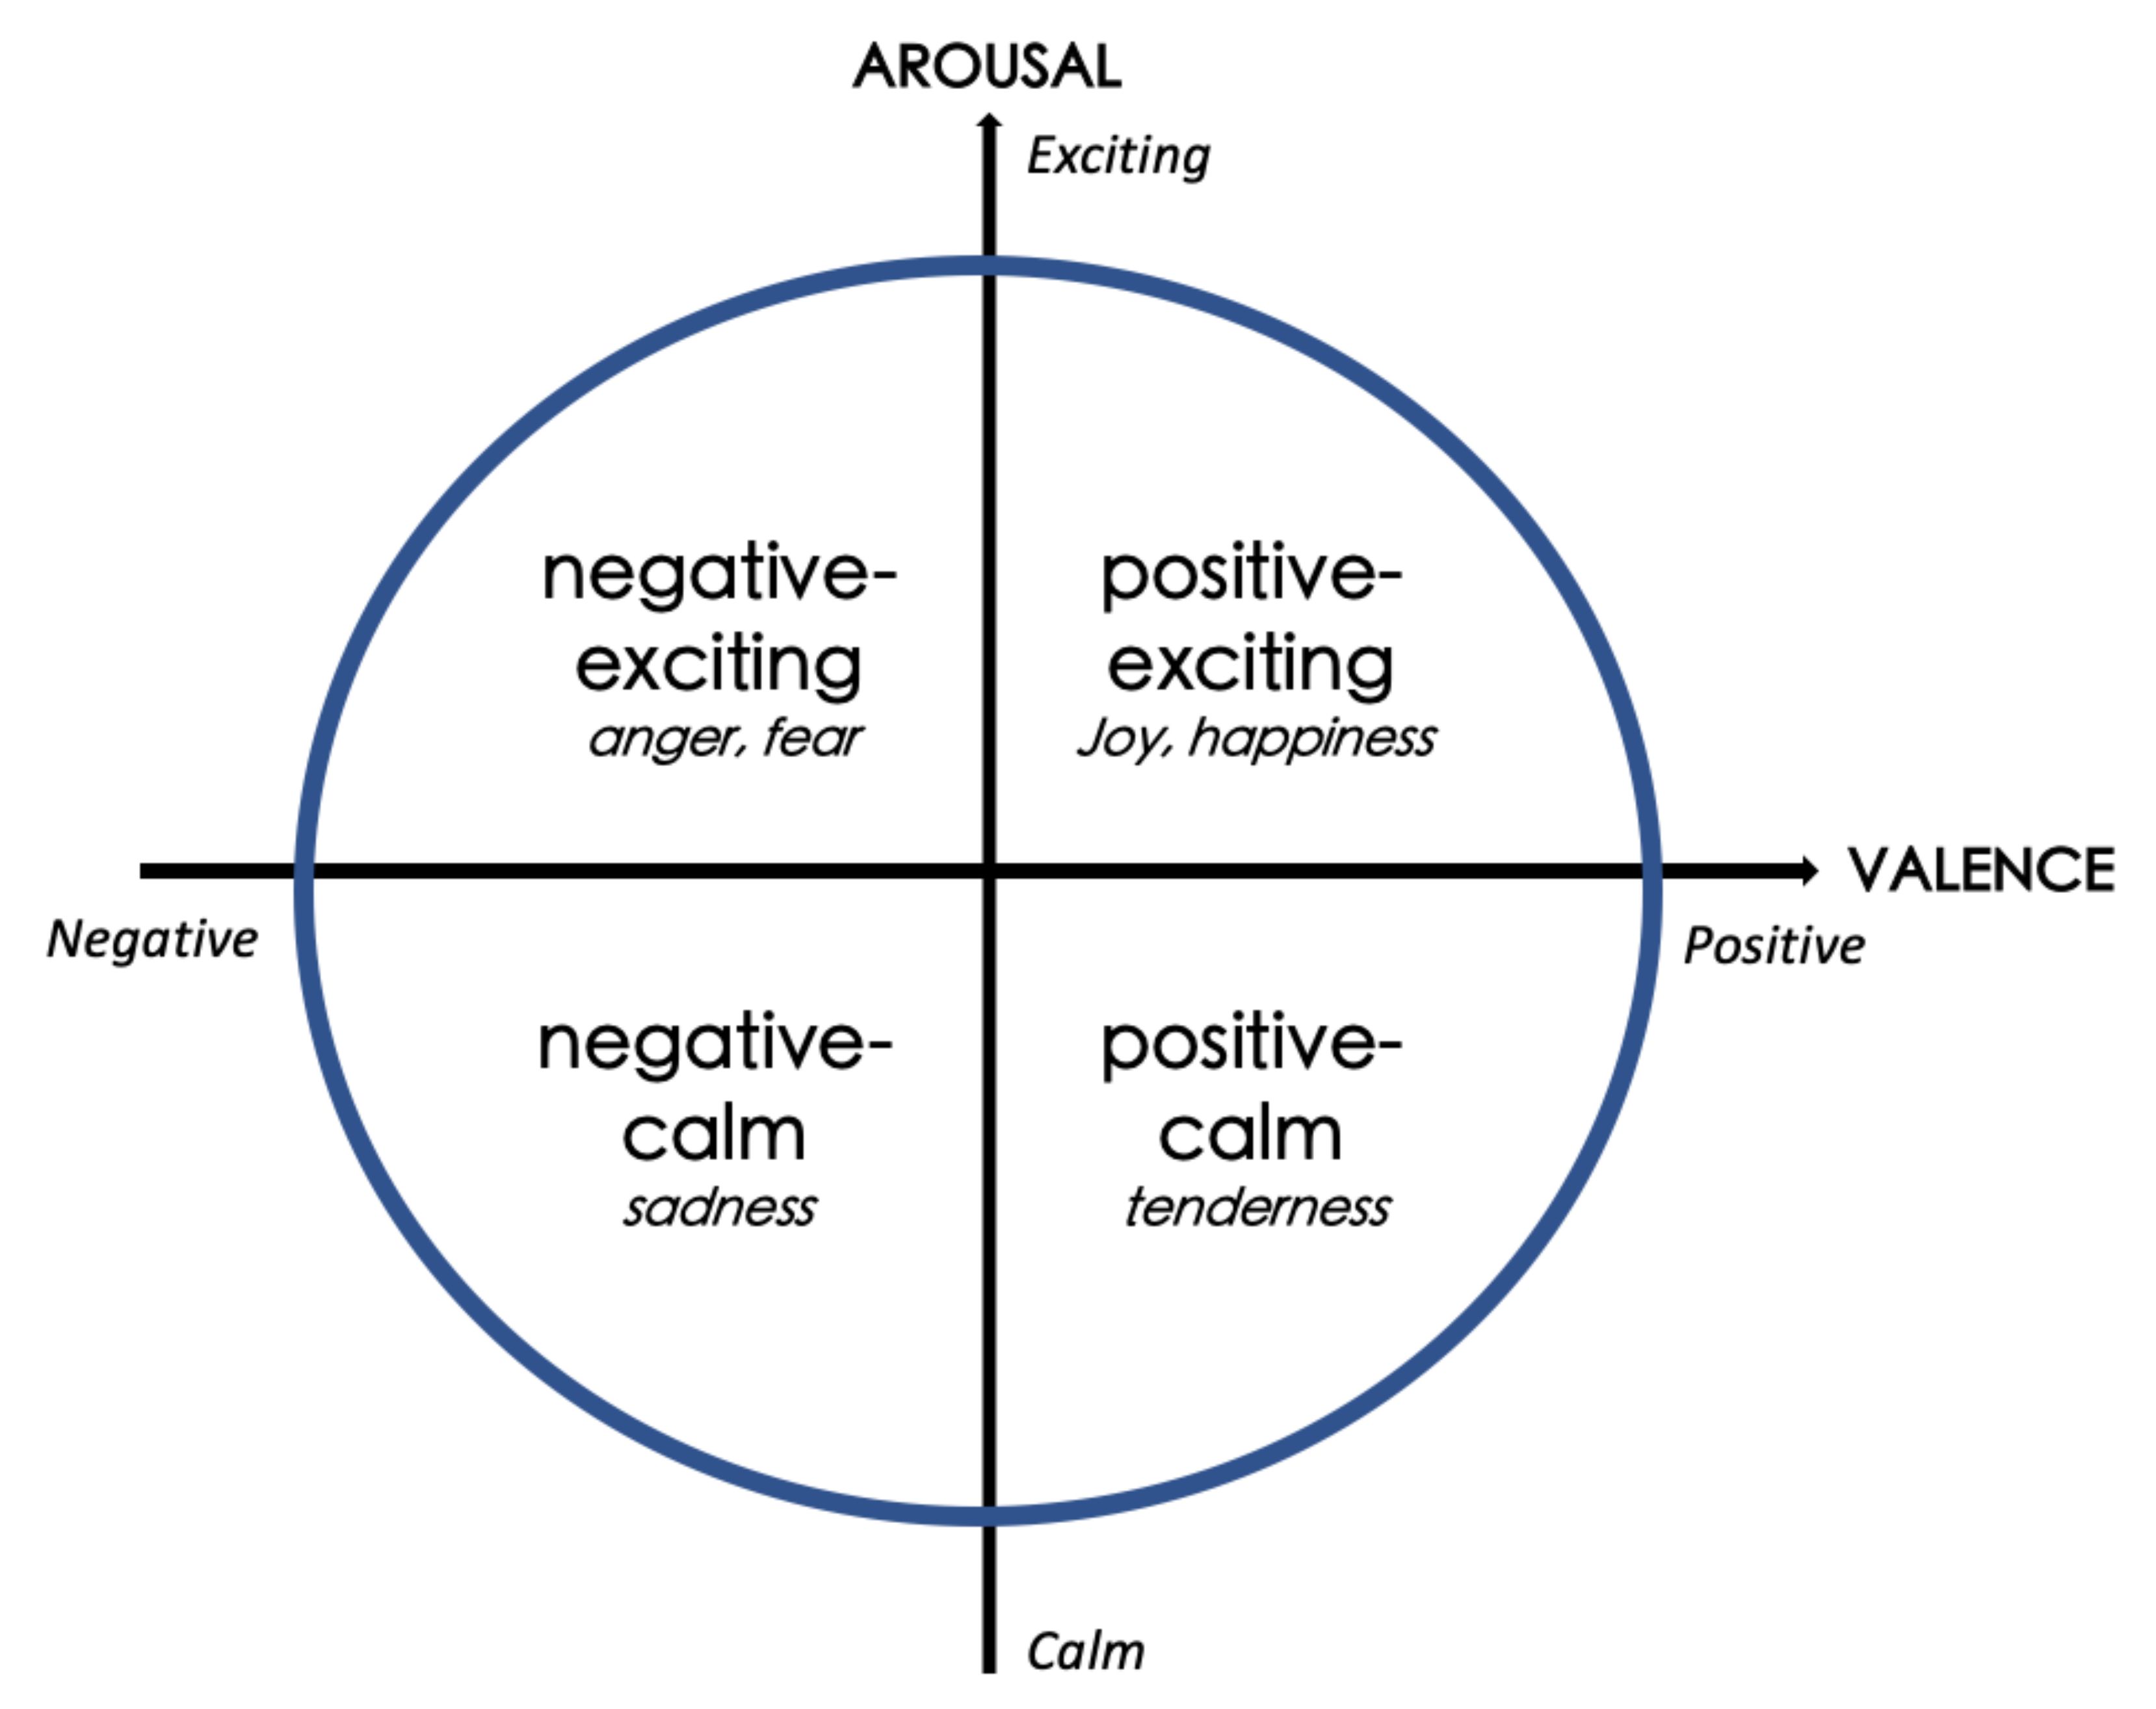
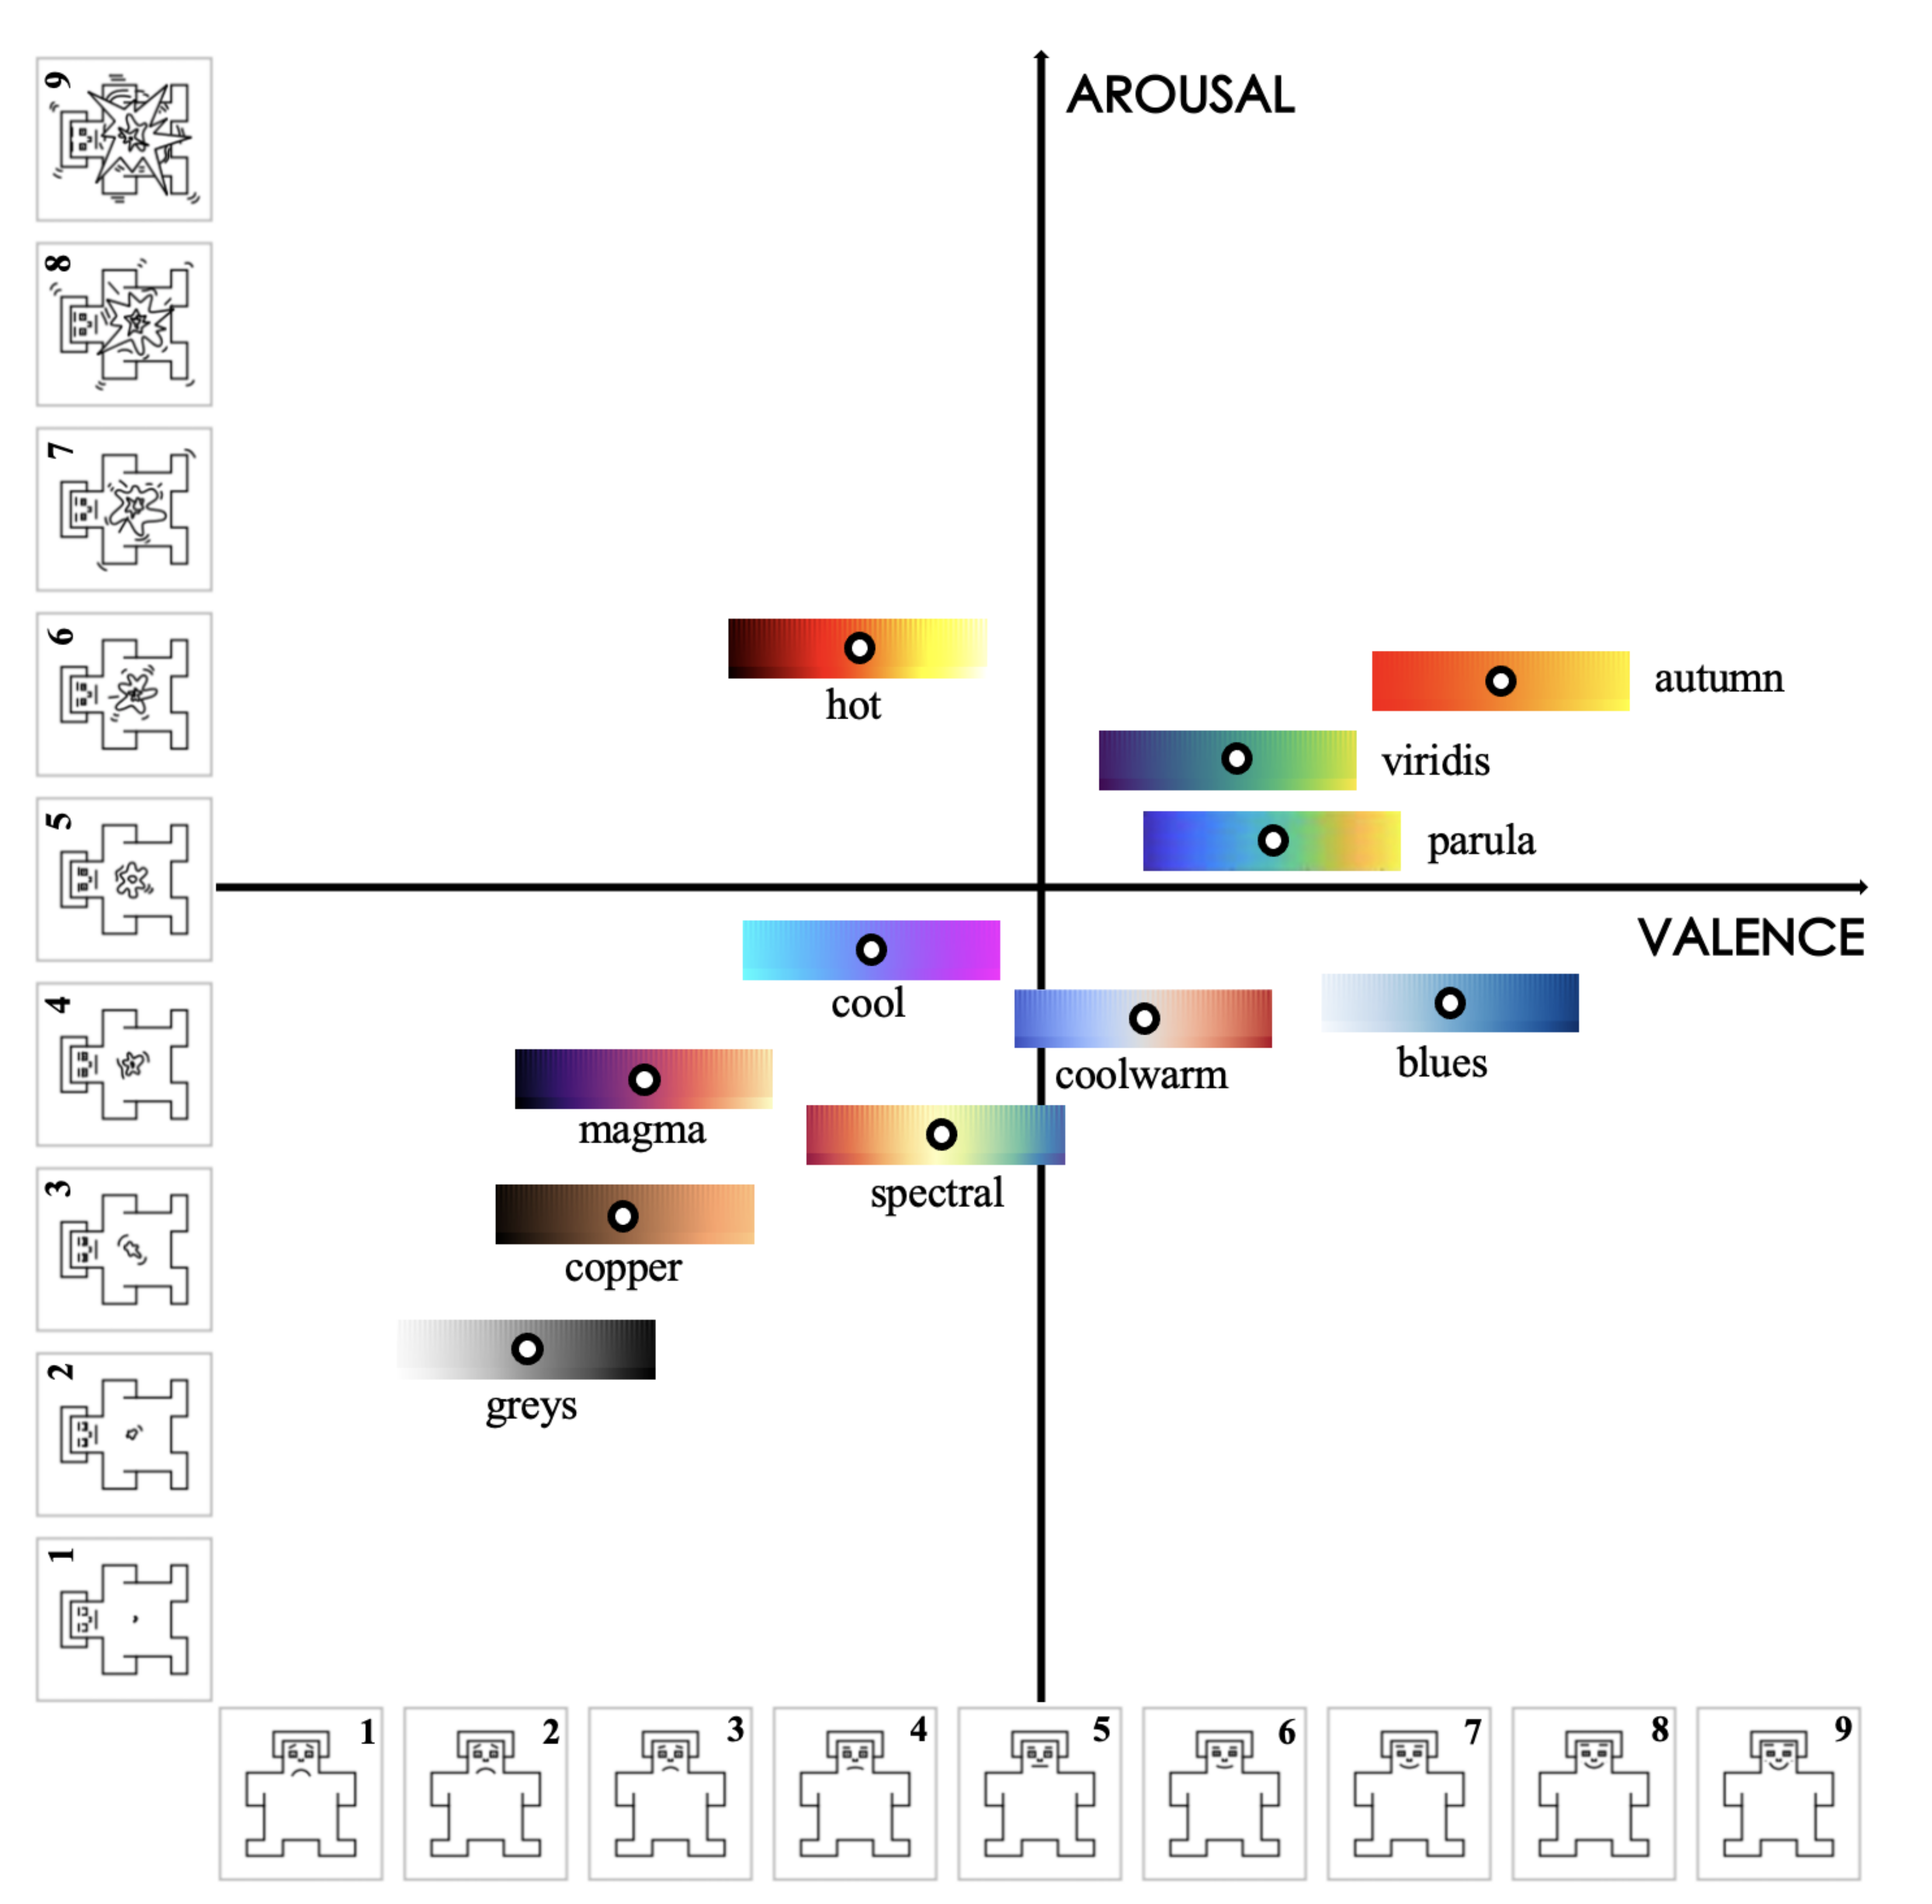
- Combining conventional design study with a crowdsourced study and validating that colormaps triggering affect in the positive–exciting quadrant in the valence–arousal model are able to facilitate more precise visual comprehension in MWT.
- Proposing a synthetic design guideline for relevant researchers and practitioners to select colormaps boosting accurate visual comprehension in the context of MWT.
2. Related Work
2.1. Colormap Design
2.2. Affective Colormap
2.3. Motivation
3. Methodology
3.1. Overview
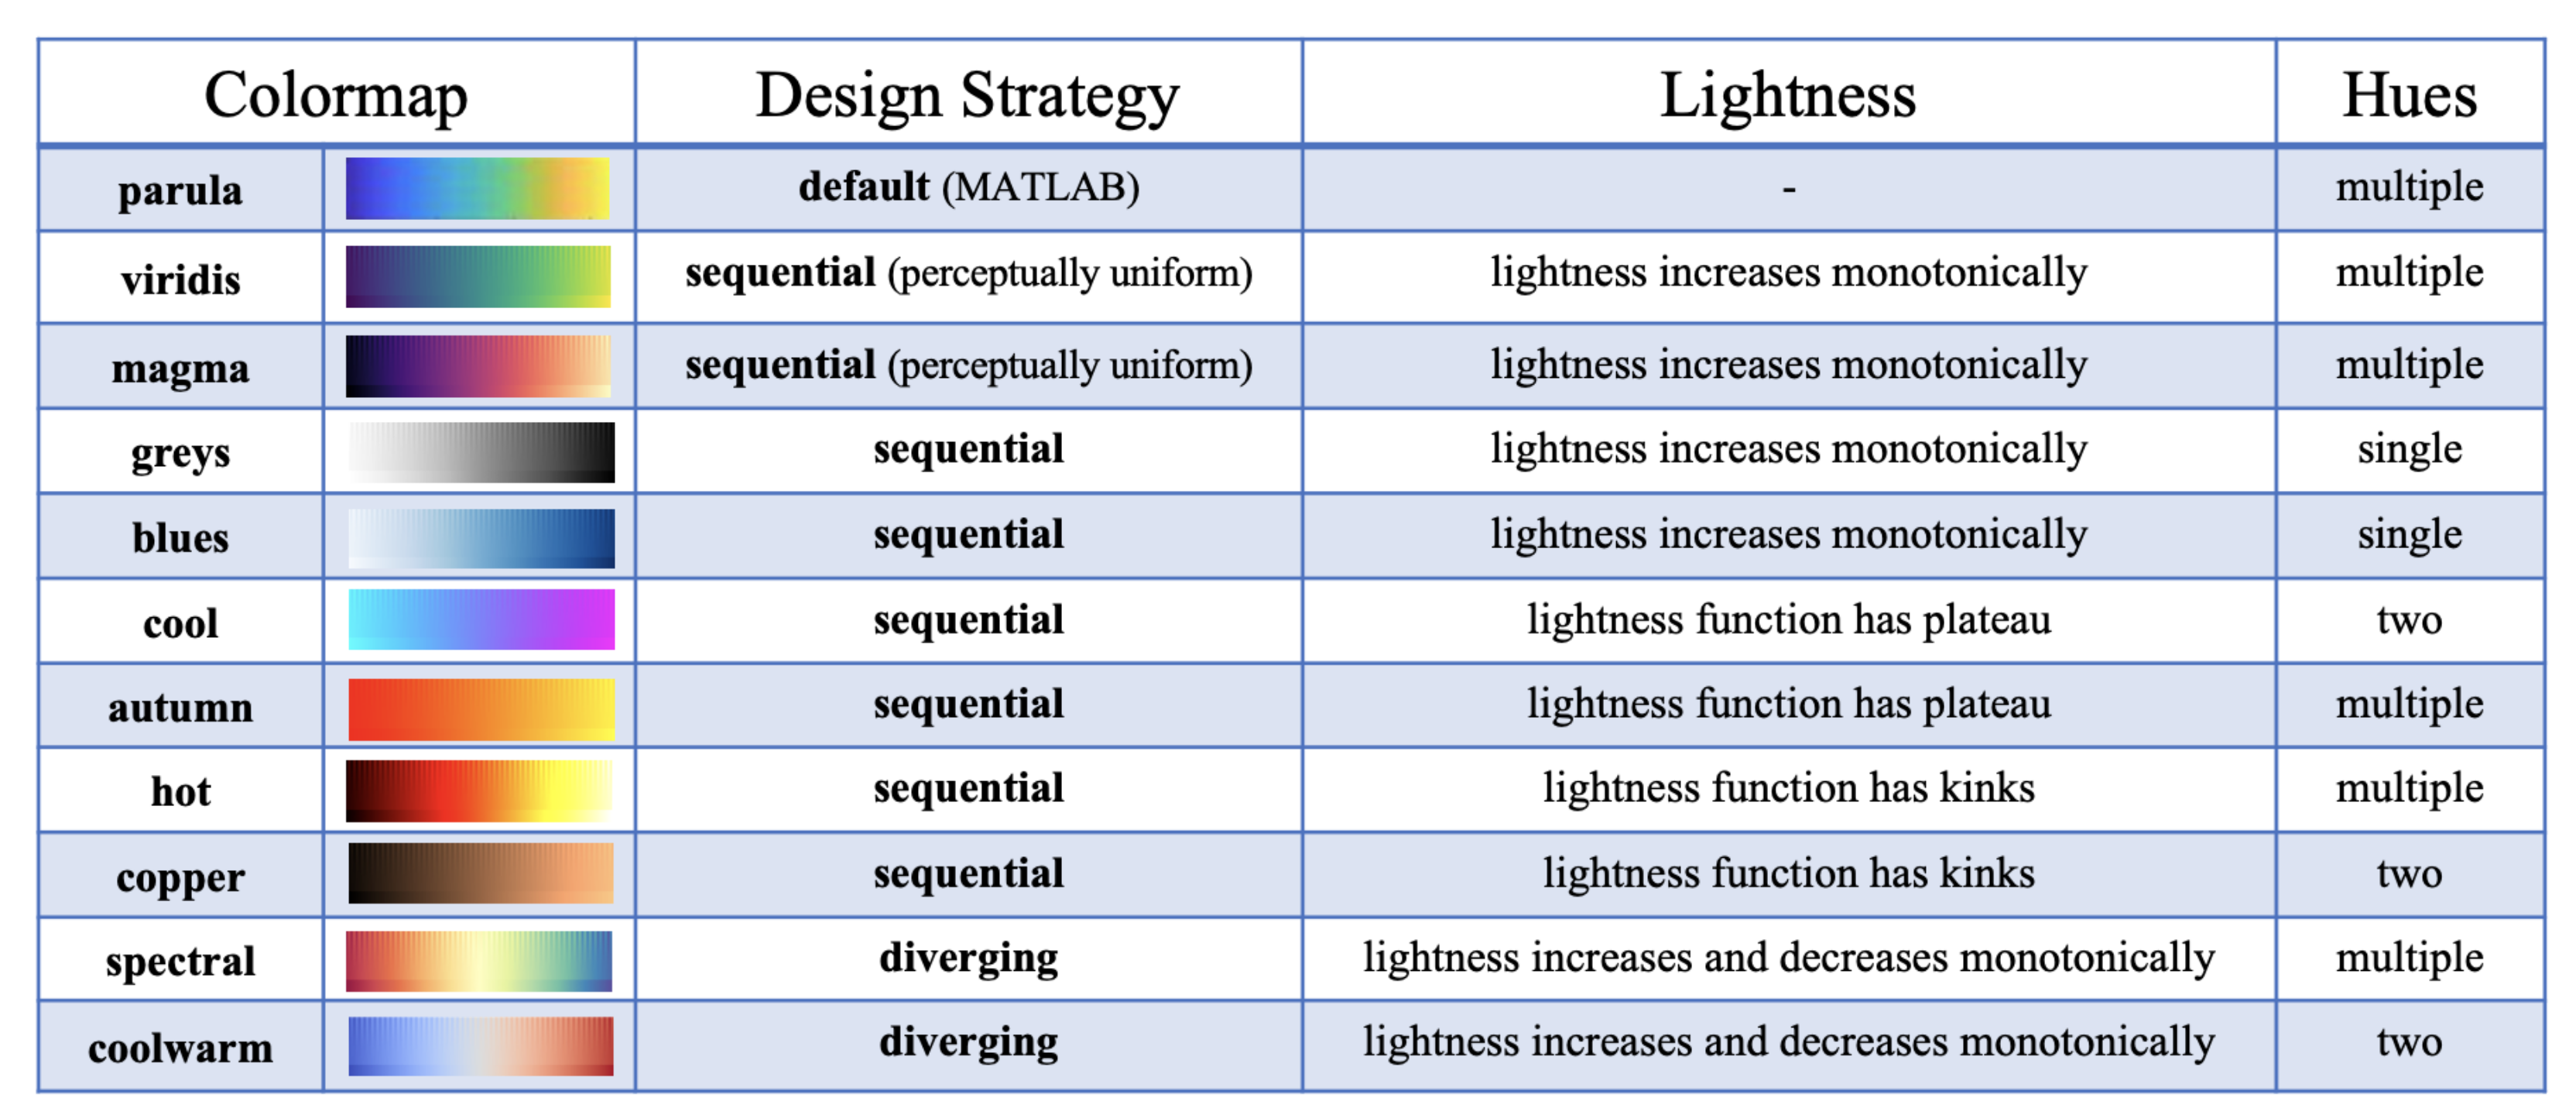
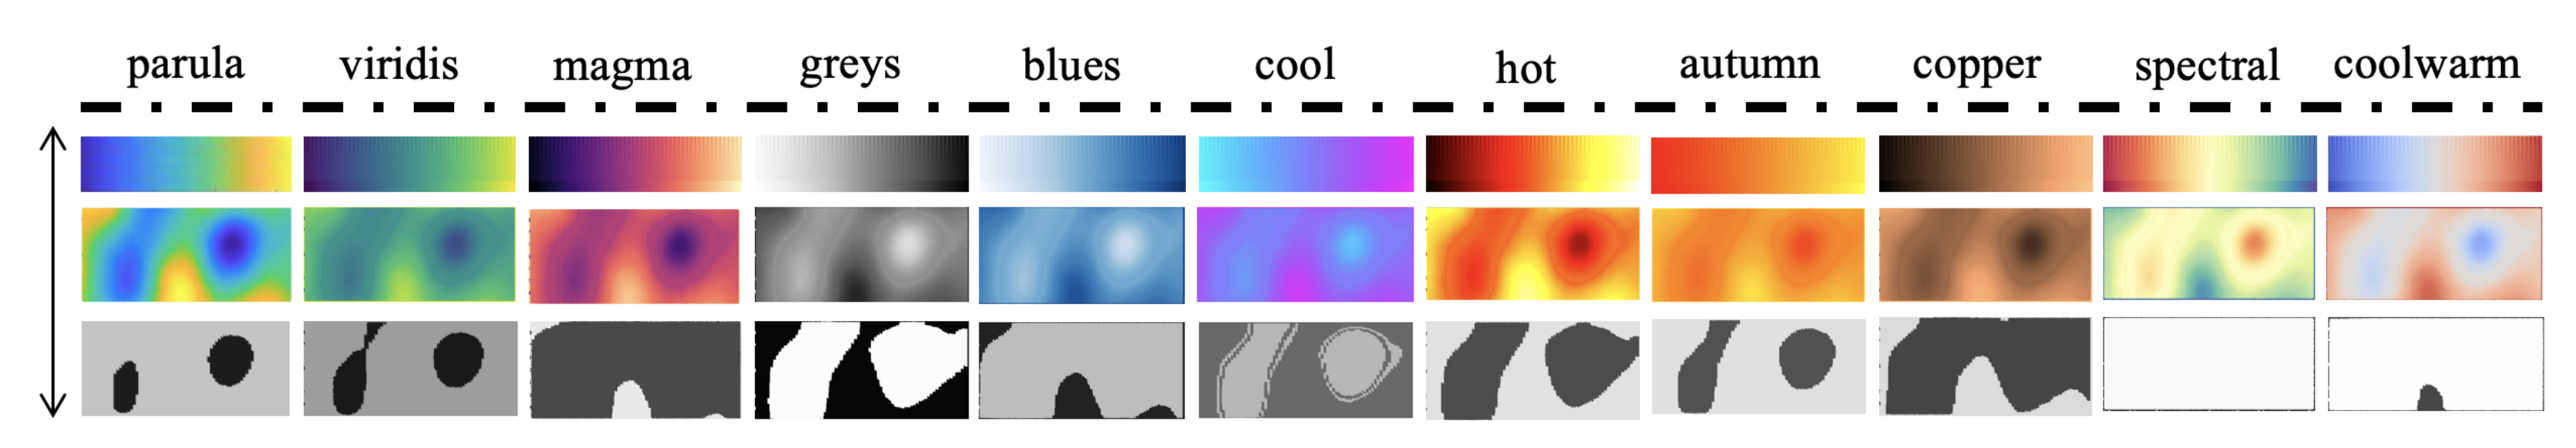
3.2. Colormaps
- –
- Sequential: Change in lightness and often incremental saturation of color, often using a single hue, should be used for representing information that has hierarchy.
- *
- Sequential 1: Perceptually uniform, with each new color equally perceptually distinct from the previous and following colors.
- *
- Sequential 2: Monotonical increase of lightness values.
- *
- Sequential 3: In the lightness function space, there is a plateau, or the function may go both up and down.
- *
- Sequential 4: In the lightness function space, there are some kinks in the function.
- –
- Diverging: Change in lightness and possibly saturation of two different colors that meet in the middle at an unsaturated color; used in information being plotted that has a critical middle value, such as topography or when data deviate around zero.For each colormap, a specific design strategy is elaborated as follows.
- *
- parula: The default colormap in MATLAB.
- *
- *
- *
- *
- *
- cool: Cyan-magenta color map; based on a colormap of the same name in MATLAB [16].
- *
- autumn: Sequential increasing shades of red-orange-yellow [7].
- *
- hot: Sequential black-red-yellow-white, to emulate blackbody radiation from an object at increasing temperatures [7].
- *
- copper: Sequential increasing shades of black-copper [25].
- *
- spectral: Diverging, multi-hue encompassing a subset of the rainbow with a yellow middle [19].
- *
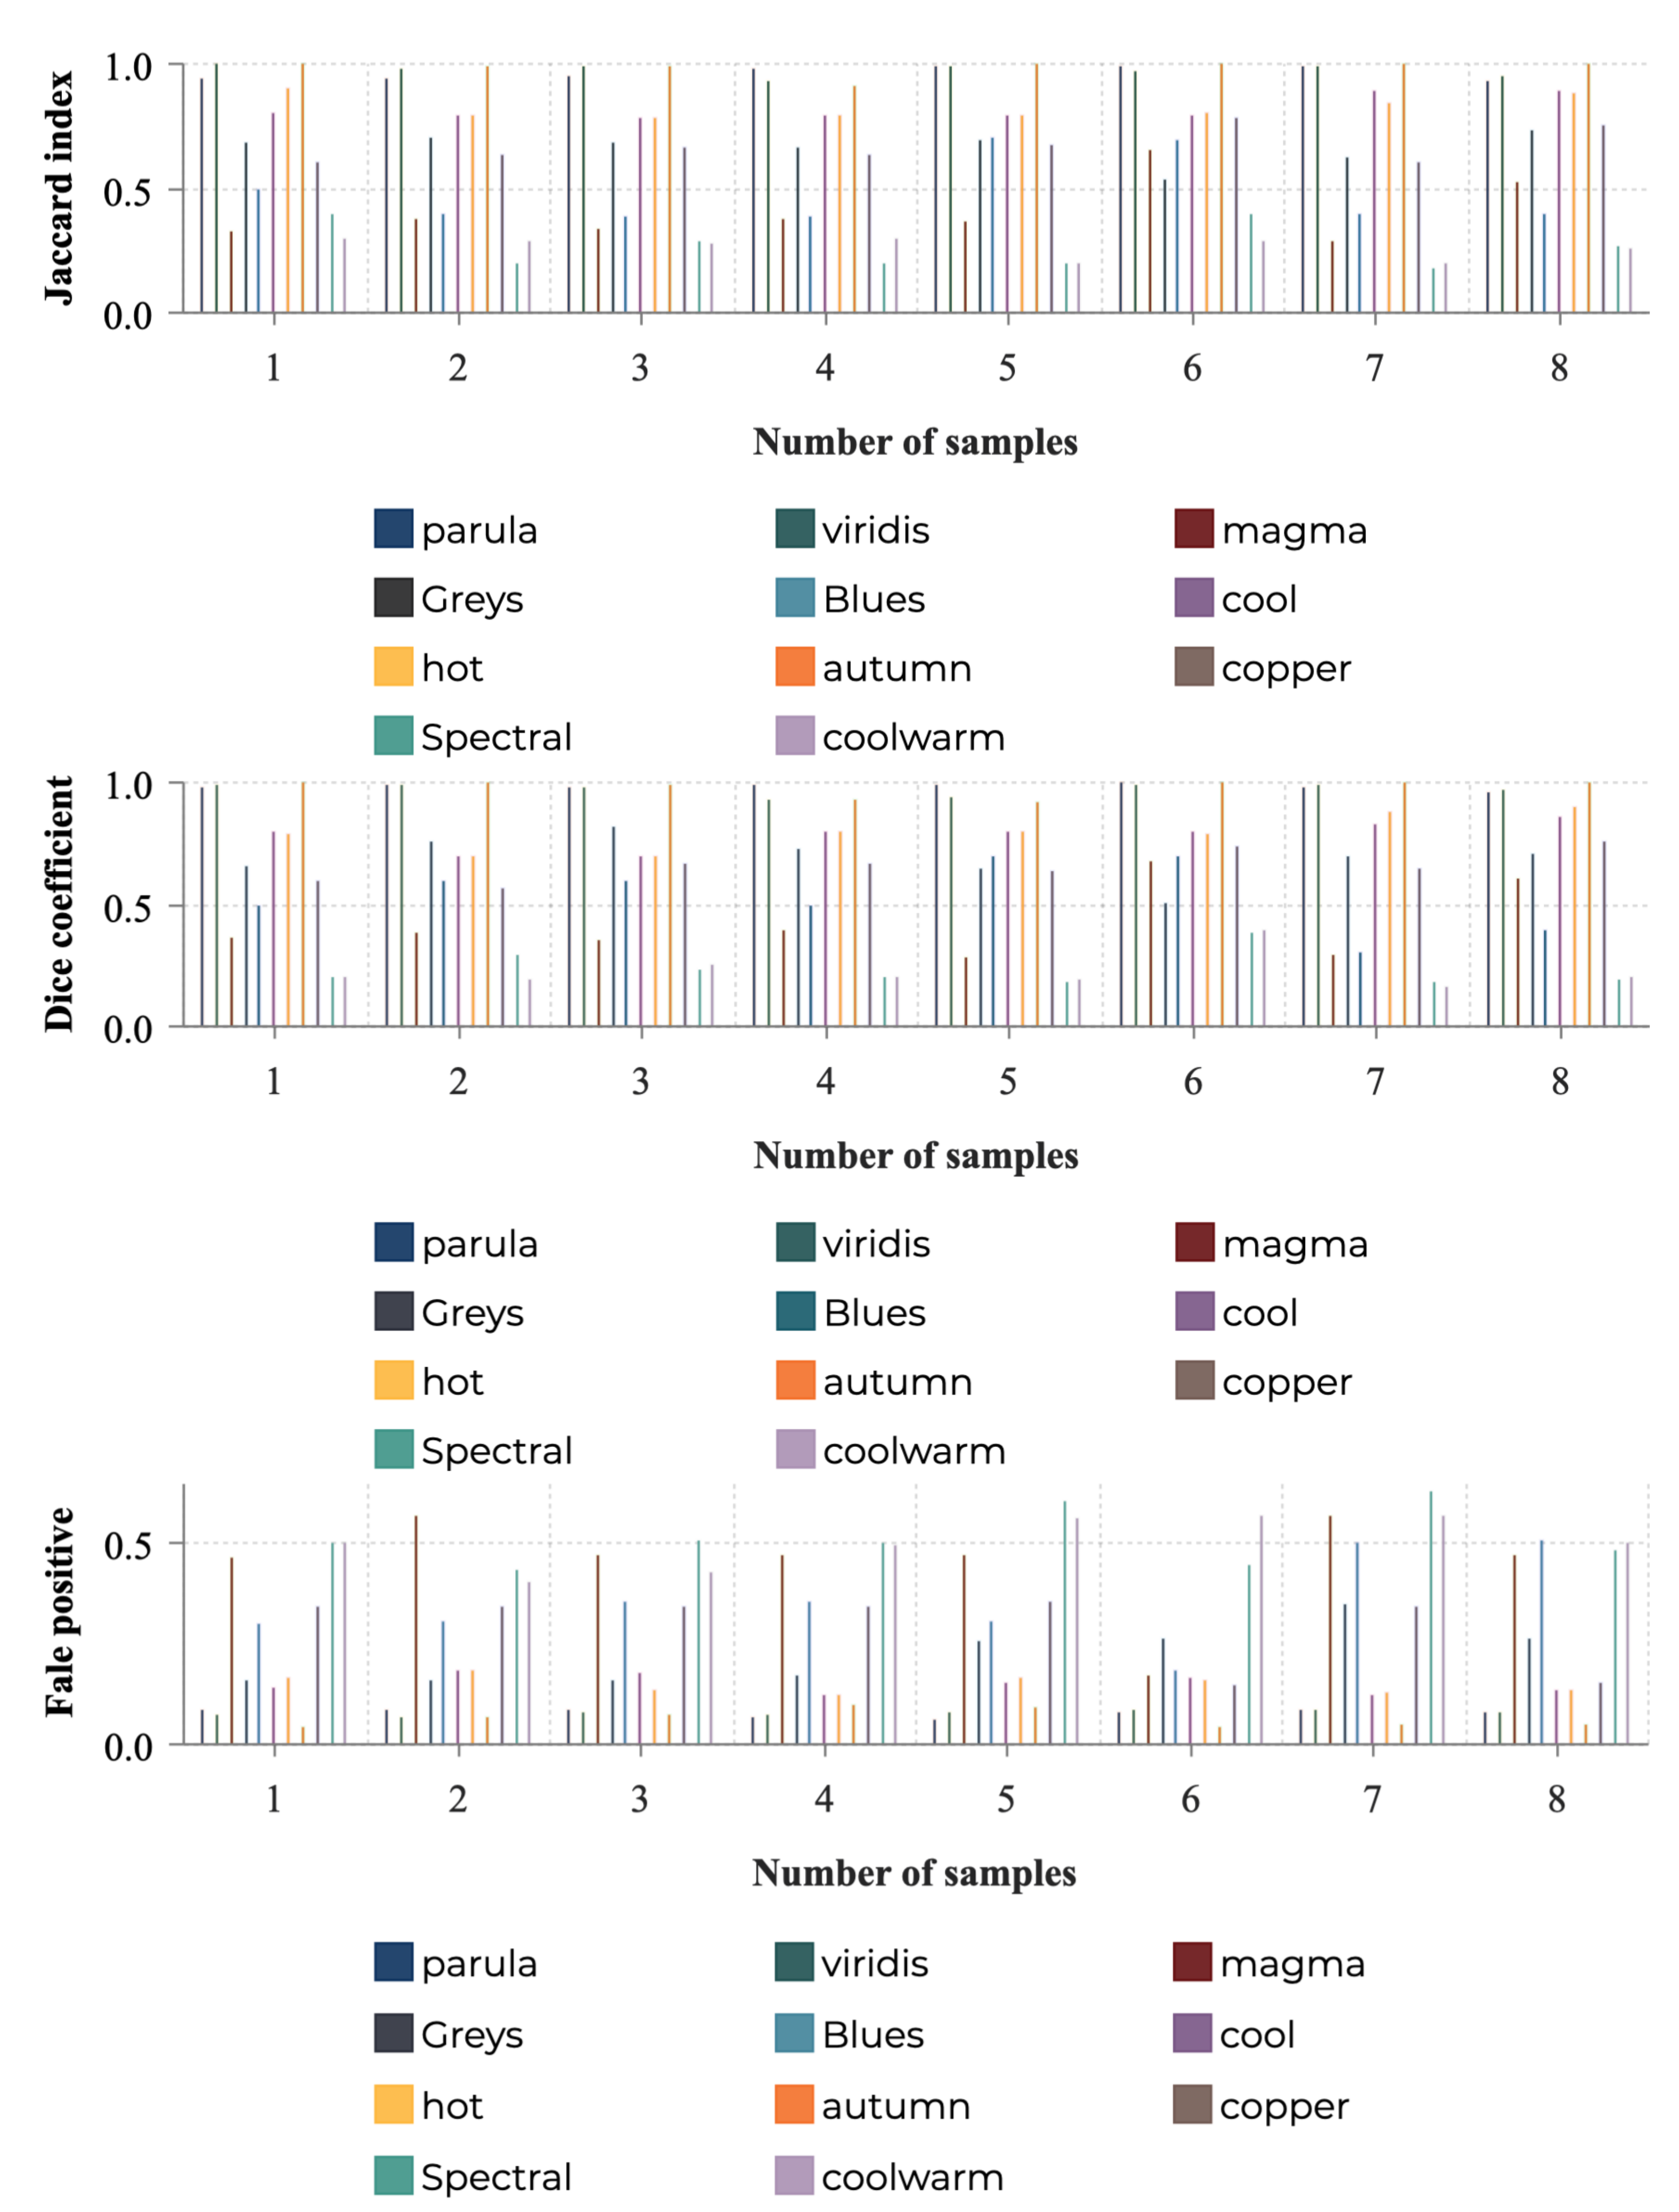
3.3. Quantitative Evaluation for Colormaps
- Jaccard index: The metric is used to characterize the similarity and diversity sample sets. Here, it displays the pixel-level similarity of the original and the segmented MWT images.
- Dice coefficient: This is another measure to obtain the similarity between two samples. It differentiates from Jaccard index in that it only calculates true positives once.
- False positive: This index is the proportion between the number of negative objects falsely classified as positive and the total number of negative objects. Lower value corresponds to higher accuracy.
4. Crowdsourced User Study
4.1. Experimental Design
4.2. Participants
4.3. Procedure: Parts I and II
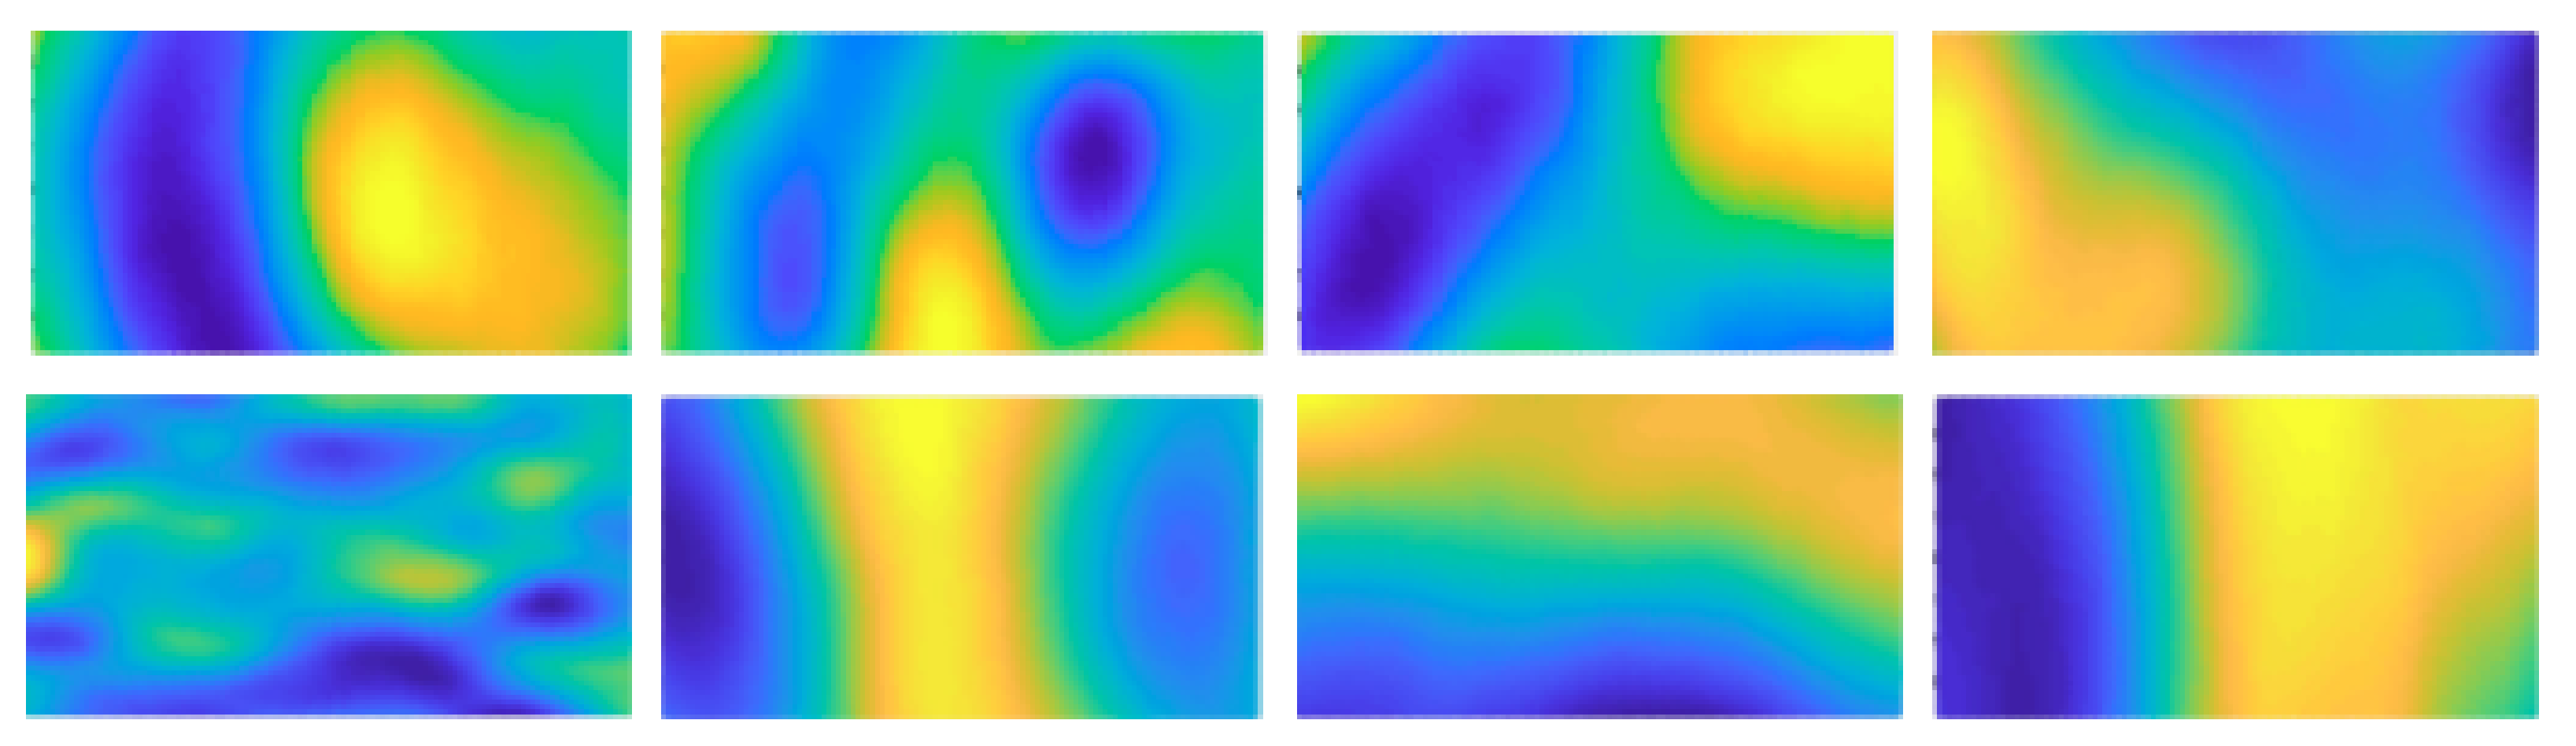
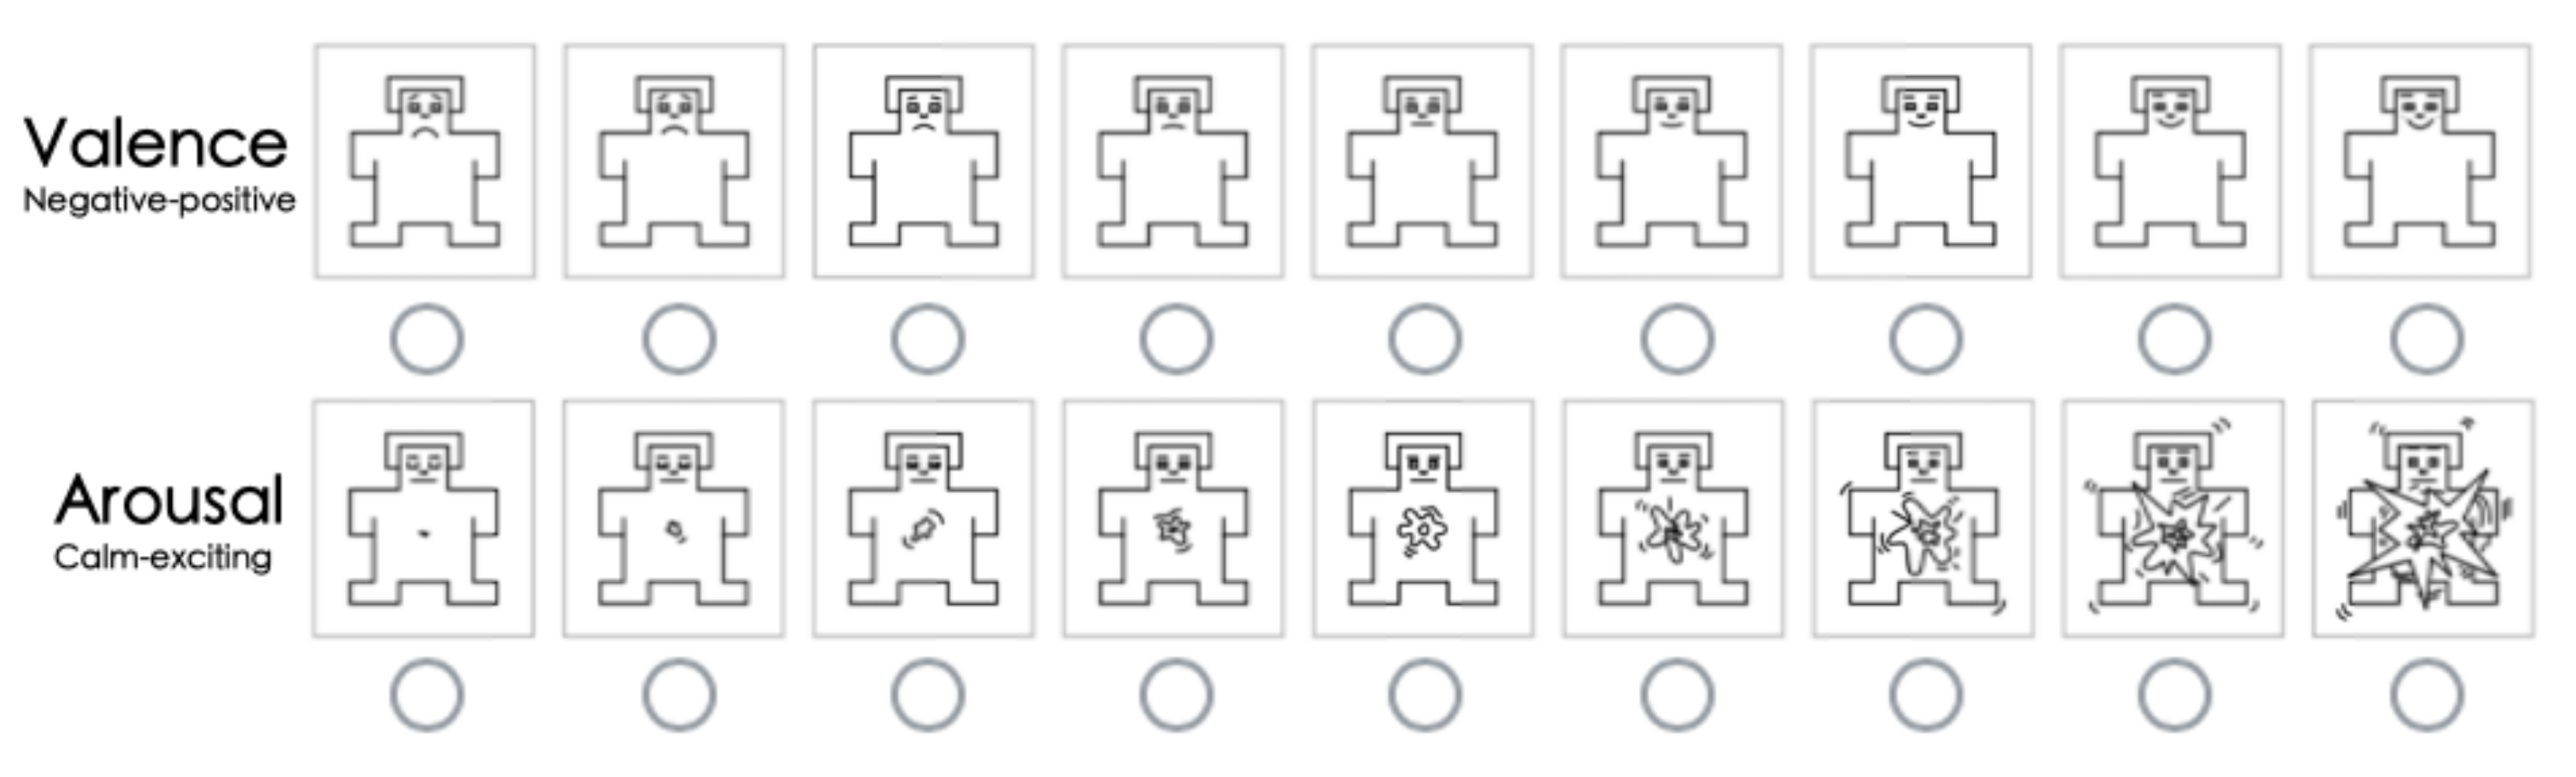
- Part I: Participants were requested to assess their emotional responses towards the 11 colormaps, with each colormap presented in eight images derived from the original eight MWT images shown in Figure 1. We adopted the 9-point (1 to 9) Self-Assessment-Manikin (SAM) scales developed by Lang [32] to encode the affective responses of each participant. The SAM model has successfully proved its efficacy in emotional analysis [33,34,35]. To better concretize the tiers of the affect, we used 9-point SAM scales (Figure 6) for the measurement instead of invoking 5-point and 7-point scales [13]. The manikins represented different emotions as well as recording the corresponding points. In our 9-point scaling structure, participants could choose from 1 to 9 by assessing their own affect, where the point 5 was annotated as a watershed to encode affective neutrality. In the valence dimension, participants indicated their responses from negative to positive as they reacted from calm to exciting in the arousal dimension. The order of the 11 colormaps displayed in this study was randomized. Totally, 11 trials on affective assessment were conducted by each participant.
- Part II: 11 paired images were prepared, with each pair consisting of one MWT image presented in a certain colormap and one segmented image derived from the corresponding MWT image. The automatic MWTS-KM method was used for implementing each segmentation task. Likewise, the presentation order of each pair of images as well as the colormaps, were randomized to avoid order effects and enhance the convincibility. There were both accurate and inaccurate segmentation results included over these colormaps. Participants were guided to conduct the rating by comparing the segmentation results of each colormap with the foremost ground-truth–the desired low moisture areas which are the blue parts on the MWT images in parula colormap. Hence, in this part, participants performed the perceptual estimation task by rating the segmentation accuracy to evaluate the 11 test colormaps. Each of them followed the Likert scale [36] from 1 to 5 (very low accuracy to very high accuracy) for quantifying the rated accuracy. Throughout this procedure, participants were able to evaluate those colormaps based on their own visual comprehension. Similarly, an overall of 11 ratings were accomplished by each participant in this part.
5. Experimental Results
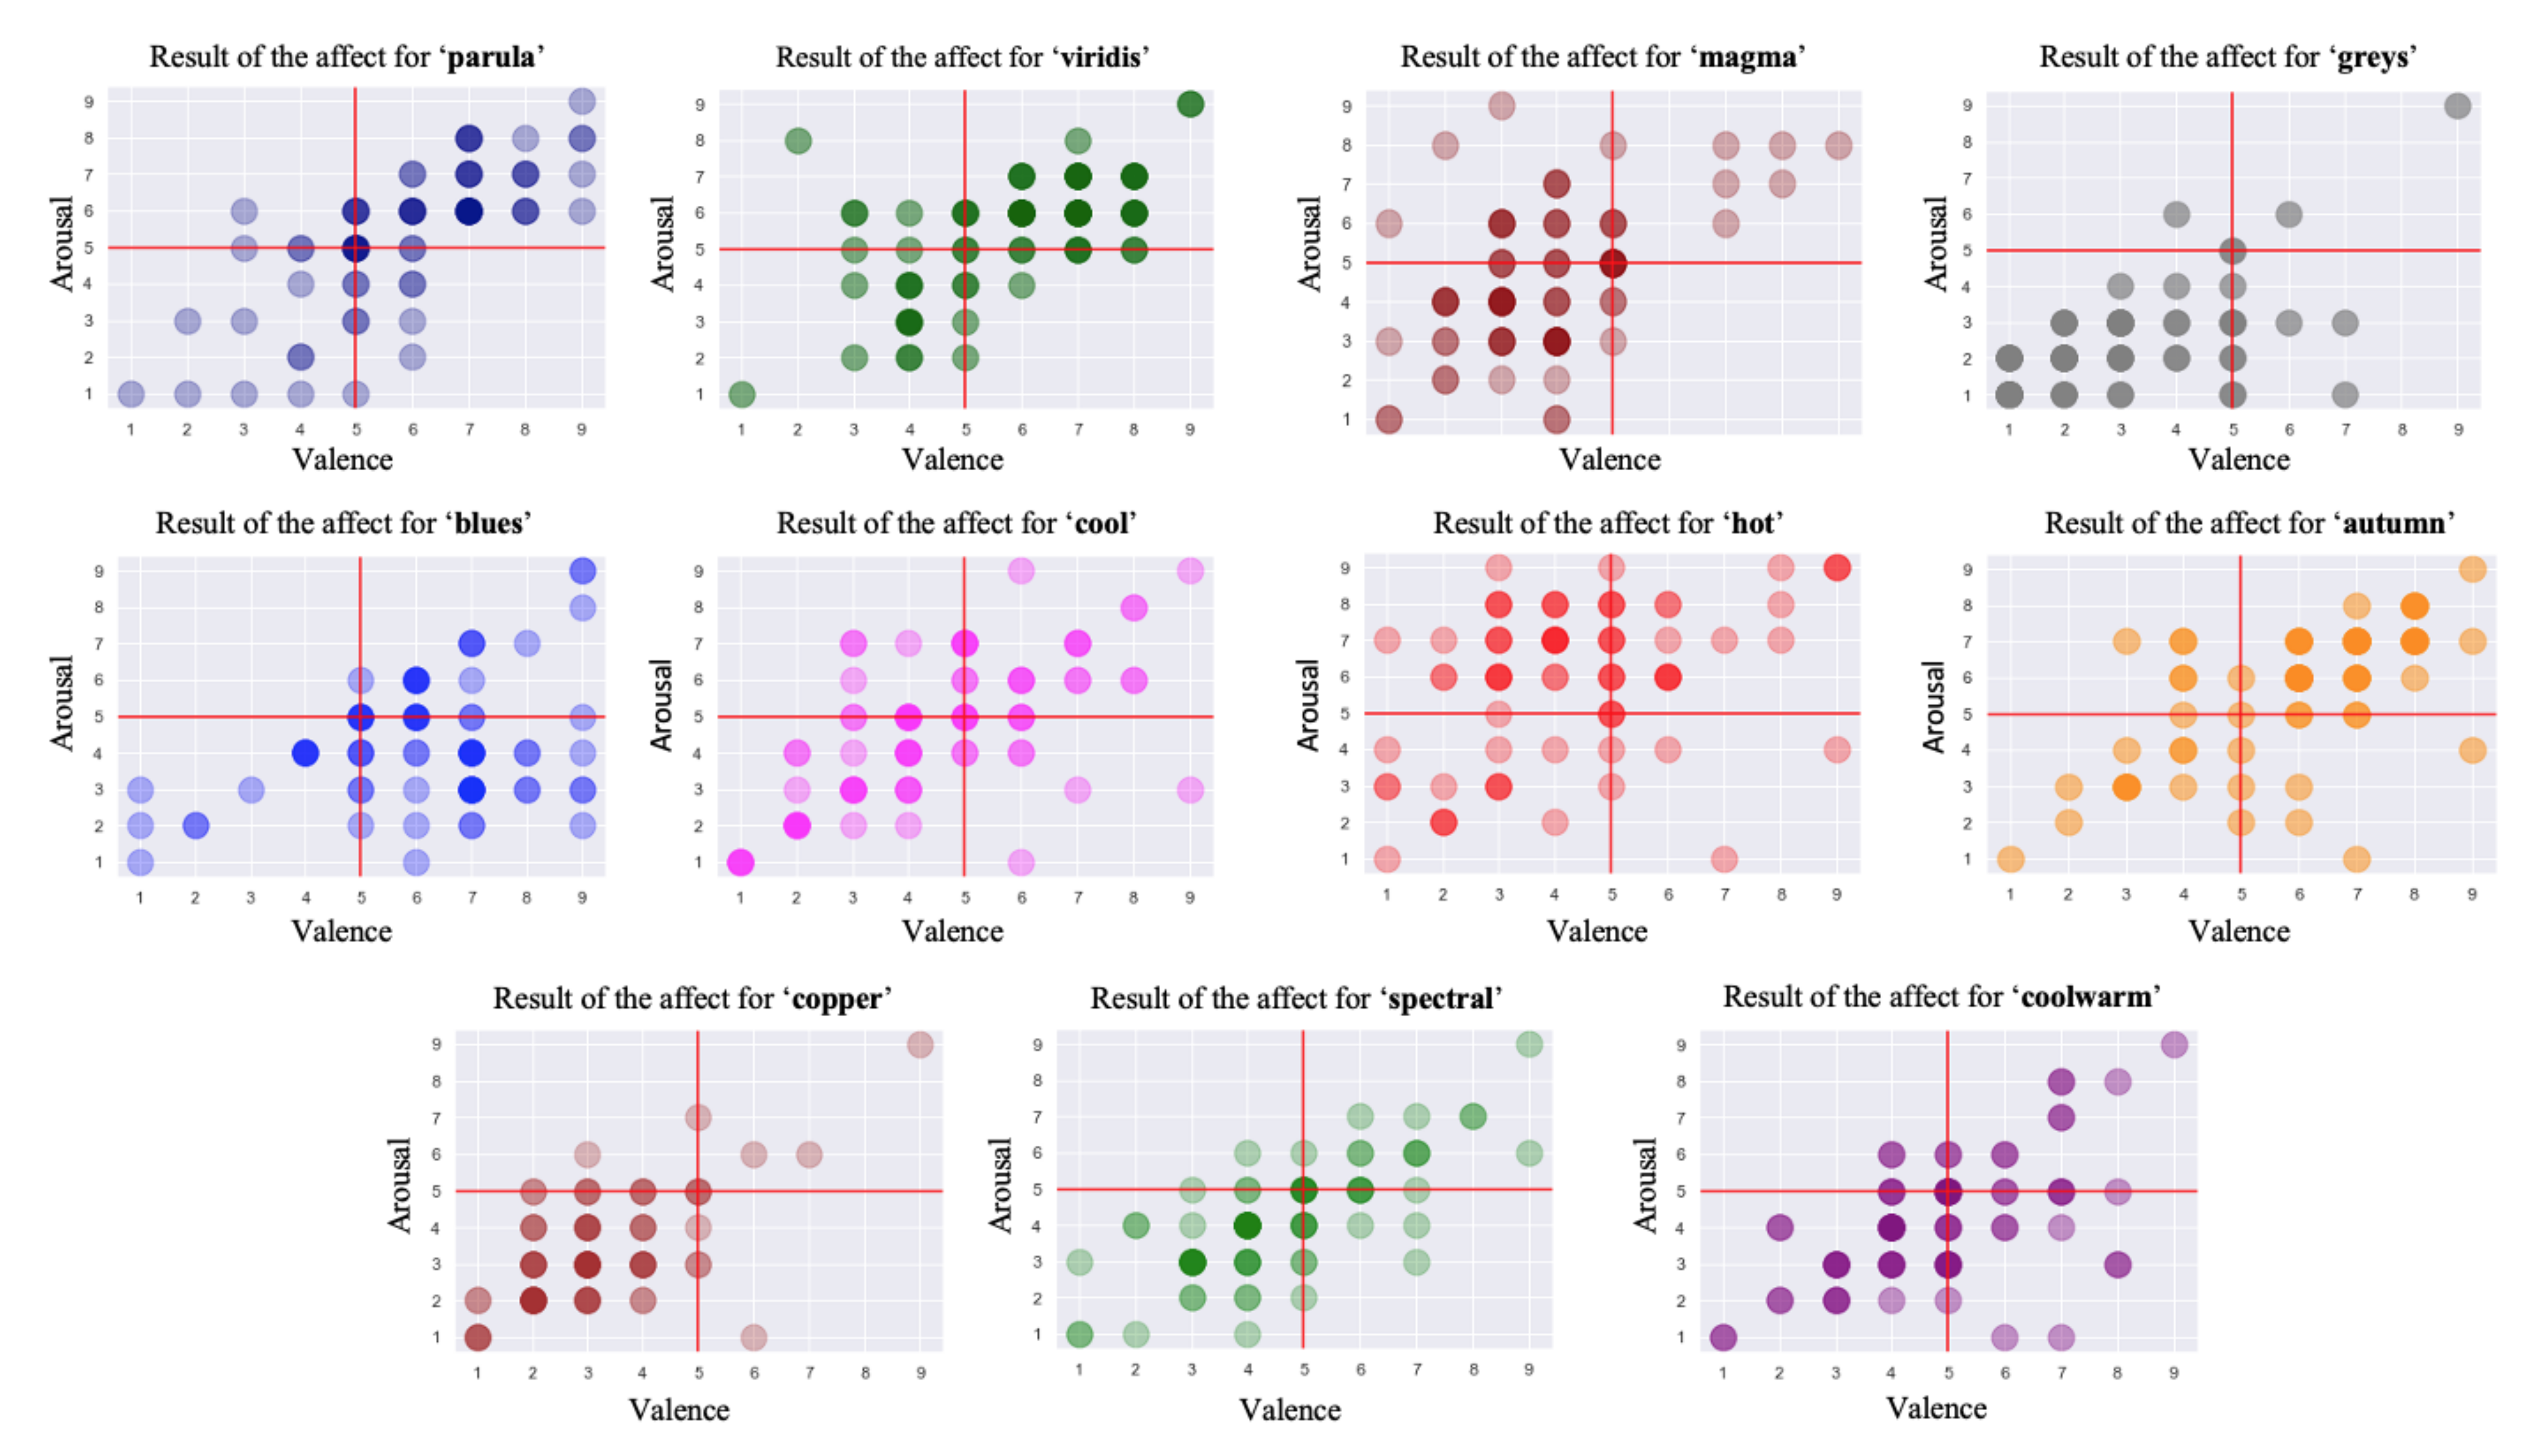
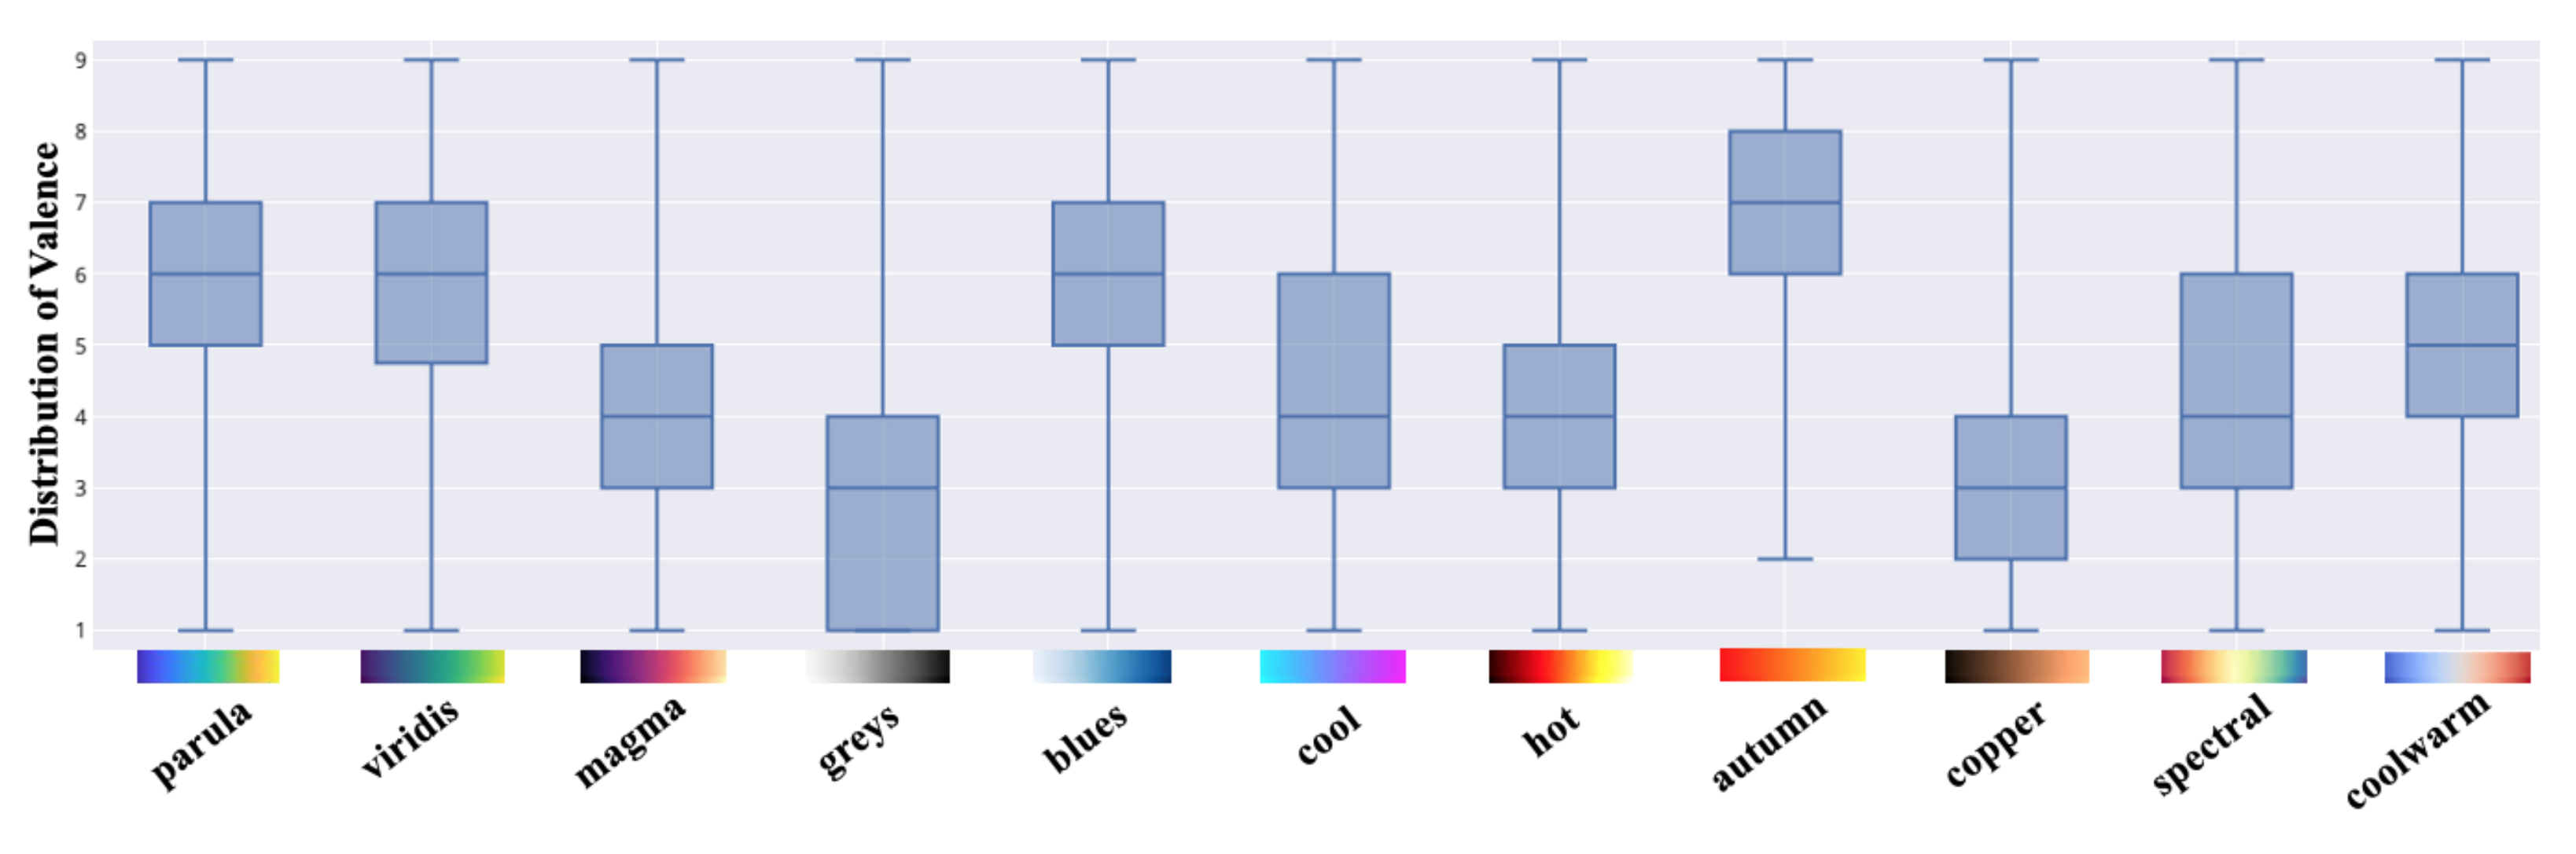
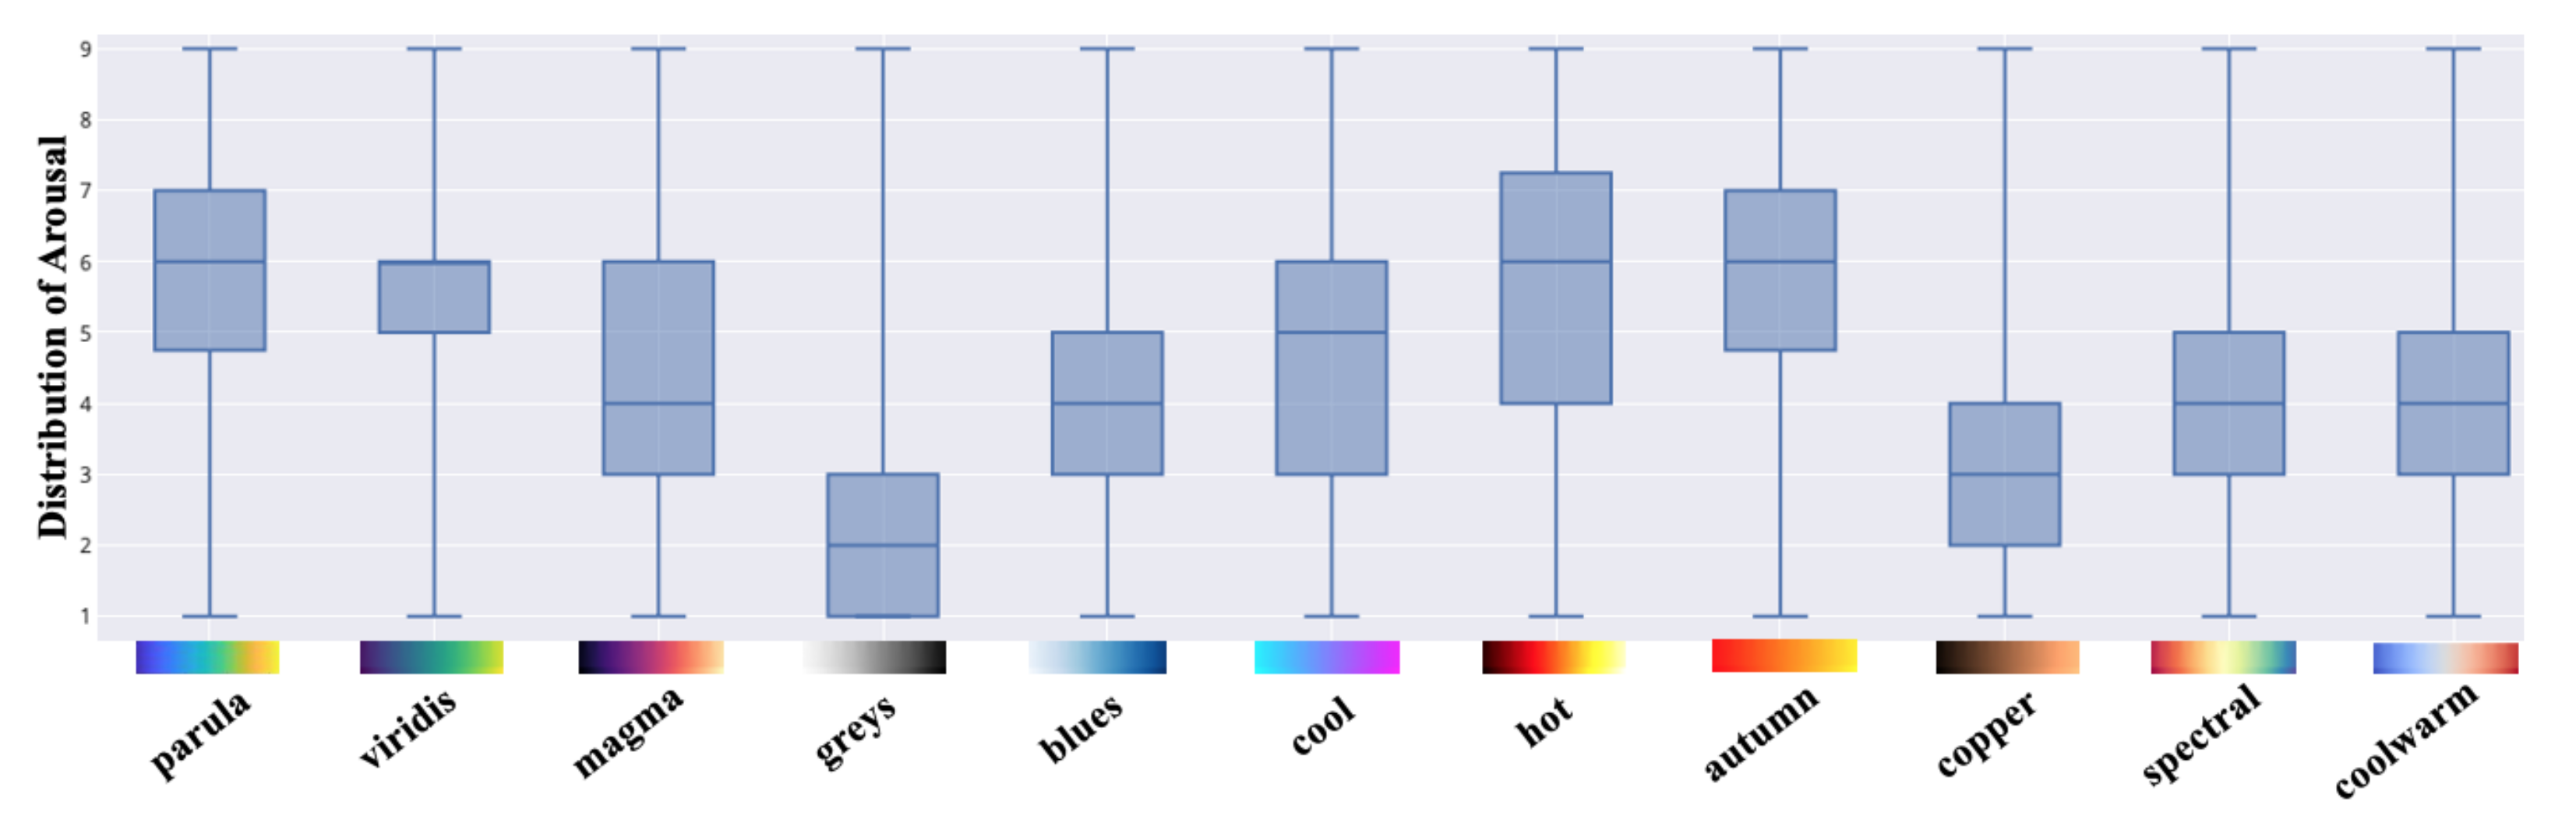
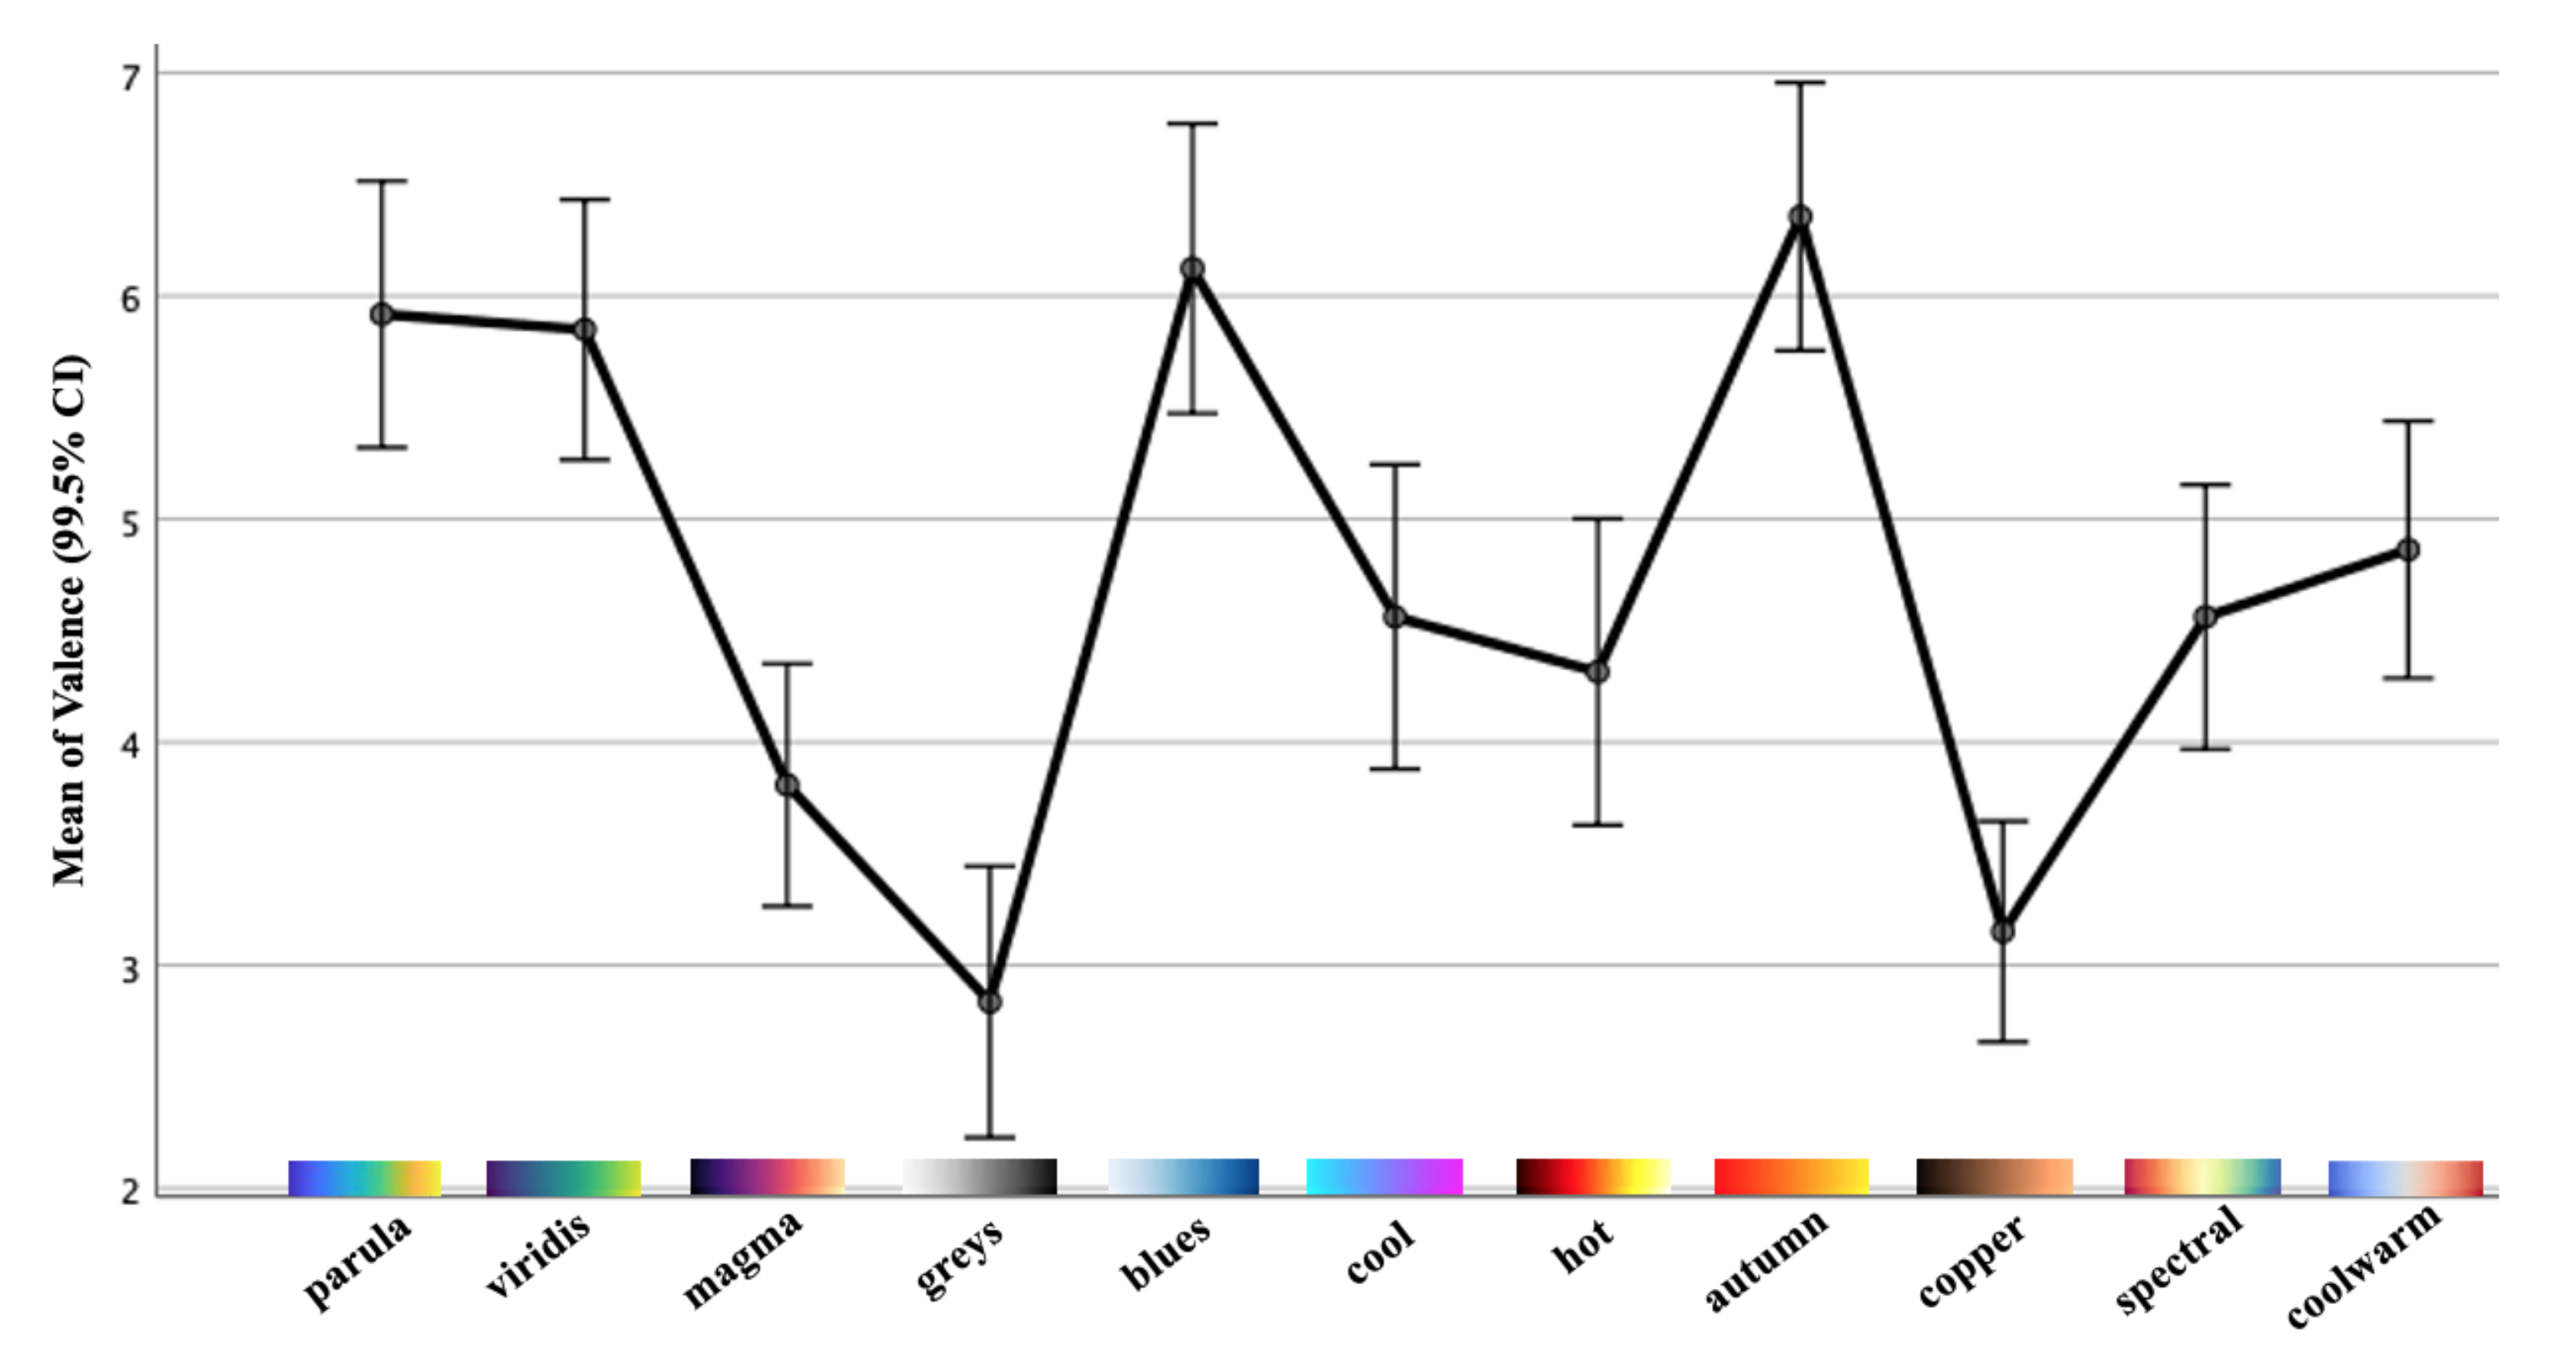
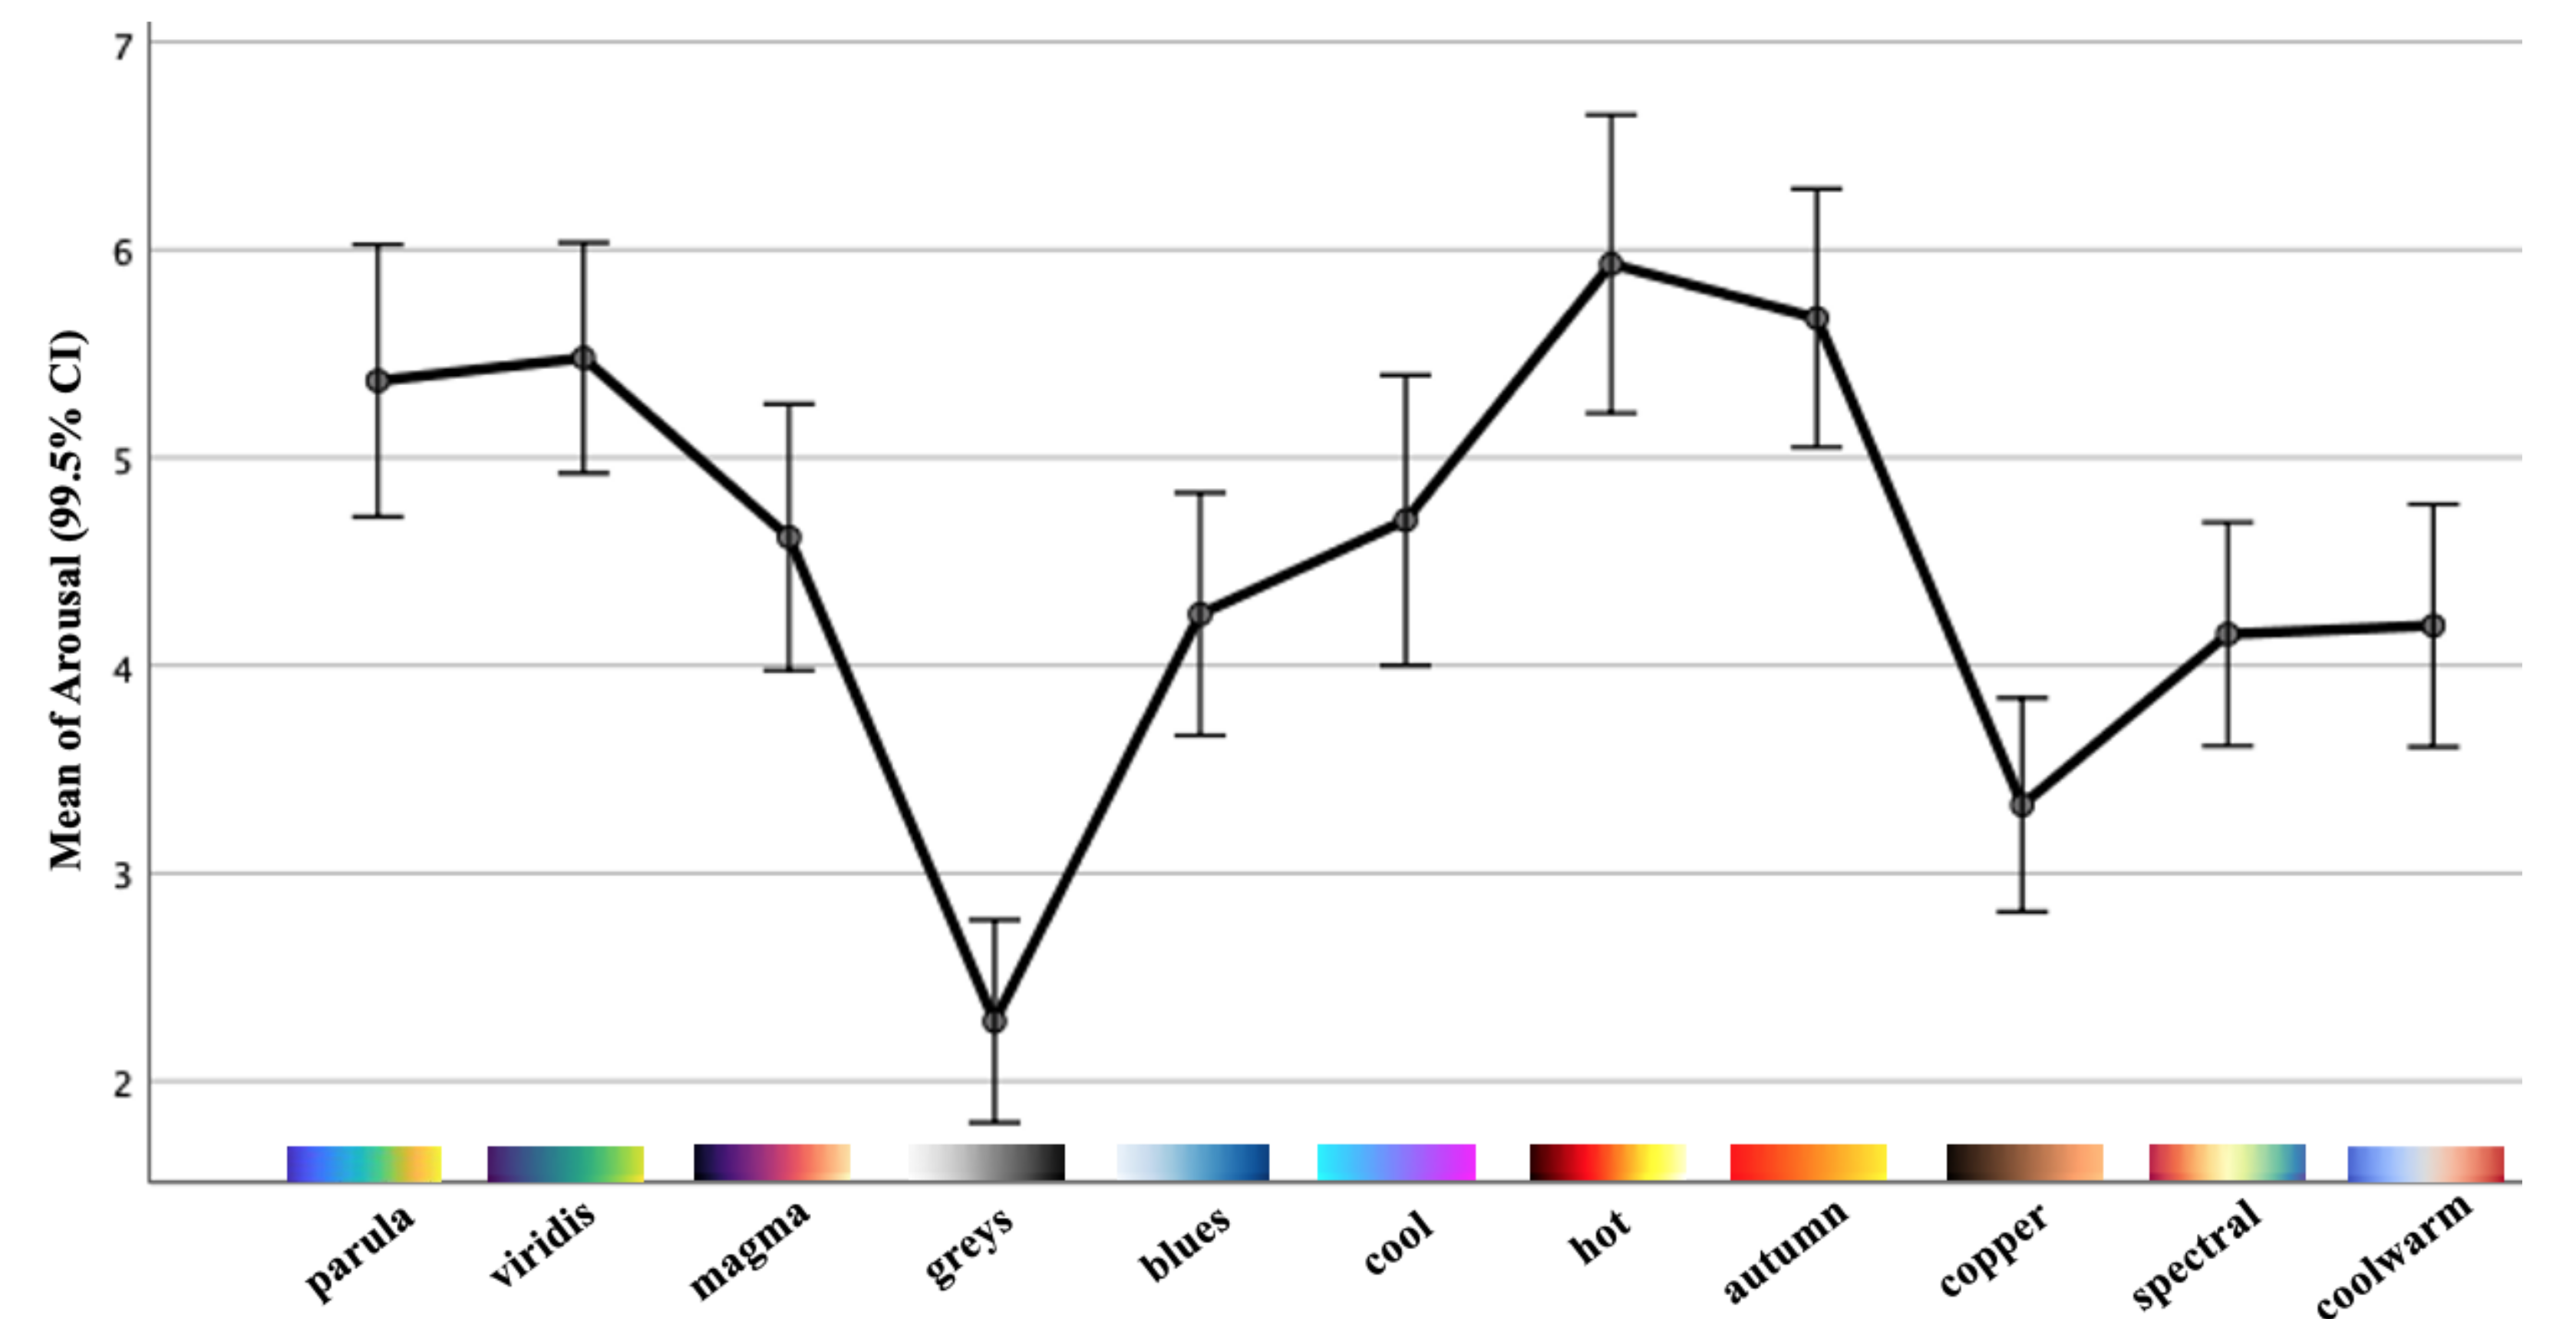
5.1. Part I: Results and Analysis
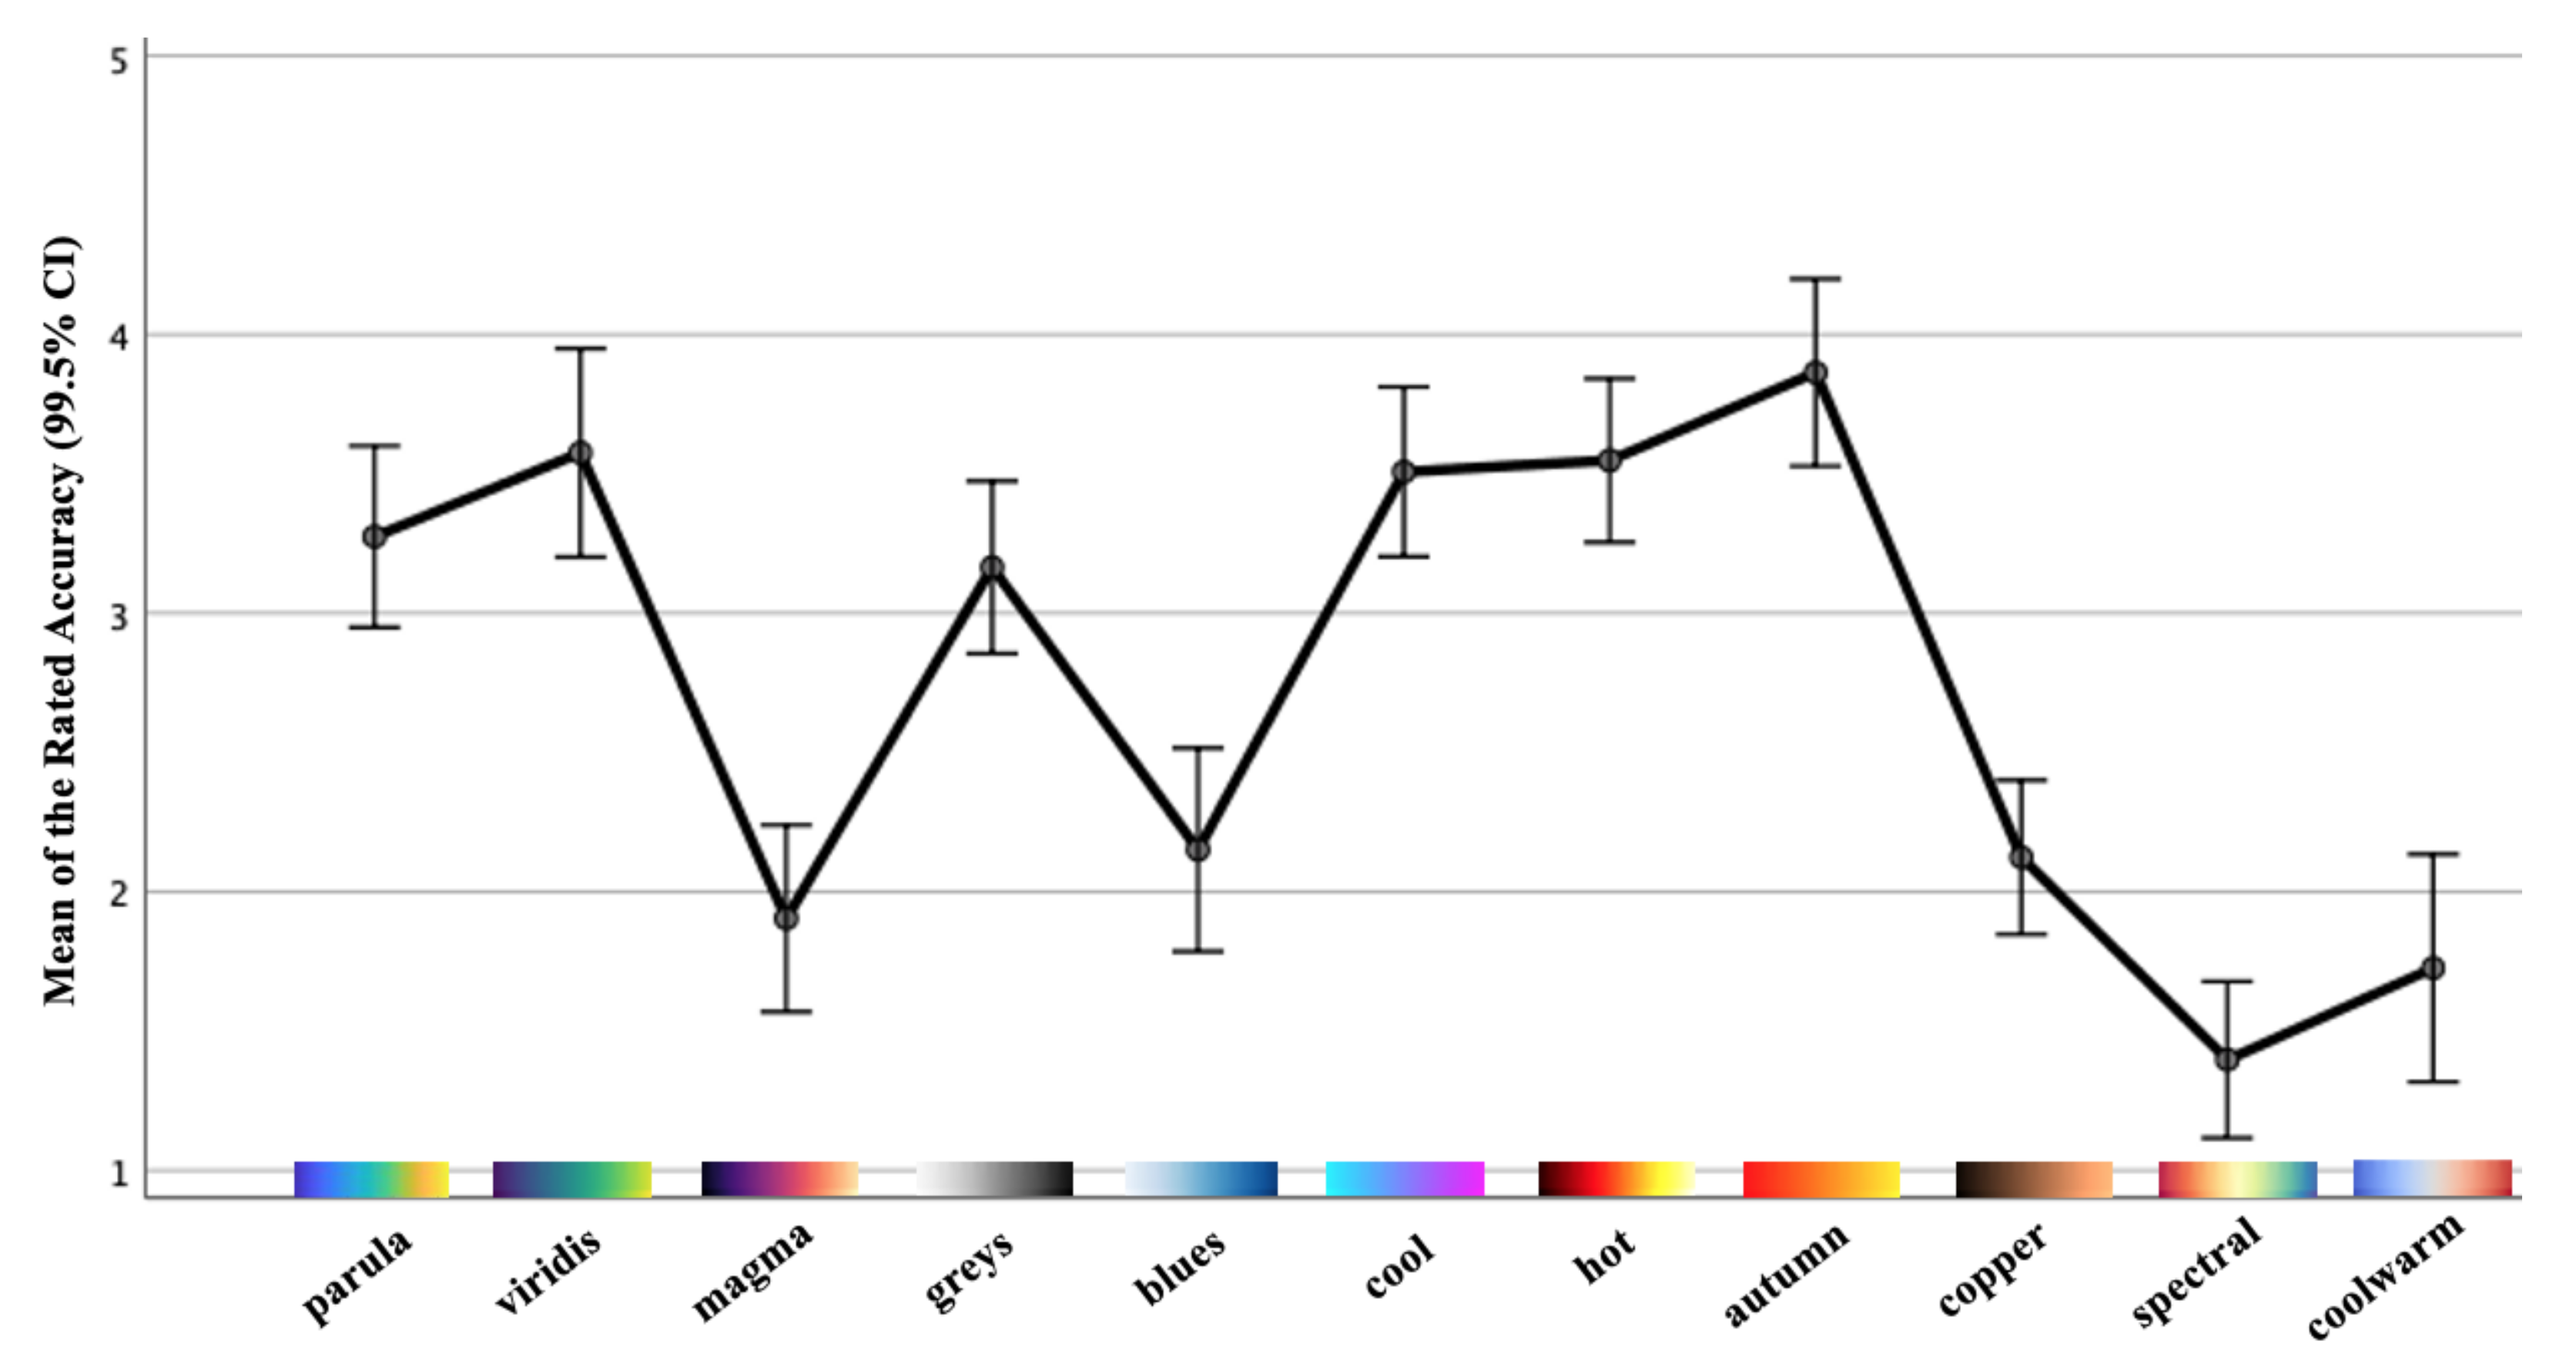
5.2. Part II: Results and Analysis
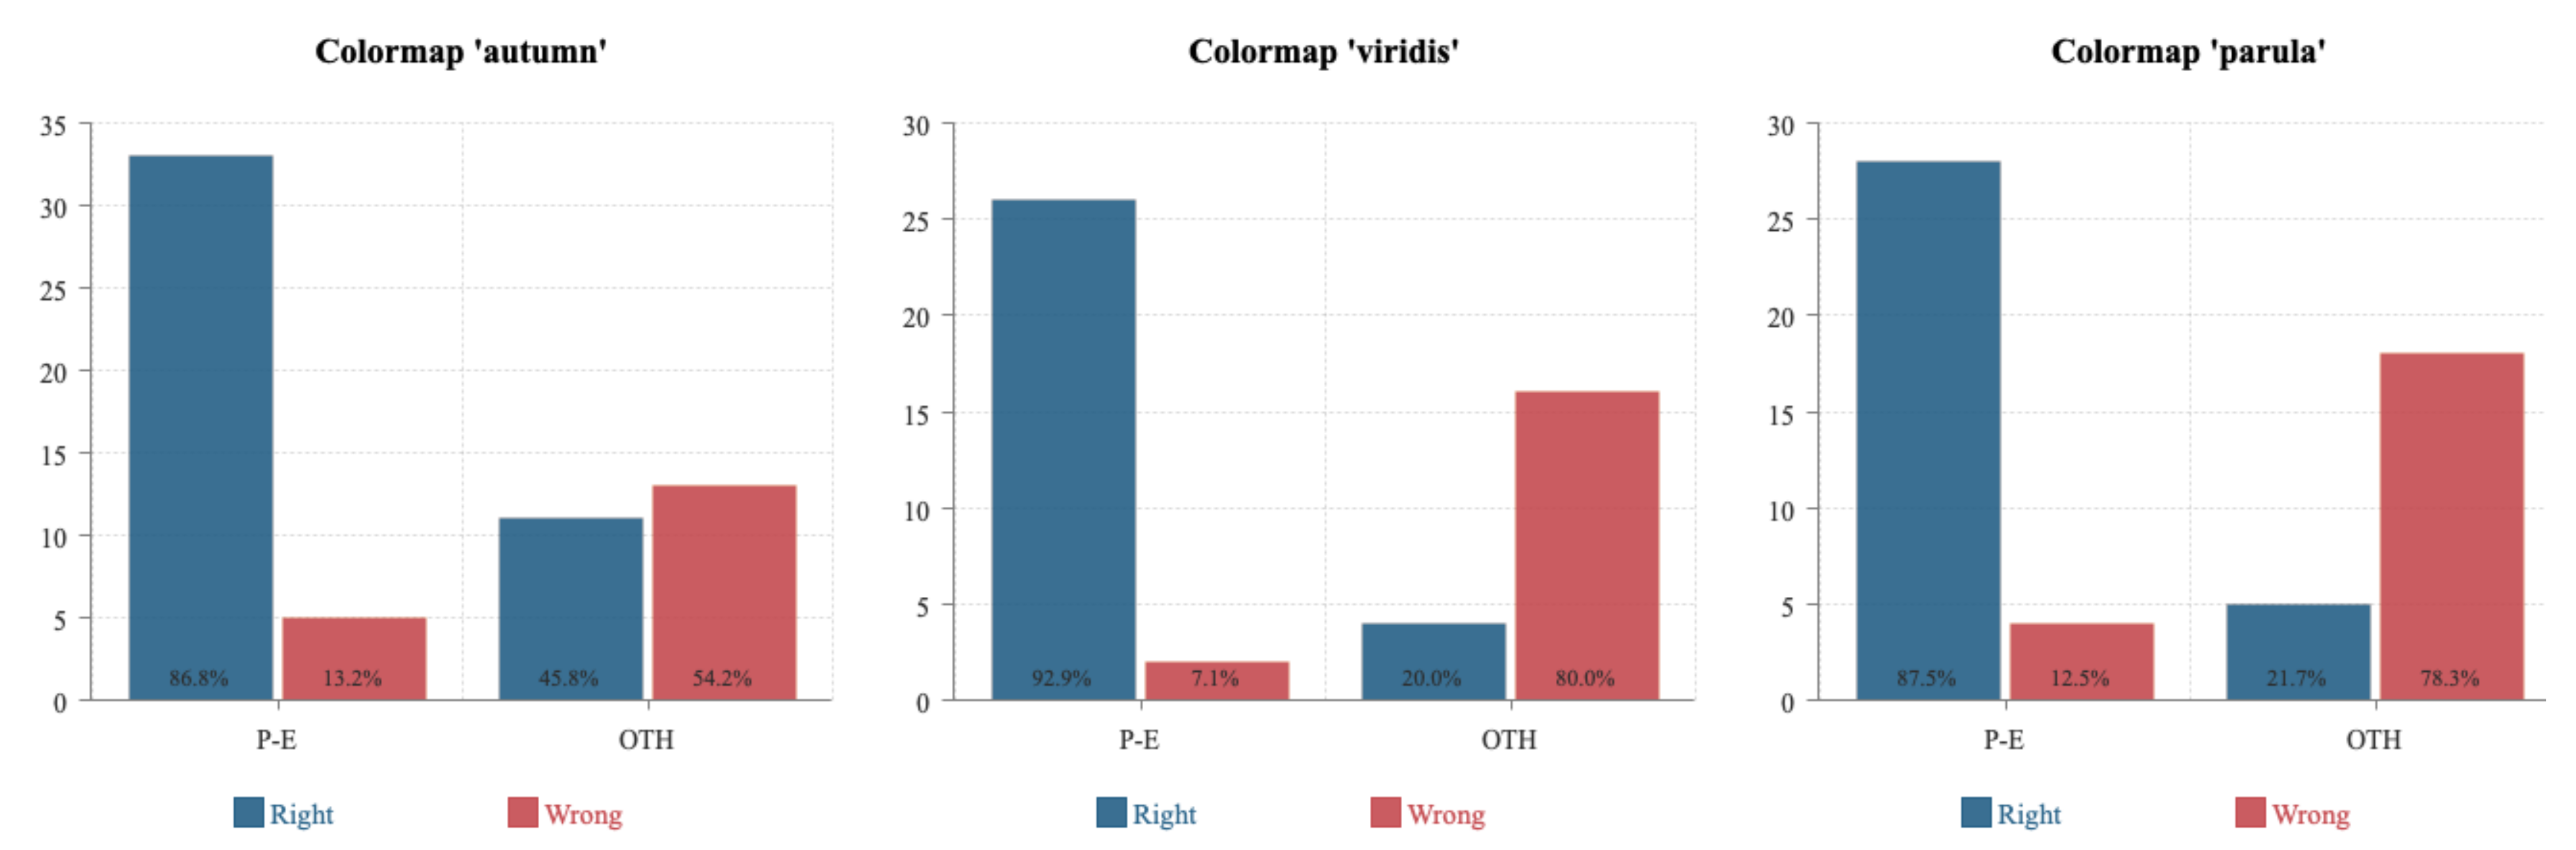
5.3. Validation Analysis
6. Discussion
6.1. Insights
6.2. Limitations
7. Conclusions
- Guideline-1: For comprehension-based segmentation scientific analysis for MWT, we recommend the colormaps autumn, viridis and parula as the most suitable color schemes. For the same context of use, we advise against spectral, coolwarm and magma schemes.
- Guideline-2: For comprehension-based segmentation scientific analysis for MWT, we recommend the colormaps triggering affect in the positive–exciting quadrant in the valence–arousal emotion model as the most suitable color schemes to facilitate visual comprehension. Conversely, we advise against those color schemes which incite affect in the negative-calm quadrant.
Author Contributions
Funding
Institutional Review Board Statement
Informed Consent Statement
Data Availability Statement
Acknowledgments
Conflicts of Interest
References
- Wu, Z.; Wang, H. Microwave Tomography for Industrial Process Imaging: Example Applications and Experimental Results. IEEE Antennas Propag. Mag. 2017, 59, 61–71. [Google Scholar] [CrossRef]
- Sun, Y.; Kuehner, T.; Link, G.; Kayser, T.; Jelonnek, J.; Baake, E. A novel temperature control approach of distributed microwave feeding systems. In Proceedings of the International Scientific Colloquium ‘Modeling for Electromagnetic Processing, Hanover, Germany, 16–19 September 2014; pp. 155–161. [Google Scholar]
- Zhang, Y.; Fjeld, M. Condition Monitoring for Confined Industrial Process Based on Infrared Images by Using Deep Neural Network and Variants. In Proceedings of the 2020 2nd International Conference on Image, Video and Signal Processing, Singapore, 20–22 March 2020; pp. 99–106. [Google Scholar]
- Nagoor, O.H.; Borgo, R.; Jones, M.W. Data painter: A tool for colormap interaction. In Proceedings of the Conference on Computer Graphics & Visual Computing, Manchester, UK, 14–15 September 2017; pp. 69–76. [Google Scholar]
- Schulze-Wollgast, P.; Tominski, C.; Schumann, H. Enhancing Visual Exploration by Appropriate Color Coding. In Proceedings of the International Conference in Central Europe on Computer Graphics, Visualization and Computer Vision 2005 (WSCG 2005), Pilsen, Czech Republic, 31 January–4 February 2005; pp. 203–210. [Google Scholar]
- Bartram, L.; Patra, A.; Stone, M. Affective color in visualization. In Proceedings of the 2017 CHI Conference on Human Factors in Computing Systems, Denver, CO, USA, 6–11 May 2017; pp. 1364–1374. [Google Scholar]
- Schloss, K.B.; Gramazio, C.C.; Silverman, A.T.; Parker, M.L.; Wang, A.S. Mapping color to meaning in colormap data visualizations. IEEE Trans. Vis. Comput. Graph. 2018, 25, 810–819. [Google Scholar] [CrossRef] [PubMed]
- Zhang, Y.; Fjeld, M.; Said, A.; Fratarcangeli, M. Task-based Colormap Design Supporting Visual Comprehension in Process Tomography. In EuroVis 2020—Short Papers; Kerren, A., Garth, C., Marai, G.E., Eds.; The Eurographics Association: Norrköping, Sweden, 2020. [Google Scholar] [CrossRef]
- Norman, D.A. Emotional Design: Why We Love (or Hate) Everyday Things; Basic Civitas Books: New York, NY, USA, 2004. [Google Scholar]
- Cairo, A. The Truthful Art: Data, Charts and Maps for Communication; New Riders: San Francisco, CA, USA, 2016. [Google Scholar]
- Hullman, J.; Diakopoulos, N. Visualization rhetoric: Framing effects in narrative visualization. IEEE Trans. Vis. Comput. Graph. 2011, 17, 2231–2240. [Google Scholar] [CrossRef] [PubMed]
- Russell, J.A. A circumplex model of affect. J. Personal. Soc. Psychol. 1980, 39, 1161. [Google Scholar] [CrossRef]
- Kirke, A.; Miranda, E. Emotional and multi-agent systems in computer-aided writing and poetry. In Proceedings of the Artificial Intelligence and Poetry Symposium, Exeter, UK, 2–5 April 2013; pp. 17–22. [Google Scholar]
- Yang, H.; Min, K. Color-Emotion Model for Re-rendering Visual Contents. Int. J. Softw. Eng. Its Appl. 2013, 7, 351–358. [Google Scholar] [CrossRef][Green Version]
- Tsonos, D.; Kouroupetroglou, G. A methodology for the extraction of reader’s emotional state triggered from text typography. In Tools in Artificial Intelligence; IntechOpen: London, UK, 2008. [Google Scholar]
- Bergman, L.D.; Rogowitz, B.E.; Treinish, L.A. A rule-based tool for assisting colormap selection. In Proceedings of the Visualization’95, Atlanta, GA, USA, 29 October–3 November 1995; pp. 118–125. [Google Scholar]
- Tominski, C.; Fuchs, G.; Schumann, H. Task-driven color coding. In Proceedings of the 2008 12th International Conference Information Visualisation, London, UK, 9–11 July 2008; pp. 373–380. [Google Scholar]
- Mittelstädt, S.; Jäckle, D.; Stoffel, F.; Keim, D.A. ColorCAT: Guided Design of Colormaps for Combined Analysis Tasks. In Proceedings of the Conference on Visualization (EuroVis), Sardinia, Italy, 25–29 May 2015; pp. 115–119. [Google Scholar]
- Reda, K.; Nalawade, P.; Ansah-Koi, K. Graphical perception of continuous quantitative maps: The effects of spatial frequency and colormap design. In Proceedings of the 2018 CHI Conference on Human Factors in Computing Systems; ACM: New York, NY, USA, 2018; p. 272. [Google Scholar]
- Turton, T.L.; Ware, C.; Samsel, F.; Rogers, D.H. A crowdsourced approach to colormap assessment. In EuroVis Workshop on Reproducibility, Verification and Validation in Visualization (EuroRV3); The Eurographics Association: Barcelona, Spain, 2017. [Google Scholar]
- Cyr, D.; Head, M.; Larios, H. Colour appeal in website design within and across cultures: A multi-method evaluation. Int. J. Hum. Comput. Stud. 2010, 68, 1–21. [Google Scholar] [CrossRef]
- Madden, T.J.; Hewett, K.; Roth, M.S. Managing images in different cultures: A cross-national study of color meanings and preferences. J. Int. Mark. 2000, 8, 90–107. [Google Scholar] [CrossRef]
- Wilms, L.; Oberfeld, D. Color and emotion: Effects of hue, saturation and brightness. Psychol. Res. 2018, 82, 896–914. [Google Scholar] [CrossRef] [PubMed]
- Kragel, P.A.; Reddan, M.C.; LaBar, K.S.; Wager, T.D. Emotion schemas are embedded in the human visual system. Sci. Adv. 2019, 5, eaaw4358. [Google Scholar] [CrossRef] [PubMed]
- Brewer, C.A. Color use guidelines for mapping. Vis. Mod. Cartogr. 1994, 1994, 123–148. [Google Scholar]
- Liu, Y.; Heer, J. Somewhere over the rainbow: An empirical assessment of quantitative colormaps. In Proceedings of the 2018 CHI Conference on Human Factors in Computing Systems, Montreal, QC, Canada, 21–26 April 2018; pp. 1–12. [Google Scholar]
- Moreland, K. Diverging color maps for scientific visualization. In International Symposium on Visual Computing; Springer: Berlin/Heidelberg, Germany, 2009; pp. 92–103. [Google Scholar]
- Zhang, Y.; Ma, Y.; Omrani, A.; Yadav, R.; Fjeld, M.; Fratarcangeli, M. Automatic image segmentation for microwave tomography (mwt) from implementation to comparative evaluation. In Proceedings of the 12th International Symposium on Visual Information Communication and Interaction, Shanghai, China, 20–22 September 2019; pp. 1–2. [Google Scholar]
- Zhang, Y.; Ma, Y.; Omrani, A.; Yadav, R.; Fjeld, M.; Fratarcangeli, M. Automated Microwave Tomography (MWT) Image Segmentation: State-of-the-Art Implementation and Evaluation. In Proceedings of the International Conference in Central Europe on Computer Graphics, Visualization and Computer Vision 2020 (WSCG 2020), Pilsen, Czech Republic, 18–22 May 2020; pp. 126–136. [Google Scholar] [CrossRef]
- Bigham, J.P.; Bernstein, M.S.; Adar, E. Human-computer interaction and collective intelligence. In Handbook of Collective Intelligence; MIT Press: Cambridge, MA, USA, 2015; Volume 57. [Google Scholar]
- Chen, C.; Woźniak, P.W.; Romanowski, A.; Obaid, M.; Jaworski, T.; Kucharski, J.; Grudzień, K.; Zhao, S.; Fjeld, M. Using crowdsourcing for scientific analysis of industrial tomographic images. ACM Trans. Intell. Syst. Technol. (TIST) 2016, 7, 52. [Google Scholar] [CrossRef]
- Lang, P. Behavioral treatment and bio-behavioral assessment: Computer applications. Technol. Ment. Health Care Deliv. Syst. 1980, 119–137. [Google Scholar] [CrossRef]
- Betella, A.; Verschure, P.F. The affective slider: A digital self-assessment scale for the measurement of human emotions. PLoS ONE 2016, 11, e0148037. [Google Scholar] [CrossRef] [PubMed]
- Bradley, M.M.; Lang, P.J. Measuring emotion: The self-assessment manikin and the semantic differential. J. Behav. Ther. Exp. Psychiatry 1994, 25, 49–59. [Google Scholar] [CrossRef]
- Geethanjali, B.; Adalarasu, K.; Hemapraba, A.; Kumar, S.P.; Rajasekeran, R. Emotion analysis using SAM (self-assessment manikin) scale. Biomed. Res. 2017, 28, 18–24. [Google Scholar]
- Likert, R. A technique for the measurement of attitudes. Arch. Psychol. 1932. [Google Scholar] [CrossRef]
- Kim, L.H.; Follmer, S. Ubiswarm: Ubiquitous robotic interfaces and investigation of abstract motion as a display. In Proceedings of the ACM on Interactive, Mobile, Wearable and Ubiquitous Technologies; ACM: New York, NY, USA, 2017; Volume 1, pp. 1–20. [Google Scholar]
- Helm, C.E.; Tucker, L.R. Individual differences in the structure of color-perception. Am. J. Psychol. 1962, 75, 437–444. [Google Scholar] [CrossRef] [PubMed]


| The Stimuli Presented to Participants | The Anticipated Results from Participants | |
|---|---|---|
| The user study | ||
| Part I | The 11 colormaps used in the study | Affective responses for each colormap |
| Part II | The 11 colormaps used in the study | Comprehension ability in rating |
| the task accuracy of each colormap |
| Parula | Viridis | Magma | Greys | Blues | Cool | Hot | Autumn | Copper | Spectral | Coolwarm | |
|---|---|---|---|---|---|---|---|---|---|---|---|
| Valence | |||||||||||
| Mean | 5.92 | 5.85 | 3.81 | 2.84 | 6.12 | 4.56 | 4.32 | 6.36 | 3.15 | 4.56 | 4.86 |
| SD | 1.762 | 1.721 | 1.604 | 1.795 | 1.914 | 2.014 | 2.027 | 1.775 | 1.459 | 1.748 | 1.702 |
| Arousal | |||||||||||
| Mean | 5.37 | 5.48 | 4.62 | 2.29 | 4.25 | 4.70 | 5.93 | 5.67 | 3.33 | 4.15 | 4.19 |
| SD | 1.933 | 1.634 | 1.890 | 1.438 | 1.722 | 2.059 | 2.117 | 1.834 | 1.519 | 1.587 | 1.721 |
| Parula | Viridis | Magma | Greys | Blues | Cool | Hot | Autumn | Copper | Spectral | Coolwarm | |
|---|---|---|---|---|---|---|---|---|---|---|---|
| Accuracy | |||||||||||
| Mean | 3.27 | 3.58 | 1.90 | 3.16 | 2.15 | 3.51 | 3.55 | 3.86 | 2.12 | 1.40 | 1.73 |
| SD | 0.961 | 1.105 | 0.988 | 0.913 | 1.076 | 0.899 | 0.867 | 0.990 | 0.816 | 0.829 | 1.205 |
| Ranks | 1 | 2 | 3 | 4 | 5 | 6 | 7 | 8 | 9 | 10 | 11 |
|---|---|---|---|---|---|---|---|---|---|---|---|
| Colormaps | autumn | viridis | parula | hot | cool | greys | blues | copper | magma | coolwarm | spectral |
Publisher’s Note: MDPI stays neutral with regard to jurisdictional claims in published maps and institutional affiliations. |
© 2021 by the authors. Licensee MDPI, Basel, Switzerland. This article is an open access article distributed under the terms and conditions of the Creative Commons Attribution (CC BY) license (https://creativecommons.org/licenses/by/4.0/).
Share and Cite
Zhang, Y.; Fjeld, M.; Fratarcangeli, M.; Said, A.; Zhao, S. Affective Colormap Design for Accurate Visual Comprehension in Industrial Tomography. Sensors 2021, 21, 4766. https://doi.org/10.3390/s21144766
Zhang Y, Fjeld M, Fratarcangeli M, Said A, Zhao S. Affective Colormap Design for Accurate Visual Comprehension in Industrial Tomography. Sensors. 2021; 21(14):4766. https://doi.org/10.3390/s21144766
Chicago/Turabian StyleZhang, Yuchong, Morten Fjeld, Marco Fratarcangeli, Alan Said, and Shengdong Zhao. 2021. "Affective Colormap Design for Accurate Visual Comprehension in Industrial Tomography" Sensors 21, no. 14: 4766. https://doi.org/10.3390/s21144766
APA StyleZhang, Y., Fjeld, M., Fratarcangeli, M., Said, A., & Zhao, S. (2021). Affective Colormap Design for Accurate Visual Comprehension in Industrial Tomography. Sensors, 21(14), 4766. https://doi.org/10.3390/s21144766