Communication

Ultra-Highly Sensitive Ammonia Detection Based on Light-Induced Thermoelastic Spectroscopy

National Key Laboratory of Science and Technology on Tunable Laser, Harbin Institute of Technology, Harbin 150001, China
*
Author to whom correspondence should be addressed.
Sensors 2021, 21(13), 4548; https://doi.org/10.3390/s21134548
Submission received: 23 June 2021 / Revised: 29 June 2021 / Accepted: 1 July 2021 / Published: 2 July 2021
(This article belongs to the Special Issue Advanced Fiber Photonic Devices and Sensors)

Abstract

:
This invited paper demonstrated an ultra-highly sensitive ammonia (NH3) sensor based on the light-induced thermoelastic spectroscopy (LITES) technique for the first time. A quartz tuning fork (QTF) with a resonance frequency of 32.768 kHz was employed as a detector. A fiber-coupled, continuous wave (CW), distributed feedback (DFB) diode laser emitting at 1530.33 nm was chosen as the excitation source. Wavelength modulation spectroscopy (WMS) and second-harmonic (2f) detection techniques were applied to reduce the background noise. In a one scan period, a 2f signal of the two absorption lines located at 6534.6 cm−1 and 6533.4 cm−1 were acquired simultaneously. The 2f signal amplitude at the two absorption lines was proved to be proportional to the concentration, respectively, by changing the concentration of NH3 in the analyte. The calculated R-square values of the linear fit are equal to ~0.99. The wavelength modulation depth was optimized to be 13.38 mA, and a minimum detection limit (MDL) of ~5.85 ppm was achieved for the reported NH3 sensor.

1. Introduction

Ammonia (NH3), a component gas of the atmosphere, has been widely used in various important fields, such as medicine production, chemical industries, and so on [1]. When it comes to a medical diagnostic, NH3 can be used as a biomarker to indicate kidney and liver diseases [2,3]. However, on the other hand, ammonia also has lots of hazards. For example, NH3 poses a serious threat to human health, which can burn skin, eyes, and the respiratory mucosa. If people inhale too much, it can cause lung swelling and even death [4]. NH3 is also the main cause of air pollution. Hence, carrying out ammonia detection is necessary for both industrial production and the environment. Nevertheless, the typical concentration of NH3 is at low levels of parts per million (ppm) or parts per billion (ppb). Therefore, NH3 sensors should be ultra-highly sensitive to satisfy these applications.
Various sensors have been used for NH3 detection. Chemical sensors are widely applied in gas detection, which has the advantages of low cost and small size [5]. However, when chemical sensors are employed to detect NH3, it may be influenced by other gasses, such as oxygen [6]. Laser absorption spectroscopy (LAS) is an effective method with the advantages of being non-invasive, highly sensitive, having a fast response, and selective detection, and has been widely used for trace gas sensing. Tunable diode laser absorption spectroscopy (TDLAS) is a serviceable LAS-based technique to detect the concentration of NH3 [7]. To obtain an excellent detection performance, a multi-pass gas cell (MPGC) is employed in the TDLAS technique [8]. When the laser beam travels through the MPGC, the effective optical path length can be extended to a significant scale, which can bring the detection limit down to ppm levels [9,10]. However, adopting an MPGC means the total equipment is costly and bulky by virtue of the large size of an MPGC and the large quantity of optical elements used to align the laser beam.
Quartz-enhanced photoacoustic spectroscopy (QEPAS), which was reported in 2002 for the first time [11], is another effective method for trace gas detection. A quartz tuning fork (QTF) is employed in QEPAS to transform acoustic wave signals to piezoelectric signals, whose amplitude reflects the gas concentration. The QTF has the advantages of being commercially available, low cost, having a tiny volume, a dipole structure, a high Q-factor, a wide dynamic range, and a narrow resonance frequency band. Due to these advantages, QEPAS could be excellent for sensitive detection and obtain great immunity to environmental noise [12,13,14,15,16,17,18]. A sensitive NH3-QEPAS sensor achieving the minimum detection limit (MDL) of ~418.4 ppb was reported in 2017 [19]. In QEPAS, the QTF needs to be placed in the gas cell and immersed in the target gas. When using QEPAS to detect the concentration of corrosive gases such as NH3, the QTF can be corroded, which may finally bring sensor failure.
Light-induced thermoelastic spectroscopy (LITES), an effective technique first reported in 2018 [20], has been widely employed for trace gas detection. This technique is also named quartz-enhanced photothermal spectroscopy (QEPTS). In LITES, the laser beam is focused on the QTF after traveling through the sample gas cell and being absorbed. Hence, when the laser arrives at the QTF, its power is converted into thermal energy in the quartz crystal [21,22,23]. Due to thermoelastic deformation, the periodic change of laser energy contributes to the periodic mechanical motion of QTF prongs, which would be enhanced by the resonance property of QTF [24,25]. Because of the piezoelectric effect, the QTF transforms mechanical vibrations into electrical signals. By demodulating the electrical signal, the concentration of sample gas can be obtained [26,27]. Compared to QEPAS, LITES has the same advantages as QEPAS while avoiding the QTF damage caused by target gas corrosiveness [28]. Therefore, LITES has been widely used in corrosive gas detection [29]. However, till now, NH3 detection using the LITES technique has not been reported.
In this invited manuscript, an ultra-highly sensitive NH3 sensor based on the LITES technique is demonstrated for the first time. By means of wavelength modulation spectroscopy (WMS) and second-harmonic detection (2f) techniques, the background noise of the sensor was able to dropdown. One current scan period covered two different absorption lines of NH3. By changing the concentration of NH3 in the analyte, a linear relationship between 2f signal amplitude and concentration was demonstrated. After optimizing the response time and modulation depth, an MDL of ~5.85 ppm was achieved for this reported NH3-LITES sensor.

2. Experimental Setup

2.1. Absorption Line Selection

Diode lasers have many merits, such as a wide tunable range from near-ultraviolet to near-infrared, small size, narrow linewidth, and high optical efficiency, making them have important applications in single-chip laboratory, medical diagnosis, dermatology, and gas sensing. In this experiment, a fiber-coupled, near-infrared, continuous wave (CW), distributed feedback (DFB) diode laser emitting at 1530.33 nm was chosen to be the excitation source. By changing the injection current at different temperatures, the emission characteristic of this diode laser was measured. The results are shown in Figure 1. Considering that the LITES signal has wide dynamic responses to laser power [20], the output power of the CW-DFB diode laser can meet the demand.
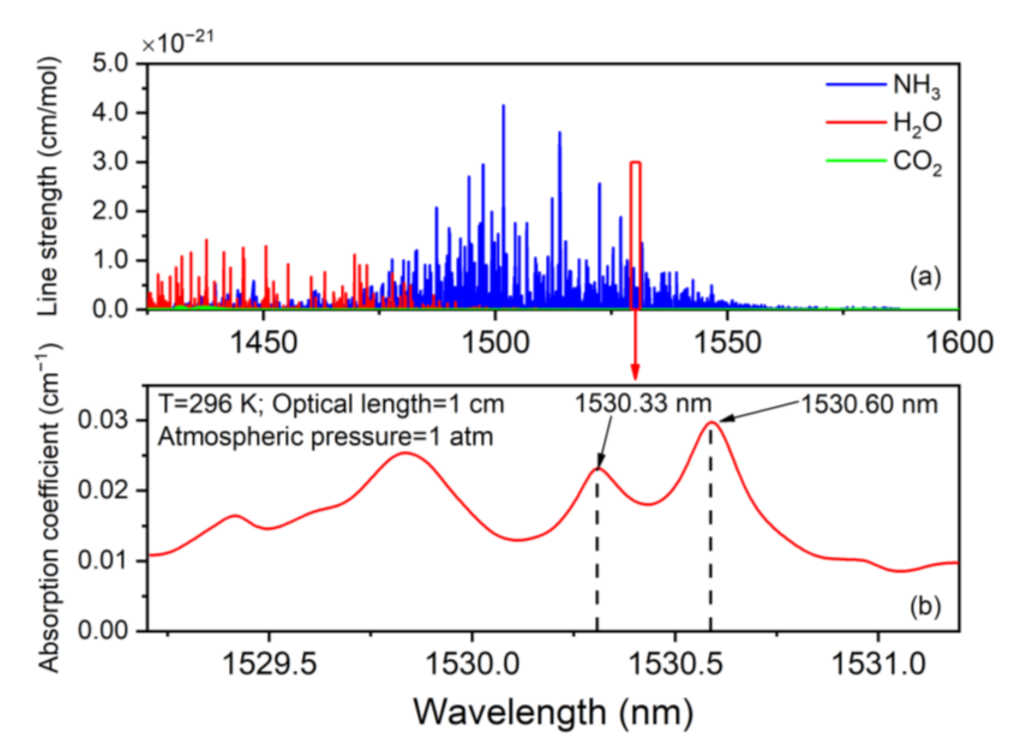
Considering that different gases may influence the detection, the absorption lines of NH3, H2O, and CO2 located between 1425 nm and 1600 nm were calculated respectively based on the HITRAN 2016 database [30]. As is shown in Figure 2a, the existence of CO2 or H2O could not influence the NH3 detection. Considering that the CW-DFB diode laser chosen in this experiment is able to cover the wavelength from 1530.69 nm (6533 cm−1) to 1529.99 nm (6536 cm−1), two absorption lines of NH3, which are respectively located at 1530.33 nm (6534.6 cm−1) and 1530.60 nm (6533.4 cm−1), were chosen in this investigation. The selected absorption lines are depicted in Figure 2b.

2.2. The Configuration of Experimental Setup

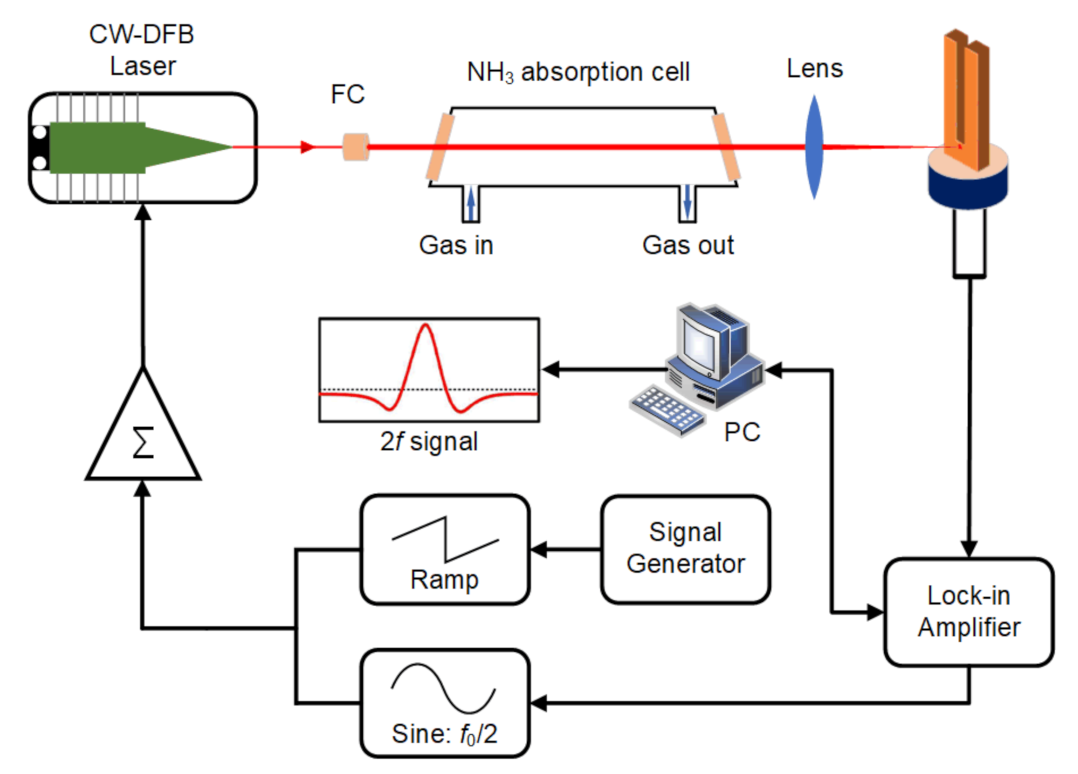
A schematic diagram of the LITES sensor system is exhibited in Figure 3. A fiber collimator (FC) was employed in order to collimate the laser beam generated by the fiber-coupled, CW-DFB diode laser. Afterward, the laser beam traveled through the absorption cell with a length of 20 cm and filled with target gas. To avoid optical interference, two wedged CaF2 windows were installed on both sides of the absorption cell. Subsequent to propagating through the cell, the laser beam is focused by a lens with a focal length of 40 mm on a QTF with a low intrinsic resonance frequency f0 of 32.768 kHz in a vacuum. For the purpose of acquiring the maximum signal, the position where the laser beam focuses on the QTF’s surface is supposed to be optimized. As was reported in [31], the optimum laser focusing position is the bare surface area on the base of QTF’s prongs. WMS and 2f detection techniques were adopted in this LITES sensor system. An adder was employed for the CW-DFB laser, which added a low-frequency ramp wave generated by a signal generator and a high-frequency sinusoidal wave (f = f0/2 = 15.36 kHz) generated by a lock-in amplifier together. The ramp wave contributed to continuously changing the emission wavelength of the CW-DFB diode laser across the absorption lines of NH3. The demodulated 2f component of the LITES signal could be acquired by a lock-in amplifier. In this reported NH3-LITES sensor system, the integration time of the lock-in amplifier was 200 ms. The experiment was accomplished at room temperature and atmospheric pressure. The LITES technique has wide dynamic responses to gas concentration [20]; therefore, a certified gas mixture of 10,000 ppm NH3:N2 was utilized as the analyte. The experimental results were verified by repeated measurements.

3. Experimental Results and Discussion

Firstly, the QTF’s properties were investigated. There are two methods to investigate the QTF’s properties. The first one applies a laser beam as the excitation source [27]; the other one applies electric excitation [32]. The first method was adopted in this experiment. As is shown in Figure 4, the intrinsic resonance frequency f0 and bandwidth Δf were measured as 32.763 kHz and 2.25 Hz, respectively. The quality factor Q = f0f was calculated as 14,541, indicating its good performance.
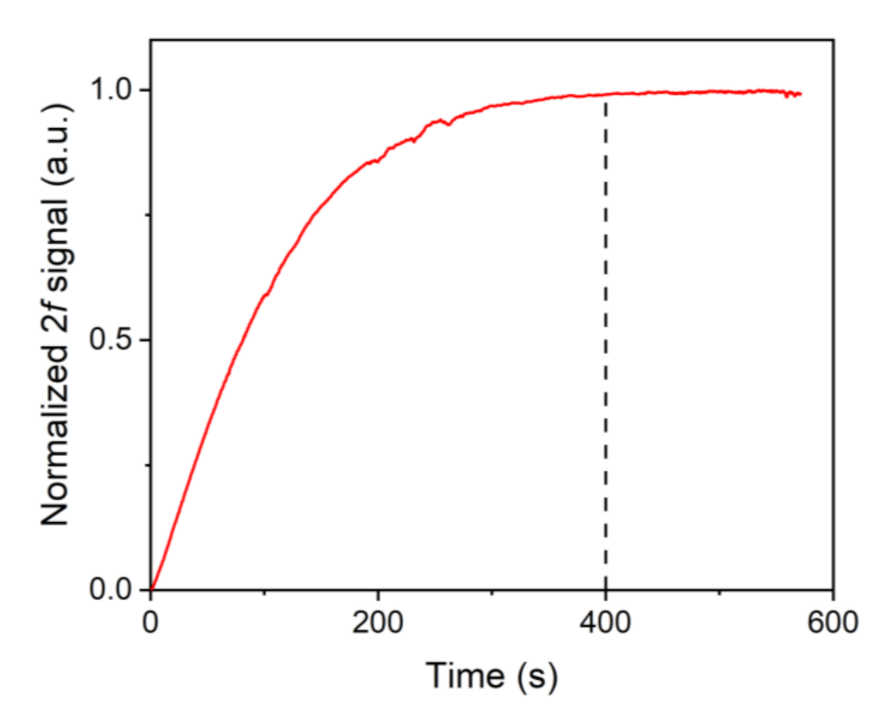
Considering that NH3 is able to be adsorbed onto the inner surface of the absorption cell, the detected 2f signal is unstable before NH3 is in a saturation adsorption state. Hence, it is crucial to investigate the relationship between the 2f signal value and ventilation time. The measured results are exhibited in Figure 5. The results indicate that the normalized signal value is essentially stable after 400 s. Hence, to acquire stable experimental data, the experiment is expected to be carried out at least 400 s after the NH3 injection.
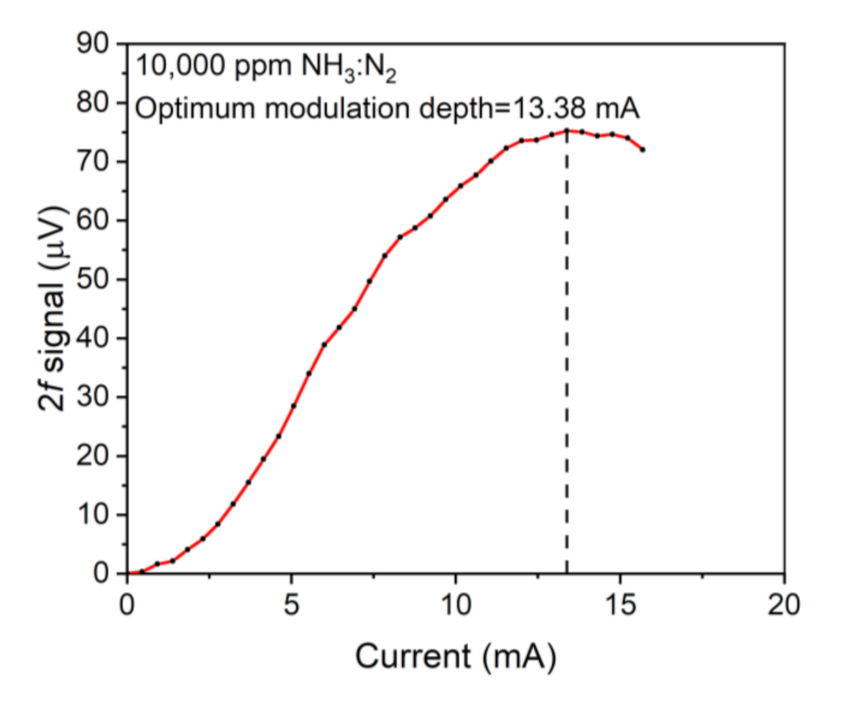
Figure 6 reflects the correlation between the NH3-LITES signal value and wavelength modulation depth. In this paper, wavelength modulation depth is described by injection current. It could be seen that the NH3-LITES signal amplitude rose to a maximum first and then fell down with the increase in injection current. When the wavelength modulation depth was 13.38 mA, the 2f signal achieved the maximum value. Therefore, the optimum modulation depth of 13.38 mA was used in the following investigations.
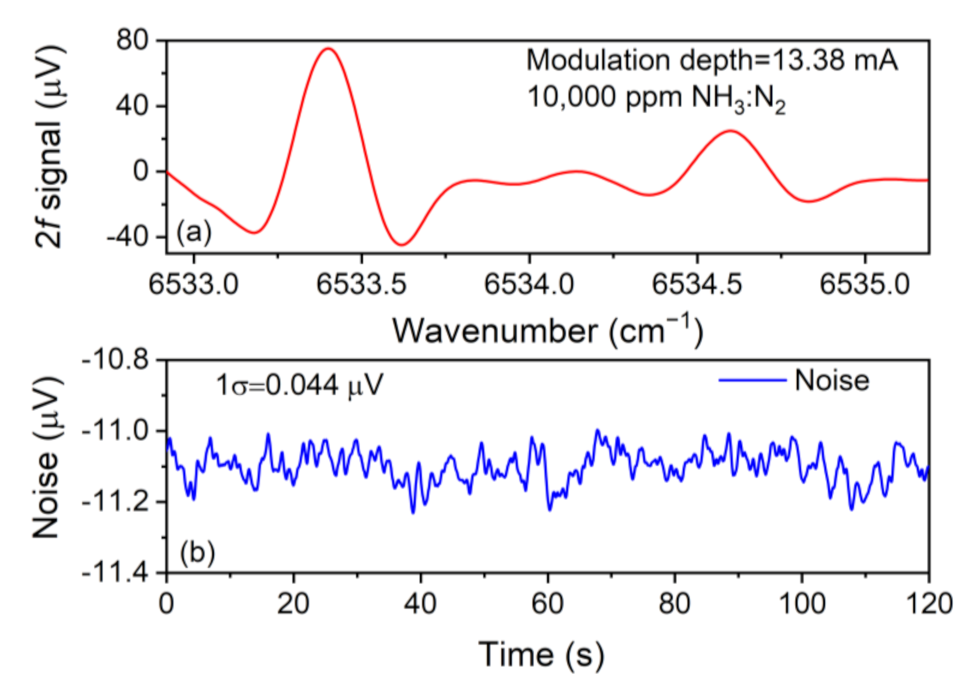
When the modulation depth was 13.38 mA, the 2f signal was measured and exhibited in Figure 7. The 2f signal had two peaks corresponding to the two absorption lines located at 6534.6 cm−1 (1530.33 nm) and 6533.4 cm−1 (1530.60 nm), respectively. The peak value at 6533.4 cm−1 was 75.23 μV, while the other peak value was 24.89 μV. Obviously, the peak value at 6533.4 cm−1 was much bigger than what was located at 6534.6 cm−1, which agreed with the absorption line strength data from the HITRAN database well. Hence, the absorption line located at 6533.4 cm−1 was selected to carry out further investigation. The background noise level was determined by continually monitoring the amplitude for 120 s when the absorption cell was filled with nitrogen (N2). The results are shown in Figure 7b. The calculated 1σ noise value was 0.044 μV. In terms of the data depicted in Figure 7, a signal-to-noise ratio (SNR) value of ~1709 was calculated. In view of the definition that minimum detection limit (MDL) = analyte concentration/SNR, an MDL of ~5.85 ppm was acquired for this NH3-LITES sensor.
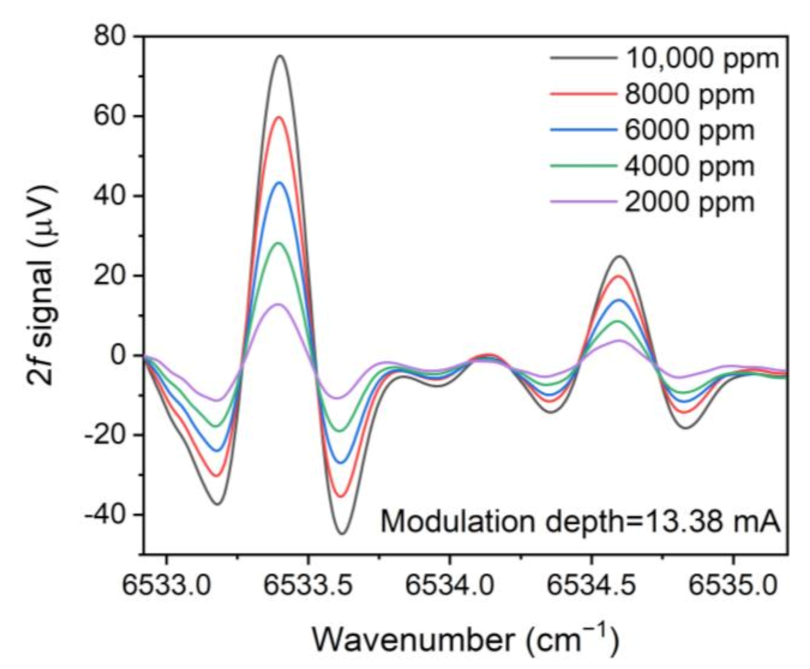
To verify the linear response of the LITES signal on the NH3 concentration, the 2f signals for different NH3 concentrations are shown in Figure 8. To obtain a mixture gas of different concentrations, two mass flow controllers were employed to control the gas flow rate of 10,000 ppm NH3:N2 and pure N2, respectively. Linear fits of LITES signal amplitude and NH3 concentration are shown in Figure 9, respectively, for the two absorption lines. The calculated R-square values are equal to ~0.99, indicating that the LITES signal performs a splendid linear response of NH3 concentration levels for the two selected lines.

4. Conclusions

This paper demonstrated an ultra-highly sensitive NH3 sensor based on the LITES technique for the first time. A fiber-coupled, near-infrared, CW-DFB diode laser emitting at 1530.33 nm was chosen to be the excitation source. A QTF with an intrinsic resonance frequency f0 of 32.768 kHz was used as a detector to transduce mechanical vibrations into electrical signals. By means of WMS and 2f detection techniques, the background noise of the sensor was reduced to a low level. Two different absorption lines of NH3 located at 6534.6 cm−1 and 6533.4 cm−1 were chosen and investigated. The response of the LITES signal on the NH3 concentrations was investigated, which indicated an excellent linear response. The wavelength modulation depth was optimized to be 13.38 mA, and finally, an MDL of ~5.85 ppm was achieved for this NH3-LITES sensor. This ppm-level NH3-LITES sensor has the potential to be applied in environmental monitoring, medical diagnostic, and other fields.

Author Contributions

Investigation; writing—original draft preparation, Y.M. (Yao Mi); writing—review and editing; supervision, Y.M. (Yufei Ma). All authors have read and agreed to the published version of the manuscript.

Funding

This research was funded by National Natural Science Foundation of China (Grant Nos. 62022032, 61875047 and 61505041), Natural Science Foundation of Heilongjiang Province of China (Grant No. YQ2019F006), Fundamental Research Funds for the Central Universities, Financial Grant from the Heilongjiang Province Postdoctoral Foundation (Grant No. LBH-Q18052).

Institutional Review Board Statement

Not applicable.

Informed Consent Statement

Not applicable.

Data Availability Statement

The data presented in this study are available on request from the corresponding author.

Conflicts of Interest

The authors declare no conflict of interest.

References

  1. Jiménez, I.; Vilà, A.M.; Calveras, A.C.; Morante, J.R. Gas sensing properties of catalytically modified wo3 with copper and vanadium for NH3 detection. IEEE Sens. J. 2002, 5, 385–391. [Google Scholar] [CrossRef]
  2. Guntner, A.T.; Abegg, S.; Konigstein, K.; Gerber, P.A.; Schmidt-Trucksäss, A.; Pratsinis, S.E. Breath sensors for health mon-itoring. ACS Sens. 2019, 4, 268–280. [Google Scholar] [CrossRef] [PubMed]
  3. Narasimhan, L.R.; Goodman, W.; Patel, C.K.N. Correlation of breath ammonia with blood urea nitrogen and creatinine during hemodialysis. Proc. Natl. Acad. Sci. USA 2001, 98, 4617–4621. [Google Scholar] [CrossRef] [PubMed] [Green Version]
  4. Fedoruk, M.J.; Bronstein, R.; Kerger, B.D. Ammonia exposure and hazard assessment for selected household cleaning product uses. J. Expo. Anal. Sci. Environ. Epidemiol. 2005, 15, 534–544. [Google Scholar] [CrossRef] [PubMed] [Green Version]
  5. Majder-Łopatka, M.; Węsierski, T.; Dmochowska, A.; Salamonowicz, Z.; Polańczyk, A. The Influence of Hydrogen on the Indications of the Electrochemical Carbon Monoxide Sensors. Sustainability 2019, 12, 14. [Google Scholar] [CrossRef] [Green Version]
  6. Abkenar, G.N.; Rieu, M.; Breuil, P.; Viricelle, J.-P. Development of a selective ammonia YSZ-based sensor and modeling of its response. Sens. Actuators B Chem. 2021, 338, 129833. [Google Scholar] [CrossRef]
  7. Lu, H.; Zheng, C.; Zhang, L.; Liu, Z.; Song, F.; Li, X.; Zhang, Y.; Wang, Y. A Remote Sensor System Based on TDLAS Technique for Ammonia Leakage Monitoring. Sensors 2021, 21, 2448. [Google Scholar] [CrossRef]
  8. Liu, K.; Wang, L.; Tan, T.; Wang, G.; Zhang, W.; Chen, W.; Gao, X. Highly sensitive detection of methane by near-infrared laser absorption spectroscopy using a compact dense-pattern multipass cell. Sens. Actuators B Chem. 2015, 220, 1000–1005. [Google Scholar] [CrossRef] [Green Version]
  9. Claps, R.; Englich, F.V.; Leleux, D.P.; Richter, D.; Tittel, F.K.; Curl, R.F. Ammonia detection by use of near-infrared diode-laser-based overtone spectroscopy. Appl. Opt. 2001, 40, 4387–4394. [Google Scholar] [CrossRef] [Green Version]
  10. Webber, M.E.; Baer, D.S.; Hanson, R.K. Ammonia monitoring near 1.5 μm with diode-laser absorption sensors. Appl. Opt. 2001, 40, 2031–2042. [Google Scholar] [CrossRef]
  11. Kosterev, A.A.; Bakhirkin, Y.A.; Curl, R.F.; Tittel, F.K. Quartz-enhanced photoacoustic spectroscopy. Opt. Lett. 2002, 27, 1902–1904. [Google Scholar] [CrossRef] [Green Version]
  12. Qiao, S.; Ma, Y.; Patimisco, P.; Sampaolo, A.; He, Y.; Lang, Z.; Tittel, F.K.; Spagnolo, V. Multi-pass quartz-enhanced photoacoustic spectroscopy-based trace gas sensing. Opt. Lett. 2021, 46, 977–980. [Google Scholar] [CrossRef]
  13. Ma, Y.; Lewicki, R.; Razeghi, M.; Tittel, F.K. QEPAS based ppb-level detection of CO and N_2O using a high power CW DFB-QCL. Opt. Express 2013, 21, 1008–1019. [Google Scholar] [CrossRef] [Green Version]
  14. Zheng, H.; Liu, Y.; Lin, H.; Liu, B.; Gu, X.; Li, D.; Huang, B.; Wu, Y.; Dong, L.; Zhu, W.; et al. Quartz-enhanced photoacoustic spectroscopy employing pilot line manufactured custom tuning forks. Photoacoustics 2020, 17, 100158. [Google Scholar] [CrossRef]
  15. Feng, W.; Qu, Y.; Gao, Y.; Ma, Y. Advances in fiber-based quartz enhanced photoacoustic spectroscopy for trace gas sensing. Microw. Opt. Technol. Lett. 2021, 63, 2031–2039. [Google Scholar] [CrossRef]
  16. Waclawek, J.P.; Moser, H.; Lendl, B. Compact quantum cascade laser based quartz-enhanced photoacoustic spectroscopy sensor system for detection of carbon disulfide. Opt. Express 2016, 24, 6559–6571. [Google Scholar] [CrossRef] [PubMed]
  17. Li, Y.; Wang, R.; Tittel, F.K.; Ma, Y. Sensitive methane detection based on quartz-enhanced photoacoustic spectroscopy with a high-power diode laser and wavelet filtering. Opt. Lasers Eng. 2020, 132, 106155. [Google Scholar] [CrossRef]
  18. Patimisco, P.; Scamarcio, G.; Tittel, F.K.; Spagnolo, V. Quartz-Enhanced Photoacoustic Spectroscopy: A Review. Sensors 2014, 14, 6165–6206. [Google Scholar] [CrossRef] [Green Version]
  19. Ma, Y.; He, Y.; Tong, Y.; Yu, X.; Tittel, F.K. Ppb-level detection of ammonia based on QEPAS using a power amplified laser and a low resonance frequency quartz tuning fork. Opt. Express 2017, 25, 29356–29364. [Google Scholar] [CrossRef] [Green Version]
  20. Ma, Y.; He, Y.; Tong, Y.; Yu, X.; Tittel, F.K. Quartz-tuning-fork enhanced photothermal spectroscopy for ultra-high sensitive trace gas detection. Opt. Express 2018, 26, 32103–32110. [Google Scholar] [CrossRef] [PubMed] [Green Version]
  21. Russo, S.D.; Zifarelli, A.; Patimisco, P.; Sampaolo, A.; Wei, T.; Wu, H.; Dong, L.; Spagnolo, V. Light-induced thermo-elastic effect in quartz tuning forks exploited as a photodetector in gas absorption spectroscopy. Opt. Express 2020, 28, 19074–19084. [Google Scholar] [CrossRef] [PubMed]
  22. Ma, Y.; He, Y.; Patimisco, P.; Sampaolo, A.; Qiao, S.; Yu, X.; Tittel, F.K.; Spagnolo, V. Ultra-high sensitive trace gas detection based on light-induced thermoelastic spectroscopy and a custom quartz tuning fork. Appl. Phys. Lett. 2020, 116, 011103. [Google Scholar] [CrossRef]
  23. Ma, Y.; Hu, Y.; Qiao, S.; He, Y.; Tittel, F.K. Trace gas sensing based on multi-quartz-enhanced photothermal spectroscopy. Photoacoustics 2020, 20, 100206. [Google Scholar] [CrossRef] [PubMed]
  24. Zhang, Q.; Chang, J.; Cong, Z.; Wang, Z. Application of Quartz Tuning Fork in Photodetector Based on Photothermal Effect. IEEE Photonic. Technol. Lett. 2019, 31, 1592–1595. [Google Scholar] [CrossRef]
  25. Qiao, S.D.; He, Y.; Ma, Y. Trace gas sensing based on single-quartz-enhanced photoacoustic-photothermal dual spectroscopy. Opt. Lett. 2021, 46, 2449–2452. [Google Scholar] [CrossRef] [PubMed]
  26. Lang, Z.T.; Qiao, S.D.; He, Y.; Ma, Y.F. Quartz tuning fork-based demodulation of an acoustic signal induced by pho-to-thermo-elastic energy conversion. Photoacoustics 2021, 22, 100272. [Google Scholar] [CrossRef]
  27. Hu, Y.; Qiao, S.; He, Y.; Lang, Z.; Ma, Y. Quartz-enhanced photoacoustic-photothermal spectroscopy for trace gas sensing. Opt. Express 2021, 29, 5121–5127. [Google Scholar] [CrossRef]
  28. Ma, Y. Recent advances in QEPAS and QEPTS based trace gas sensing: a review. Front. Phys. 2020, 8, 268. [Google Scholar] [CrossRef]
  29. Ma, Y.; Lang, Z.; He, Y.; Qiao, S.; Li, Y. Ultra-Highly Sensitive Hydrogen Chloride Detection Based on Quartz-Enhanced Photothermal Spectroscopy. Sensors 2021, 21, 3563. [Google Scholar] [CrossRef]
  30. Gordon, I.E.; Rothman, L.S.; Hill, C.; Kochanov, R.V.; Tan, Y.; Bernath, P.F.; Birk, M.; Boudon, V.; Campargue, A.; Chance, K.V.; et al. The HITRAN2016 molecular spectroscopic database. J. Quant. Spectrosc. Radiat. Transf. 2017, 203, 3–69. [Google Scholar] [CrossRef]
  31. He, Y.; Ma, Y.; Tong, Y.; Yu, X.; Tittel, F.K. Ultra-high sensitive light-induced thermoelastic spectroscopy sensor with a high Q-factor quartz tuning fork and a multipass cell. Opt. Lett. 2019, 44, 1904–1907. [Google Scholar] [CrossRef]
  32. Ma, Y.F.; Yu, G.; Zhang, J.; Yu, X.; Sun, R.; Tittel, F.K. Quartz Enhanced Photoacoustic Spectroscopy Based Trace Gas Sensors Using Different Quartz Tuning Forks. Sensors 2015, 15, 7596–7604. [Google Scholar] [CrossRef] [PubMed] [Green Version]
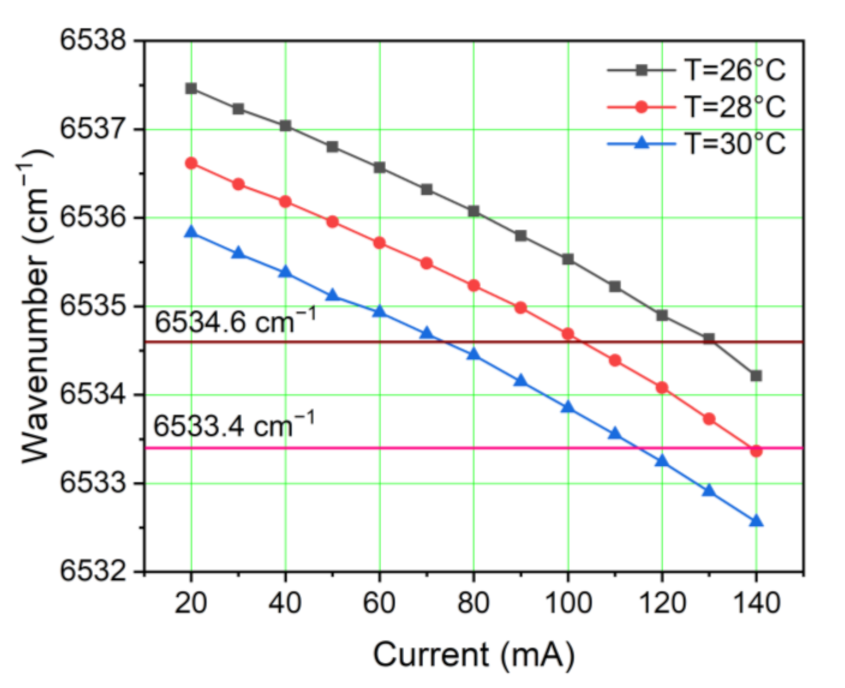
Figure 1. Emission characteristic of the 1530.33 nm CW-DFB diode laser.
Sensors 21 04548 g001
Figure 2. Simulation absorption spectra based on HITRAN database: (a) absorption line strength of different gases; (b) absorption coefficient of NH3 at 296 K, standard atmospheric pressure, and an optical path length of 1 cm for 10,000 ppm NH3:N2.
Sensors 21 04548 g002
Figure 3. Schematic diagram of the LITES sensor system.
Sensors 21 04548 g003
Figure 4. Normalized and squared amplitude as a function of frequency.
Sensors 21 04548 g004
Figure 5. The correlation between normalized 2f signal value and ventilation time.
Sensors 21 04548 g005
Figure 6. The correlation between wavelength modulation depth and 2f signal value.
Sensors 21 04548 g006
Figure 7. (a) 2f signal of 10,000 ppm NH3:N2; (b) noise level of NH3-LITES sensor.
Sensors 21 04548 g007
Figure 8. 2f signal of mixture gas with different NH3 concentrations.
Sensors 21 04548 g008
Figure 9. Linear fits of 2f signal peak values and NH3 concentration.
Sensors 21 04548 g009
Publisher’s Note: MDPI stays neutral with regard to jurisdictional claims in published maps and institutional affiliations.