Article

Silver-Assembled Silica Nanoparticles in Lateral Flow Immunoassay for Visual Inspection of Prostate-Specific Antigen

1
Department of Bioscience and Biotechnology, Konkuk University, Seoul 05029, Korea
2
Department of Chemistry Education, Seoul National University, Seoul 05029, Korea
3
BioSquare Inc., Seongnam 13620, Korea
4
Department of Radiology, Stanford University School of Medicine, Stanford, CA 94305, USA
5
Molecular Imaging Program at Stanford, Stanford University School of Medicine, Stanford, CA 94305, USA
6
Department of Chemical and Biological Engineering, Hanbat National University, Daejeon 34158, Korea
7
School of International Engineering and Science, Jeonbuk National University, Jeonju 54896, Korea
8
Department of Urology, Seoul National University Bundang Hospital, Seongnam 13620, Korea
9
Department of Nuclear Medicine, Seoul National University Bundang Hospital, Seongnam 13620, Korea
*
Authors to whom correspondence should be addressed.
Sensors 2021, 21(12), 4099; https://doi.org/10.3390/s21124099
Submission received: 6 May 2021 / Revised: 10 June 2021 / Accepted: 12 June 2021 / Published: 15 June 2021
(This article belongs to the Special Issue Lateral Flow Immunoassay: Advances and Applications)

Abstract

:
Prostate-specific antigen (PSA) is the best-known biomarker for early diagnosis of prostate cancer. For prostate cancer in particular, the threshold level of PSA <4.0 ng/mL in clinical samples is an important indicator. Quick and easy visual detection of the PSA level greatly helps in early detection and treatment of prostate cancer and reducing mortality. In this study, we developed optimized silica-coated silver-assembled silica nanoparticles (SiO2@Ag@SiO2 NPs) that were applied to a visual lateral flow immunoassay (LFIA) platform for PSA detection. During synthesis, the ratio of silica NPs to silver nitrate changed, and as the synthesized NPs exhibited distinct UV spectra and colors, most optimized SiO2@Ag@SiO2 NPs showed the potential for early prostate cancer diagnosis. The PSA detection limit of our LFIA platform was 1.1 ng/mL. By applying each SiO2@Ag@SiO2 NP to the visual LFIA platform, optimized SiO2@Ag@SiO2 NPs were selected in the test strip, and clinical samples from prostate cancer patients were successfully detected as the boundaries of non-specific binding were clearly seen and the level of PSA was <4 ng/mL, thus providing an avenue for quick prostate cancer diagnosis and early treatment.

Graphical Abstract

1. Introduction

Biomarker detection facilitates early diagnosis and monitoring of disease status, such as in cancer [1]. Cancer cells generate a variety of biomarkers, and their detection provides important information about the type and present stage of the target cancer [2]. Immunological assays have been commonly used for the detection of these biomarkers in a non- or minimally-invasive manner [3,4,5]. Typical techniques for immunological analysis include enzyme-linked immunosorbent assay (ELISA), radio immunoassay (RIA), and the fluorescent antibody (Ab) (FA) technique [6,7,8]. Among these, ELISA is a representative immunological analysis method widely used as a diagnostic tool in medicine due to its high reproducibility and strong quantitative approach [9], but it requires large amounts of samples (20–200 μL), has a lengthy analysis time (1.5–3 h), and requires expensive instrumentation for quantitative analysis [10]. An alternative to ELISA, paper-based ELISA, in which paper is used as a substrate for AB immobilization, can be performed quickly (~1 h) using a small amount of the sample (1–10 μL) and simple equipment (commercial scanners); however, a disadvantage is that it has a lower sensitivity than conventional ELISA [10,11].
Recent focus has centered on another alternative, lateral flow immunoassay (LFIA), which involves the use of a test strip. LFIA is widely used for clinical diagnosis as well as for food safety, animal health, and environmental monitoring. LFIA can be performed quickly for clinical diagnosis applications because there is no additional sedimentation or cleaning procedure during the Ab–antigen binding process. It can also be used for early diagnosis using cancer biomarkers in a variety of samples, such as saliva, urine, and serum [12,13,14], and has the advantage of being simpler and more economical than ELISA. Since early cancer diagnosis is very important for cancer treatment and can increase patient survival rates, LFIA can be applied in early cancer diagnosis to maximize survival [15].
Among the various kind of cancers, prostate cancer is the second most diagnosed cancer in the world and is the sixth leading cause of cancer-related death worldwide [16]. Prostate-specific antigen (PSA) was known to be reproducible in blood of men without biopsy of target tissue that has increased levels in prostate cancer, is detectable in the early stages of prostate cancer and was the most reliable biomarker for monitoring prognosis [17,18,19,20]. Early diagnosis of prostate cancer by PSA detection lowers the mortality rate and plays an important role in treatment [21,22]. Conventional tests for prostate cancer diagnoses using PSA are mainly performed in centralized laboratories using large-scale automated analyzers, and the associated medical costs increase due to various reasons, such as sample transport, increased waiting time, and simple management. However, these detection methods often lead to over-treatment and over-diagnosis; hence, there is a need for a method that can detect PSA quickly, accurately, and economically [19,21]. Using LFIA for prostate cancer diagnosis, PSA can be detected at low costs and in a shorter duration, increasing patient satisfaction. Traditionally, the normal PSA level that is acceptable as the basis for biopsy in phase 3 clinical studies of early prostate cancer screening is <4.0 ng/mL [20], and this serves as an important indicator for judging the presence or absence of prostate cancer via LFIA [23,24].
To analyze clinical samples in LFIA, we used a silica NP-based assembly of silver NPs (AgNPs). Among the various metal NPs, AgNPs can be synthesized as nanomaterials with the desired chemical, morphological, and optical properties by controlling the reaction conditions [25]. When these AgNPs are manufactured in assembly form, they can have added advantages in biological applications as their optical effect is maximized [26,27]. It is known that the assembly structure is capable of controlling localized surface plasmon resonance (LSPR) and shows better scattering properties than single NPs [28]. In LFIA, outcomes such as low LOD using assembly-type nanoprobes have already been demonstrated [29,30]. As such, the use of assembly-type nanoprobes is a good way to lower the LOD in LFIA, but as far as we know, PSA detection through LFIA using assembled AgNP structures has not been reported.
Here, we present an LFIA system using optimized silica-coated silver-assembled silica (SiO2@Ag@SiO2) NPs that can be detected in PSA from serum. Three types of SiO2@Ag@SiO2 NPs, capable of absorbing a wide range of wavelengths, were synthesized by precisely controlling the amount of AgNPs on the silica NPs. Absorption of a wide range of wavelengths showed improved LOD in PSA detection compared to other SiO2@Ag@SiO2 NPs. Furthermore, when clinical samples were introduced and developed, all test strip results were clearly distinguished with the naked eye compared to a negative control using SiO2@Ag@SiO2 NPs.

2. Materials and Methods

2.1. Materials

Tetraethyl orthosilicate (TEOS), (3-mercaptopropyl)trimethoxysilane (MPTS), ethylene glycol (EG), silver nitrate (AgNO3, 99.99%), octylamine (OA), sodium silicate solution, (3-aminopropyl)triethoxysilane (APTS), succinic anhydride, N, N-diisopropylethylamine (DIEA), N-(3-dimethylaminopropyl)-N′-ethylcarbodiimide hydrochloride (EDC), N-hydroxysulfosuccinimide sodium salt (Sulfo-NHS), 2-(N-morpholino)ethanesulfonic acid (MES) hydrate, phosphate-buffered saline (PBS, pH 7.4), TWEEN® 20, 11-mercaptoundecanoic acid (11-MUA), and ethanolamine were purchased from Sigma–Aldrich (St. Louis, MO, USA). Ethyl alcohol (EtOH, 99.9%), aqueous ammonium hydroxide (NH4OH, 27%), and 1-methyl-2-pyrrolidinone (NMP) were purchased from Daejung (Siheung, Korea). Amino polyethylene glycol (PEG) Acid (NH2–PEG–COOH, MW = 600 Da) was purchased from Nanocs Inc. (New York, NY, USA). The backing card, nitrocellulose (NC) membrane, absorbent pad, cassette, mouse monoclonal anti-PSA Ab (14,801 and 14,803), and goat anti-rabbit IgG Ab were purchased from Bore Da Biotech Co. Ltd. (Seongnam, Korea).

2.2. Synthesis of SiO2@Ag@SiO2 NPs

SiO2 NPs were synthesized using a modified Stöber method [25]. A solution containing TEOS (1.6 mL), NH4OH (3 mL), and absolute EtOH (40 mL) was stirred for 20 h at 25 °C. The solution was washed several times with absolute EtOH by centrifugation at 8885 rcf for 10 min repeatedly. To introduce thiol groups, SiO2 NPs (200 mg) were mixed with absolute EtOH (4 mL), MPTS (200 μL), and NH4OH (40 μL) for 12 h at 25 °C. The solution was washed several times with absolute EtOH by centrifugation at 8885 rcf for 10 min. Following thiol-functionalization, AgNPs were introduced onto the surface of SiO2 NPs by using a modified polyol process. In this process, each SiO2@Ag NP was introduced by using different amounts of AgNO3: 2.6 mg AgNO3 per 1 mg SiO2 NPs, 0.9 mg AgNO3 per 1 mg SiO2 NPs, and 0.5 mg AgNO3 per 1 mg SiO2 NPs with PVP (MW 40,000) in 50 mL EG. Then, 41.4 μL OA was added sequentially to each solution, and the solutions were stirred for 1 h at 25 °C. Each solution was washed several times with absolute EtOH by centrifugation at 8885 rcf for 10 min. Silica shells were introduced to each SiO2@Ag NP via the modified silica coating method [31]. Each SiO2@Ag NP (1 mg) was dispersed in 1 mL absolute EtOH with 0.15 mM 11-MUA and stirred for 1 h at 25 °C. Then, each SiO2@Ag NP was dispersed in 15 mL aqueous sodium silicate solution (0.036 wt%) and stirred for 15 h at 25 °C. Subsequently, 60 mL absolute EtOH was added to each solution and stirred for 3 h at 25 °C to form a thin silica shell. After 3 h, 30 μL TEOS and aqueous ammonium hydroxide (28–30%, 250 μL) were added to each solution and stirred for 24 h at 25 °C. The resulting SiO2@Ag@SiO2 NP2.6, SiO2@Ag@SiO2 NP0.9, and SiO2@Ag@SiO2 NP0.5 were washed several times with absolute EtOH by centrifugation at 8885 rcf for 10 min.

2.3. Conjugation for Ab

Ab conjugation were explained as a schematic illustration (Supplementary Materials: Figure S1). For the introduction of amine groups to the surface, each SiO2@Ag@SiO2 NP (1 mg) was mixed with APTS (10 μL) and NH4OH (10 μL) for 1 h at 25 °C. The mixture was washed several times with NMP by centrifugation at 15,928 rcf for 10 min. To introduce carboxyl groups onto the surface of amine-functionalized SiO2@Ag@SiO2 NPs, they were dispersed in NMP (500 μL consisting of 1.75 mg succinic anhydride), and the mixture was added to DIEA (3.05 μL) and stirred for 2 h at 25 °C. The mixture was washed several times with deionized water (DW) by centrifugation at 15,928 rcf for 10 min, followed by redispersion in MES (50 mM). Carboxyl-functionalized SiO2@Ag@SiO2 NPs were added to EDC (2 mg) and sulfo-NHS (2 mg), and the mixture was stirred for 30 min at 25 °C. The supernatant was removed, followed by dispersion in MES (50 mM). The activation group-functionalized SiO2@Ag@SiO2 NPs were added to NH2-PEG600-COOH (1.6 mM), and the mixture was stirred for 2 h at 25 °C. For surface blocking, SiO2@Ag@SiO2 NP–PEG-COOH was added to ethanolamine (3.2 μL) and stirred for 30 min at 25 °C. The mixture was washed several times with DW by centrifugation at 15,928 rcf for 10 min and redispersed in MES (50 mM). SiO2@Ag@SiO2 NP–SNs–PEG-COOH was added to EDC (2 mg) and sulfo-NHS (2 mg) and stirred for 30 min at 25 °C. The supernatant was removed and dispersed in MES (50 mM). The activation group-supplemented SiO2@Ag@SiO2 NP–SNs–PEG-COOH was added to anti-PSA Ab (14,803) and stirred for 2 h at 25 °C. After centrifugation, SiO2@Ag@SiO2 NP–SNs–PEG-PSA Ab was added to ethanolamine (3.2 μL) and stirred for 30 min at 25 °C. The mixture was washed several times with 0.5% bovine serum albumin (BSA) by centrifugation at 15,928 rcf for 10 min and redispersed in 0.5% BSA.

2.4. Preparation of Test Strips

The test strip consisted of a backing card, NC membrane, and absorbent pad. After assembling the NC membrane on the backing card, the test line was sprayed with anti-PSA Ab (14,801, 1 mg/mL) using a dispenser, and the control line was sprayed with goat anti-rabbit IgG Ab (1 mg/mL). The assembly was dried for 2 h. Thereafter, 0.1% BSA was applied to the assembly and dried for at least a day. Finally, the absorbent pad was assembled on the backing card. After cutting the strip to a length of 0.4 cm, the test strip preparation was completed.

2.5. Analysis of Colored Band of the Test Line on the Test Strip

To measure the intensity of the colored band of the test line on the test strip, each strip was captured as an 8-byte image using ImageQuant LAS-4000 (GE Healthcare, Chicago, IL, USA) [32]. Captured images were analyzed using the ImageJ software (ver. 1.53a, National Institutes of Health, Bethesda, MD, USA).

2.6. Characterization of SiO2@Ag@SiO2 NPs

Transmission electron microscopy (TEM) images were obtained using a LIBRA 120 (Carl Zeiss, Oberkochen, Germany). UV–vis extinction spectra were obtained with an Optigen 2120 UV spectrophotometer (Mecasys, Daejeon, Korea).

3. Results and Discussion

3.1. Synthesis of Each SiO2@Ag@SiO2 NP

The synthesis procedure for each SiO2@Ag@SiO2 NP is shown in Figure 1 [26,33]. In the process of assembling AgNPs on SiO2 NPs, we attempted to evaluate optimized SiO2@Ag@SiO2 NPs for detecting specific PSA concentrations on an LFIA platform based on the pattern formed with the introduction of AgNPs. The nanoprobes used in an optimized LFIA can affect the antigen–Ab interaction and LOD [34,35]. Additionally, SiO2 NPs were synthesized by using the sol–gel process based on the Stöber method. They were analyzed via TEM and were found to be spherical, monodispersed, and uniformly sized (167 ± 3.5 nm, n = 30; Figure S2). Then, a thiol group was introduced on the surface of each SiO2 NP via a reaction with MPTS. For the fabrication of the assembled AgNPs and SiO2 NPs (SiO2@Ag NPs), AgNPs were allowed to develop on the surface of SiO2 NPs, which introduced the thiol group. Octylamine and ethylene glycol have important roles in the nucleation and growth of AgNPs on the surface of SiO2 NPs [36], and silver ions were effectively reduced on the surface of SiO2 NPs because of the interaction between the thiol groups of MPTS and the silver ions, producing AgNPs. Simultaneously, it was confirmed that three types of SiO2@Ag NPs, named according to their AgNO3 and SiO2 NP ratios (SiO2@Ag NP2.6, SiO2@Ag NP0.9, and SiO2@Ag NP0.5) were synthesized by adjusting the amount of AgNO3 (Figure S3). Subsequently, 11-MUA, which has both terminal thiol and carboxyl groups, was introduced to the surface of the particles to functionalize the surface of AgNPs and facilitate an additional silica coating of the surface [31]. To prevent aggregation and facilitate additional surface modifications, each SiO2@Ag NP was encapsulated in an outer silica shell, and three types of silica shell-coated SiO2@Ag NPs (SiO2@Ag@SiO2 NP2.6, SiO2@Ag@SiO2 NP0.9, and SiO2@Ag@SiO2 NP0.5) were finally synthesized. TEM images (Figure 2a–c) show that all SiO2@Ag@SiO2 NPs were well encapsulated within the silica shell. The plasmon resonance spectra of all SiO2@Ag@SiO2 NP solutions were analyzed by UV–vis spectroscopy (Figure 2d). SiO2@Ag@SiO2 NPs produced by controlling the amount of AgNO3 were red-shifted as the amount of SiO2 NPs was reduced, indicating the induced surface plasmon resonance shift, which agreed with a previous study [37]. Moreover, each synthesized SiO2@Ag@SiO2 NP was visually compared in ethyl alcohol (Figure 2e). Their color, which was highly dependent on synthesized AgNPs, gradually changed from yellow to dark gray as the amount of SiO2 NPs decreased. By controlling the amount of AgNO3 during the synthesis of SiO2@Ag@SiO2 NPs, we successfully synthesized three types of SiO2@Ag@SiO2 NPs and confirmed that the synthesized particles had plasmon resonance spectra.

3.2. Measurement of the Scattering Effect in the NC Membrane on the Test Strip

Before application of each SiO2@Ag@SiO2 NP to LFIA, we confirmed the scattering effect of light in the NC membrane in the test strip. Normally, the colored band representing the result of the NC membrane absorbs and scatters light according to the plasmon properties of the probe [38]. Referring to the previous study, a series of three consecutive 1/2 dilutions of SiO2@Ag@SiO2 NP2.6, SiO2@Ag@SiO2 NP0.9, and SiO2@Ag@SiO2 NP0.5 were used [39]. The prepared samples were dropped by spotting on the NC membrane, and visibility by scattering of color spots according to NP dilution was confirmed. First, 0.5 μL of each sample was dropped onto the NC membrane and dried, and then the NC membrane was scanned through a commercial scanner (L3150, Epson, Suwa, Japan) (Figure 3a). Figure 3b shows an image of colored spots obtained by applying a double dilution (top to bottom). Visual examination showed that the colored spot faded as each sample was diluted. When all probes were diluted to ¼ of the initial concentration, only the color intensity of SiO2@Ag@SiO2 NP2.6 was observed. To compare the color intensities among all particles, the intensity of each colored spot was measured using the ImageJ software (Figure 3c). SiO2@Ag@SiO2 NP2.6 had the brightest spot when compared to other samples. The different scattering effects shown based on conditions in the actual NC membrane indicate the possibility of detecting various biomarkers with different diagnostic criteria by using particles under different conditions. Unlike the single AuNP, AgNPs on the surface of fabricated particles were located close to each other. In particular, in the case of SiO2@Ag@SiO2 NP2.6, AgNPs were too closely embedded, so they were attached with a distance of a few nanometers. Because this distance of a few nanometers can enhance the LSPR effect, SiO2@Ag@SiO2 NP2.6 showed the highest signal intensity among the fabricated particles.

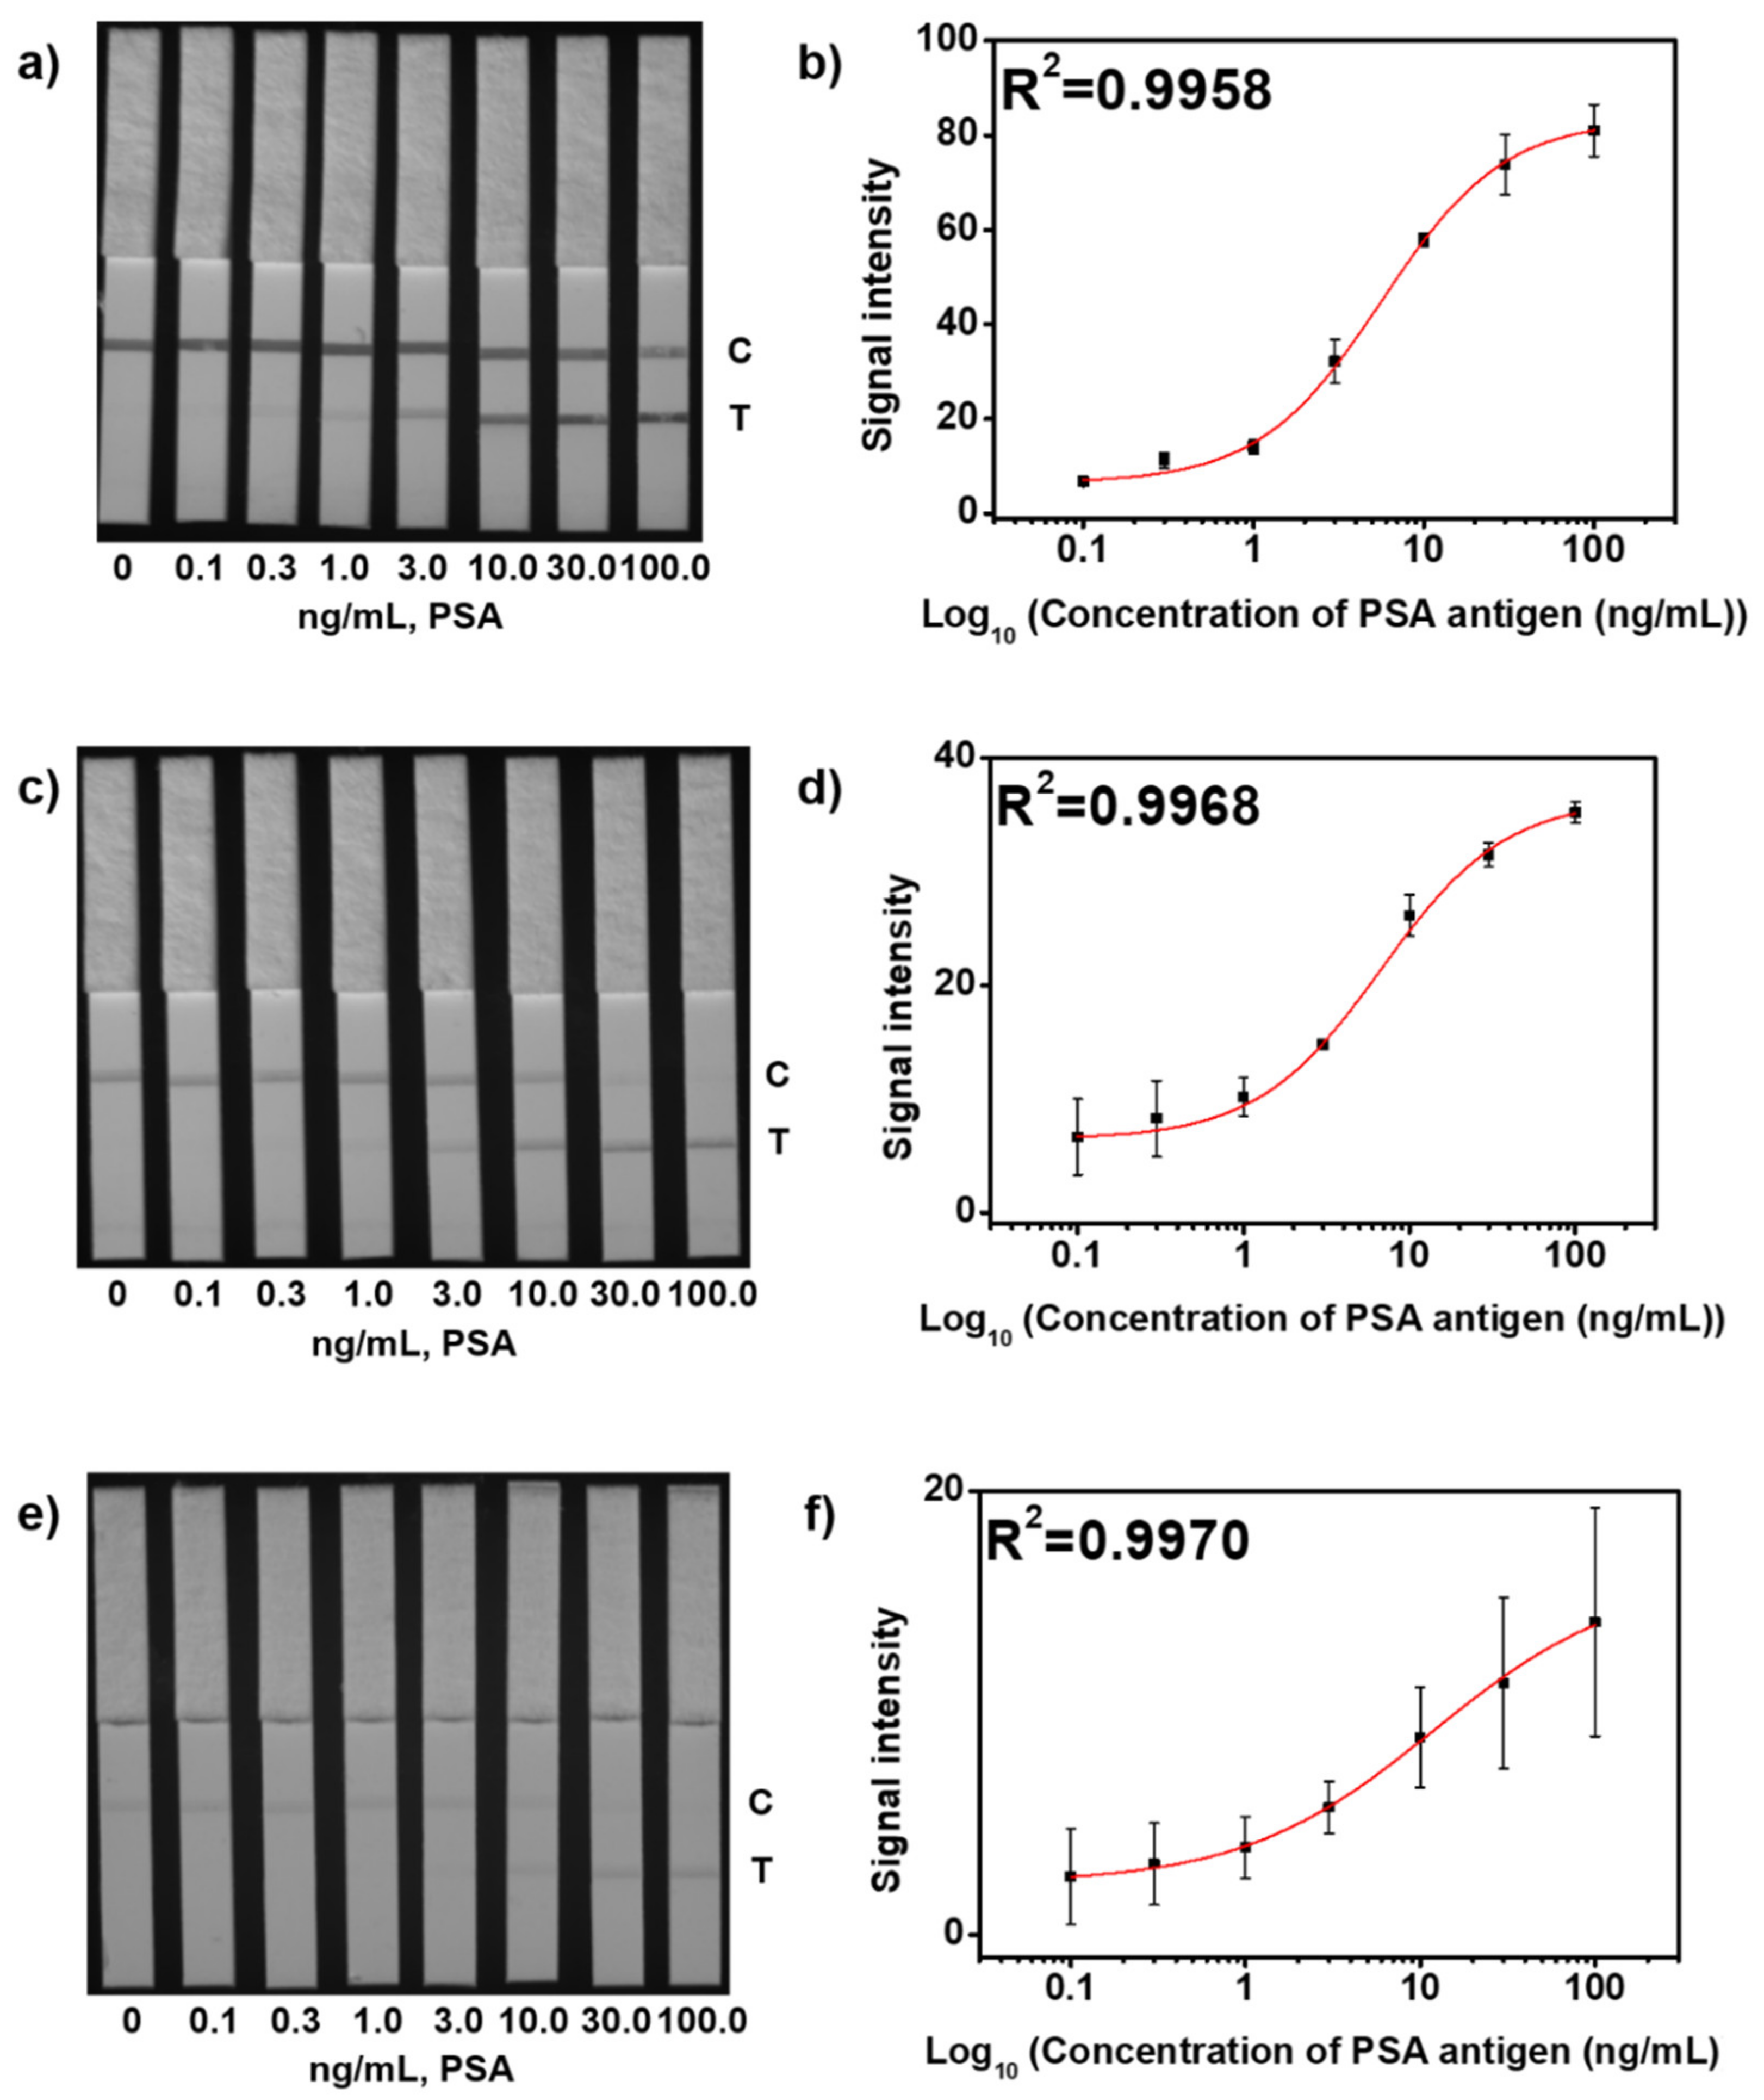
3.3. Applications of SiO2@Ag@SiO2 NPs as Probe in LFIA

To detect PSA in LFIA via the dipstick method, as schematically illustrated in Figure 4, we used a test strip consisting of an NC membrane and an absorbent pad on the backing card. In the NC membrane, anti-PSA Ab (primary Ab; 14,801) was dispensed onto the test line, and goat anti-rabbit IgG (secondary Ab) was dispensed onto the control line. For application of SiO2@Ag@SiO2 NPs, the surfaces of all SiO2@Ag@SiO2 NPs were conjugated with anti-PSA Ab (detection Ab; 14,803) using the well-known EDC/sulfo-NHS coupling reaction [40]. Here, the surfaces of all SiO2@Ag@SiO2 NPs were first conjugated with NH2-PEG600-COOH to prevent aggregation and then with anti-PSA Ab (14,803). To develop the NPs of corresponding concentration, each SiO2@Ag@SiO2 NP (3 μg) was mixed with the same amount of PSA in a 96-well plate. Then, the test strip was dipped into the corresponding well and developed, and the results were confirmed by a change in the intensity of the colored band of each test line in the test strip.
To observe the change in intensity of the colored band of the test line on the test strip based on the amount of PSA antigen with each SiO2@Ag@SiO2 NP, test strips were dipped in each corresponding well that contained a complex of a different concentration of PSA (0–100.0 ng/mL) with each SiO2@Ag@SiO2 NP. After 10 min, the result from each test strip was confirmed. First, non-specific binding was not observed in all test strips with 0 ng/mL developed (Figure 5a,c,e and Figure S3). The visual appearance of the colored band of the test line for each test strip was different at low concentrations. Visualization was possible for the colored band of the test line in the test strip using SiO2@Ag@SiO2 NP2.6 at 1.0 ng/mL, SiO2@Ag@SiO2 NP0.9 at 3.0 ng/mL, and SiO2@Ag@SiO2 NP0.5 at 10.0 ng/mL, and they could all be observed with the naked eye. When the LOD of the colored band in the test line for each probe was calculated using a logistic curve, the LOD of the test strip with SiO2@Ag@SiO2 NP2.6 was 1.1 ng/mL, SiO2@Ag@SiO2 NP0.9 was 3.0 ng/mL, and SiO2@Ag@SiO2 NP0.5 was 6.5 ng/mL (Figure 5b,d,f). This shows that using SiO2@Ag@SiO2 NP2.6 as a probe in LFIA can lower the LOD effectively.
In addition, we verified reproducibility and selectivity [41]. First, in a total of 10 batches of test strips, SiO2@Ag@SiO2 NP2.6 was used as a probe, and when 100 ng/mL of PSA was developed, 95.8% of reproducibility was shown, indicating excellent reproducibility (Figure S4a). In addition, when α-fetoprotein (AFP) and newborn calf serum (NCS) were developed, only PSA was selectively detected (Figure S4b).

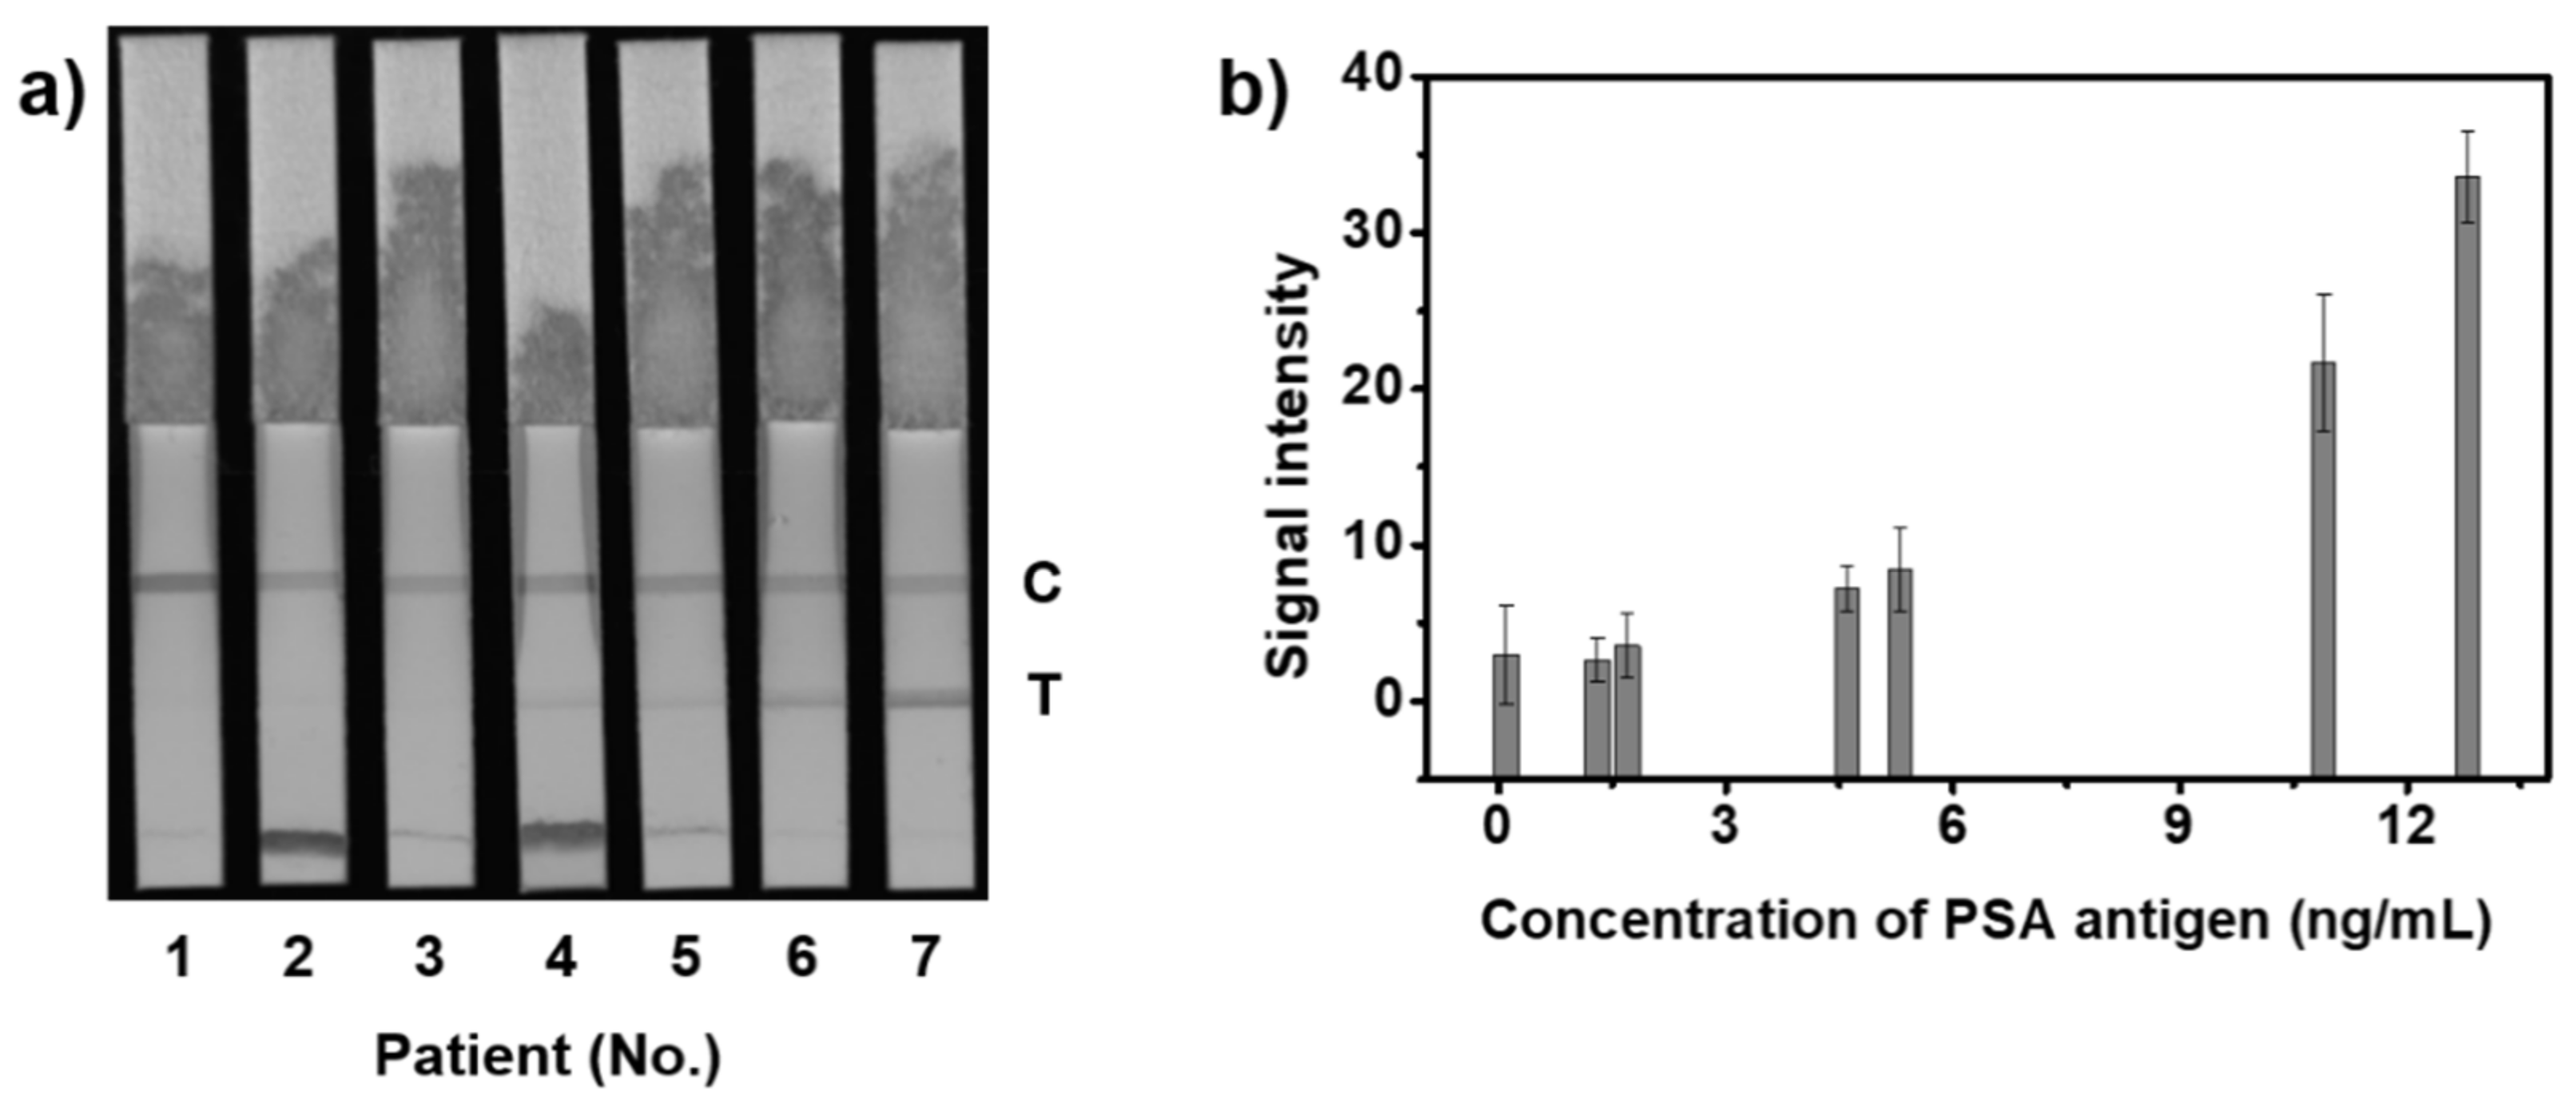
3.4. Detection in Clinical Samples

Based on the results obtained from the analysis of the change in color intensity with the amount of PSA, we conducted LFIA using newly constructed NPs. Among these, SiO2@Ag@SiO2 NP2.6 was employed as a probe for application to clinical samples in LFIA, and all clinical samples were collected from men in their 20s and 50s. Thus, we selected clinical samples spiked with PSA concentrations <0.1 ng/mL (i), negative control, 1.3 ng/mL (ii), 1.7 ng/mL (iii), 4.6 ng/mL (iv), 5.3 ng/mL (v), 10.9 ng/mL (vi), and 12.8 ng/mL (vii). In Figure 6a and Figure S5, the colored bands of the test line on the test strip that were classified as early and late stages clearly differed from those of the negative control, and the visual appearances of clinical samples i and ii, which were classified as normal, were similar to the negative control. Moreover, the intensities of normal clinical samples and negative control were similar, and the intensity of each clinical sample was slightly different in each section (Figure 6b). Therefore, these results indicate that the LFIA platform using SiO2@Ag@SiO2 NP2.6 as a probe is potentially useful for early prostate cancer diagnosis.

4. Conclusions

We fabricated an LFIA platform that can detect PSA at low concentrations and on which PSA levels in clinical samples can be observed with an optimized SiO2@Ag@SiO2 NP probe. For optimal probe selection, SiO2@Ag@SiO2 NP2.6, SiO2@Ag@SiO2 NP0.9, and SiO2@Ag@SiO2 NP0.5 probes that exhibited distinct color and plasmon resonance spectra were synthesized by elaborately introducing AgNPs onto silica NPs. In addition, results from the application of SiO2@Ag@SiO2 NPs to the LFIA platform could be confirmed within 10 min, and the change in intensity of the colored band of the test line on the test strip based on the amount of PSA antigen showed that the best probe, SiO2@Ag@SiO2 NP2.6, lowered the LOD approximately two and a half times more than conventional colloid AuNPs used in LFIA. This LFIA platform using SiO2@Ag@SiO2 NP10 as a probe provided easy visual observation of the PSA levels unaided by an additional device, demonstrating the possibility for similar detection of other target proteins.

Supplementary Materials

The following are available online at https://www.mdpi.com/article/10.3390/s21124099/s1, Figure S1: Schematic illustration of surface modification and conjugation of anti-PSA antibody onto the surface of fabricated particles. Figure S2: Transmission electron microscopy (TEM) images of silica nanoparticles (SiO2 NPs). Figure S3: TEM images of each SiO2@Ag NPs. (a) SiO2 NP@Ag NP2.6, (b) SiO2@Ag NP0.9, and (c) SiO2@Ag NP0.5. Figure S4: Digital photographic images of each test strip in Figure 5. (a) SiO2@Ag@SiO2 NP2.6, (b) SiO2@Ag@SiO2 NP0.9, and (c) SiO2@Ag@SiO2 NP0.5. Figure S5: Reproducibility and selectivity test using SiO2@Ag@SiO2 NP2.6. (a) Test of reproducibility using SiO2@Ag@SiO2 NP2.6 as a signal reporter with PSA of 100 ng/mL in LFIA. (i) Color images and (ii) measurement of signal intensity. (b) Test of Selectivity using SiO2@Ag@SiO2 NP2.6 as a signal reporter with Color images of (i) PSA of 100 ng/mL, (ii) α-fetoprotein (AFP) 100 ng/mL, (iii) newborn calf serum (NCS) in LFIA, and (iv) measurement of signal intensity. Figure S6: The digital photographic image of each test strip in Figure 6.

Author Contributions

Conceptualization, H.-M.K., H.-Y.L. and B.-H.J.; methodology, H.-M.K., J.K., S.B. and J.A.; investigation, H.-M.K., Y.-S.C., M.G.C., H.S. and J.-W.K.; formal analysis, X.-H.P., B.S., W.K., Y.-H.K. and W.-Y.R.; software, S.-m.P. and S.H.L.; writing—original draft preparation, H.-M.K.; writing—review and editing, S.L., D.H.J., H.-Y.L. and B.-H.J.; supervisor, H.-Y.L. and B.-H.J. All authors have read and agreed to the published version of the manuscript.

Funding

This research was funded by the Korean Health Technology R&D Project, Ministry of Health & Welfare (HI17C1264), WTU Joint Research Grant of Konkuk University in 2018 (2018-A019-0462). This work was supported by the National Research Foundation of Korea (NRF) grant funded by the Korea government (MSIT) (No. 2019R1F1A1063454). And this paper was funded by Leaders in Industry-university Cooperation and project by NRF grant funded by the Ministry of Education.

Institutional Review Board Statement

The study design was approved by the Seoul National University Bundang Hospital (IRB No. B 1711/432–302).

Informed Consent Statement

Before starting this study, all clinical samples were obtained with written informed consent.

Data Availability Statement

The data presented in this study are available on request from the corresponding author.

Conflicts of Interest

The authors declare no conflict of interest.

References

  1. Wu, L.; Qu, X. Cancer biomarker detection: Recent achievements and challenges. Chem. Soc. Rev. 2015, 44, 2963–2997. [Google Scholar] [CrossRef]
  2. Arya, S.K.; Estrela, P. Recent advances in enhancement strategies for electrochemical ELISA-based immunoassays for cancer biomarker detection. Sensors 2018, 18, 2010. [Google Scholar] [CrossRef] [PubMed] [Green Version]
  3. Jedinak, A.; Loughlin, K.R.; Moses, M.A. Approaches to the discovery of non-invasive urinary biomarkers of prostate cancer. Oncotarget 2018, 9, 32534–32550. [Google Scholar] [CrossRef] [PubMed]
  4. Qin, C.; Tao, L.; Phang, Y.H.; Zhang, C.; Chen, S.Y.; Zhang, P.; Tan, Y.; Jiang, Y.Y.; Chen, Y.Z. The assessment of the readiness of molecular biomarker-based mobile health technologies for healthcare applications. Sci. Rep. 2015, 5, 17854–17868. [Google Scholar] [CrossRef] [PubMed] [Green Version]
  5. Park, S.-m.; Aalipour, A.; Vermesh, O.; Yu, J.H.; Gambhir, S.S. Towards clinically translatable in vivo nanodiagnostics. Nat. Rev. Mater. 2017, 2, 1–20. [Google Scholar] [CrossRef] [PubMed]
  6. Kim, J.J.; Trivedi, N.N.; Wilson, D.M.; Mahalingam, S.; Morrison, L.; Tsai, A.; Chattergoon, M.A.; Dang, K.; Patel, M.; Ahn, L. Molecular and immunological analysis of genetic prostate specific antigen (PSA) vaccine. Oncogene 1998, 17, 3125–3135. [Google Scholar] [CrossRef] [Green Version]
  7. Grange, R.; Thompson, J.; Lambert, D. Radioimmunoassay, enzyme and non-enzyme-based immunoassays. Br. J. Anaesth. 2014, 112, 213–216. [Google Scholar] [CrossRef] [Green Version]
  8. Machado, E.R.; Teixeira, E.M.; Goncalves-Pires, M.D.R.F.; Loureiro, Z.M.; Araujo, R.A.; Costa-Cruz, J.M. Parasitological and immunological diagnosis of Strongyloides stercoralis in patients with gastrointestinal cancer. Scand. J. Infect. Dis. 2008, 40, 154–158. [Google Scholar] [CrossRef]
  9. Quinn, C.P.; Semenova, V.A.; Elie, C.M.; Romero-Steiner, S.; Greene, C.; Li, H.; Stamey, K.; Steward-Clark, E.; Schmidt, D.S.; Mothershed, E. Specific, sensitive, and quantitative enzyme-linked immunosorbent assay for human immunoglobulin G antibodies to anthrax toxin protective antigen. Emerg. Infect. Dis. 2002, 8, 1103–1110. [Google Scholar] [CrossRef]
  10. Anwar, M.; Tayyab, M.; Kashif, M.; Afzal, N. Paper Based vs. Conventional Enzyme Linked Immuno-Sorbent Assay: A Review of Literature. Int. Clin. Pathol. J. 2016, 3, 00079. [Google Scholar] [CrossRef]
  11. Murdock, R.C.; Shen, L.; Griffin, D.K.; Kelley-Loughnane, N.; Papautsky, I.; Hagen, J.A. Optimization of a paper-based ELISA for a human performance biomarker. Anal. Chem. 2013, 85, 11634–11642. [Google Scholar] [CrossRef]
  12. Miočević, O.; Cole, C.R.; Laughlin, M.J.; Buck, R.L.; Slowey, P.D.; Shirtcliff, E.A. Quantitative lateral flow assays for salivary biomarker assessment: A review. Front. Public Health 2017, 5, 133–145. [Google Scholar] [CrossRef] [PubMed] [Green Version]
  13. Lei, Q.; Zhao, L.; Ye, S.; Sun, Y.; Xie, F.; Zhang, H.; Zhou, F.; Wu, S. Rapid and quantitative detection of urinary Cyfra21-1 using fluorescent nanosphere-based immunochromatographic test strip for diagnosis and prognostic monitoring of bladder cancer. Artif. Cells Nanomed. Biotechnol. 2019, 47, 4266–4272. [Google Scholar] [CrossRef] [Green Version]
  14. Lu, L.; Yu, J.; Liu, X.; Yang, X.; Zhou, Z.; Jin, Q.; Xiao, R.; Wang, C. Rapid, quantitative and ultra-sensitive detection of cancer biomarker by a SERRS-based lateral flow immunoassay using bovine serum albumin coated Au nanorods. RSC Adv. 2020, 10, 271–281. [Google Scholar] [CrossRef] [Green Version]
  15. Chen, X.; Gole, J.; Gore, A.; He, Q.; Lu, M.; Min, J.; Yuan, Z.; Yang, X.; Jiang, Y.; Zhang, T. Non-invasive early detection of cancer four years before conventional diagnosis using a blood test. Nat. Commun. 2020, 11, 1–10. [Google Scholar] [CrossRef]
  16. Culp, M.B.; Soerjomataram, I.; Efstathiou, J.A.; Bray, F.; Jemal, A. Recent global patterns in prostate cancer incidence and mortality rates. Eur. Urol. 2020, 77, 38–52. [Google Scholar] [CrossRef] [PubMed]
  17. Madu, C.O.; Lu, Y. Novel diagnostic biomarkers for prostate cancer. J. Cancer 2010, 1, 150–177. [Google Scholar] [CrossRef] [Green Version]
  18. Shariat, S.F.; Canto, E.I.; Kattan, M.W.; Slawin, K.M. Beyond prostate-specific antigen: New serologic biomarkers for improved diagnosis and management of prostate cancer. Rev. Urol. 2004, 6, 58–72. [Google Scholar]
  19. Bickers, B.; Aukim-Hastie, C. New molecular biomarkers for the prognosis and management of prostate cancer-the post PSA era. Anticancer Res. 2009, 29, 3289–3298. [Google Scholar]
  20. Andriole, G.L.; Crawford, E.D.; Grubb, R.L., III; Buys, S.S.; Chia, D.; Church, T.R.; Fouad, M.N.; Gelmann, E.P.; Kvale, P.A.; Reding, D.J. Mortality results from a randomized prostate-cancer screening trial. N. Engl. J. Med. 2009, 360, 1310–1319. [Google Scholar] [CrossRef] [Green Version]
  21. De Visschere, P.; Oosterlinck, W.; De Meerleer, G.; Villeirs, G. Clinical and imaging tools in the early diagnosis of prostate cancer, a review. J. Belge Radiol. 2010, 93, 62–70. [Google Scholar] [CrossRef] [Green Version]
  22. Farzin, L.; Sadjadi, S.; Shamsipur, M.; Sheibani, S. An immunosensing device based on inhibition of mediator’s faradaic process for early diagnosis of prostate cancer using bifunctional nanoplatform reinforced by carbon nanotube. J. Pharm. Biomed. Anal. 2019, 172, 259–267. [Google Scholar] [CrossRef] [PubMed]
  23. Punglia, R.S.; D’Amico, A.V.; Catalona, W.J.; Roehl, K.A.; Kuntz, K.M. Effect of verification bias on screening for prostate cancer by measurement of prostate-specific antigen. N. Engl. J. Med. 2003, 349, 335–342. [Google Scholar] [CrossRef] [PubMed] [Green Version]
  24. Oremek, G.; Sapoutzis, N.; Eden, F.; Jonas, D. Complexed PSA in routine diagnosis. Anticancer Res. 2003, 23, 975–977. [Google Scholar]
  25. Stöber, W.; Fink, A.; Bohn, E. Controlled growth of monodisperse silica spheres in the micron size range. J. Colloid Interface Sci. 1968, 26, 62–69. [Google Scholar] [CrossRef]
  26. Kim, J.-H.; Kim, J.-S.; Choi, H.; Lee, S.-M.; Jun, B.-H.; Yu, K.-N.; Kuk, E.; Kim, Y.-K.; Jeong, D.H.; Cho, M.-H. Nanoparticle probes with surface enhanced Raman spectroscopic tags for cellular cancer targeting. Anal. Chem. 2006, 78, 6967–6973. [Google Scholar] [CrossRef] [PubMed]
  27. Kim, H.-M.; Kim, D.-M.; Jeong, C.; Park, S.Y.; Cha, M.G.; Ha, Y.; Jang, D.; Kyeong, S.; Pham, X.-H.; Hahm, E. Assembly of plasmonic and magnetic nanoparticles with fluorescent silica shell layer for tri-functional SERS-magnetic-fluorescence probes and its bioapplications. Sci. Rep. 2018, 8, 1–10. [Google Scholar] [CrossRef]
  28. Liu, L.; Gao, Z.; Jiang, B.; Bai, Y.; Wang, W.; Yin, Y. Reversible assembly and dynamic plasmonic tuning of Ag nanoparticles enabled by limited ligand protection. Nano Lett. 2018, 18, 5312–5318. [Google Scholar] [CrossRef]
  29. Liu, C.; Jia, Q.; Yang, C.; Qiao, R.; Jing, L.; Wang, L.; Xu, C.; Gao, M. Lateral flow immunochromatographic assay for sensitive pesticide detection by using Fe3O4 nanoparticle aggregates as color reagents. Anal. Chem. 2011, 83, 6778–6784. [Google Scholar] [CrossRef] [PubMed]
  30. Chen, X.; Leng, Y.; Hao, L.; Duan, H.; Yuan, J.; Zhang, W.; Huang, X.; Xiong, Y. Self-assembled colloidal gold superparticles to enhance the sensitivity of lateral flow immunoassays with sandwich format. Theranostics 2020, 10, 3737–3748. [Google Scholar] [CrossRef]
  31. Cha, M.G.; Lee, S.; Park, S.; Kang, H.; Lee, S.G.; Jeong, C.; Lee, Y.-S.; Kim, C.; Jeong, D.H. A dual modal silver bumpy nanoprobe for photoacoustic imaging and SERS multiplexed identification of in vivo lymph nodes. Nanoscale 2017, 9, 12556–12564. [Google Scholar] [CrossRef]
  32. Han, K.N.; Choi, J.-S.; Kwon, J. Three-dimensional paper-based slip device for one-step point-of-care testing. Sci. Rep. 2016, 6, 1–7. [Google Scholar] [CrossRef] [PubMed] [Green Version]
  33. Kim, H.-M.; Jeong, S.; Hahm, E.; Kim, J.; Cha, M.G.; Kim, K.-M.; Kang, H.; Kyeong, S.; Pham, X.-H.; Lee, Y.-S. Large scale synthesis of surface-enhanced Raman scattering nanoprobes with high reproducibility and long-term stability. J. Ind. Eng. Chem. 2016, 33, 22–27. [Google Scholar] [CrossRef]
  34. Toubanaki, D.K.; Margaroni, M.; Prapas, A.; Karagouni, E. Development of a nanoparticle-based Lateral flow Strip Biosensor for Visual Detection of Whole nervous necrosis Virus particles. Sci. Rep. 2020, 10, 1–12. [Google Scholar] [CrossRef] [PubMed] [Green Version]
  35. Huang, X.; Huang, T.; Li, X.; Huang, Z. Flower-like gold nanoparticles-based immunochromatographic test strip for rapid simultaneous detection of fumonisin B1 and deoxynivalenol in Chinese traditional medicine. J. Pharm. Biomed. Anal. 2020, 177, 112895–112903. [Google Scholar] [CrossRef] [PubMed]
  36. Kang, H.; Kang, T.; Kim, S.; Kim, J.-H.; Jun, B.-H.; Chae, J.; Park, J.; Jeong, D.-H.; Lee, Y.-S. Base effects on fabrication of silver nanoparticles embedded silica nanocomposite for surface-enhanced raman scattering (sers). J. Nanosci. Nanotechnol. 2011, 11, 579–583. [Google Scholar] [CrossRef] [PubMed]
  37. Jeong, C.; Kim, H.-M.; Park, S.Y.; Cha, M.G.; Park, S.-J.; Kyeong, S.; Pham, X.-H.; Hahm, E.; Ha, Y.; Jeong, D.H. Highly sensitive magnetic-SERS dual-function silica nanoprobes for effective on-site organic chemical detection. Nanomaterials 2017, 7, 146. [Google Scholar] [CrossRef] [Green Version]
  38. Khlebtsov, N.G.E. Optics and biophotonics of nanoparticles with a plasmon resonance. Quantum Electron. 2008, 38, 504–529. [Google Scholar] [CrossRef]
  39. Khlebtsov, B.N.; Tumskiy, R.S.; Burov, A.M.; Pylaev, T.E.; Khlebtsov, N.G. Quantifying the numbers of gold nanoparticles in the test zone of lateral flow immunoassay strips. ACS Appl. Nano Mater. 2019, 2, 5020–5028. [Google Scholar] [CrossRef] [Green Version]
  40. Kim, H.-M.; Oh, C.; An, J.; Baek, S.; Bock, S.; Kim, J.; Jung, H.-S.; Song, H.; Kim, J.-W.; Jo, A. Multi-Quantum Dots-Embedded Silica-Encapsulated Nanoparticle-Based Lateral Flow Assay for Highly Sensitive Exosome Detection. Nanomaterials 2021, 11, 768. [Google Scholar] [CrossRef]
  41. Kim, H.-M.; Kim, J.; An, J.; Bock, S.; Pham, X.-H.; Huynh, K.-H.; Choi, Y.; Hahm, E.; Song, H.; Kim, J.-W. Au–Ag assembled on silica nanoprobes for visual semiquantitative detection of prostate-specific antigen. J. Nanobiotechnol. 2021, 19, 1–10. [Google Scholar] [CrossRef] [PubMed]
Figure 1. Illustration of a typical preparation of silver assembly silica nanoprobes (SiO2@Ag@SiO2 NPs).
Sensors 21 04099 g001
Figure 2. Transmission electron microscopy (TEM) images of (a) SiO2@Ag@SiO2 NP2.6, (b) SiO2@Ag@SiO2 NP0.9, and (c) SiO2@Ag@SiO2 NP0.5. (d) UV–Vis absorption spectra and (e) actual color image of (i) SiO2@Ag@SiO2 NP2.6, (ii) SiO2@Ag@SiO2 NP0.9, and (iii) SiO2@Ag@SiO2 NP0.5 in EtOH.
Sensors 21 04099 g002
Figure 3. (a) Spotting of SiO2@Ag@SiO2 NPs onto the membrane and data analysis. (b) Scanned color image of the spots formed on the nitrocellulose (NC) membrane with 0.5 μL of suspensions at different concentrations (1/2 dilutions) and (c) intensity of corresponding colored spots on the NC membrane of (i) SiO2@Ag@SiO2 NP2.6, (ii) SiO2@Ag@SiO2 NP0.9, and (iii) SiO2@Ag@SiO2 NP0.5. Error bars represent the standard deviation of the mean over the three batches of measurements of analytes.
Sensors 21 04099 g003
Figure 4. Schematic of the lateral flow immunoassay dipsticks.
Sensors 21 04099 g004
Figure 5. Detection of PSA antigen with various concentrations (0, 0.1, 0.3, 1.0, 3.0, 10.0, 30.0 and 100.0 ng/mL) with each SiO2@Ag@SiO2 NP in LFIA. (a) An 8-byte image captured using ImageQuant LAS-4000 of (a) SiO2@Ag@SiO2 NP2.6, (c) SiO2@Ag@SiO2 NP0.9, and (e) SiO2@Ag@SiO2 NP0.5. Intensity of the corresponding colored band compared to the test line on the test strip of (b) SiO2@Ag@SiO2 NP2.6, (d) SiO2@Ag@SiO2 NP0.9, and (f) SiO2@Ag@SiO2 NP0.5. Error bars represent the standard deviation of the mean over the three batches of measurements of analytes.
Sensors 21 04099 g005
Figure 6. Results using clinical samples with SiO2@Ag@SiO2 NP2.6 in LFIA. (a) An 8-byte image captured using ImageQuant LAS-4000. (b) Intensity of the corresponding colored band compared to the test line on the test strip. Error bars represent the standard deviation of the mean over the three batches of measurements of analytes.
Sensors 21 04099 g006
Publisher’s Note: MDPI stays neutral with regard to jurisdictional claims in published maps and institutional affiliations.

