
RF Sensing Based Breathing Patterns Detection Leveraging USRP Devices

 ,
,  ,
, 
 and
and 
Abstract
1. Introduction
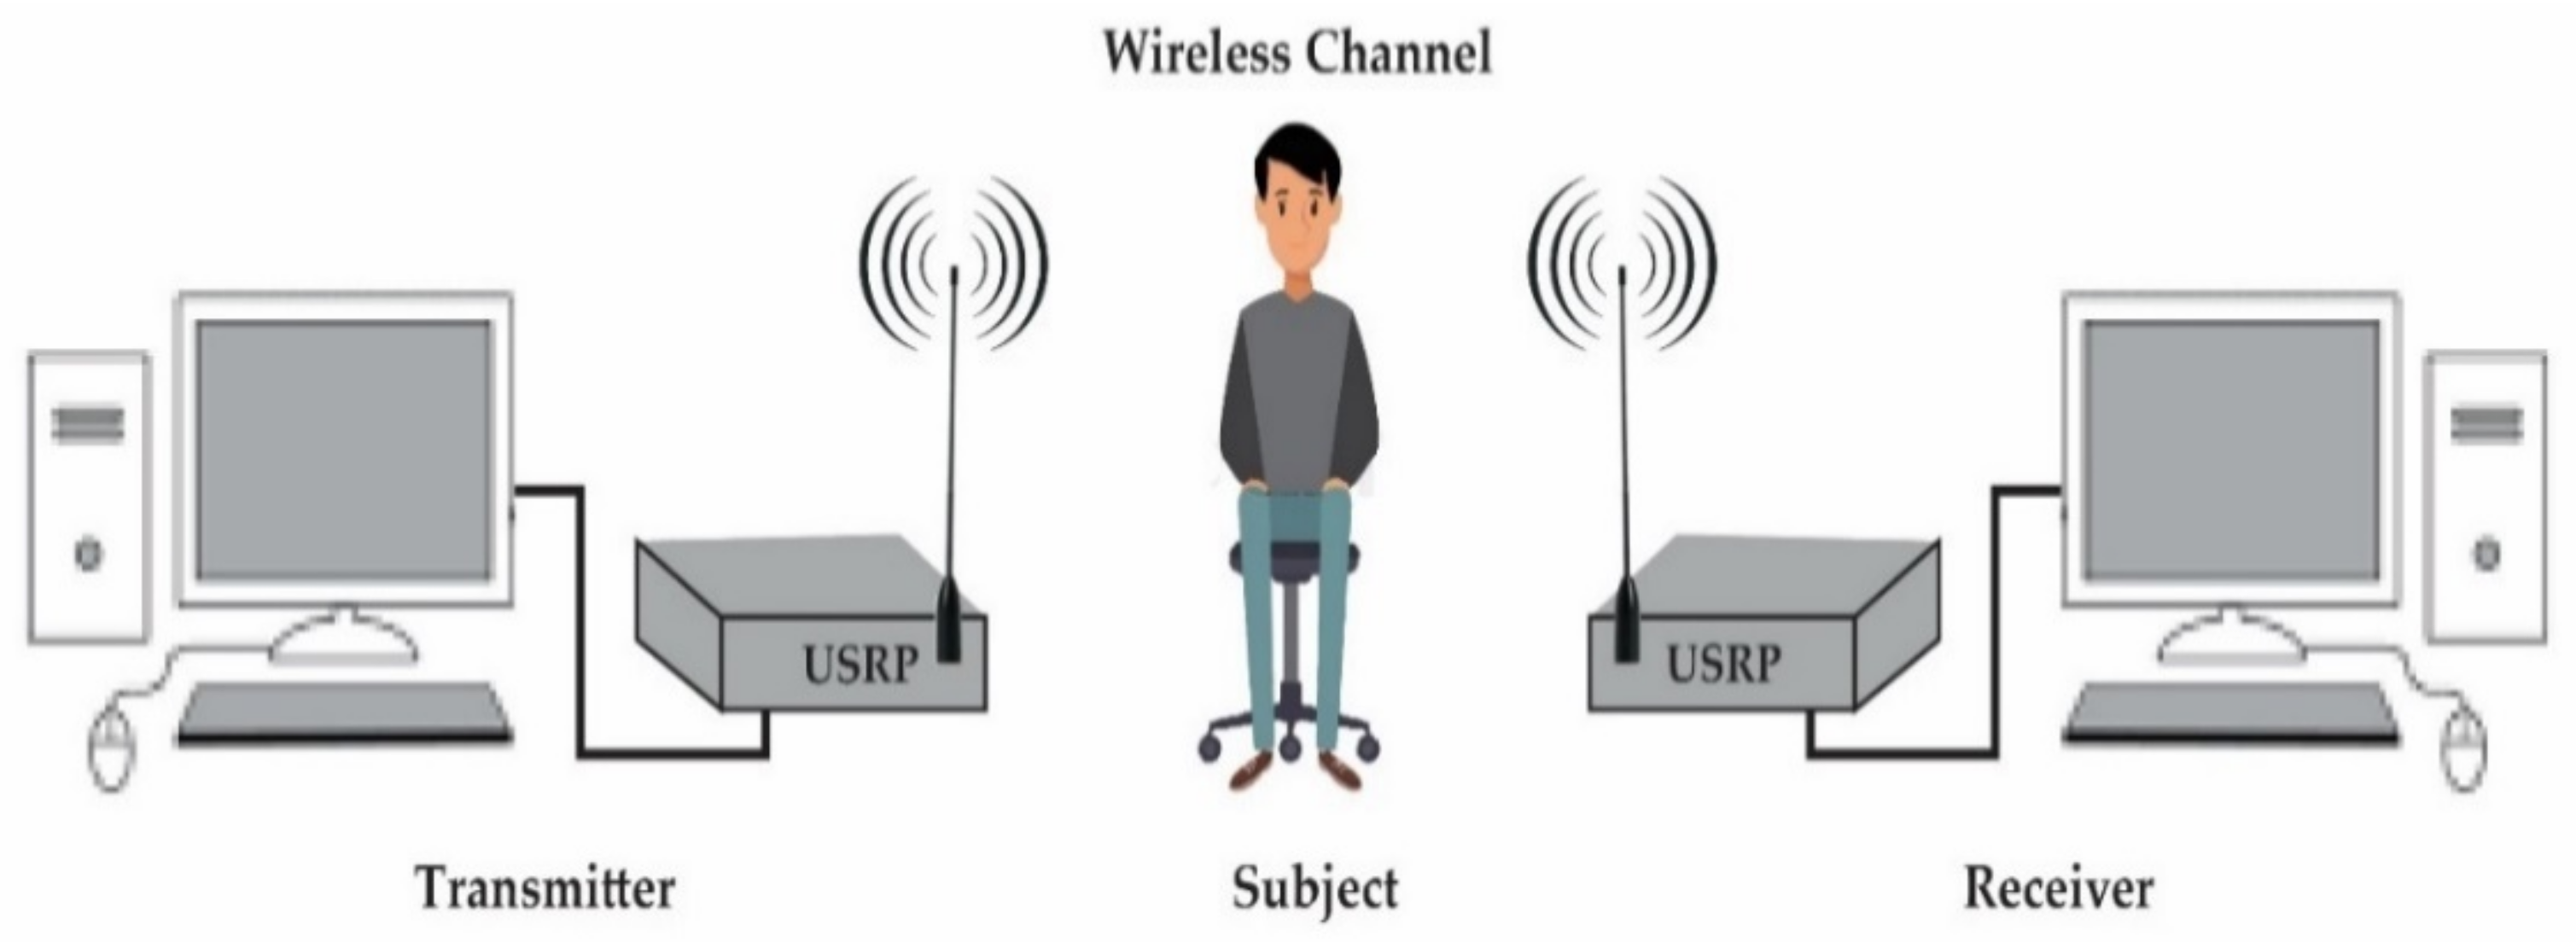
2. System Design
2.1. Transmitter
2.2. Wireless Channel
2.3. Receiver
3. Methodology
- Breathing data collection;
- Breathing data extraction;
- Breathing data processing;
- Breathing pattern classification.

3.1. Breathing Data Collection
3.2. Breathing Data Extraction
3.3. Breathing Data Processing
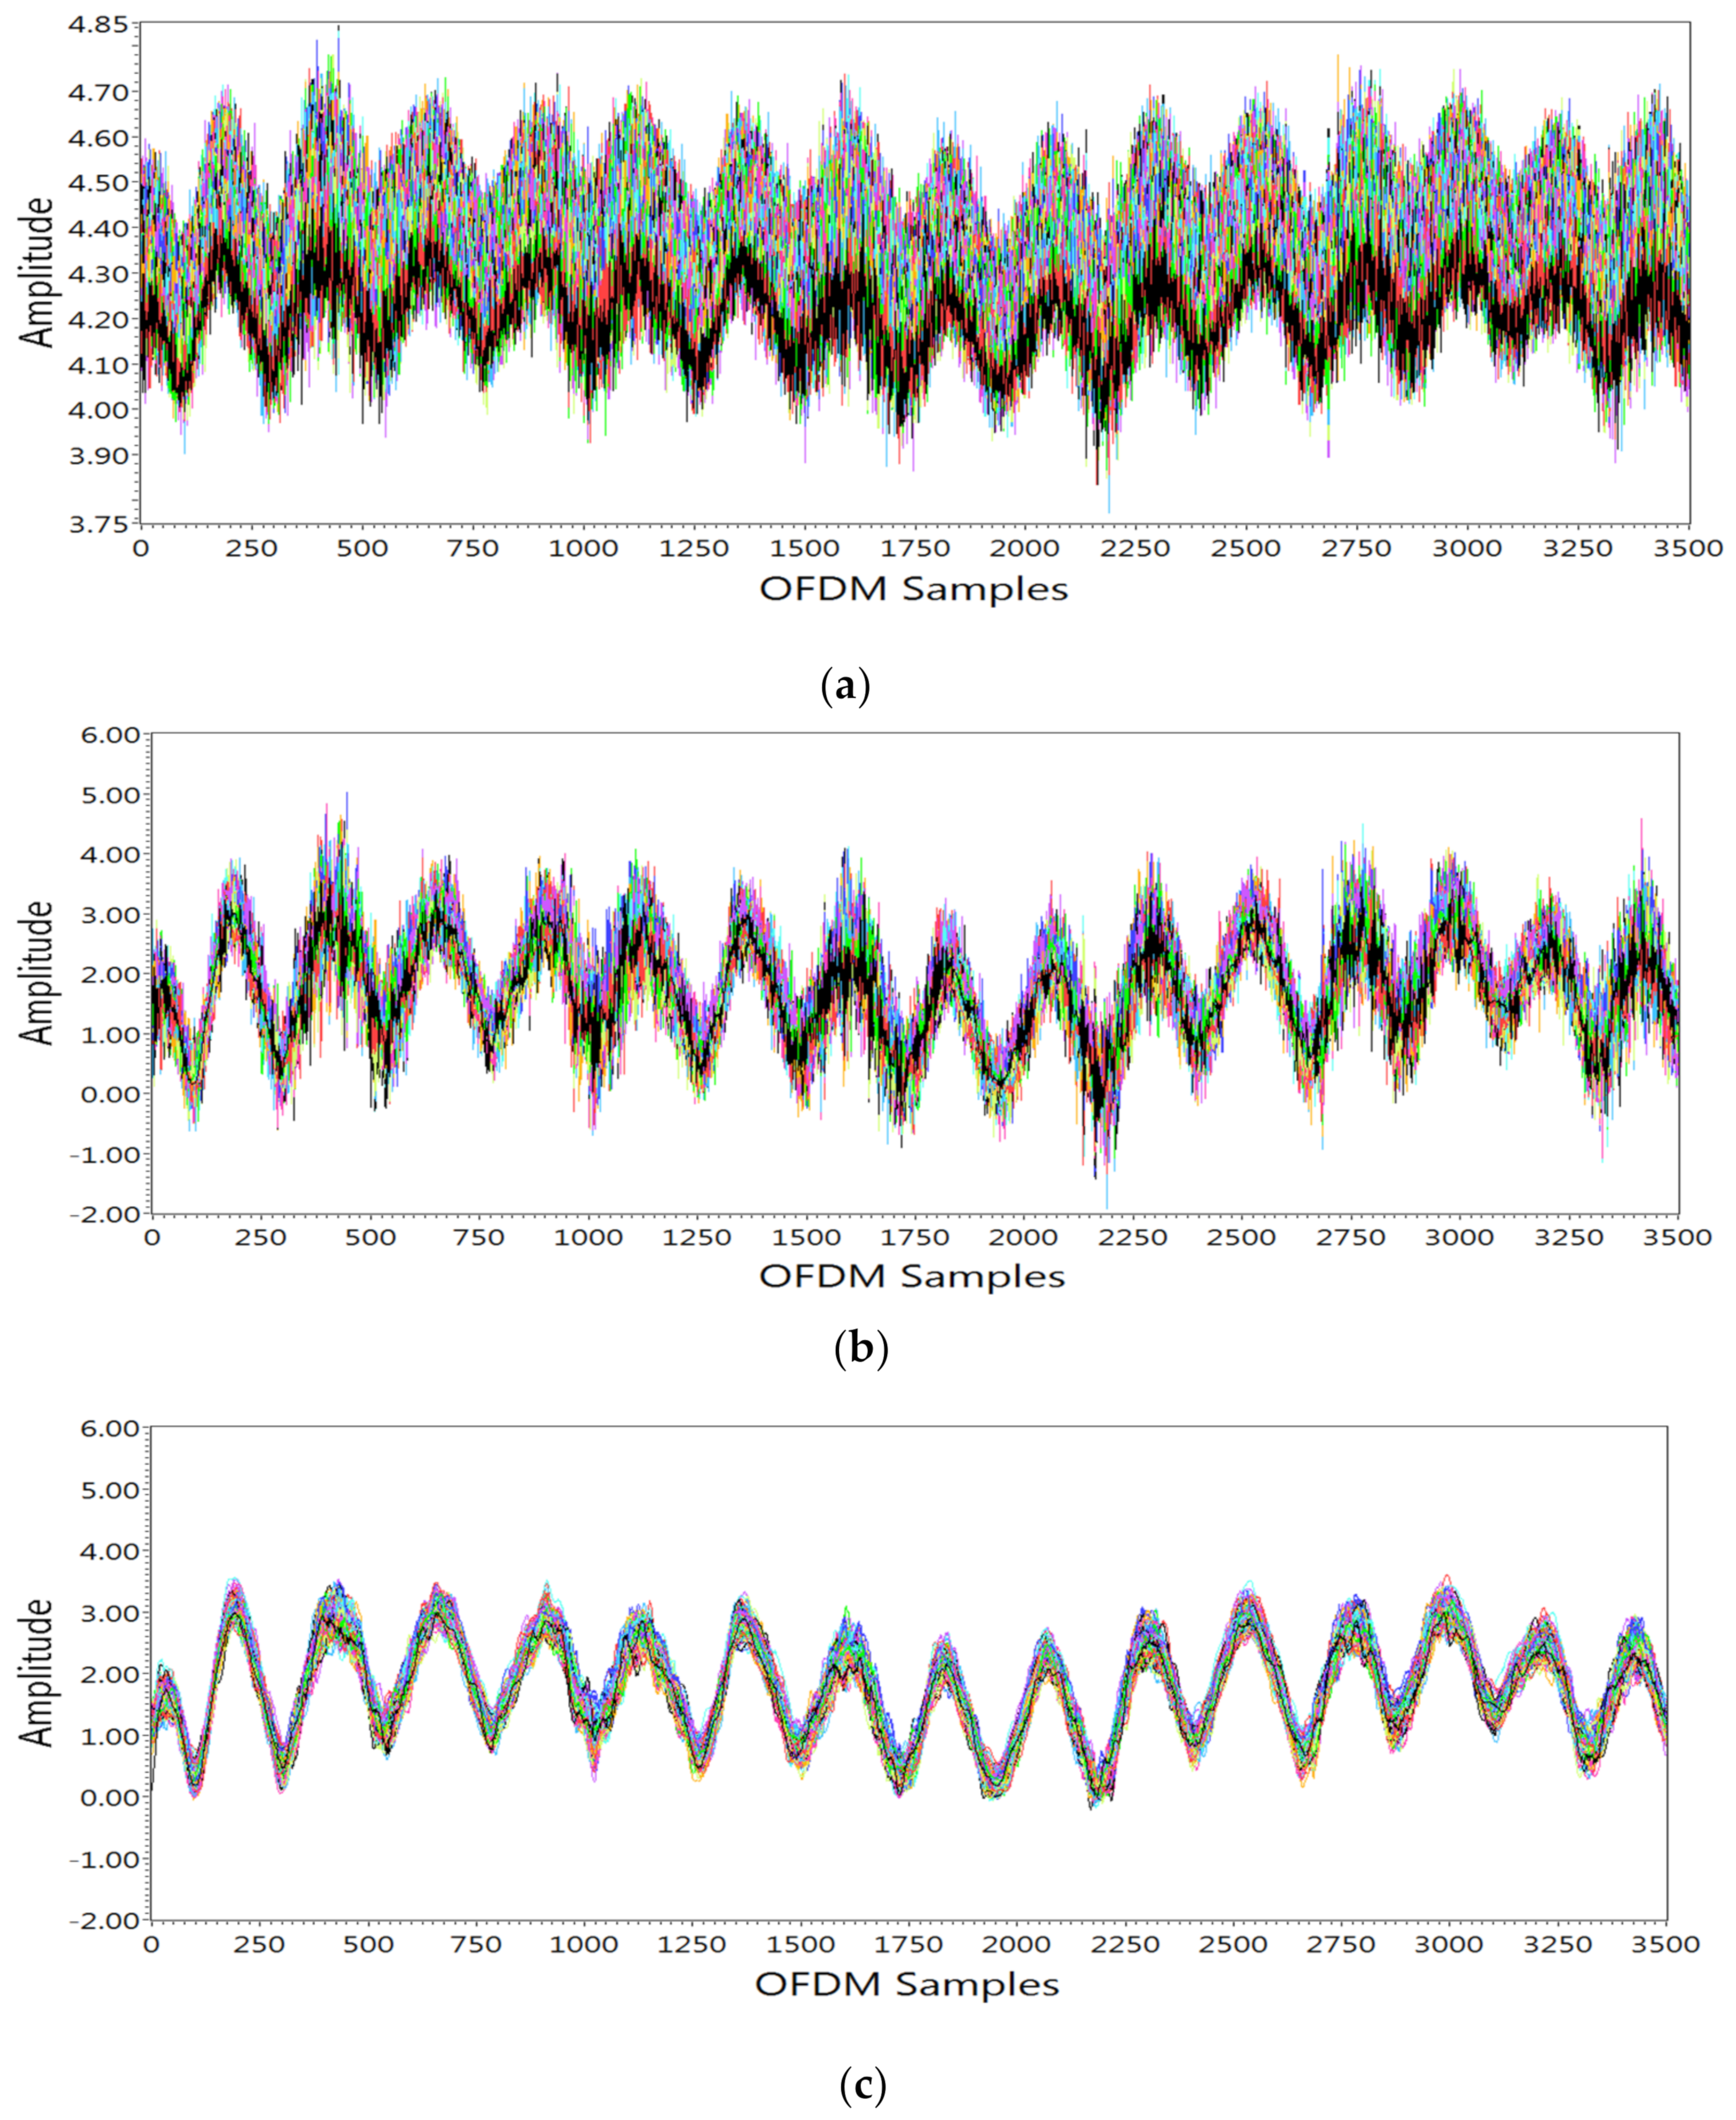
3.3.1. Subcarrier Selection
3.3.2. Removing Outliers
3.3.3. Smoothening Data
3.3.4. Feature Extraction
3.4. Classification
4. Results and Discussions
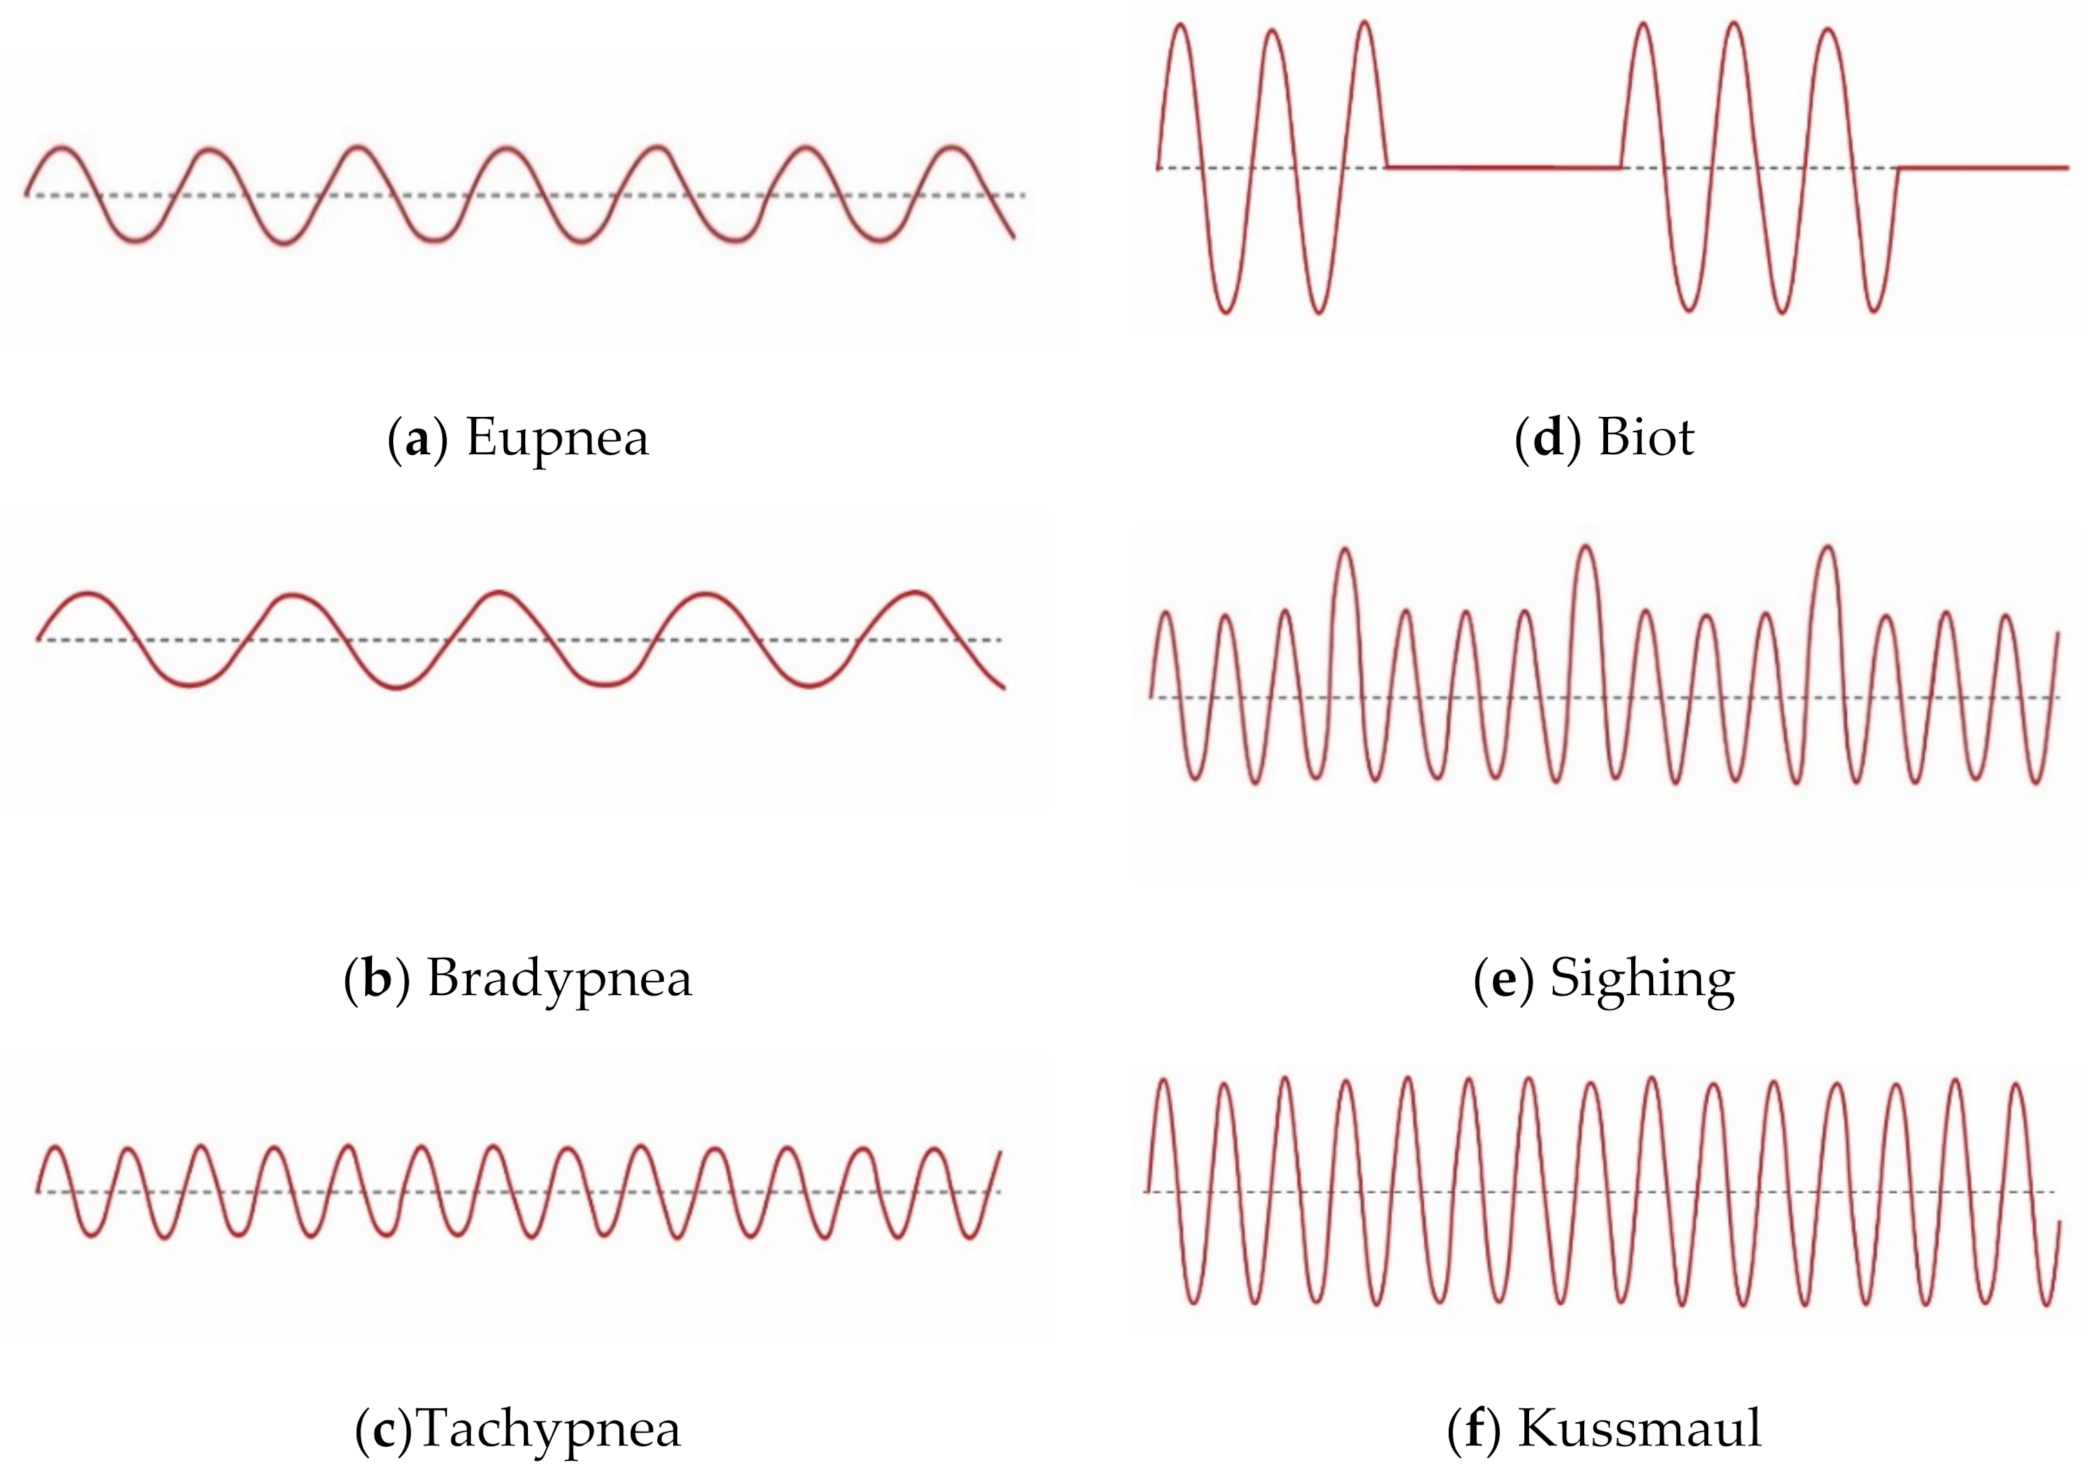
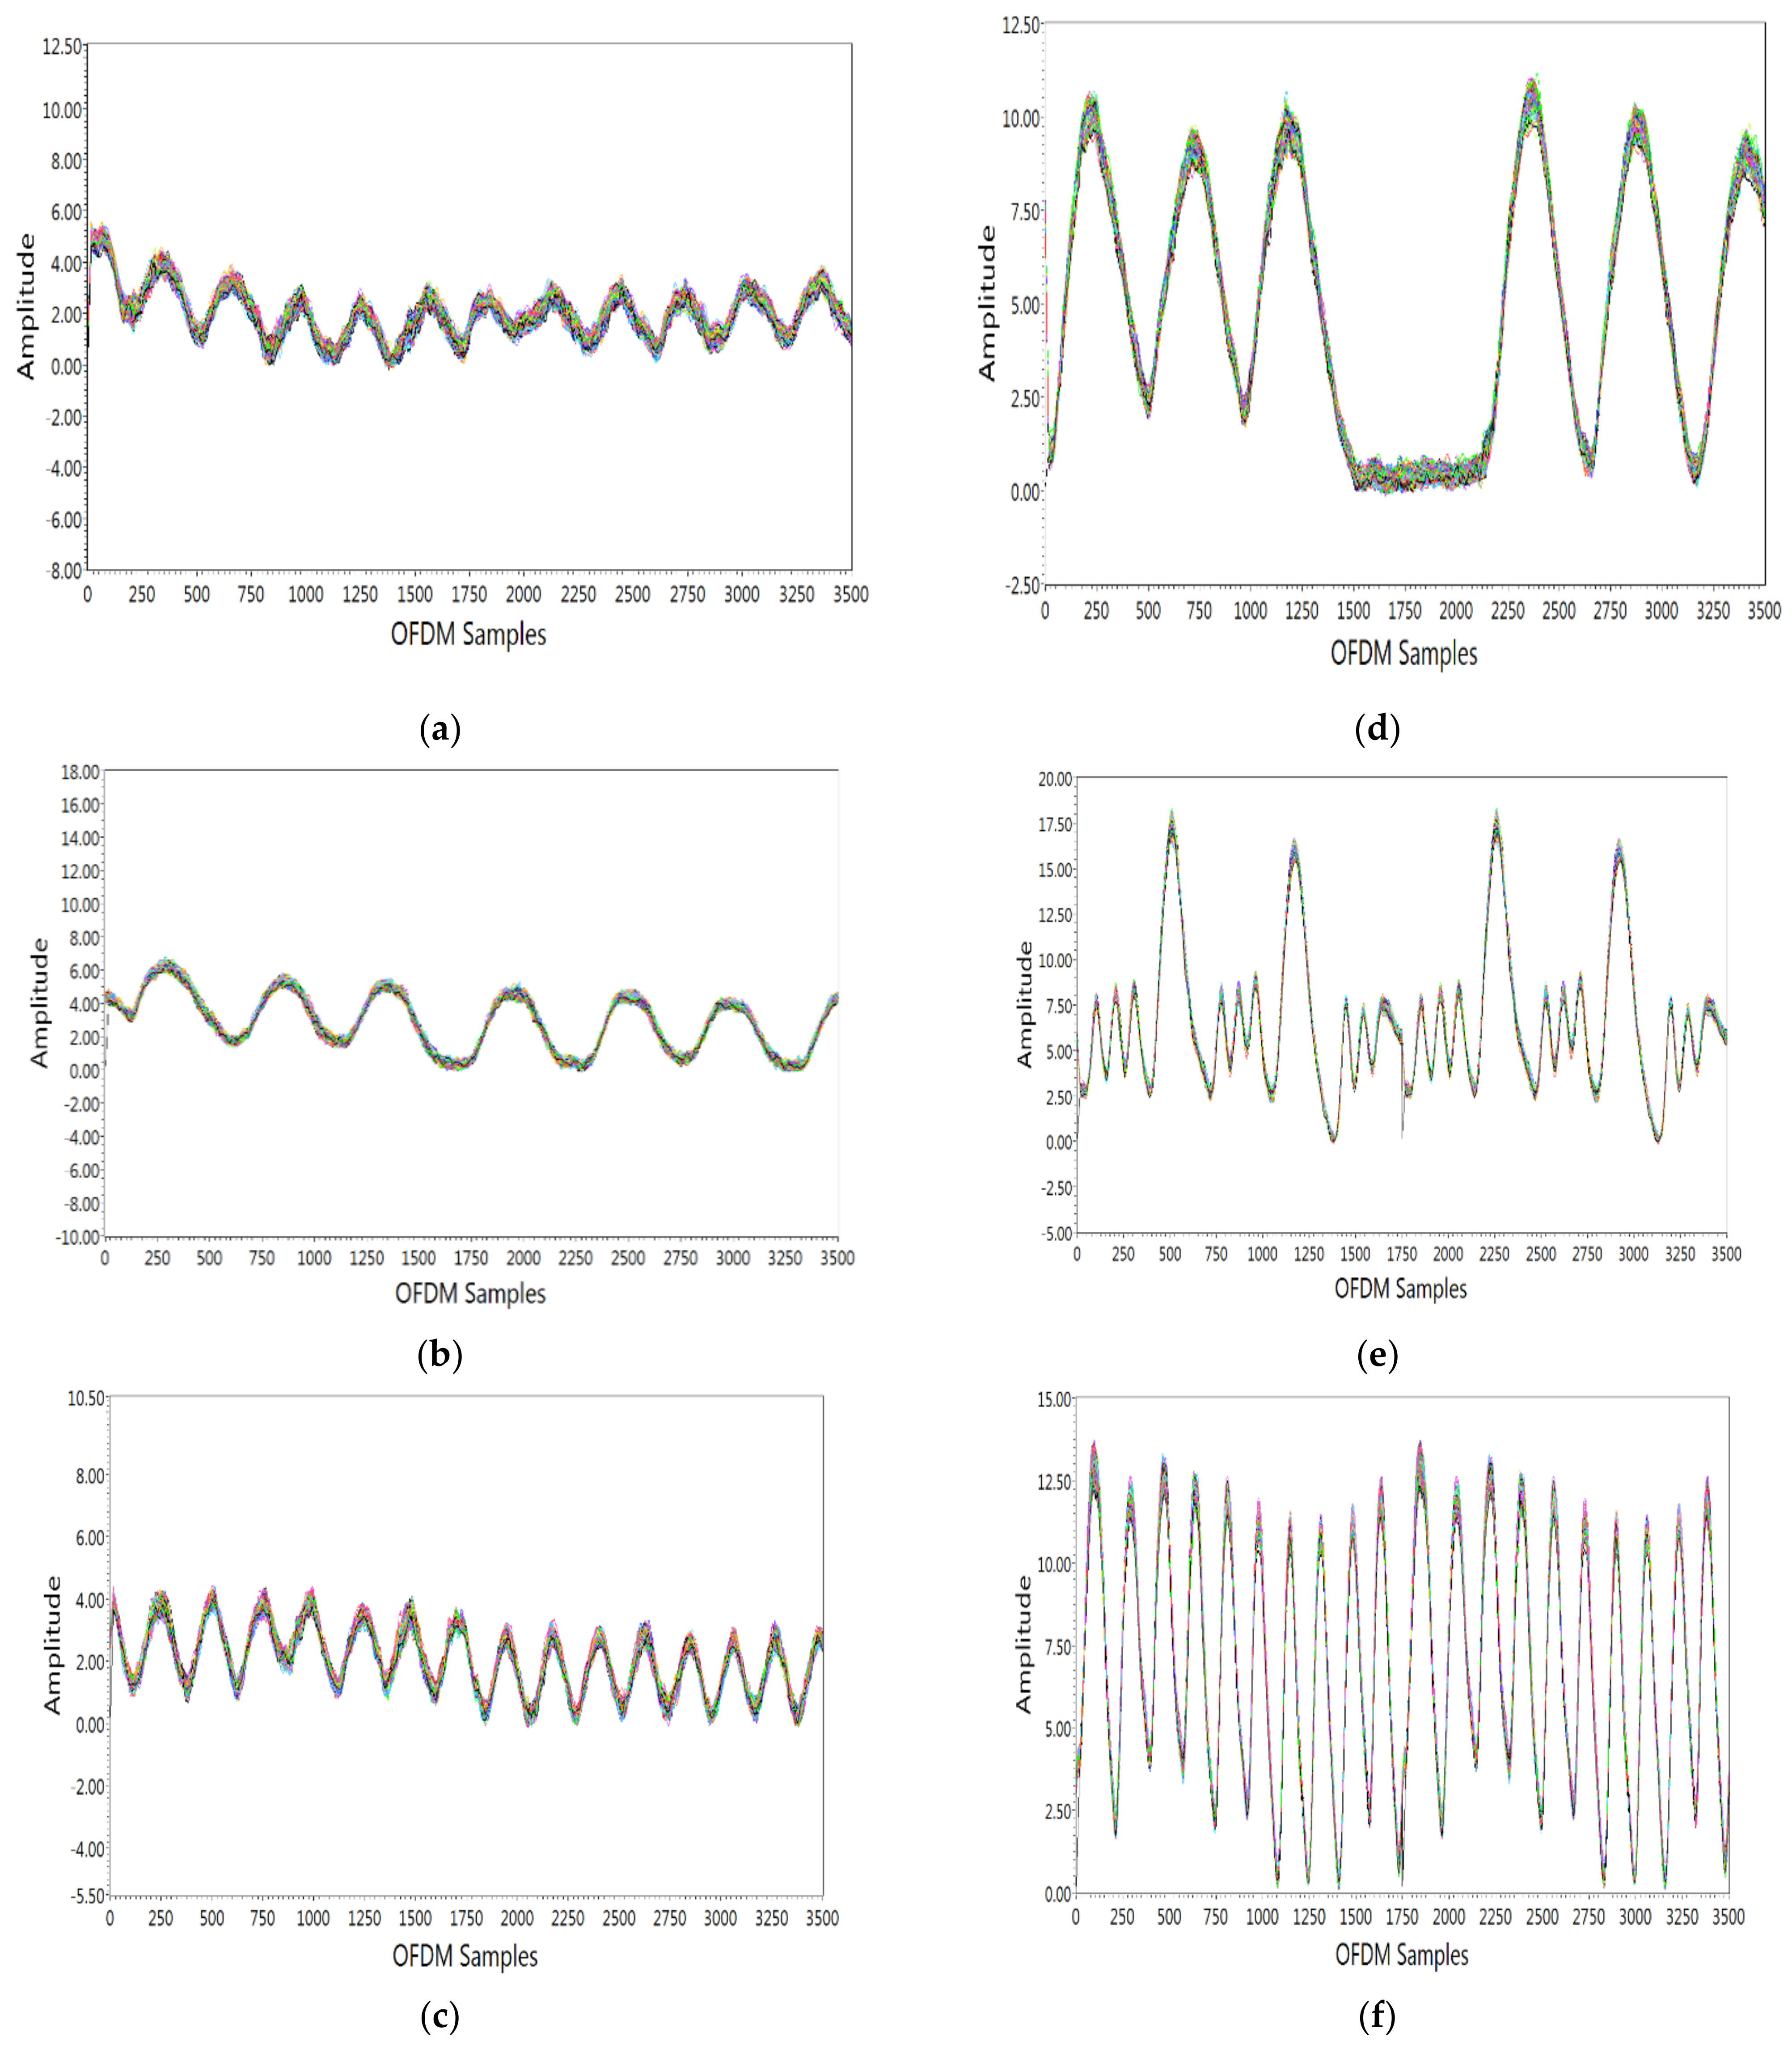
4.1. Breathing Pattern Detection
- Eupnea is breathing with a normal pattern and rate. Eupnea is usually 12–20 breaths per minute for adults. For this breathing pattern, the subject was requested to breathe normally at a normal rate. From Figure 5a, it is seen that there were 10 breaths per 30 s, which agrees with the breathing patterns shown in Figure 1a.
4.2. Abnormal Breathing Patterns Classification
5. Conclusions
Author Contributions
Funding
Institutional Review Board Statement
Informed Consent Statement
Data Availability Statement
Conflicts of Interest
References
- Yuan, G.; Drost, N.A.; McIvor, R.A. Respiratory rate and breathing pattern. McMaster Univ. Med. J. 2013, 10, 23–28. [Google Scholar]
- Vital Signs 101. Available online: www.hopkinsmedicine.org (accessed on 4 February 2021).
- Ganong, W.F.; William, G. Review of Medical Physiology; Appleton & Lange: Norwalk, CT, USA, 1995. [Google Scholar]
- Tortora, G.J.; Anagnostakos, N.P. Principles of Anatomy and Physiology, 5th ed.; Harper & Row, Publishers: New York, NY, USA, 1987; pp. 556–582. ISBN 978-0-06-350729-6. [Google Scholar]
- Shallow Breathing. Available online: https://en.wikipedia.org/wiki/Shallow_breathing (accessed on 11 March 2021).
- Hameed, R.A.; Sabir, M.K.; Fadhel, M.A.; Al-Shamma, O.; Alzubaidi, L. Human emotion classification based on respiration signal. In Proceedings of the International Conference on Information and Communication Technology, Baghdad, Iraq, 15–16 April 2019; pp. 239–245. [Google Scholar]
- Perciavalle, V.; Blandini, M.; Fecarotta, P.; Buscemi, A.; di Corrado, D.; Bertolo, L.; Fichera, F.; Coco, M. The role of deep breathing on stress. Neurol. Sci. 2017, 38, 451–458. [Google Scholar] [CrossRef] [PubMed]
- Holfinger, S.J.; Lyons, M.; Mindel, J.; Cistulli, P.A.; Sutherland, K.; Chen, N.; McArdle, N.; Gislason, T.; Penzel, T.; Han, F.; et al. 0459 diagnostic performance of symptomless obstructive sleep apnea prediction tools in clinical and community-based samples. Sleep 2019, 42, A184–A185. [Google Scholar] [CrossRef]
- Boulding, R.; Stacey, R.; Niven, R.; Fowler, S.J. Dysfunctional breathing: A review of the literature and proposal for classification. Eur. Respir. Rev. 2016, 25, 287–294. [Google Scholar] [CrossRef]
- Braun, S.R. Respiratory Rate and Pattern. In Clinical Methods: The History, Physical, and Laboratory Examinations, 3rd ed.; Walker, H.K., Hall, W.D., Hurst, J.W., Eds.; Butterworths: Boston, MA, USA, 1990. [Google Scholar]
- Whited, L.; Graham, D.D. Abnormal Respirations. In StatPearls; StatPearls Publishing: Treasure Island, FL, USA, 2021. [Google Scholar]
- Coronaviridae Study Group of the International Committee on Taxonomy of V. The species Severe acute respiratory syndrome-related coronavirus: Classifying 2019-nCoV and naming it SARS-CoV-2. Nat. Microbiol. 2020, 5, 536–544. [Google Scholar] [CrossRef]
- Huang, C.; Wang, Y.; Li, X.; Ren, L.; Zhao, J.; Hu, Y. Clinical features of patients infected with 2019 novel coronavirus in Wuhan, China. Lancet Glob. Health 2020, 395, 497–506. [Google Scholar] [CrossRef] [PubMed]
- Miller, D.J.; Capodilupo, J.V.; Lastella, M.; Sargent, C.; Roach, G.D.; Lee, V.H.; Capodilupo, E.R.; Miller, D.J.; Capodilupo, J.V.; Lastella, M.; et al. Analyzing changes in respiratory rate to predict the risk of COVID-19 infection. PLoS ONE 2020, 15, e0243693. [Google Scholar] [CrossRef]
- CDC—Spirometry—NIOSH Workplace Safety and Health Topic. Available online: www.cdc.gov (accessed on 31 January 2017).
- Hill, S.L.; Blackburn, J.P.; Williams, T.R. Measurement of respiratory flow by inductance pneumography. Med. Biol. Eng. Comput. 1982, 20, 517–518. [Google Scholar] [CrossRef]
- Freundlich, J.J.; Erickson, J.C. Electrical impedance pneumographyfor simple nonrestrictive continuous monitoring of respiratory rate, rhythm and tidal volume for surgical patients. Chest J. 1974, 65, 181–184. [Google Scholar] [CrossRef]
- Von Schéeleand, B.H.C.; Von Schéeleand, I.A.M. The measurement of respiratory andmetabolic parameters of patients and controls beforeand after incremental exercise on bicycle: Supporting the effort syndromehypothesis? Appl. Psychophys. Biof. 1999, 24, 167–177. [Google Scholar] [CrossRef]
- L-Khalidi, F.Q.A.; Saatchi, R.; Burke, D.; Elphick, H.; Tan, S. Respiration rate monitoring methods: A review. Pediatric Pulmonol. 2011, 46, 523–529. [Google Scholar] [CrossRef]
- Bae, M.; Lee, S.; Kim, N. Development of a robust and cost-effective 3d respiratory motion monitoring system using the kinect device: Accuracy comparison with the conventional stereovision navigation system. Comput. Methods Programs Biomed. 2018, 160, 25–32. [Google Scholar] [CrossRef]
- Hu, M.; Zhai, G.; Li, D.; Fan, Y.; Duan, H.; Zhu, W.; Yang, X. Combination of near-infrared and thermal imaging techniques for the remote and simultaneous measurements of breathing and heart rates under sleep situation. PLoS ONE 2018, 13, e0190466. [Google Scholar] [CrossRef]
- Kranjec, J.; Beguš, S.; Drnovšek, J.; Geršak, G. Novel methods for noncontact heart rate measurement: A feasibility study. IEEE Trans. Instrum. Meas. 2013, 63, 838–847. [Google Scholar] [CrossRef]
- Kuo, H.-C. A fully integrated 60-GHz CMOS direct-conversion Doppler radar RF sensor with clutter canceller for single-antenna noncontact human vital-signs detection. IEEE Trans. Microw. Theory Tech. 2016, 64, 1018–1028. [Google Scholar] [CrossRef]
- Patwari, N.; Brewer, L.; Tate, Q.; Kaltiokallio, O.; Bocca, M. Breathfinding: A wireless network that monitors and locates breathing in a home. IEEE J. Sel. Top. Signal Process. 2013, 8, 30–42. [Google Scholar] [CrossRef]
- Wang, F.; Zhang, F.; Wu, C.; Wang, B.; Liu, K.J.R. Vimo: Vital sign monitoring using commodity millimeter wave radio. In Proceedings of the ICASSP 2020—2020 IEEE International Conference on Acoustics, Speech and Signal Processing (ICASSP), Virtual Conference, 4–8 May 2020; pp. 8304–8308. [Google Scholar]
- Arsalan, M.; Santra, A.; Will, C. Improved Contactless Heartbeat Estimation in FMCW Radar via Kalman filter Tracking. IEEE Sens. Lett. 2020, 4, 1–4. [Google Scholar] [CrossRef]
- Shah, S.A.; Fioranelli, F. RF Sensing Technologies for Assisted Daily Living in Healthcare: A Comprehensive Review. IEEE Aerosp. Electron. Syst. Mag. 2019, 34, 26–44. [Google Scholar] [CrossRef]
- Shah, S.A.; Tahir, A.; Ahmad, J.; Zahid, A.; Pervaiz, H.; Shah, S.Y.; Ashleibta, A.M.; Hasanali, A.; Khattak, S.; Abbasi, Q.H. Sensor fusion for identification of freezing of gait episodes using Wi-Fi and radar imaging. IEEE Sens. J. 2020, 20, 14410–14422. [Google Scholar] [CrossRef]
- Shah, S.A.; Zhang, Z.; Ren, A.; Zhao, N.; Yang, X.; Zhao, W.; Yang, J.; Zhao, J.; Sun, W.; Hao, Y. Buried object sensing considering curved pipeline. IEEE Antennas Wirel. Propag. Lett. 2017, 16, 2771–2775. [Google Scholar] [CrossRef]
- Shah, S.A.; Yang, X.; Abbasi, Q.H. Cognitive health care system and its application in pill-rolling assessment. Int. J. Numer. Model. Electron. Netw. Devices Fields 2019, 32, e2632. [Google Scholar] [CrossRef]
- Taylor, W.; Dashtipour, K.; Shah, S.A.; Imran, M.A.; Abbasi, Q.H. Image classification of radar spectograms of human motion using machine and deep learning algorithms. IEEE Sens. J. 2020. [Google Scholar] [CrossRef]
- Shah, S.A.; Ahmad, J.; Masood, F.; Shah, S.Y.; Pervaiz, H.; Taylor, W.; Imran, M.A.; Abbasi, Q.H. Privacy-Preserving Wandering Behavior Sensing in Dementia Patients Using Modified Logistic and Dynamic Newton Leipnik Maps. IEEE Sens. J. 2020, 21, 3669–3679. [Google Scholar] [CrossRef]
- Lee, S.; Park, Y.D.; Suh, Y.J.; Jeon, S. Design and implementation of monitoring system for breathing and heart rate pattern using WiFi signals. In Proceedings of the 2018 15th IEEE Annual Consumer Communications & Networking Conference (CCNC), Las Vegas, NV, USA, 12–15 January 2018; pp. 1–7. [Google Scholar]
- Ashleibta, A.M. Non-Invasive RF Sensing for Detecting Breathing Abnormalities using Software Defined Radios. IEEE Sens. J. 2020, 21, 5111–5118. [Google Scholar] [CrossRef]
- Yang, Z.; Zhou, Z.; Liu, Y. From RSSI to CSI: Indoor localization via channel response. ACM Comput. Surv. (CSUR) 2013, 46, 25. [Google Scholar]
- Awoseyila, A.B.; Kasparis, C.; Evans, B.G. Robust time-domain timing and frequency synchronization for OFDM systems. IEEE Trans. Consum. Electron. 2009, 55, 391–399. [Google Scholar] [CrossRef]
- Van de Beek, J. A time and frequency synchronization scheme for multiuser OFDM. IEEE J. Sel. Areas Commun. 1999, 17, 1900–1914. [Google Scholar] [CrossRef]
- Wang, Z. A survey on CSI-based human behavior recognition in through-the-wall scenario. IEEE Access 2019, 7, 78772–78793. [Google Scholar] [CrossRef]
- Lu, Y.; Lv, S.-H.; Wang, X.-D.; Zhou, X.-M. A Survey on WiFi based human behavior analysis technology. Chin. J. Comput. 2018, 41, 1–22. [Google Scholar]


| Sr. # | Breathing Pattern Type | Description | Causes |
|---|---|---|---|
| 1. | Eupnea | Normal breathing pattern and rate | Balanced diet and healthy life |
| 2. | Bradypnea | Slow and shallow breathe | Sleep drugs, metabolic disorder, head injury, stroke |
| 3. | Tachypnea | Fast and shallow breathe | Fever, anxiety, exercise, shock |
| 4. | Biot | Deep breathe with gradual periods of no breaths | Spinal meningitis, head injury |
| 5. | Sighing | Breathing punctuated by frequent deep breathes | Anxiety, dyspnea, and dizziness |
| 6. | Kussmaul | Fast and deep breaths | Renal failure, metabolic acidosis, diabetic ketoacidosis |
| Sr. No. | Subject | Age (Years) | Height (cm) | Weight (Kg) | Body Structure |
|---|---|---|---|---|---|
| 1 | Male | 28 | 179 | 65 | Ectomorph |
| 2 | Male | 31 | 176 | 52 | Endomorph |
| 3 | Male | 26 | 173 | 76 | Endomorph |
| 4 | Male | 31 | 177 | 52 | Ectomorph |
| 5 | Male | 31 | 174 | 65 | Endomorph |
| Sr. # | Statistical Features | Description | Expression |
|---|---|---|---|
| 1 | Minimum | Minimum value of data | |
| 2 | Maximum | Maximum value of data | |
| 3 | Mean | Mean of data | |
| 4 | Variance | degree of data spread | |
| 5 | Standard deviation | Square root of variance | |
| 6 | RMS | Root mean square data | |
| 7 | Peak-to-peak value | Data fluctuations about the mean | |
| 8 | Kurtosis | Measure of tailedness in data | |
| 9 | Skewness | Measure of symmetry in data | |
| 10 | Peak factor | Ratio of maximum data value to RMS | |
| 11 | Interquartile range | Mid-spread of data | |
| 12 | Waveform factor | Ratio of the RMS value to the mean value | |
| 13 | FFT | Frequency information about data | |
| 14 | Frequency Min | Minimum Frequency component | |
| 15 | Frequency Max | Maximum Frequency component | |
| 16 | Spectral Probability | Probability distribution of spectrum | |
| 17 | Signal Energy | Measure of energy component | |
| 18 | Spectrum Entropy | Measure of data irregularity |
| Algorithms | Actual/Predicted | Eupnea | Bradypnea | Tachypnea | Biot | Sighing | Kussmaul |
|---|---|---|---|---|---|---|---|
| Complex Tree | Eupnea | 3608 | 33 | 0 | 9 | 0 | 0 |
| Bradypnea | 40 | 3604 | 0 | 6 | 0 | 0 | |
| Tachypnea | 0 | 0 | 3632 | 0 | 0 | 18 | |
| Biot | 9 | 3 | 0 | 3638 | 0 | 0 | |
| Sighing | 0 | 0 | 0 | 0 | 3649 | 1 | |
| Kussmaul | 0 | 0 | 4 | 0 | 1 | 3645 | |
| Ensemble Subspace KNN | Eupnea | 3509 | 18 | 59 | 3 | 0 | 1 |
| Bradypnea | 29 | 3594 | 23 | 0 | 0 | 4 | |
| Tachypnea | 99 | 37 | 3505 | 9 | 0 | 0 | |
| Biot | 1 | 0 | 1 | 3638 | 0 | 4 | |
| Sighing | 0 | 0 | 0 | 0 | 3650 | 0 | |
| Kussmaul | 2 | 5 | 1 | 1 | 0 | 3641 | |
| Quadratic SVM | Eupnea | 3403 | 185 | 0 | 61 | 1 | |
| Bradypnea | 160 | 3485 | 0 | 5 | 0 | 0 | |
| Tachypnea | 18 | 6 | 3589 | 18 | 0 | 19 | |
| Biot | 117 | 2 | 0 | 3531 | 0 | 0 | |
| Sighing | 0 | 0 | 0 | 0 | 3650 | 0 | |
| Kussmaul | 0 | 2 | 0 | 4 | 2 | 3642 | |
| Coarse KNN | Eupnea | 3278 | 137 | 109 | 101 | 0 | 25 |
| Bradypnea | 85 | 3436 | 104 | 2 | 0 | 23 | |
| Tachypnea | 195 | 134 | 3197 | 49 | 0 | 75 | |
| Biot | 46 | 1 | 40 | 3523 | 10 | 30 | |
| Sighing | 0 | 0 | 0 | 0 | 3649 | 1 | |
| Kussmaul | 14 | 51 | 0 | 21 | 20 | 3544 |
| Algorithms | Accuracy (%) | Prediction Speed (obs/s) | Training Time (s) |
|---|---|---|---|
| Complex Tree | 99.4 | ~330,000 | 7.58 |
| Ensemble Subspace KNN | 98.6 | ~12,000 | 239.40 |
| Quadratic SVM | 97.3 | ~21,000 | 193.92 |
| Coarse KNN | 94.2 | ~2400 | 182.18 |
Publisher’s Note: MDPI stays neutral with regard to jurisdictional claims in published maps and institutional affiliations. |
© 2021 by the authors. Licensee MDPI, Basel, Switzerland. This article is an open access article distributed under the terms and conditions of the Creative Commons Attribution (CC BY) license (https://creativecommons.org/licenses/by/4.0/).
Share and Cite
Rehman, M.; Shah, R.A.; Khan, M.B.; AbuAli, N.A.; Shah, S.A.; Yang, X.; Alomainy, A.; Imran, M.A.; Abbasi, Q.H. RF Sensing Based Breathing Patterns Detection Leveraging USRP Devices. Sensors 2021, 21, 3855. https://doi.org/10.3390/s21113855
Rehman M, Shah RA, Khan MB, AbuAli NA, Shah SA, Yang X, Alomainy A, Imran MA, Abbasi QH. RF Sensing Based Breathing Patterns Detection Leveraging USRP Devices. Sensors. 2021; 21(11):3855. https://doi.org/10.3390/s21113855
Chicago/Turabian StyleRehman, Mubashir, Raza Ali Shah, Muhammad Bilal Khan, Najah Abed AbuAli, Syed Aziz Shah, Xiaodong Yang, Akram Alomainy, Muhmmad Ali Imran, and Qammer H. Abbasi. 2021. "RF Sensing Based Breathing Patterns Detection Leveraging USRP Devices" Sensors 21, no. 11: 3855. https://doi.org/10.3390/s21113855
APA StyleRehman, M., Shah, R. A., Khan, M. B., AbuAli, N. A., Shah, S. A., Yang, X., Alomainy, A., Imran, M. A., & Abbasi, Q. H. (2021). RF Sensing Based Breathing Patterns Detection Leveraging USRP Devices. Sensors, 21(11), 3855. https://doi.org/10.3390/s21113855