
Recent Research for Unobtrusive Atrial Fibrillation Detection Methods Based on Cardiac Dynamics Signals: A Survey


Abstract
1. Introduction
2. Instrument/Signal
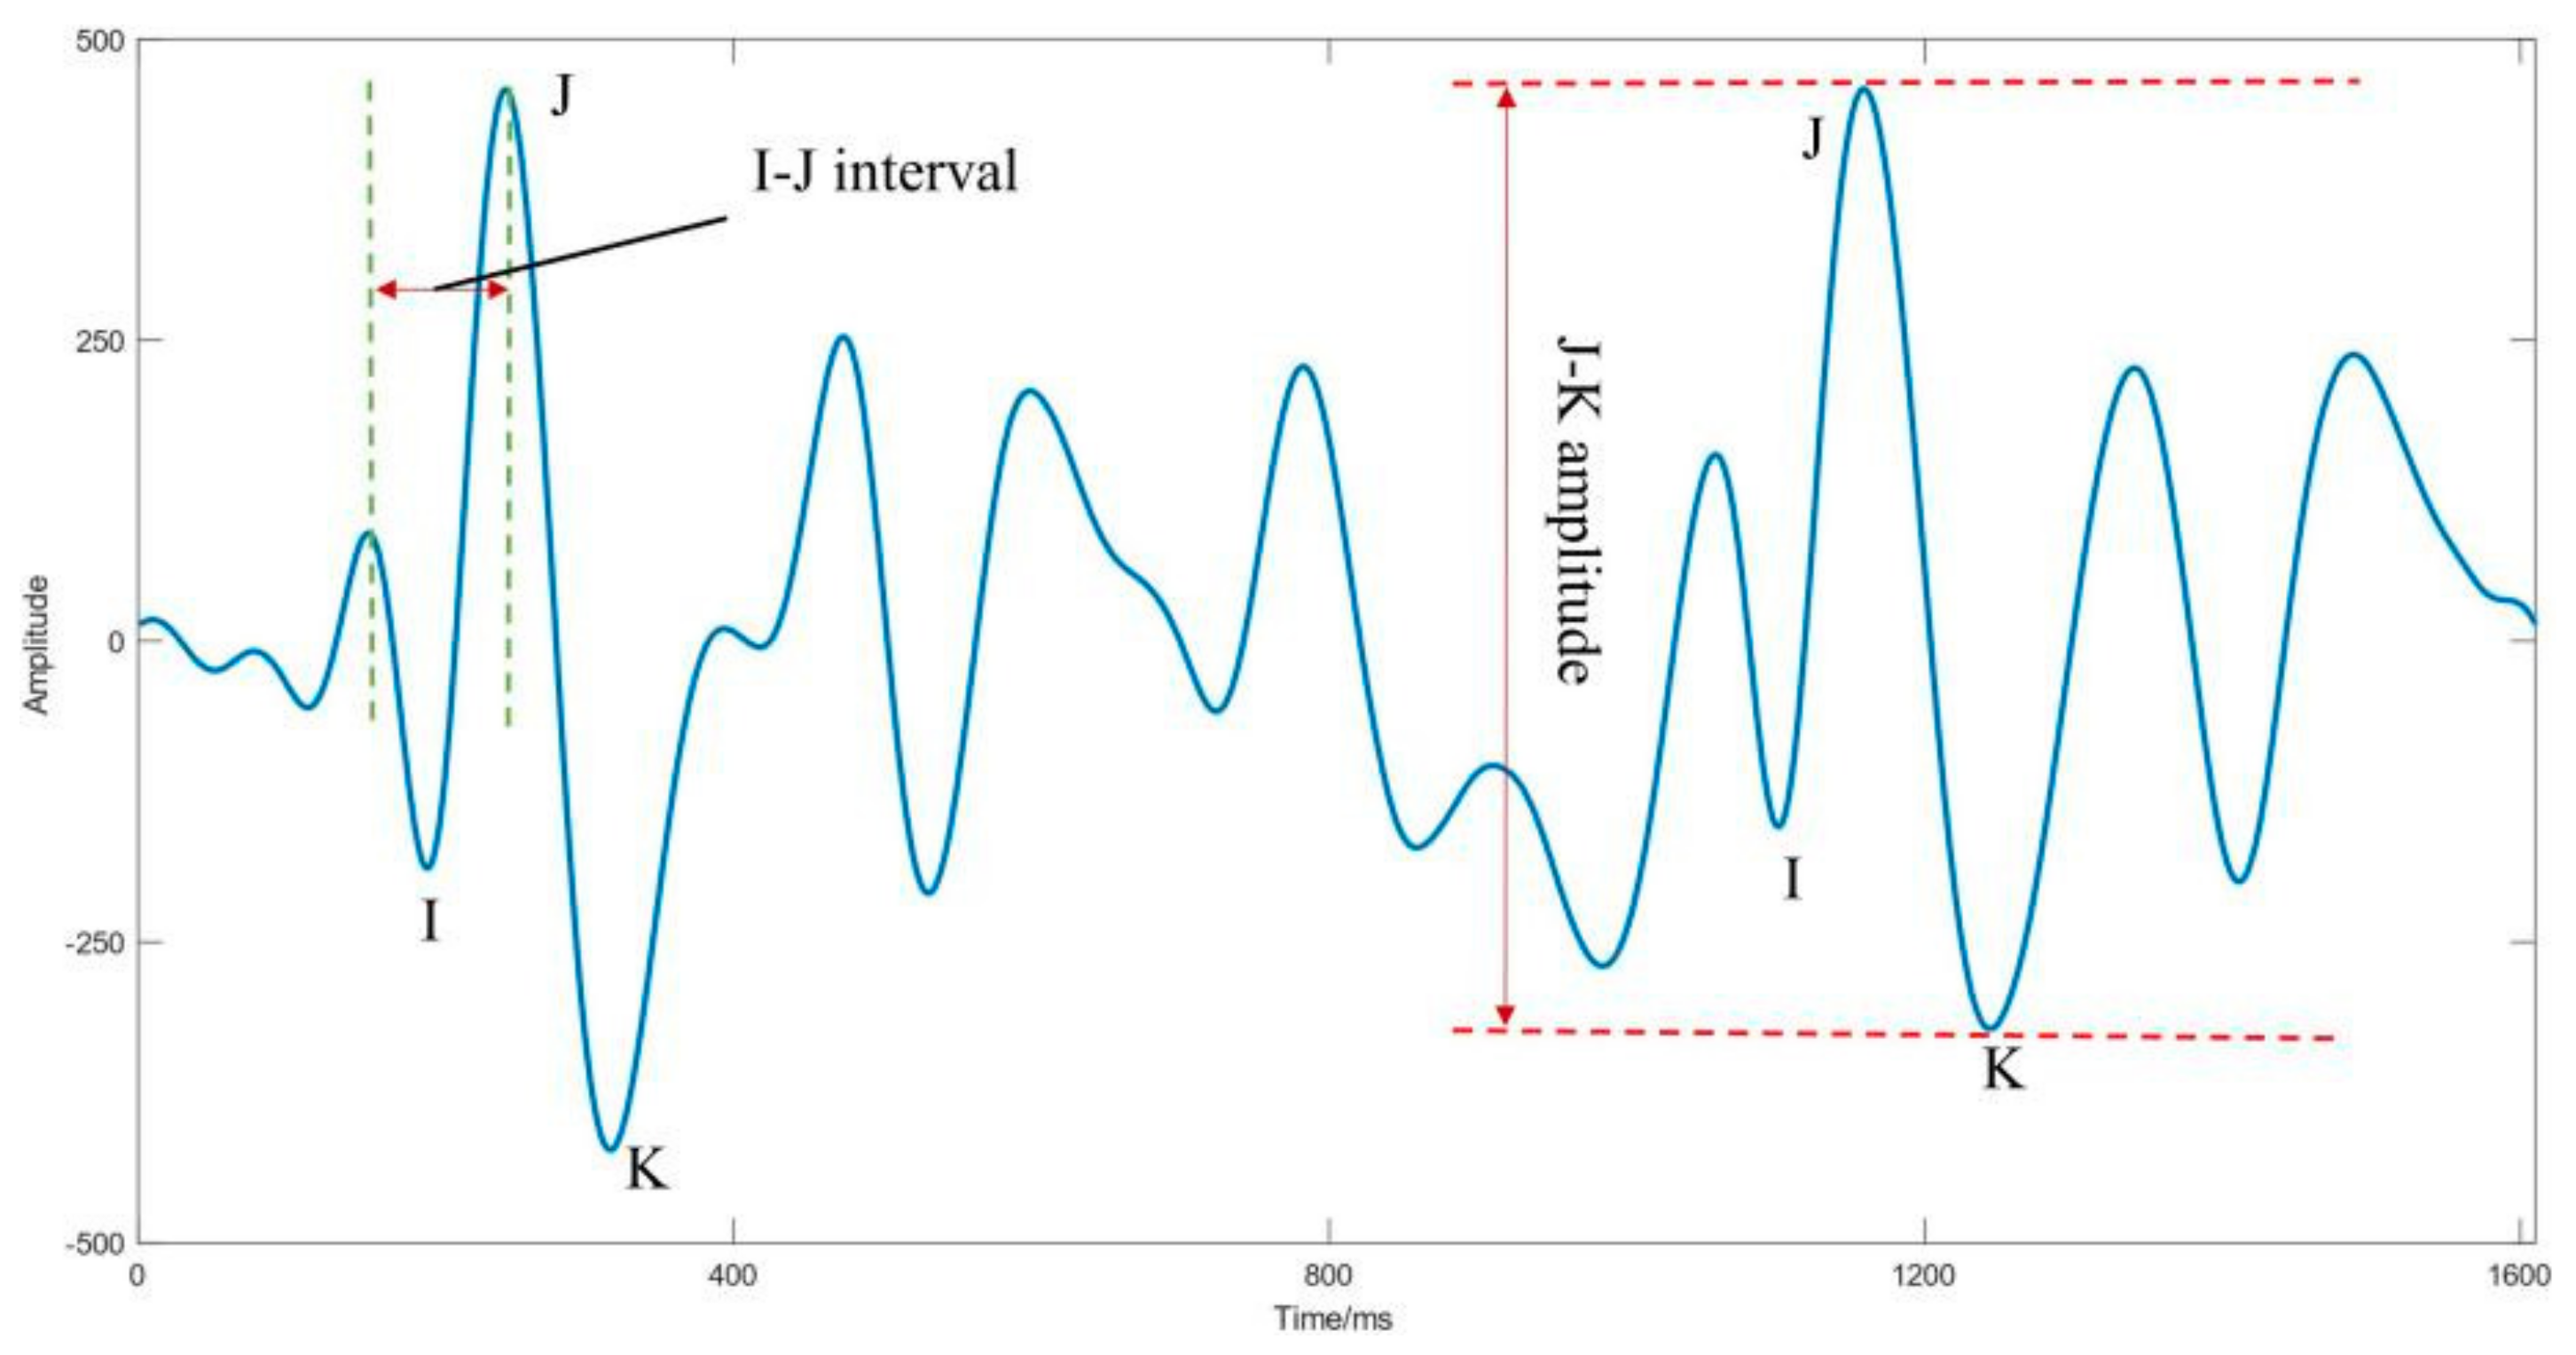
2.1. BCG Signal
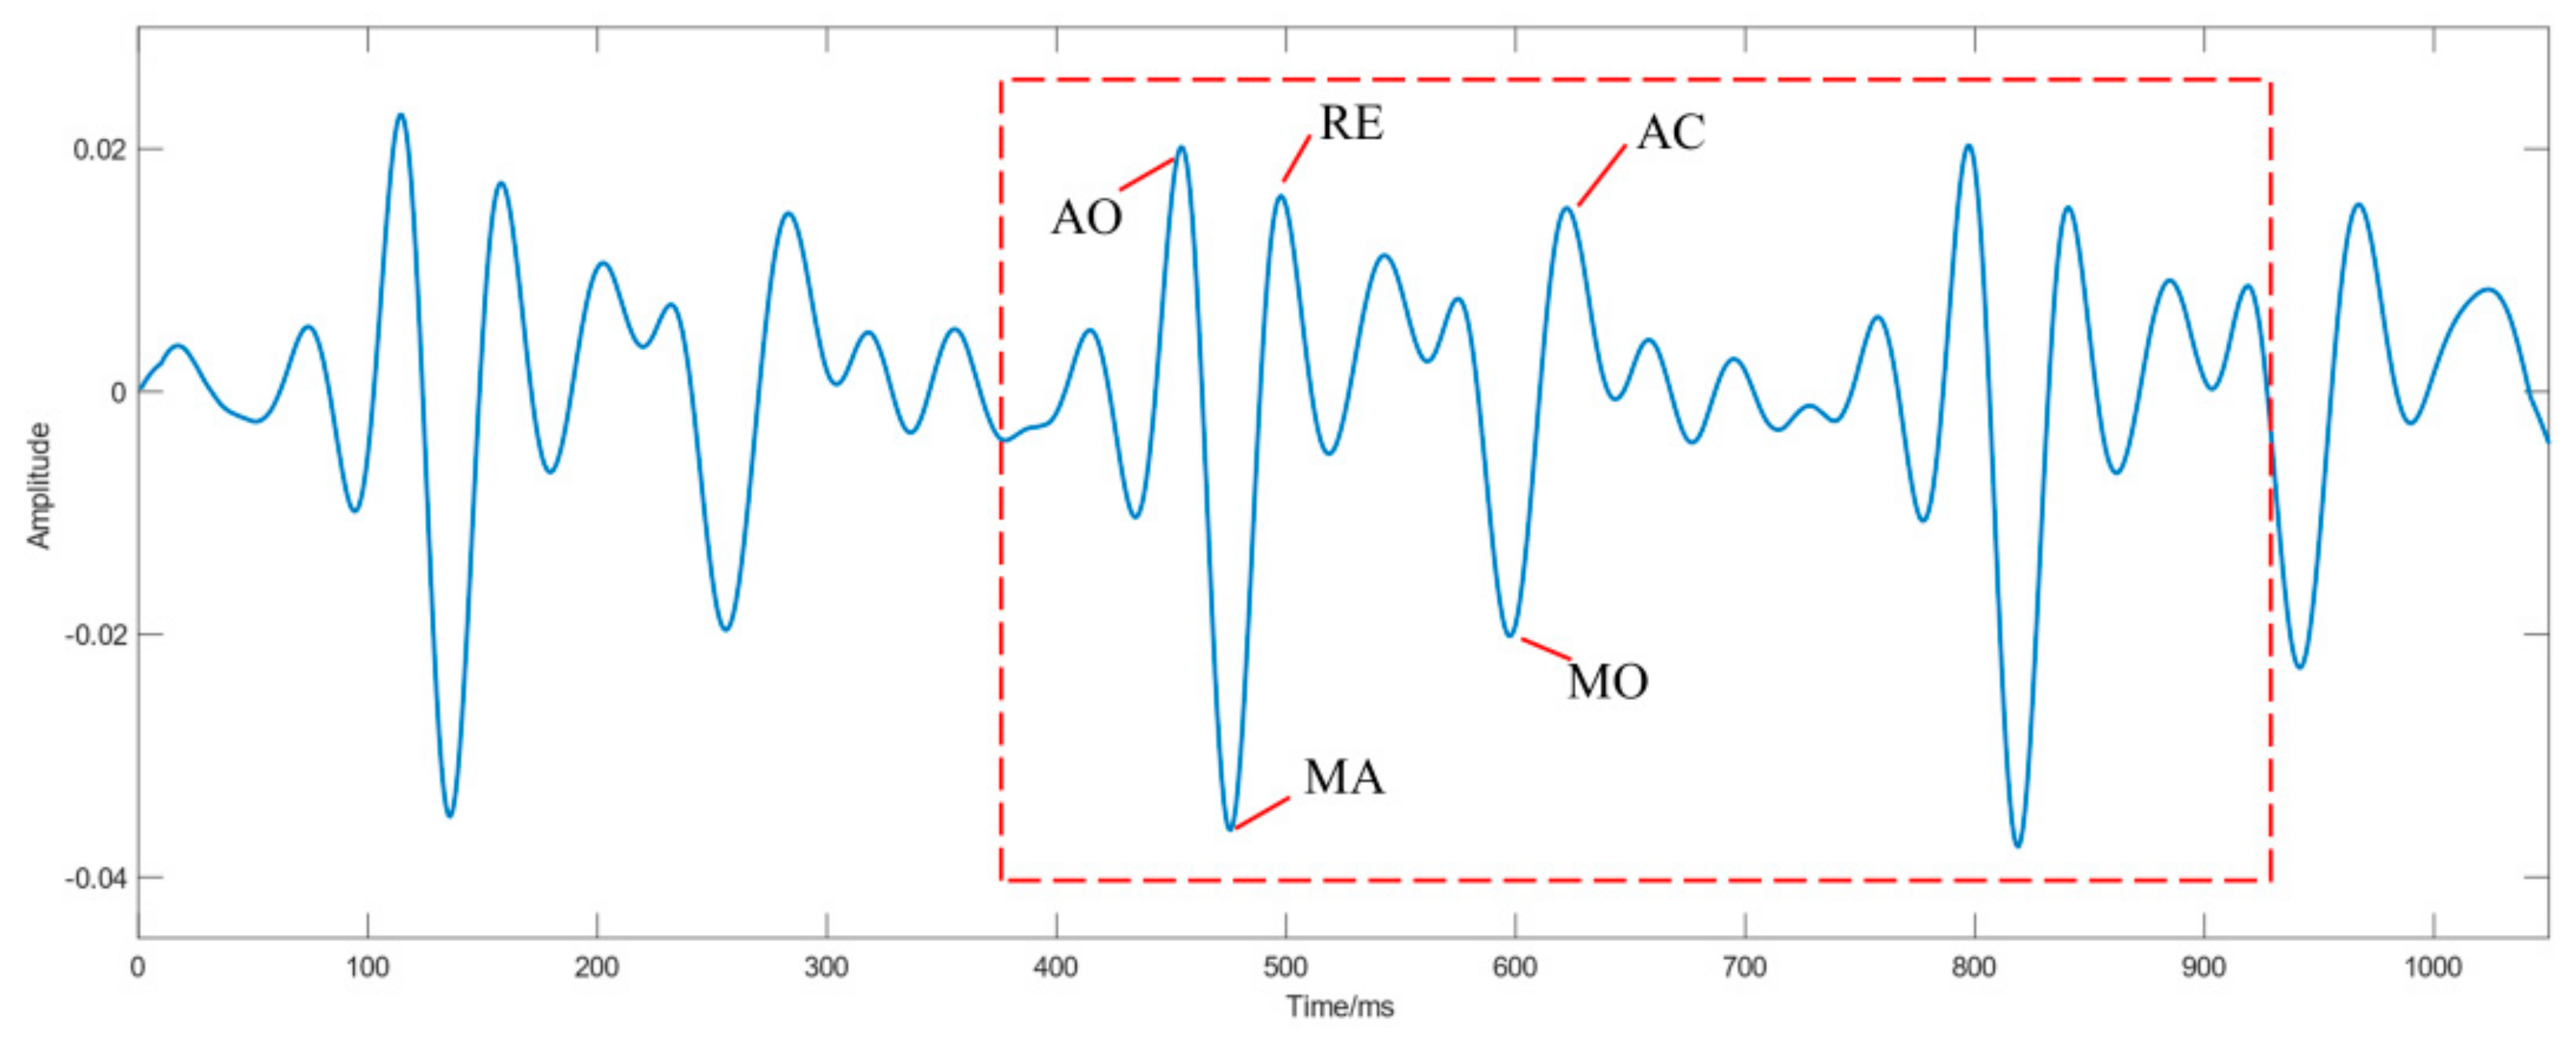
2.2. SCG Signal
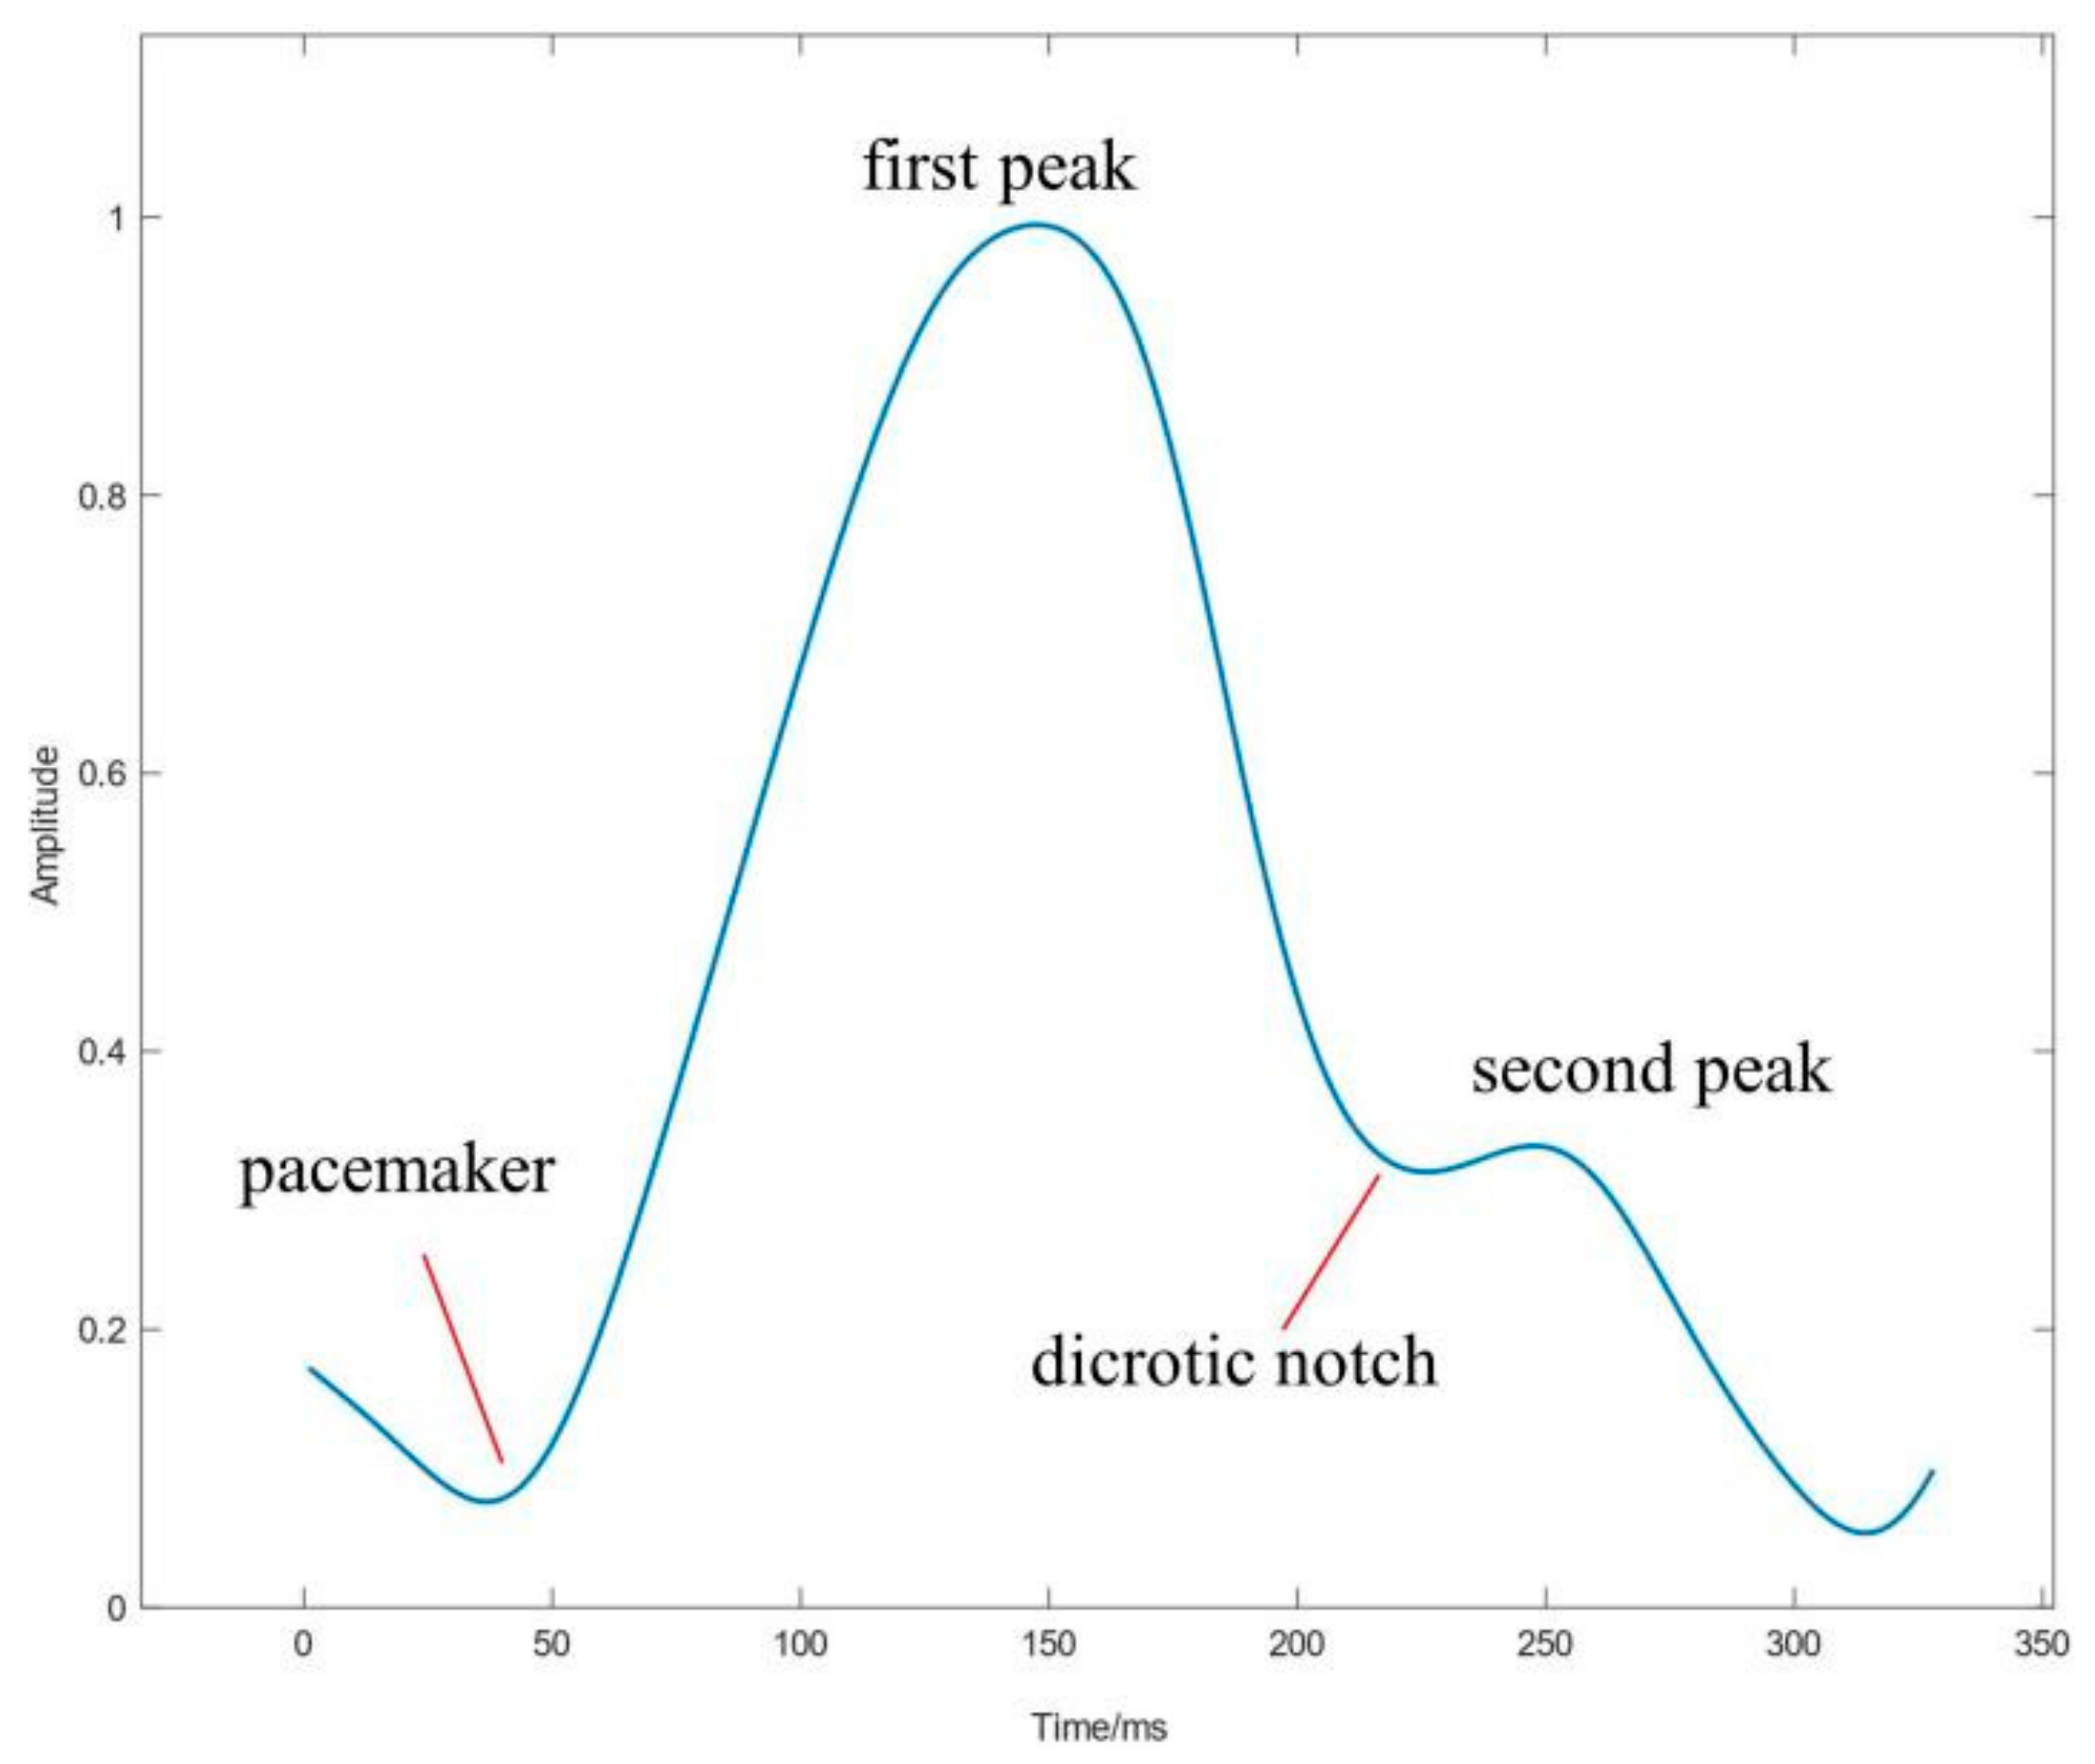
2.3. PPG Signal
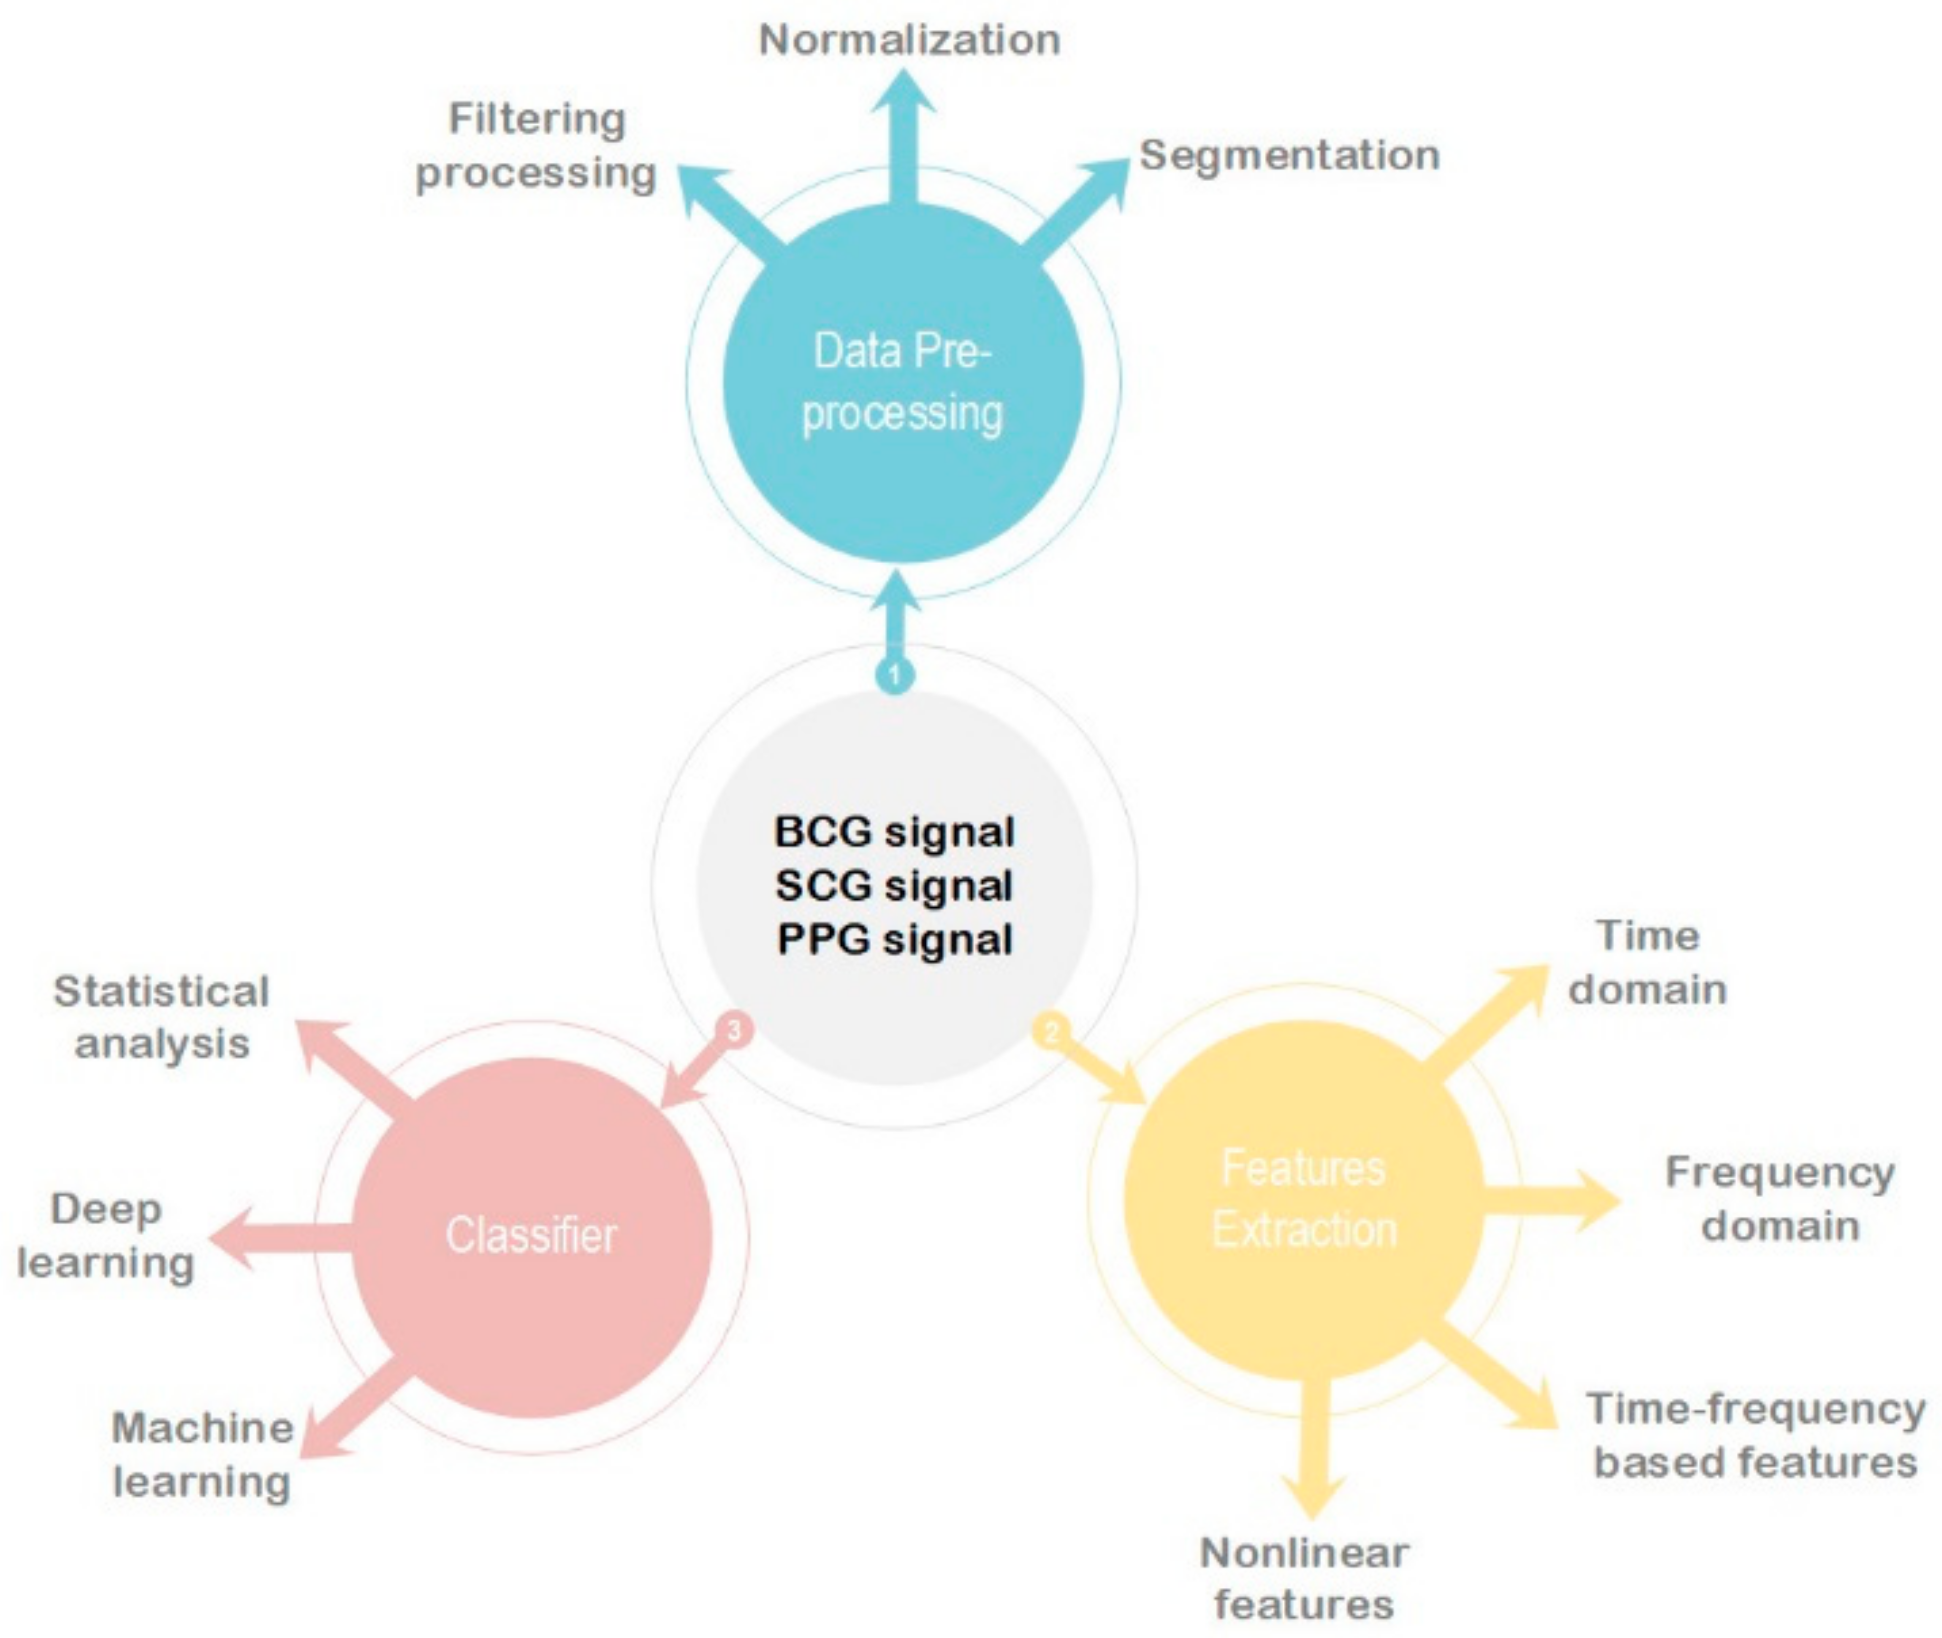
2.4. Data Preprocessing
3. Features Extraction
3.1. Time-Domain Features
3.2. Frequency-Domain Features
3.3. Time-Frequency-Domain Features
3.4. Nonlinear Features
3.5. Other Features
4. Classifier
4.1. Machine Learning
4.1.1. Support Vector Machine
4.1.2. Random Forest
4.1.3. Other ML Models
4.2. Deep Learning
4.3. Statistical Analysis
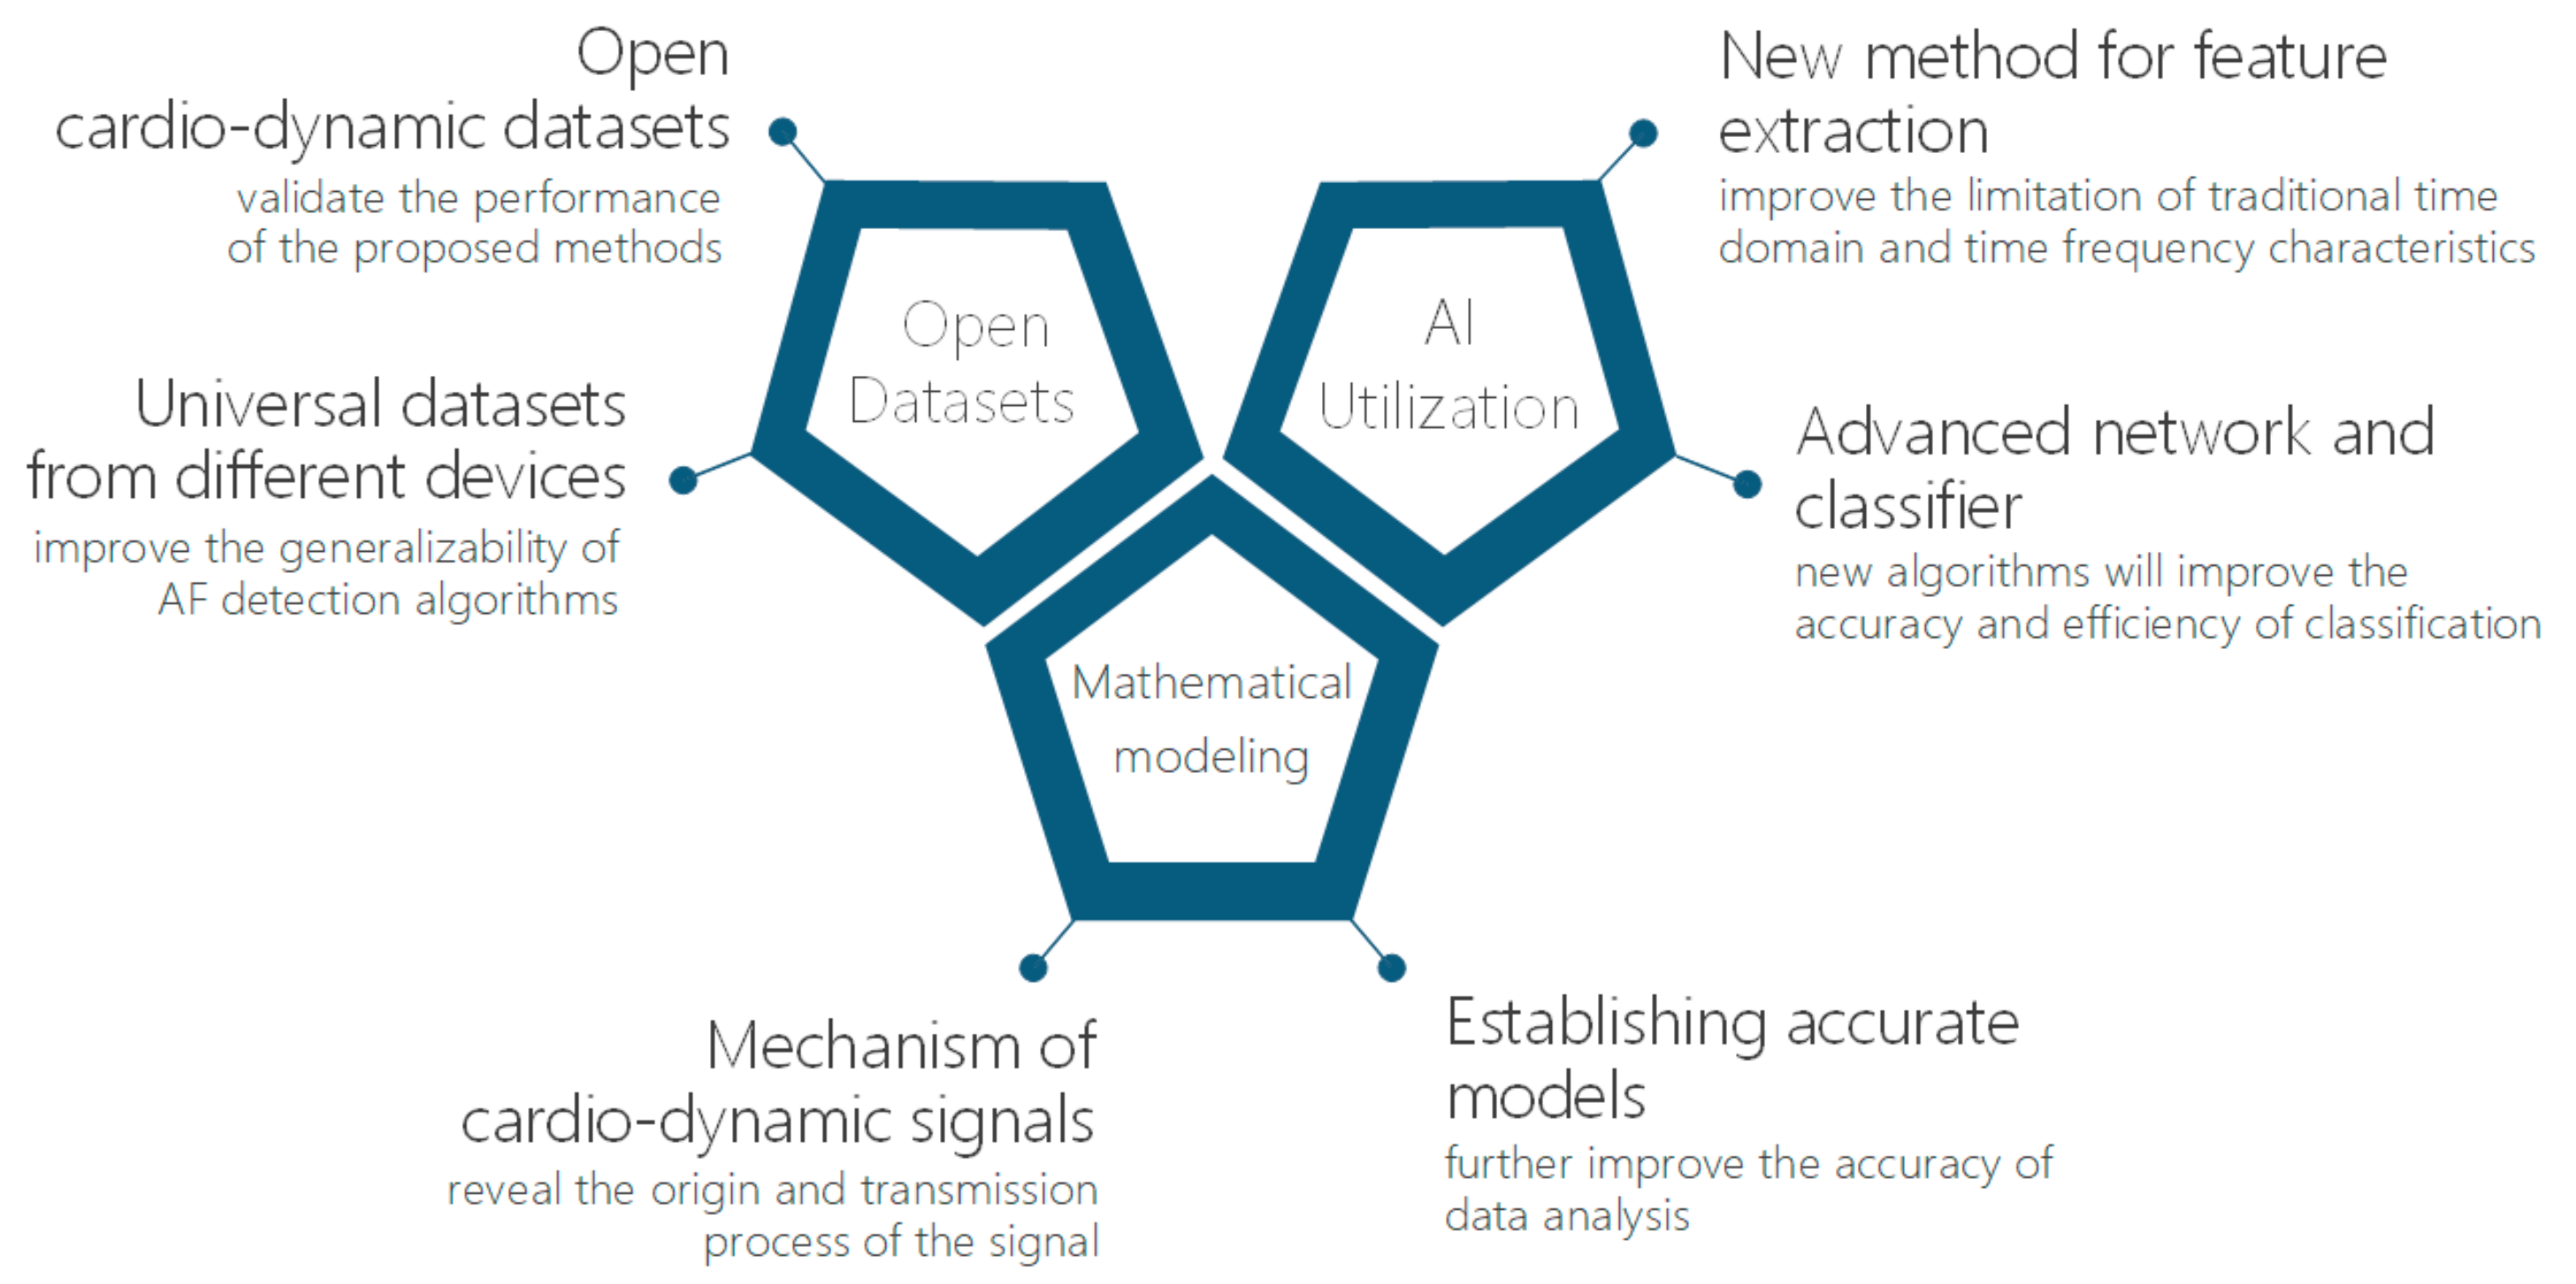
5. Conclusions
Author Contributions
Funding
Institutional Review Board Statement
Informed Consent Statement
Data Availability Statement
Conflicts of Interest
References
- Murphy, A.; Banerjee, A.; Breithardt, G.; Camm, A.J.; Commerford, P.; Freedman, B.; Gonzalez-Hermosillo, J.A.; Halperin, J.L.; Lau, C.P.; Perel, P.; et al. The World Heart Federation roadmap for nonvalvular atrial fibrillation. Glob. Heart 2017, 12, 273–284. [Google Scholar] [CrossRef]
- Yu, B.; Zhang, B.; Xu, L.; Fang, P.; Hu, J. Automatic Detection of Atrial Fibrillation from Ballistocardiogram (BCG) Using Wavelet Features and Machine Learning. In Proceedings of the 2019 41st Annual International Conference of the IEEE Engineering in Medicine and Biology Society (EMBC), Berlin, Germany, 23–27 July 2019; pp. 4322–4325. [Google Scholar]
- Kirchhof, P.; Benussi, S.; Kotecha, D.; Ahlsson, A.; Atar, D.; Casadei, B.; Castella, M.; Diener, H.C.; Heidbuchel, H.; Hendriks, J.; et al. 2016 ESC Guidelines for the management of atrial fibrillation developed in collaboration with EACTS. Eur. Heart J. 2016, 37, 2893–2962. [Google Scholar] [CrossRef] [PubMed]
- Mehrang, S.; Tadi, M.J.; Hurnanen, T.; Knuutila, T.; Lahdenoja, O.; Jaakkola, J.; Jaakkola, S.; Vasankari, T.; Kiviniemi, T.; Airaksinen, J.; et al. Reliability of Self-Applied Smartphone Mechanocardiography for Atrial Fibrillation Detection. IEEE Access 2019, 7, 146801–146812. [Google Scholar] [CrossRef]
- Hagiwara, Y.; Fujita, H.; Oh, S.L.; Tan, J.H.; San Tan, R.; Ciaccio, E.J.; Acharya, U.R. Computer-aided diagnosis of atrial fibrillation based on ECG signals: A review. Inf. Sci. 2018, 467, 99–114. [Google Scholar] [CrossRef]
- Sadek, I.; Biswas, J.; Abdulrazak, B. Ballistocardiogram signal processing: A review. Health Inf. Sci. Syst. 2019, 1, 1–23. [Google Scholar] [CrossRef]
- Kim, C.S.; Carek, A.M.; Inan, O.T.; Mukkamala, R.; Hahn, J.O. Ballistocardiogram-based approach to cuffless blood pressure monitoring: Proof of concept and potential challenges. IEEE Trans. Biomed. Eng. 2018, 65, 2384–2391. [Google Scholar] [CrossRef]
- Inan, O.T.; Migeotte, P.F.; Park, K.S.; Etemadi, M.; Tavakolian, K.; Casanella, R.; Zanetti, J.; Tank, J.; Funtova, I.; Prisk, G.K.; et al. Ballistocardiography and Seismocardiography: A review of recent advances. Biomed. Health Inform. IEEE J. 2015, 19, 1414–1427. [Google Scholar] [CrossRef] [PubMed]
- Hyun, E.; Noh, S.; Yoon, C.; Kim, H.C. Patch type integrated sensor system for measuring electrical and mechanical cardiac activities. In Proceedings of the 2014 IEEE Sensors Applications Symposium (SAS), Queenstown, New Zealand, 18–20 February 2014; pp. 94–96. [Google Scholar]
- Da He, D.; Winokur, E.S.; Sodini, C.G. A continuous, wearable, and wireless heart monitor using head ballistocardiogram (BCG) and head electrocardiogram (ECG). In Proceedings of the 2011 Annual International Conference of the IEEE Engineering in Medicine and Biology Society, Boston, MA, USA, 30 August–3 September 2011; pp. 4729–4732. [Google Scholar]
- Winokur, E.S.; Da He, D.; Sodini, C.G. A wearable vital signs monitor at the ear for continuous heart rate and pulse transit time measurements. In Proceedings of the 2012 Annual International Conference of the IEEE Engineering in Medicine and Biology Society (EMBC 2012), San Diego, CA, USA, 28 August–1 September 2012; pp. 2724–2727. [Google Scholar]
- Kortelainen, J.M.; Virkkala, J. FFT averaging of multichannel BCG signals from bed mattress sensor to improve estimation of heart beat interval. In Proceedings of the 2007 29th Annual International Conference of the IEEE Engineering in Medicine and Biology Society, Lyon, France, 22–26 August 2007; pp. 6685–6688. [Google Scholar]
- Inan, O.T.; Etemadi, M.; Wiard, R.M.; Giovangrandi, L.; Kovacs, G.T. Robust ballistocardiogram acquisition for home monitoring. Physiol. Meas. 2009, 30, 169–185. [Google Scholar] [CrossRef]
- Paalasmaa, J.; Waris, M.; Toivonen, H.; Leppäkorpi, L.; Partinen, M. Unobtrusive online monitoring of sleep at home. In Proceedings of the 2012 Annual International Conference of the IEEE Engineering in Medicine and Biology Society (EMBC 2012), San Diego, CA, USA, 28 August–1 September 2012; pp. 3784–3788. [Google Scholar]
- Wang, F.; Tanaka, M.; Chonan, S. Development of a PVDF piezopolymer sensor for unconstrained in-sleep cardiorespiratory monitoring. J. Intell. Mater. Syst. Struct. 2003, 14, 185–190. [Google Scholar] [CrossRef]
- Wen, X.; Huang, Y.; Wu, X.; Zhang, B. A feasible feature extraction method for atrial fibrillation detection from BCG. IEEE J. Biomed. Health Inform. 2019, 24, 1093–1103. [Google Scholar] [CrossRef]
- Brüser, C.; Zink, M.D.; Winter, S.; Schauerte, P.; Leonhardt, S. A feasibility study on the automatic detection of atrial fibrillation using an unobtrusive bed-mounted sensor. In Proceedings of the 2011 Computing in Cardiology, Hangzhou, China, 18–21 September 2011; pp. 13–16. [Google Scholar]
- Brüser, C.; Diesel, J.; Zink, M.D.; Winter, S.; Schauerte, P.; Leonhardt, S. Automatic detection of atrial fibrillation in cardiac vibration signals. IEEE J. Biomed. Health Inform. 2012, 17, 162–171. [Google Scholar] [CrossRef] [PubMed]
- Zink, M.D.; Brüser, C.; Winnersbach, P.; Napp, A.; Leonhardt, S.; Marx, N.; Schauerte, P.; Mischke, K. Heartbeat cycle length detection by a ballistocardiographic sensor in atrial fibrillation and sinus rhythm. BioMed Res. Int. 2015, 2015, 840356. [Google Scholar] [CrossRef]
- Jiang, F.; Xu, J.; Lu, Z.; Song, B.; Hu, Z.; Li, R.; Xu, L. A Transfer Learning Approach to Detect Paroxysmal Atrial Fibrillation Automatically Based on Ballistocardiogram Signal. J. Med. Imaging Health Inform. 2019, 9, 1943–1949. [Google Scholar] [CrossRef]
- Jiang, F.; Hong, C.; Cheng, T.; Wang, H.; Xu, B.; Zhang, B. Attention-based multi-scale features fusion for unobtrusive atrial fibrillation detection using ballistocardiogram signal. BioMed. Eng. OnLine 2021, 20, 12. [Google Scholar] [CrossRef] [PubMed]
- Koivisto, T.; Lahdenoja, O.; Koskinen, J.; Panula, T.; Hurnanen, T.; Kaisti, M.; Kinnunen, J.; Kostiainen, P.; Meriheina, U.; Vasankari, T.; et al. Atrial fibrillation detection using mems accelerometer based bedsensor. In Proceedings of the 2019 Computing in Cardiology (CinC), Singapore, 8–11 September 2019; p. 1. [Google Scholar]
- Panula, T.; Hurnanen, T.; Tuominen, J.; Kaisti, M.; Koskinen, J.; Pänkäälä, M.; Koivisto, T. A Wearable Sensor Node for Detecting Atrial Fibrillation Using Real-Time Digital Signal Processing. In Proceedings of the 2018 25th IEEE International Conference on Electronics, Circuits and Systems (ICECS), Bordeaux, France, 9–12 December 2018; pp. 681–684. [Google Scholar]
- Pänkäälä, M.; Koivisto, T.; Lahdenoja, O.; Kiviniemi, T.; Saraste, A.; Vasankari, T.; Airaksinen, J. Detection of atrial fibrillation with seismocardiography. In Proceedings of the 2016 38th Annual International Conference of the IEEE Engineering in Medicine and Biology Society (EMBC), Orlando, FL, USA, 16–20 August 2016; pp. 4369–4374. [Google Scholar]
- Castiglioni, P.; Faini, A.; Parati, G.; Di Rienzo, M. Wearable seismocardiography. In Proceedings of the 2007 29th Annual International Conference of the IEEE Engineering in Medicine and Biology Society, Lyon, France, 22–26 August 2007; pp. 3954–3957. [Google Scholar]
- Baevsky, R.M.; Funtova, I.I.; Diedrich, A.; Chernikova, A.G.; Drescher, J.; Baranov, V.M.; Tank, J. Autonomic function testing aboard the ISS using “PNEUMOCARD”. Acta Astronaut. 2009, 65, 930–932. [Google Scholar] [CrossRef]
- Di Rienzo, M.; Meriggi, P.; Rizzo, F.; Vaini, E.; Faini, A.; Merati, G.; Parati, G.; Castiglioni, P. A wearable system for the seismocardiogram assessment in daily life conditions. In Proceedings of the 2011 Annual International Conference of the IEEE Engineering in Medicine and Biology Society (EMBC 2011), Boston, MA, USA, 30 August–3 September 2011; pp. 4263–4266. [Google Scholar]
- Koivistoinen, T.; Junnila, S.; Varri, A.; Koobi, T. A new method for measuring the ballistocardiogram using EMFi sensors in a normal chair. In Proceedings of the 26th Annual International Conference of the IEEE Engineering in Medicine and Biology Society, San Francisco, CA, USA, 1–5 September 2004; Volume 1, pp. 2026–2029. [Google Scholar]
- Walter, M.; Eilebrecht, B.; Wartzek, T.; Leonhardt, S. The smart car seat: Personalized monitoring of vital signs in automotive applications. Pers. Ubiquitous Comput. 2011, 15, 707–715. [Google Scholar] [CrossRef]
- Koivisto, T.; Pänkäälä, M.; Hurnanen, T.; Vasankari, T.; Kiviniemi, T.; Saraste, A.; Airaksinen, J. Automatic detection of atrial fibrillation using MEMS accelerometer. In Proceedings of the 2015 Computing in Cardiology Conference (CinC), Nice, France, 6–9 September 2015; pp. 829–832. [Google Scholar]
- Hurnanen, T.; Lehtonen, E.; Tadi, M.J.; Kuusela, T.; Kiviniemi, T.; Saraste, A.; Vasankari, T.; Airaksinen, J.; Koivisto, T.; Pänkäälä, M. Automated detection of atrial fibrillation based on time–frequency analysis of seismocardiograms. IEEE J. Biomed. Health Inform. 2016, 21, 1233–1241. [Google Scholar] [CrossRef] [PubMed]
- Kaisti, M.; Panula, T.; Leppänen, J.; Punkkinen, R.; Tadi, M.J.; Vasankari, T.; Jaakkola, S.; Kiviniemi, T.; Airaksinen, J.; Kostiainen, P.; et al. Clinical assessment of a non-invasive wearable MEMS pressure sensor array for monitoring of arterial pulse waveform, heart rate and detection of atrial fibrillation. NPJ Digit. Med. 2019, 2, 39. [Google Scholar] [CrossRef]
- Lahdenoja, O.; Hurnanen, T.; Iftikhar, Z.; Nieminen, S.; Knuutila, T.; Saraste, A.; Kiviniemi, T.; Vasankari, T.; Airaksinen, J.; Pänkäälä, M.; et al. Atrial fibrillation detection via accelerometer and gyroscope of a smartphone. IEEE J. Biomed. Health Inform. 2017, 22, 108–118. [Google Scholar] [CrossRef]
- Tadi, M.J.; Mehrang, S.; Kaisti, M.; Lahdenoja, O.; Hurnanen, T.; Jaakkola, J.; Jaakkola, S.; Vasankari, T.; Kiviniemi, T.; Airaksinen, J.; et al. Comprehensive analysis of cardiogenic vibrations for automated detection of atrial fibrillation using smartphone mechanocardiograms. IEEE Sens. J. 2018, 19, 2230–2242. [Google Scholar] [CrossRef]
- Iftikhar, Z.; Lahdenoja, O.; Tadi, M.J.; Hurnanen, T.; Vasankari, T.; Kiviniemi, T.; Airaksinen, J.; Koivisto, T.; Pänkäälä, M. Multiclass classifier based cardiovascular condition detection using smartphone mechanocardiography. Sci. Rep. 2018, 8, 9344. [Google Scholar] [CrossRef] [PubMed]
- Mehrang, S.; Lahdenoja, O.; Kaisti, M.; Tadi, M.J.; Hurnanen, T.; Airola, A.; Knuutila, T.; Jaakkola, J.; Jaakkola, S.; Vasankari, T.; et al. Classification of Atrial Fibrillation and Acute Decompensated Heart Failure Using Smartphone Mechanocardiography: A Multilabel Learning Approach. IEEE Sens. J. 2020, 20, 7957–7968. [Google Scholar] [CrossRef]
- Pereira, T.; Tran, N.; Gadhoumi, K.; Pelter, M.M.; Do, D.H.; Lee, R.J.; Colorado, R.; Meisel, K.; Hu, X. Photoplethysmography based atrial fibrillation detection: A review. NPJ Digit. Med. 2020, 3, 3. [Google Scholar] [CrossRef] [PubMed]
- Ping, S. PPG for Cardiovascular Assessment and its Application. Ph.D. Thesis, Shanghai Jiao Tong University, Shanghai, China, 8 May 2010. (In Chinese). [Google Scholar]
- Tamura, T.; Maeda, Y.; Sekine, M.; Yoshida, M. Wearable photoplethysmographic sensors—Past and present. Electronics 2014, 3, 282–302. [Google Scholar] [CrossRef]
- Shi, J.; Alikhani, I.; Li, X.; Yu, Z.; Seppänen, T.; Zhao, G. Atrial fibrillation detection from face videos by fusing subtle variations. IEEE Trans. Circuits Syst. Video Technol. 2019, 30, 2781–2795. [Google Scholar] [CrossRef]
- Bonomi, A.G.; Schipper, F.; Eerikäinen, L.M.; Margarito, J.; Aarts, R.M.; Babaeizadeh, S.; de Morree, H.M.; Dekker, L. Atrial fibrillation detection using photo-plethysmography and acceleration data at the wrist. In Proceedings of the 2016 Computing in Cardiology Conference (CinC), Vancouver, BC, Canada, 11–14 September 2016; pp. 277–280. [Google Scholar]
- Bonomi, A.G.; Schipper, F.; Eerikäinen, L.M.; Margarito, J.; Van Dinther, R.; Muesch, G.; De Morree, H.M.; Aarts, R.M.; Babaeizadeh, S.; McManus, D.D.; et al. Atrial Fibrillation Detection Using a Novel Cardiac Ambulatory Monitor Based on Photo-Plethysmography at the Wrist. J. Am. Heart Assoc. 2018, 7, e009351. [Google Scholar] [CrossRef] [PubMed]
- Eerikäinen, L.M.; Bonomi, A.G.; Schipper, F.; Dekker, L.R.; de Morree, H.M.; Vullings, R.; Aarts, R.M. Detecting atrial fibrillation and atrial flutter in daily life using photoplethysmography data. IEEE J. Biomed. Health Inform. 2019, 24, 1610–1618. [Google Scholar] [CrossRef]
- Bashar, S.K.; Han, D.; Hajeb-Mohammadalipour, S.; Ding, E.; Whitcomb, C.; McManus, D.D.; Chon, K.H. Atrial fibrillation detection from wrist photoplethysmography signals using smartwatches. Sci. Rep. 2019, 9, 15054. [Google Scholar] [CrossRef]
- Shashikumar, S.P.; Shah, A.J.; Li, Q.; Clifford, G.D.; Nemati, S. A deep learning approach to monitoring and detecting atrial fibrillation using wearable technology. In Proceedings of the 2017 IEEE EMBS International Conference on Biomedical & Health Informatics (BHI), Orlando, FL, USA, 16–19 February 2017; pp. 141–144. [Google Scholar]
- Conroy, T.; Guzman, J.H.; Hall, B.; Tsouri, G.; Couderc, J.P. Detection of atrial fibrillation using an earlobe photoplethysmographic sensor. Physiol. Meas. 2017, 38, 1906–1918. [Google Scholar] [CrossRef]
- Aliamiri, A.; Shen, Y. Deep learning based atrial fibrillation detection using wearable photoplethysmography sensor. In Proceedings of the 2018 IEEE EMBS International Conference on Biomedical & Health Informatics (BHI), Las Vegas, NV, USA, 4–7 March 2018; pp. 442–445. [Google Scholar]
- Tang, S.C.; Huang, P.W.; Hung, C.S.; Shan, S.M.; Lin, Y.H.; Shieh, J.S.; Lai, D.M.; Wu, A.Y.; Jeng, J.S. Identification of atrial fibrillation by quantitative analyses of fingertip photoplethysmogram. Sci. Rep. 2017, 7, 45644. [Google Scholar] [CrossRef] [PubMed]
- Ferranti, L.; Laureanti, R. Atrial fibrillation detection in PPG signal recorded through a wristband device. Sci. Rep. 2019, 9, 15054. [Google Scholar]
- Couderc, J.P.; Kyal, S.; Mestha, L.K.; Xu, B.; Peterson, D.R.; Xia, X.; Hall, B. Detection of atrial fibrillation using contactless facial video monitoring. Heart Rhythm 2015, 12, 195–201. [Google Scholar] [CrossRef] [PubMed]
- Poh, M.Z.; Poh, Y.C.; Chan, P.H.; Wong, C.K.; Pun, L.; Leung, W.W.; Wong, Y.F.; Wong, M.M.; Chu, D.W.; Siu, C.W. Diagnostic assessment of a deep learning system for detecting atrial fibrillation in pulse waveforms. Heart 2018, 104, 1921–1928. [Google Scholar] [CrossRef] [PubMed]
- Chan, P.H.; Wong, C.K.; Poh, Y.C.; Pun, L.; Leung, W.W.; Wong, Y.F.; Wong, M.M.; Poh, M.Z.; Chu, D.W.; Siu, C.W. Diagnostic performance of a smartphone-based photoplethysmographic application for atrial fibrillation screening in a primary care setting. J. Am. Heart Assoc. 2016, 5, e003428. [Google Scholar] [CrossRef] [PubMed]
- Krivoshei, L.; Weber, S.; Burkard, T.; Maseli, A.; Brasier, N.; Kühne, M.; Conen, D.; Huebner, T.; Seeck, A.; Eckstein, J. Smart detection of atrial fibrillation. Europace 2017, 19, 753–757. [Google Scholar] [CrossRef]
- Estrella-Gallego, A.; Vazquez-Briseno, M.; Nieto-Hipolito, J.I.; Gutierrez-Lopez, E.; Sanchez-Lopez, J.D.; Garcia-Berumen, A.; Rivera-Rodriguez, R. Monitoring Atrial Fibrillation Using PPG Signals and a Smartphone. Int. J. Online Biomed. Eng. 2020, 16, 60–74. [Google Scholar] [CrossRef]
- Urdan, T.C. Statistics in Plain English; Routledge: London, UK, 2005. [Google Scholar]
- Dibley, M.J.; Staehling, N.; Nieburg, P.; Trowbridge, F.L. Interpretation of Z-score anthropometric indicators derived from the international growth reference. Am. J. Clin. Nutr. 1987, 46, 749–762. [Google Scholar] [CrossRef]
- Yang, C.; Veiga, C.; Rodriguez-Andina, J.J.; Farina, J.; Iniguez, A.; Yin, S. Using PPG signals and wearable devices for atrial fibrillation screening. IEEE Trans. Ind. Electron. 2019, 66, 8832–8842. [Google Scholar] [CrossRef]
- Song, Y.; Ni, H.; Zhou, X.; Zhao, W.; Wang, T. Extracting features for cardiovascular disease classification based on ballistocardiography. In Proceedings of the 2015 IEEE 12th International Conference on Ubiquitous Intelligence and Computing and 2015 IEEE 12th International Conference on Autonomic and Trusted Computing and 2015 IEEE 15th International Conference on Scalable Computing and Communications and Its Associated Workshops (UIC-ATC-ScalCom), Beijing, China, 10–14 August 2015; pp. 1230–1235. [Google Scholar]
- Shan, S.M.; Tang, S.C.; Huang, P.W.; Lin, Y.M.; Huang, W.H.; Lai, D.M.; Wu, A.Y. Reliable PPG-based algorithm in atrial fibrillation detection. In Proceedings of the 2016 IEEE Biomedical Circuits and Systems Conference (BioCAS), Shanghai, China, 17–19 October 2016; pp. 340–343. [Google Scholar]
- Hoshi, R.A.; Pastre, C.M.; Vanderlei, L.C.; Godoy, M.F. Poincaré plot indexes of heart rate variability: Relationships with other nonlinear variables. Auton. Neurosci. 2013, 177, 271–274. [Google Scholar] [CrossRef]
- Mohri, M.; Rostamizadeh, A.; Talwalkar, A. Foundations of Machine Learning; MIT Press: Cambridge, MA, USA, 2018. [Google Scholar]
- Elaidi, H.; Elhaddar, Y.; Benabbou, Z.; Abbar, H. An idea of a clustering algorithm using support vector machines based on binary decision tree. In Proceedings of the 2018 International Conference on Intelligent Systems and Computer Vision (ISCV), Fez, Morocco, 2–4 April 2018; pp. 1–5. [Google Scholar]
- Sihem, N.I.; Bitam, S.; Mellouk, A. An enhanced random forest for cardiac diseases identification based on ECG signal. In Proceedings of the 2018 14th International Wireless Communications & Mobile Computing Conference (IWCMC), Limassol, Cyprus, 25–29 June 2018; pp. 1339–1344. [Google Scholar]
- Saini, I.; Singh, D.; Khosla, A. Delineation of ECG wave components using K-nearest neighbor (KNN) algorithm: ECG wave delineation using KNN. In Proceedings of the 2013 10th International Conference on Information Technology: New Generations, Las Vegas, NV, USA, 15–17 April 2013; pp. 712–717. [Google Scholar]
- Shi, H.; Wang, H.; Huang, Y.; Zhao, L.; Qin, C.; Liu, C. A hierarchical method based on weighted extreme gradient boosting in ECG heartbeat classification. Comput. Methods Programs Biomed. 2019, 171, 1–10. [Google Scholar] [CrossRef] [PubMed]
- Shahraki, A.; Abbasi, M.; Haugen, Ø. Boosting algorithms for network intrusion detection: A comparative evaluation of Real AdaBoost, Gentle AdaBoost and Modest AdaBoost. Eng. Appl. Artif. Intell. 2020, 94, 103770. [Google Scholar] [CrossRef]
- Piryonesi, S.M.; El-Diraby, T.E. Role of data analytics in infrastructure asset management: Overcoming data size and quality problems. J. Transp. Eng. Part B Pavements 2020, 146, 04020022. [Google Scholar] [CrossRef]
- Piccialli, F.; Di Somma, V.; Giampaolo, F.; Cuomo, S.; Fortino, G. A survey on deep learning in medicine: Why, how and when? Inf. Fusion 2021, 66, 111–137. [Google Scholar] [CrossRef]
- Dixon, W.J.; Massey, F.J., Jr. Introduction to Statistical Analysis; McGraw-Hill: New York, NY, USA, 1951. [Google Scholar]
- Zou, H.; Hastie, T. Regularization and variable selection via the elastic net. J. R. Stat. Soc. Ser. B 2005, 67, 301–320. [Google Scholar] [CrossRef]
- Nemati, S.; Ghassemi, M.M.; Ambai, V.; Isakadze, N.; Levantsevych, O.; Shah, A.; Clifford, G.D. Monitoring and detecting atrial fibrillation using wearable technology. In Proceedings of the 2016 38th Annual International Conference of the IEEE Engineering in Medicine and Biology Society (EMBC), Orlando, FL, USA, 16–20 August 2016; pp. 3394–3397. [Google Scholar]


| Signal | Instrument/Sensor | Sampling Rate | |
|---|---|---|---|
| BCG | EMFi | L-series (290 × 600 mm) of Emfit (Finland) [16] | 125 Hz |
| EMFi sensor (40 × 79 cm) of Emfit (Finland) [2] | 125 Hz | ||
| EMFi sensor (30 × 60 cm) of Emfit (Finland) [17,18,19] | 128 Hz | ||
| PVDF | Polyvinylidene fluoride (PVDF) sensor [20,21] | 125 Hz | |
| Murata BCG sensor (SCA10/11H) [22] | 125 Hz | ||
| MEMS | LSM6DSM always-on 3D accelerometer and 3D gyroscope [23] | - | |
| SCG | Single MEMS | Digital output three-axis MEMS (Free scale Semiconductor, MMA8451Q) with 14 bits of resolution [30,31] | 800 Hz |
| Analog output one-axis MEMS accelerometer (VTI Technologies Oy, SCA620) [24] | 3000 Hz | ||
| MEMS pressure sensor element (SCB10H) [32] | 1000 Hz | ||
| Smartphone | Sony Xperia Z Series Smartphone (a three-axis accelerometer inside the smartphone and the six data channels of three gyroscopes) [33] | 200 Hz | |
| Sony Xperia Z1 or Z5 smartphone (sing a custom-designed Android application) [34,36] | 200 Hz | ||
| Smartphone [4,35] | 200 Hz | ||
| PPG | PD | Philips heart and motion detection module’s (CM3 Generation3, Wearable Sensing Technologies) wrist wearable sensor [41,42,43] | 128 Hz |
| Earlobe PPG sensor (HeartSensor HRS-07UE, BINAR Integrated Mobile Systems, Washington, DC, USA) [46] | 300 Hz | ||
| Smart wristwatch provided by Samsung (“Simband”) [44,45] | 128 Hz | ||
| Samsung gear device [47] | 100 Hz | ||
| Bedside monitor (IntelliVue MP70, Philips, Netherlands) [48] | 128 Hz | ||
| PPG Empatica E4 wristband [49] | 64 Hz | ||
| Camera | RGB network camera (Dell Precision M6400, 30 frames per second, resolution 1280 × 720) [50] | 200 Hz | |
| Smartphone (iPhone 4S, Apple, Inc., Cupertino, CA, USA) [51,52,53] | 30 Hz | ||
| Samsung Galaxy 6 smartphone and Samsung Galaxy S8 Plus smartphone [54] | - | ||
| Feature Type | Features | Signal | Method |
|---|---|---|---|
| Time-domain | Signal morphology | BCG | Skewness and kurtosis [17] |
| Skewness, kurtosis, standard deviation, the difference between the maximum and minimum values of each segment [18] | |||
| Entire BCG segment [20] | |||
| SCG | Entire SCG segment [30] | ||
| Variance of the difference between maximum and minimum [24] | |||
| Zero-crossing ratio [34] | |||
| PPG | Entire PPG segment [47,51] | ||
| Kurtosis [43] | |||
| Time interval | SCG | AO–AO interval [24] | |
| PPG | BBI [41,42] | ||
| Heart rate | BCG | HR from sensor built-in algorithms [22] | |
| SCG | IHR [34,35] | ||
| HR from the median of the eight BBI [34] | |||
| HR approximation was achieved by computing short segment autocorrelations [36] | |||
| PPG | HR from means of the location of each PPG waveform trough [54] | ||
| HRV | SCG | Means of the median absolute difference of the cardiac cycle durations [31] | |
| RMSSD and the median difference based on the successive SCG BBI [34] | |||
| Root-mean-square of the successive median absolute difference of SCG BBI and the two higher-order HRV parameters [33,35] | |||
| Median absolute difference of the obtained BBI [36] | |||
| BCG | Mean, standard deviation of BBI and RMSSD [58] | ||
| PPG | Normalized SD and RMSSD [59] | ||
| RMSSD, mean, SD [40] | |||
| SD, a robust version of SD, and a weighted SD [45] | |||
| Avg ∆ SS, SDSS, pNNx, CVSS [46] | |||
| SD [43] | |||
| RMSSD [44,48,53] | |||
| Frequency domain | FFT/PSD | SCG | Spectral flux and the spectral peaks [34] |
| BCG | Spectral entropy, the dominant frequency, and the magnitude and ratio of the dominant frequency [2] | ||
| HF, LF and the LF/HF components [58] | |||
| PPG | LF, HF and LF/HF [48,59] | ||
| LF, HF and normalized LF/HF [40] | |||
| Spectral entropy [43] | |||
| Time frequency domain | Wavelet | BCG | Power distribution profile using time-invariant stationary WT [2] |
| PPG | The wavelet power spectrum [45] | ||
| Time-varying PSD/FFT | SCG | Spectral entropy [31,32,33,34,35,36] | |
| BCG | Seven time-frequency features based on PSD, such as skewness, kurtosis [18,57] | ||
| Nonlinear | Approximate entropy estimate (APEN) | SCG | ApEn is a self-similarity parameter that quantifies the unpredictability of fluctuations in a time-series [33,35,36] |
| Turning point ratios (TPR) | SCG | Nonparametric statistical approach to determine the randomness of the signal [33,34,35,36] | |
| PPG | Ratio of the turning point to total data length [48,59] | ||
| Sample entropy (SampEn) | PPG | Modified version of ApEn, which is considered to assess the complexity or dynamics of physiological time-series [43,45,48,59] | |
| Shannon entropy | PPG | Common entropy definition in information theory [43,48,53,59] | |
| Poincaré plot analysis (PPA) | PPG | SD1 (axis vertical to the line of identity), SD2 (axis along the line of identity) [40] and SD1/SD2 [53] | |
| Other | New defined | BCG | Mean value, variance, skewness, and kurtosis of four new defined data sequences [16] |
| Classifiers | Models | Signal | Dataset | Performance | Comparison | |
|---|---|---|---|---|---|---|
| ML | SVM | BCG | 8 h data from 37 subjects [16] | SEN = 96.8% PRE = 92.8% ACC = 94.5% | NB, BAT, RF, DT | |
| 7.5 h data from 12 AF patients [2] | ACC = 92.2% SEN = 95.82% | BT, KNN | ||||
| 2 h data from 10 AF patients [17] | SEN = 96.2% SP = 91.9% | - | ||||
| SCG | 16 AF patients, 23 healthy individuals [33] | ACC = 97.4% SP = 100% | KSVM, RF | |||
| 3 min data from 23 healthy individuals, 40 AF patients [35] | ACC = 98.4% | RF | ||||
| PPG | 468 AF patients [59] | ROC = 97.1% SEN = 94.2% ACC = 95.7% | - | |||
| 10 min data from 30 AF patients and 31 healthy individuals [49] | ACC = 90% SEN = 96.67% | - | ||||
| 10 min data from 30 AF patients and 30 healthy individuals [40] | SEN = 91% SP = 94.11% ACC = 92.56% | - | ||||
| 11 AF patients [57] | ACC = 90% | - | ||||
| RF | BCG | 30 min BCG data from 20 AF patients and 15 healthy individuals [22] | SEN = 100% SP = 93.3% | SVM | ||
| 45 min data from 10 AF patients [18] | Matthews correlation coefficient = 0.921 SEN = 93.8% SP = 98.2% | LDA, QDA, SVM, NB, BoT, BAT | ||||
| SCG | 3 min data from 435 subjects, including 190 AF patients and 245 healthy individuals [34] | AUC = 0.972~0.983 | KSVM | |||
| PPG | 24 h data from 40 subjects (14 with AF) [43] | SEN = 93.6% SP = 88.2% | - | |||
| Others | NB | BCG | 18 subjects [58] | PRE = 92.3% ACC = 92.30% | - | |
| Linear least-squares | SCG | 119 min of AF data 126 min of SR data from 13 patients [31] | TPR = 99.9% TNR = 96.4% | - | ||
| K-means clustering | 10 min data from 7 AF patients [32] | SEN = 99.1% PRE = 100% | - | |||
| Extreme gradient boosting | three minutes data from 150 AF patients and 150 healthy individuals [36] | AUC = 0.98 | LR, RF | |||
| K-nearest neighbor | PPG | 11 AF patients [57] | ACC = 90% | KSVM | ||
| DL | CNN | BCG | 8 h data from 19 patients [20] | ACC = 95.8% SEN = 98.3% SP = 93.3% PRE = 93.7% | - | |
| 8 h data from AF patients [21] | ACC = 94.7% SP = 93.5% SEN = 95.9% PRE = 93.7% | - | ||||
| PPG | 5 min data from 45 AF patients and 53 healthy individuals [45] | AUC = 0.95 ACC = 91.8% | - | |||
| End to end model | PPG | 19 AF patients [47] | ACC = 98.19% | - | ||
| DCNN | PPG | 17 s PPG waveforms, 149,048 PPG waveforms from 3039 subjects [51] | SEN = 95.2% CI = 88.3%~98.7% SP = 99.0% ACC = 96.1% | - | ||
| Statistical analysis | Markov model | PPG | 16 AF patients and 11 healthy individuals [41] | SEN = 97 ± 2% SP = 99% ACC = 98% | - | |
| 24 h data from 20 AF patients [42] | SEN = 97% SEN = 93% SP = 100% ACC > 96% | - | ||||
| Logic regression | PPG | 1, 2, and 10 min of data from 666 AF patients [48] | AUC = 97.2% SEN = 94.0% ACC = 96.2% | - | ||
| Elastic net logistic model | PPG | 3.5 to 8.5 min data from 15 AF patients and 31 healthy individuals [71] | Acc = 95% Sen = 97% Sp = 94% AUC = 99% | - | ||
Publisher’s Note: MDPI stays neutral with regard to jurisdictional claims in published maps and institutional affiliations. |
© 2021 by the authors. Licensee MDPI, Basel, Switzerland. This article is an open access article distributed under the terms and conditions of the Creative Commons Attribution (CC BY) license (https://creativecommons.org/licenses/by/4.0/).
Share and Cite
Jiang, F.; Zhou, Y.; Ling, T.; Zhang, Y.; Zhu, Z. Recent Research for Unobtrusive Atrial Fibrillation Detection Methods Based on Cardiac Dynamics Signals: A Survey. Sensors 2021, 21, 3814. https://doi.org/10.3390/s21113814
Jiang F, Zhou Y, Ling T, Zhang Y, Zhu Z. Recent Research for Unobtrusive Atrial Fibrillation Detection Methods Based on Cardiac Dynamics Signals: A Survey. Sensors. 2021; 21(11):3814. https://doi.org/10.3390/s21113814
Chicago/Turabian StyleJiang, Fangfang, Yihan Zhou, Tianyi Ling, Yanbing Zhang, and Ziyu Zhu. 2021. "Recent Research for Unobtrusive Atrial Fibrillation Detection Methods Based on Cardiac Dynamics Signals: A Survey" Sensors 21, no. 11: 3814. https://doi.org/10.3390/s21113814
APA StyleJiang, F., Zhou, Y., Ling, T., Zhang, Y., & Zhu, Z. (2021). Recent Research for Unobtrusive Atrial Fibrillation Detection Methods Based on Cardiac Dynamics Signals: A Survey. Sensors, 21(11), 3814. https://doi.org/10.3390/s21113814