Article

A Novel Versatile Approach for Underwater Conformal Volumetric Array Design

School of Mechanical Engineering, Kyungpook National University, Daegu 41556, Korea
*
Author to whom correspondence should be addressed.
Sensors 2021, 21(11), 3591; https://doi.org/10.3390/s21113591
Submission received: 24 April 2021 / Revised: 14 May 2021 / Accepted: 18 May 2021 / Published: 21 May 2021
(This article belongs to the Section Physical Sensors)

Abstract

:
In this study, we present a novel approach to the design of a conformal volumetric array composed of M × N convex subarrays in two orthogonal curvilinear directions for underwater acoustic imaging for mine detection. Our design targets require that the proposed array transducer has three-dimensional half-power beamwidths of 85° and 25° in either of its convex subarray parts, while also reaching a peak transmitting voltage response above 147 dB. The radiated sound pressure of the subarrays was independently derived as a function of their geometrical parameters. The resulting directional factors were then combined to analyze the beam profile of the entire array. The design was finally optimized to minimize the ripple level. To validate this theoretical design, the structure was modeled and analyzed using the finite element method. The comparison between the resulting beam pattern from the finite element analysis and the analytical computation showed an excellent compliance. The method advanced is a simple and systematic analytical model to facilitate the development of new conformal volumetric arrays for underwater mine detection.

1. Introduction

For decades, conformal arrays have been used in non-destructive evaluation [1], medical imaging and diagnosis [2], and underwater sound navigation and ranging (SONAR) [3]. Among these, underwater SONAR has become prominent in the contemporary use of such arrays, providing surveillance for maritime safety and security against threats such as sea mines [4,5,6,7,8]. Many recent studies are dedicated to naval mine detection, mine-like object classification, and mine countermeasures [9,10,11,12,13,14,15,16].
Conformal arrays structurally conform to their host’s surface, appearing like an integral part of the whole structure with radiating elements arranged on a curved surface [17]. Compared to a planar array, they provide a wider beamwidth, smaller profile, and reduced drag from hydrodynamic forces [18,19]. These arrays are generally known for their complex geometry, making them difficult to design and analyze [20,21]. Hence, syntheses of these arrays’ geometry are less commonly done analytically using the fundamental acoustic equations, as is typical with the case of planar arrays [22,23].
In fact, few existing designs in the literature have a mathematical background which could have facilitated more understanding of the conformal arrays [24]. The literature does not provide sufficient techniques to guide the design of a conformal array. The common approaches including the popular Dolph-Chebyshev design and the genetic algorithm have been criticized for time delay and exclusion of radiation pattern of the elements in the analysis, respectively [25]. As with the other techniques to help the design of conformal arrays, the equivalent circuit method has recently been proposed [26], which usually involves complex algorithms. The finite element method and other advanced simulation software or computer application packages are utilized as well [27,28,29,30]. An alternative design technique known as transformation optics (TO) has also been applied in new studies [31]. As an integration of mapping and coordinate transformation techniques, the major goal of TO is to find a conformal array having an equivalent performance with a linear or planar array [32].
In many other studies, the practical construction of these arrays is carried out by simply bending them around the curvature of a host surface [33,34,35,36]. Meanwhile, the transducer made in such a manner has been identified with several problems such as shift in resonance frequency, change in performance, and mismatch between the diameter of the transducer and the bending radius [37]. Consequently, there is a need for a more versatile design, one that is intrinsically conformable to any given shape by simple modification of the structural variables or can provide any given beamwidth depending on the performance requirement. This is only possible through the development of a characteristic equation upon which the geometrical parameters of the models are fundamentally related.
Meanwhile, whereas there has been a quantum of research efforts [38,39,40,41,42] on cylindrical conformal arrays, the research on conformal volumetric arrays is comparatively less abundant. These few existing studies are focused on the sparse volumetric array and aim to narrow the main lobe width or the side lobe levels [43,44], while the long-range detection in acoustic imaging requires broader beamwidth [45]. Besides the wider beamwidth characteristics [46], the two curvilinear parts of the uniform volumetric array geometry would enhance a better penetration depth than the cylindrical array.
In this study, we present a novel approach to designing a 5 × 55 conformal volumetric array for mine detection considering the performance limitations in the designs. Typically, in principle, low-frequency signals favor long range while high frequency favors resolution. Meanwhile, 100 kHz is the maximum in the low ultrasonic frequency range. In our approach, this frequency was chosen to achieve a sufficient range detection at a maximum possible resolution in an underwater application [47,48]. At this frequency, the advantage of broader beamwidth offered by the doubly curved volumetric array was employed to provide a long-ranging detection [45]. The conformal array adopted also compensates for the problem of small radiation areas peculiar to some low-frequency, high-power transducers used in this application [3] while at the same time constricting the aperture width to moderate the overall size of this complex structure for economic consideration [49].
However, the design scheme in this work was developed as a universal model without any restrictions on the frequency it can be applied to. Hence, the scheme can be utilized to design a conformal volumetric array working at any arbitrary frequency depending on the interest of the designer. In this work, the design method is applied to the sample frequency of 100 kHz and geometry as a specific case.
The conformal volumetric array consists of two convex subarray parts that are composed of M × N rectangular elements. The sound pressure from each subarray was mathematically derived to obtain its respective directional factors. Using the product theorem, the directional factor of the whole structure was composed to characterize the beam pattern [50]. Consequently, M and N values required to achieve −3 dB beamwidths of 85° and 25° in the respective subarray part were determined through an optimization technique in addition to minimizing the ripple level to achieve a robust design. Finally, computational analysis was performed using the finite element method to validate the theoretical results as well as evaluate the transmitting voltage response (TVR) of the resulting conformal array.
The novelty of this work is in deriving a new equation to design conformal volumetric array, which enables the theoretical analysis of the array performance for the first time, to our knowledge. The uniqueness of the design equation is in the inclusion of curvature as an active determinant variable of the performance output. This is an uncommon approach to designing a conformal array due to the complex geometry of the array. This is a simpler and faster analytical approach compared to the use of complex algorithms and design software in previous works.

2. The Conformal Array Geometrical Parameters

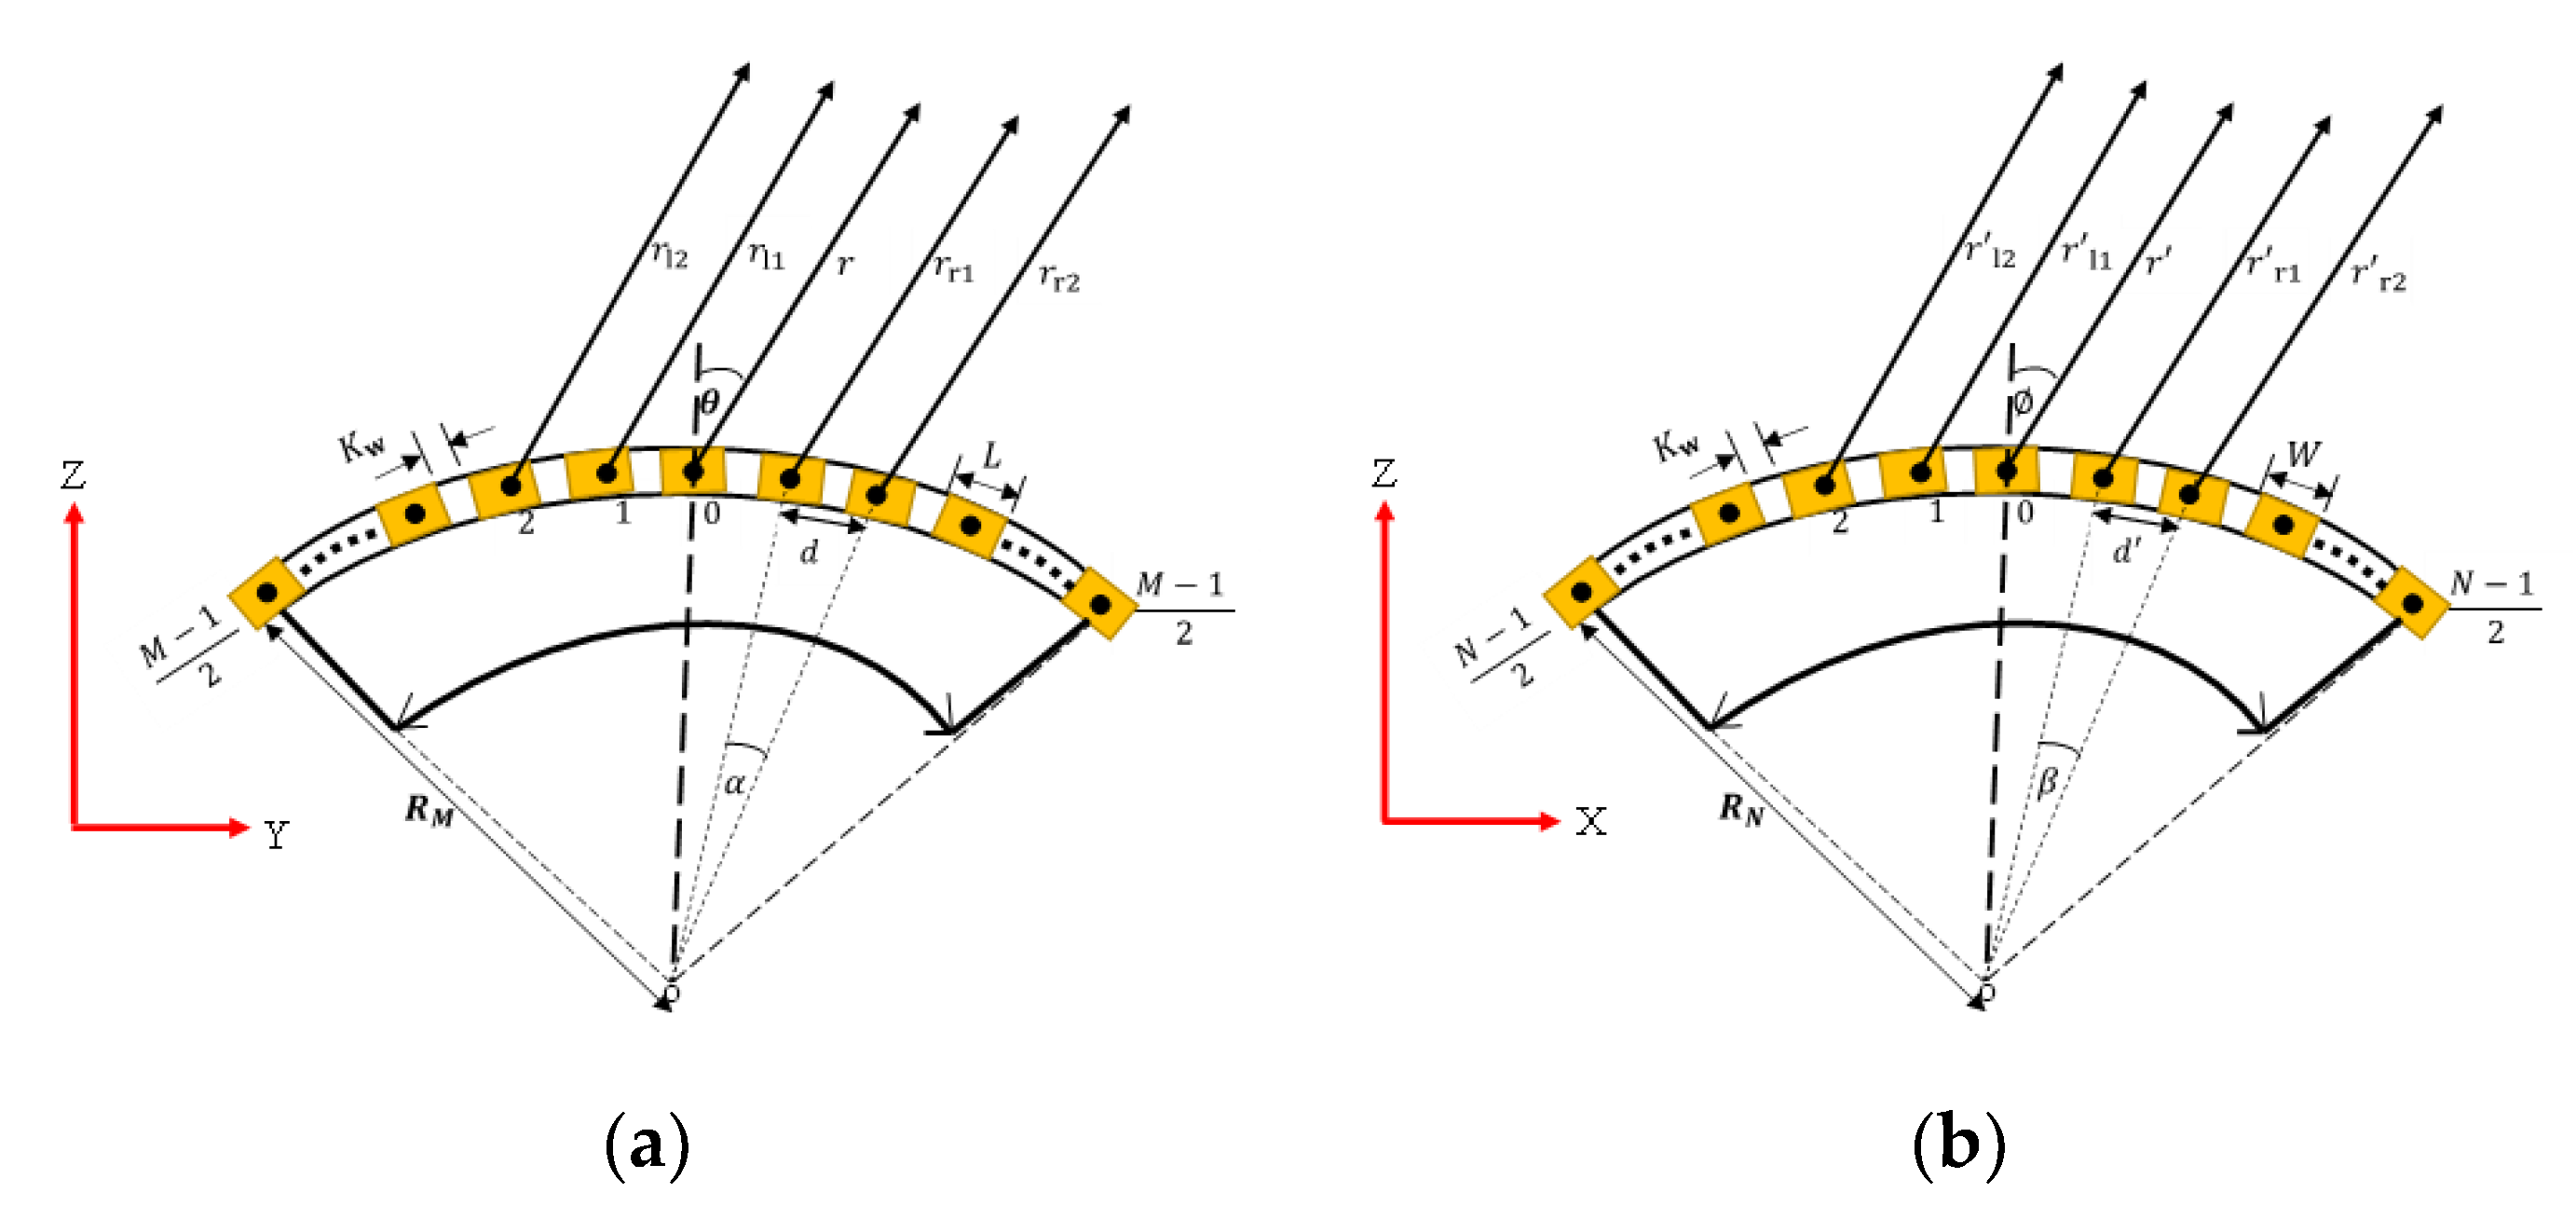
Figure 1 shows the discretized M × N array of point (or simple) sources of proposed conformal array geometry. These point sources are conventionally located at the center of the actual rectangular elements from where the pressure field is calculated, as shown in Figure 2. As clearly shown in Figure 2, the size of the elements in the M- and N-subarray parts of the structure are denoted by L and W, respectively. In Figure 2a, RM, d, and α are the radius of curvature, the pitch (inter-element spacing), and the angle of separation between two adjacent elements in the M-subarray part, respectively. Similarly, RN, d’, and β respectively denote the same quantities in the N-subarray part as shown in Figure 2b. Kw is the kerf (edge-to-edge spacing) on both sides of the array. The mathematical relationships between these geometrical parameters are presented in Equations (1)–(4). In these equations, DM and DN are the total widths of the array aperture in the M- and N-subarray parts, respectively.
d = K w + L = 2 R M sin ( α / 2 )
D M = ( M 1 ) d + L
d = K w + W = 2 R N   sin ( β / 2 )
D N = ( N 1 )   d + W

3. Determination of the Far-Field

The pressure from the array is calculated at the far-field, which is where the pressure amplitude varies inversely with the distance from the acoustic source [51]. As depicted in Figure 2, m = 1, 2, 3 … (M−1)/2, and n = 1, 2, 3 … (N−1)/2, respectively denote the positions of individual elements in the M- and N-subarray parts where both M and N are odd integers. Odd numbers of elements are relatively better than even numbers to mitigate the ripple [17]. The measurement angle as projected to the far-field point relative to the normal axis from each element in the M- and N-subarray parts is denoted as θ and ϕ, respectively. In the M-subarray, as shown in Figure 2a, r denotes the distance from the center element to the measurement point while the rrm and rlm terms denote these distances from the mth element on the right and left sections of the array, respectively. Equations (5)–(9) present the relationship between these quantities.
r r 1 = r + d   sin ( α / 2 θ )
r r 2 = r r 1 + d   sin ( 3 α / 2 θ )
r r m = r r ( m 1 ) + d   sin [ ( 2 m 1 )   α / 2 θ ]
r rm = r + 2 R M sin ( α 2 θ ) sin ( α / 2 ) + 2 R M sin [ ( 2 m 1 ) α 2 θ ] sin ( α / 2 ) = r + R M cos θ R M cos ( m α θ )
r lm = r + R M cos θ R M cos ( m α + θ )
Similarly for the N-subarray in Figure 2b, where r’ denotes the far-field distance from the center element, the rrn and rln representing the same far-field distance from the nth element on the right and left section of the array, respectively, can also be obtained as presented in Equations (10) and (11).
r r n = r + R N cos R N cos ( n β )
r l n = r + R N cos R N cos ( n β + )

4. Derivation of the Directivity Function

Fundamentally, Equation (12) presents the radiated sound pressure, p, from the simple source at any distance R [50]. In this equation, A is the pressure amplitude, ω is the angular frequency, k is the wave number, and t is the wave propagation time. Using this equation, the acoustic pressures, Pc from the central element as well as Pl and Pr from the left and right section of the M-subarray, respectively, are expressed in Equations (13)–(15).
p = A R e i ( ω t k R )
P c = A r e i ( ω t k r )
P l = m = 1 M 1 2 A r l m e i ( ω t k r l m )
P r = m = 1 M 1 2 A r r m e i ( ω t k r r m )
At far-field, 1/rrm = 1/rlm ≈ 1/r. Hence, the sum of these pressures results in the total radiated pressure, PM, in Equation (16) and, subsequently, the corresponding directivity function, HM (θ), of the M-subarray in Equation (17).
P M = A r e i ( ω t k r ) [ 1 + m = 1 M 1 2 { e i k R M ( cos θ cos ( m α + θ ) ) + e i k R M ( cos θ cos ( m α θ ) ) } ]
H M ( θ ) = [ 1 + m = 1 M 1 2 { e i k R M ( cos θ cos ( m α + θ ) ) + e i k R M ( cos θ cos ( m α θ ) ) } ]
By a similar approach, the total radiated sound pressure, PN, and the corresponding directivity function, HN (ϕ), for the N-subarray part can be expressed as Equations (18) and (19), respectively.
P N = A   r e i ( ω t k   r ) [ 1 + n = 1 N 1 2 { e i k R N ( cos cos ( n β + ) ) + e i k R N ( cos cos ( n β ) ) } ]
H N ( ) = [ 1 + n = 1 N 1 2 { e i k R N ( cos cos ( n β + ) ) + e i k R N ( cos cos ( n β ) ) } ]
Having assumed the active element as a simple source, the calculation of the actual directional factor of the proposed conformal array requires the determination of the directional factor, Hr(θ, ϕ), of the actual rectangular element used in the array. To this end, Figure 3 shows the geometry for the derivation of Hr(θ, ϕ), for a rectangular element of L × W dimension.
In Figure 3, the distance from the center of the element to the measurement point A is re while θ and ϕ are zero in the orthogonal YZ and XZ planes, respectively. Subsequently, the distance Re from any other point on an idealized small element xy can be expressed as in Equation (20). Based on this equation, the acoustic pressure of the rectangular element, Pe, is derived as expressed in Equation (21) and finally resulting into Hr(θ, ϕ) in Equation (22).
R e = r e x sin y sin θ
P e = W 2 W 2 L 2 L 2 A R e e i ( ω t k R e ) d x d y = A r e e i ( ω t k r e ) L W sin ( k L 2 sin θ ) k L 2 sin θ · sin ( k W 2 sin ) k W 2 sin
H r ( θ , ) = sin ( k L 2 sin θ ) k L 2 sin θ · sin ( k W 2 sin ) k W 2 sin
By normalizing the constituent subarray directional factors, HM(θ) and HN(ϕ), with their respective maximum values, and combining them with Hr(θ, ϕ) using the product theorem [52], the overall directional factor of the whole conformal array, H(θ, ϕ), is obtained in Equation (23). Consequently, the beam pattern of the whole conformal array, b(θ, ϕ), is finally expressed in Equation (24).
H ( θ , ) = | H M H M max | · | H N H N max | · H r ( θ , )
b ( θ , ) = 20 log | H ( θ , ) |

5. The Working Frequency and the Maximum Array Aperture Size

Implementation of Equation (24) requires determining the operating frequency f and size of the array with respect to the relationship in Equation (25). In this equation, c = 1500 m/s is the acoustic wave speed in water while λ is the wavelength.
k = 2πf/c = 2π/λ
The long-range detection is favored by the low-frequency range (1–100 kHz). Meanwhile, high ultrasonic frequency for acoustic imaging has also been placed between 100 kHz and 2 MHz [47]. Since resolution and frequency are directly related, 100 kHz is therefore selected as the working frequency of the proposed array. Being an interface between the low- and high-frequency signals, this frequency provides the highest possible resolution for low-frequency signals and an excellent long-penetration range of up to 1 km, and allows for centimeter size range of a small conformal array structure.
Based on this frequency and the space limitation on the hosting surface of the mine hunter for the proposed array, the aperture width is restricted to a maximum of 33 cm, which also falls within the size range recommended for underwater acoustic imaging [47]. In addition, the pitch is maintained at less than a half wavelength while the kerf is also fixed at 0.5 mm to achieve the wider element size needed for the target high-power output. Its reduction below this value may facilitate mutual acoustic coupling between the elements or degrade the power output if higher. Application of these conditions to Equations (1)–(2) yields design constraints in Equations (26) and (27) where a = L or W and b = M or N, respectively, for the M- and N-subarray parts.
a < 7.0
b ≤ 330.5/(a + 0.5);

6. Design of the Conformal Volumetric Array

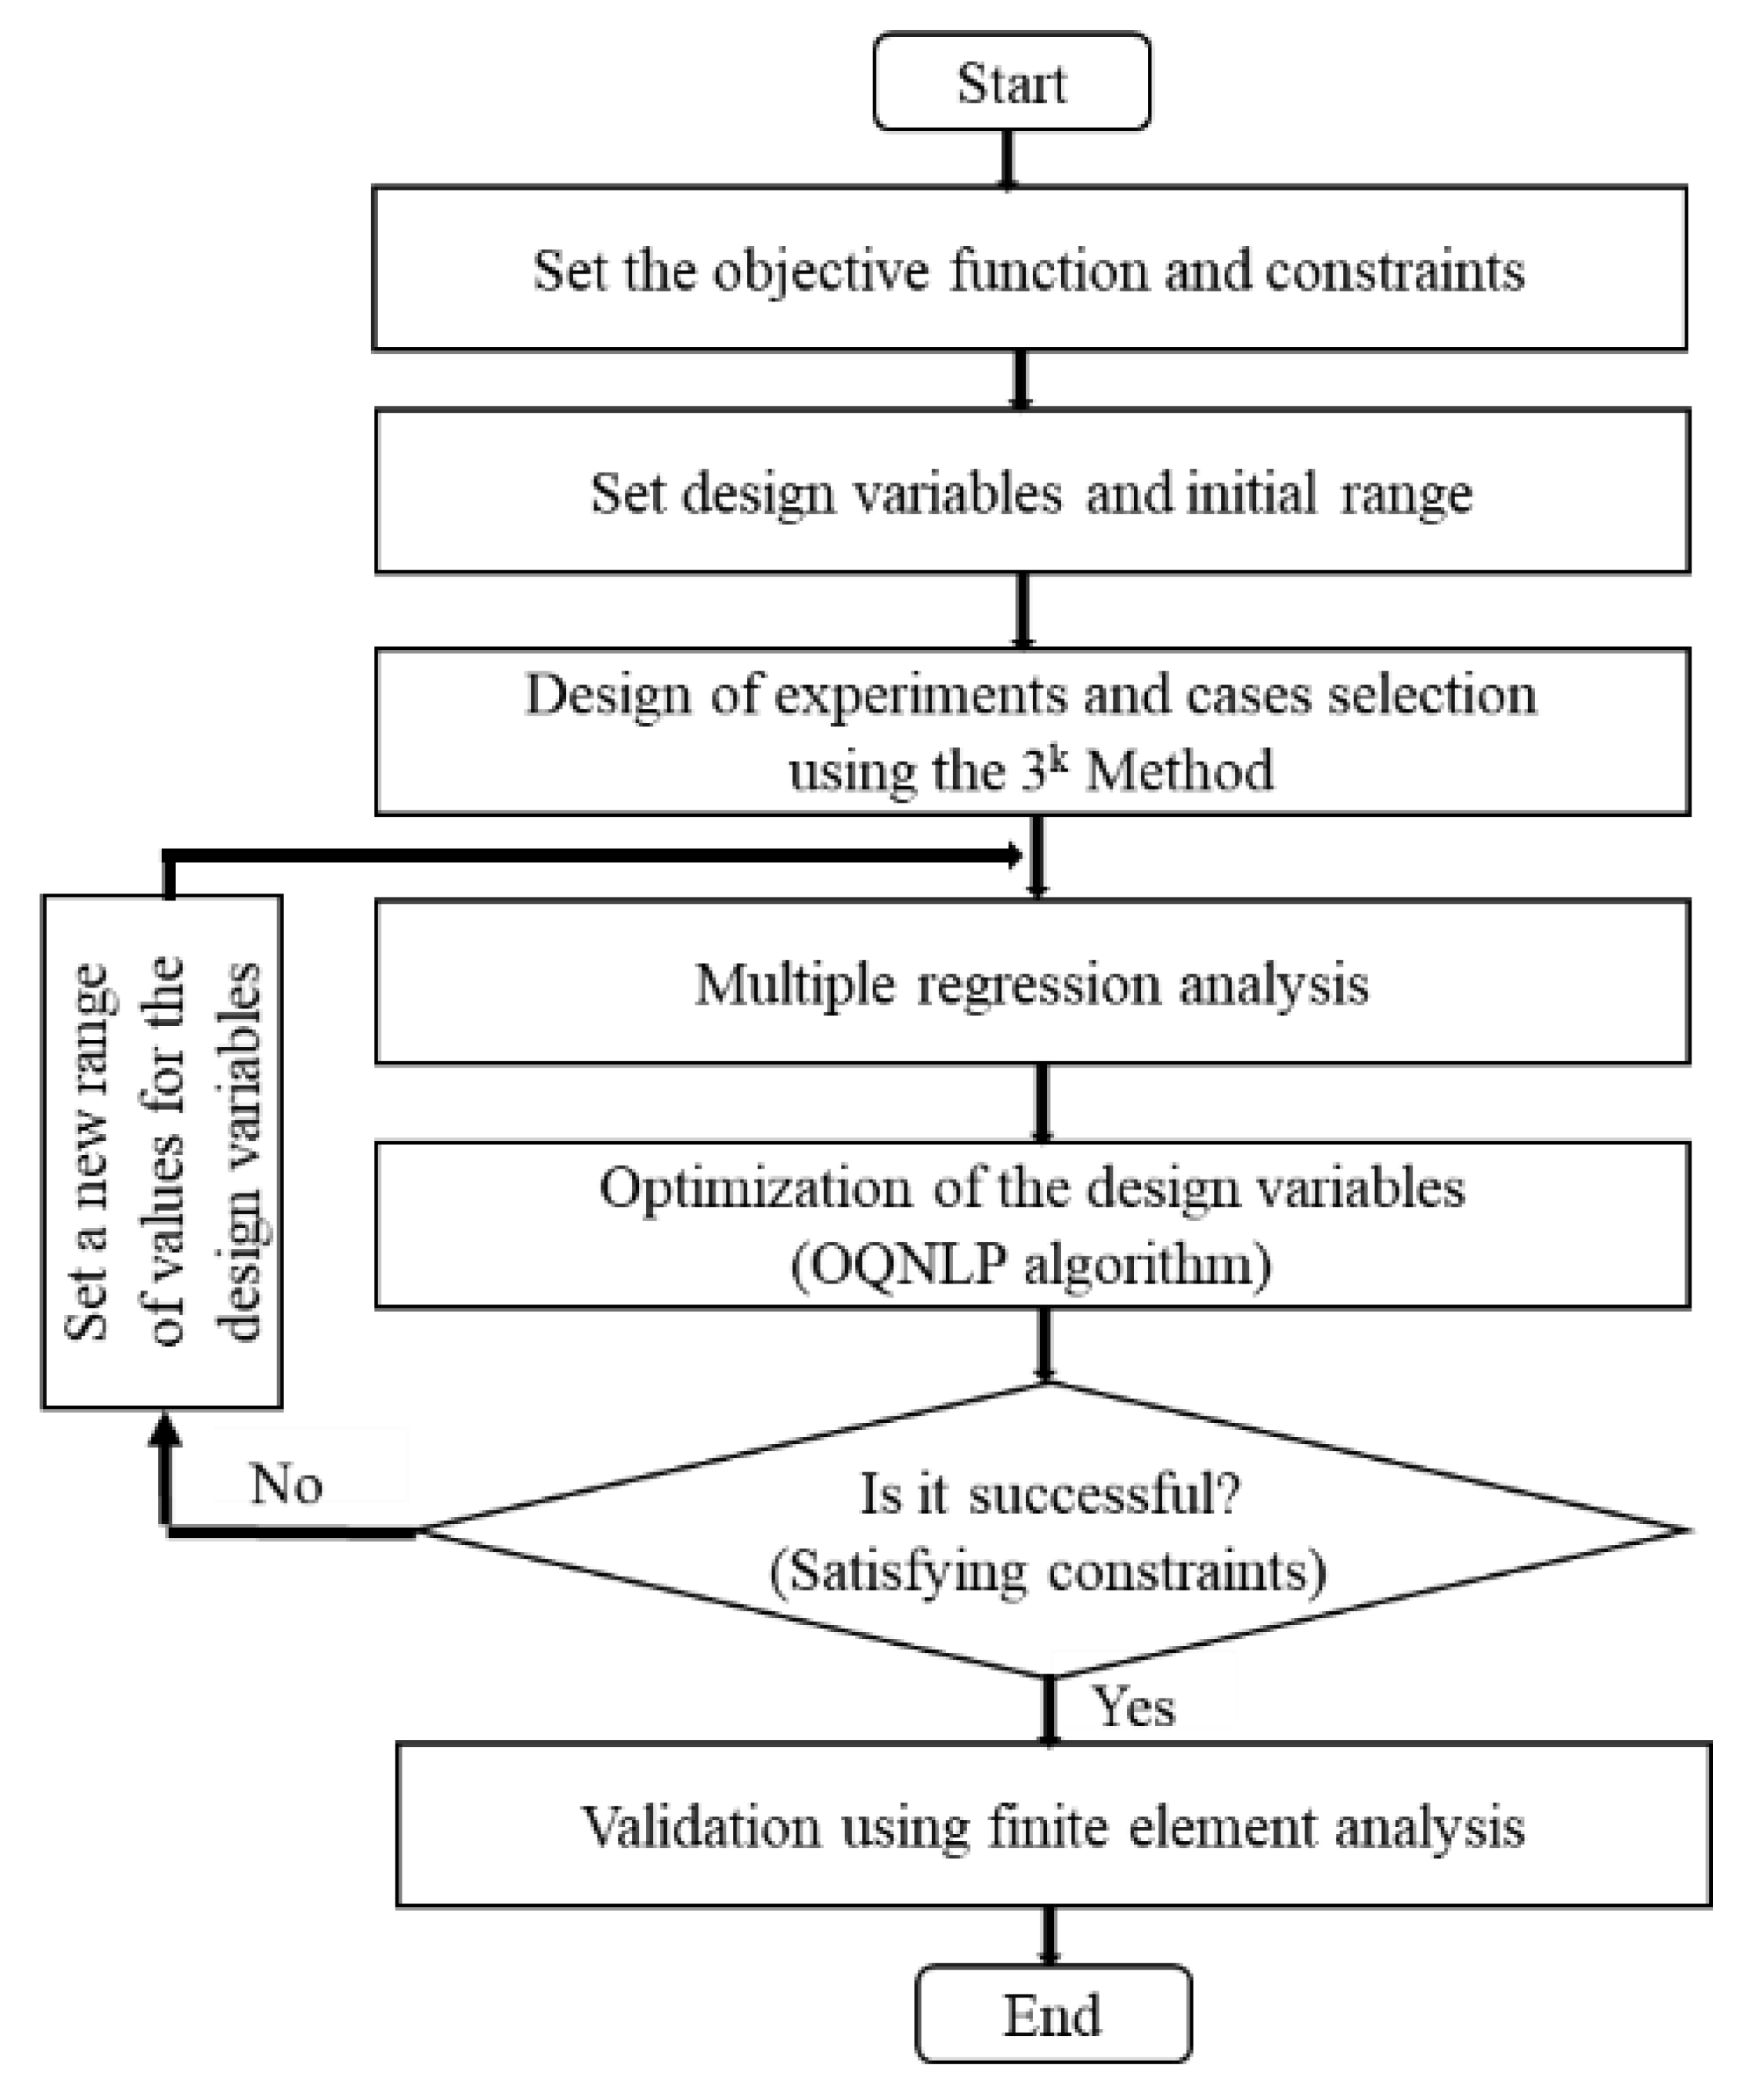
In this section, the final design of the structure was accomplished by optimization technique using the OptQuest Nonlinear Programming (OQNLP) algorithm [53,54]. The algorithm for the entire optimization procedure was implemented using a MATLAB program (version R2019a 9.6) and it is presented in the flowchart in Figure 4.
The effect of the geometrical variables on the performance characteristics was evaluated in Equation (24) using different values of M, L, and RM for the M-array (at ϕ = 0) and N, W, and RN in the case of the N-subarray part (at θ = 0). A MATLAB program for calculating the −3 dB beamwidth as well as the magnitude of the ripple formed within the main lobe was developed. Optimization technique by OQNLP algorithm requires a regression analysis and constraint equations. Regression analysis involves finding the best fitting function between the input and output variables using the least square method [55]. With a given value for the radius of curvature, both the size and number of elements were determined by the developed geometrical relations according to the conditions in Equations (26) and (27).
For the M-subarray, RM and L were varied at ± 0.1R0 and L0 ± 0.2 mm of their respective initial basic values, R0 and L0. They were then formulated into a 2 × J matrix of experimental models using the 3k factorial design method [56]. The number of elements, M, was not included in the regression as a design variable. Each M-value was treated as a discrete constant value in each iterative process to preserve its value as an integer. With each M-value, RM and L values in each J-column were then used to evaluate both the ripple and −3 dB beamwidth in the main lobe.
Since the performance outputs indicate nonlinear relationships with the design variables, the quadratic polynomial functions in Equations (28) and (29) were derived for both output parameters Y1 and Y2 in terms of the design variables X1 and X2. The coefficients B0B8 and C0C8 were to be determined by the regression analysis. In this equation, Y1 = Ripple, Y2 = Beamwidth, X1 = RM/R0, and X2 = L/L0. The independent input variables, RM and L, are divided by their basic values, respectively, because of the large difference between their physical values.
Y 1 = B 0 + B 1 X 1 + B 2 X 2 + B 3 X 1 X 2 + B 4 X 1 2 X 2 + B 5 X 2 2 X 1 + B 6 X 1 2 + B 7 X 2 2 + B 8 X 1 2 X 2 2
Y 2   = C 0 + C 1 X 1 + C 2 X 2 + C 3 X 1 X 2 + C 4 X 1 2 X 2 + C 5 X 2 2 X 1 + C 6 X 1 2 + C 7 X 2 2 + C 8 X 1 2 X 2 2
The coefficients in Equations (28) and (29) were evaluated resulting in a perfect fitting function in Equations (30) and (31) having a regression coefficient of unity.
Y 1 = 19.7290 70.5376 X 1 2 18.4869 X 2 2 + 71.8826 X 1 2 X 2
Y 2   = ( 1.3573 + 1.2303 X 1 2 + 1.485 X 2 2 1.2828 X 1 2 X 2 ) × 10 3
where X 1   = RM/202.8, X 2 = L/5.2.
Based on this regression analysis result, optimization was conducted by the OQNLP algorithm to achieve the objective in Equation (32). The design target was to minimize the ripple and achieve a −3 dB beamwidth of 85° in the M-subarray part. Hence, the objective function and the constraint for the optimization were set as Equation (32) where yl and yu are 85° and 90°, respectively. This process was iterated for different trial values of the design variables until this equation was satisfied according to Figure 4. This was eventually achieved at a point when M = 55 where the penultimate range of design variables was as shown in Table 1.
{ Objective   :   Minimize   Y 1   Constraint :   y l Y 2 y u
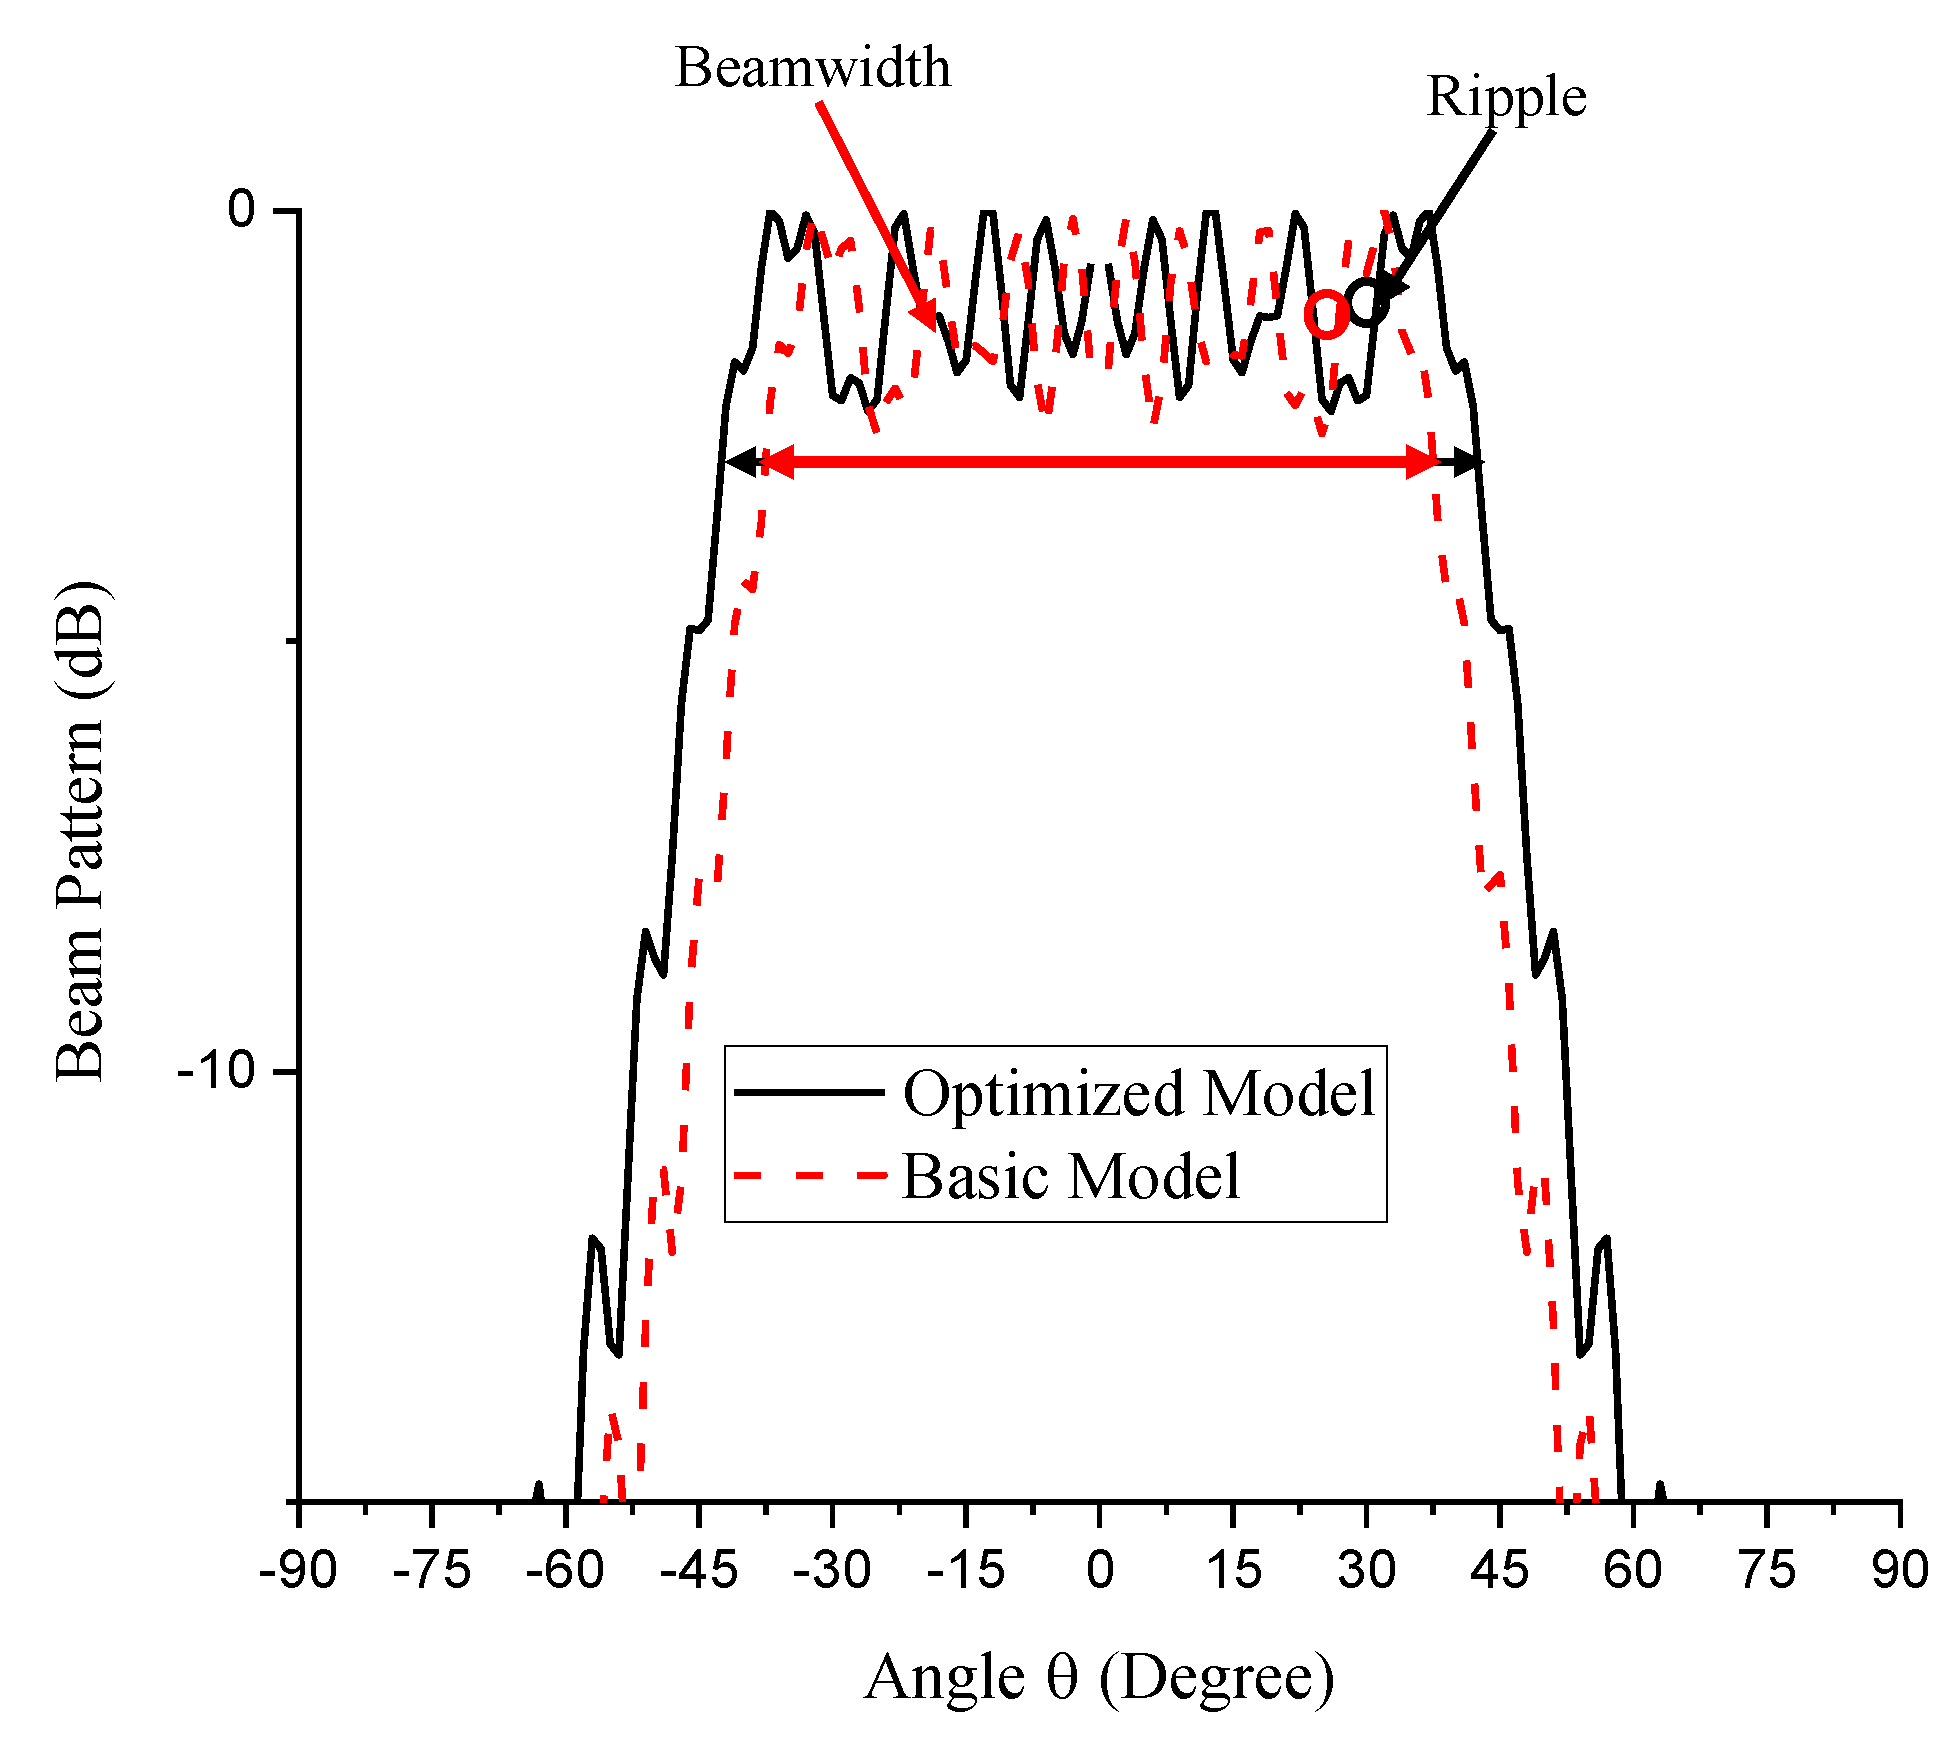
The final result was obtained as shown in Table 2. The result in Table 2 clearly shows that the ripple has been minimized by 0.3 dB while the beamwidth has been widened by 10° to the desired 85.1°. Figure 5 shows the comparison between the beam patterns of the initial and optimized models. By this result, the conformal array has the final aperture size of 31.3 cm and the pitch of 5.7 mm (0.38λ). This result agrees with the finding that a minimal ripple is obtained at reduced pitch d = 0.4λ [49]. The maximum aperture width also falls in the smaller size region of the recommended range of 10 cm–1 m indicating good economic consideration [47].
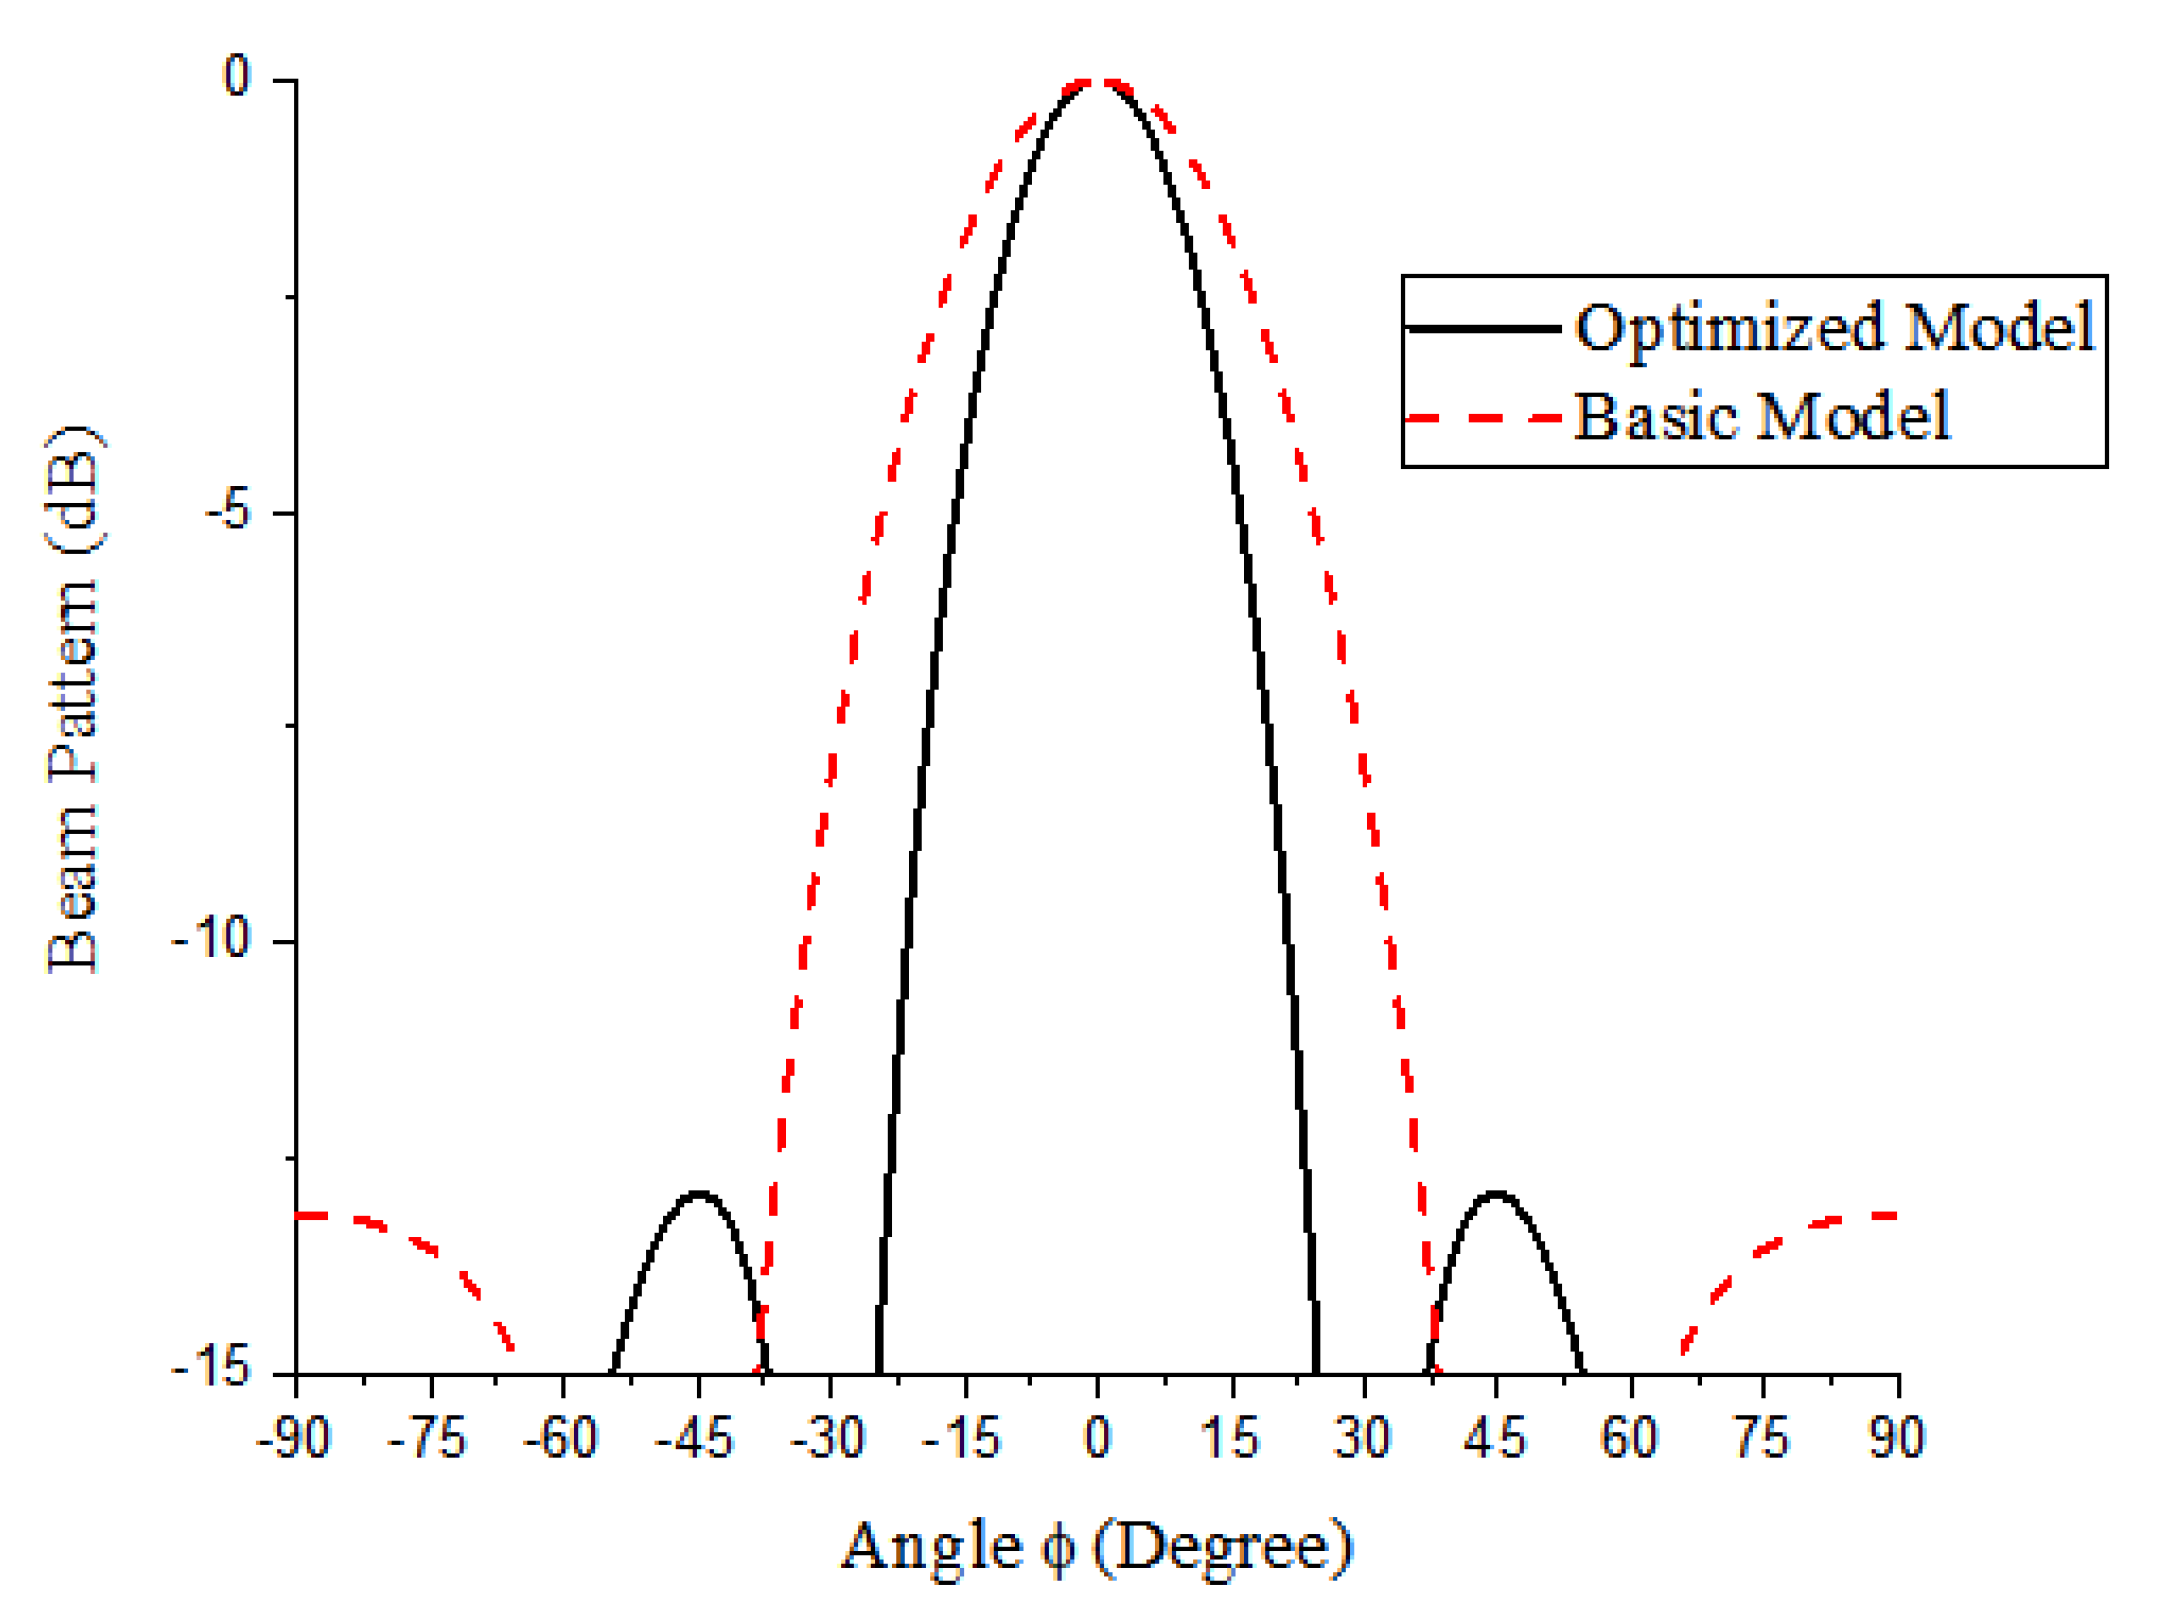
Having completed the design of the M-subarray, the similar procedure was carried out for the N-subarray using N, RN, and W. Now, X1 and X2 in Equations (28) and (29) are RN/R0 and W/W0, respectively. Due to the −3 dB beamwidth target of 25°, yl and yu in Equation (32) for the N-subarray part are 25° and 26°, respectively. The penultimate range of the design variables for this part is presented in Table 3. The regression analysis yielded a perfect fitting function having a regression coefficient of unity presented in Equations (33) and (34). In Equation (33), Y1 = 0 because there is no ripple in the N-subarray part due to the small number of elements, N = 5 producing the target beamwidth as shown in the final optimization result in Table 4. Consequently, the pitch and aperture width on this part are 6.1 mm (0.4λ) and 3 cm, respectively. Figure 6 shows the comparison between the beam patterns of the initial and optimized models.
Y 1 = 0
Y 2   = 132.5495 0.2075 X 1 140.5653 X 2 + 0.2246 X 1 X 2 0.0940 X 1 2 X 2 0.3597 X 2 2 X 1 + 0.0809 X 1 2 + 46.2380 X 2 2 + 0.1396 X 1 2 X 2 2
where X 1   = RN/120, X 2   = W/3.6.

7. Validation of the Design

Finite element analysis (FEA) has been described as the best way to obtain quantitative data for an acoustic array design [52]. Its reliability to evaluate the integrity of theoretical designs in academic and commercial applications has been emphasized [57,58]. Consequently, a commercial FEA software, Pzflex® (version 1.21.7.0), is employed to validate the design as well as evaluate the TVR level of the conformal array with respect to the target minimum of 147 dB. PZT-5H was selected as the active piezoceramic element, as adopted from [52], while other structural components are presented in Table 5. This FEA model was constructed in consideration of the operational factors in the practical underwater environment.
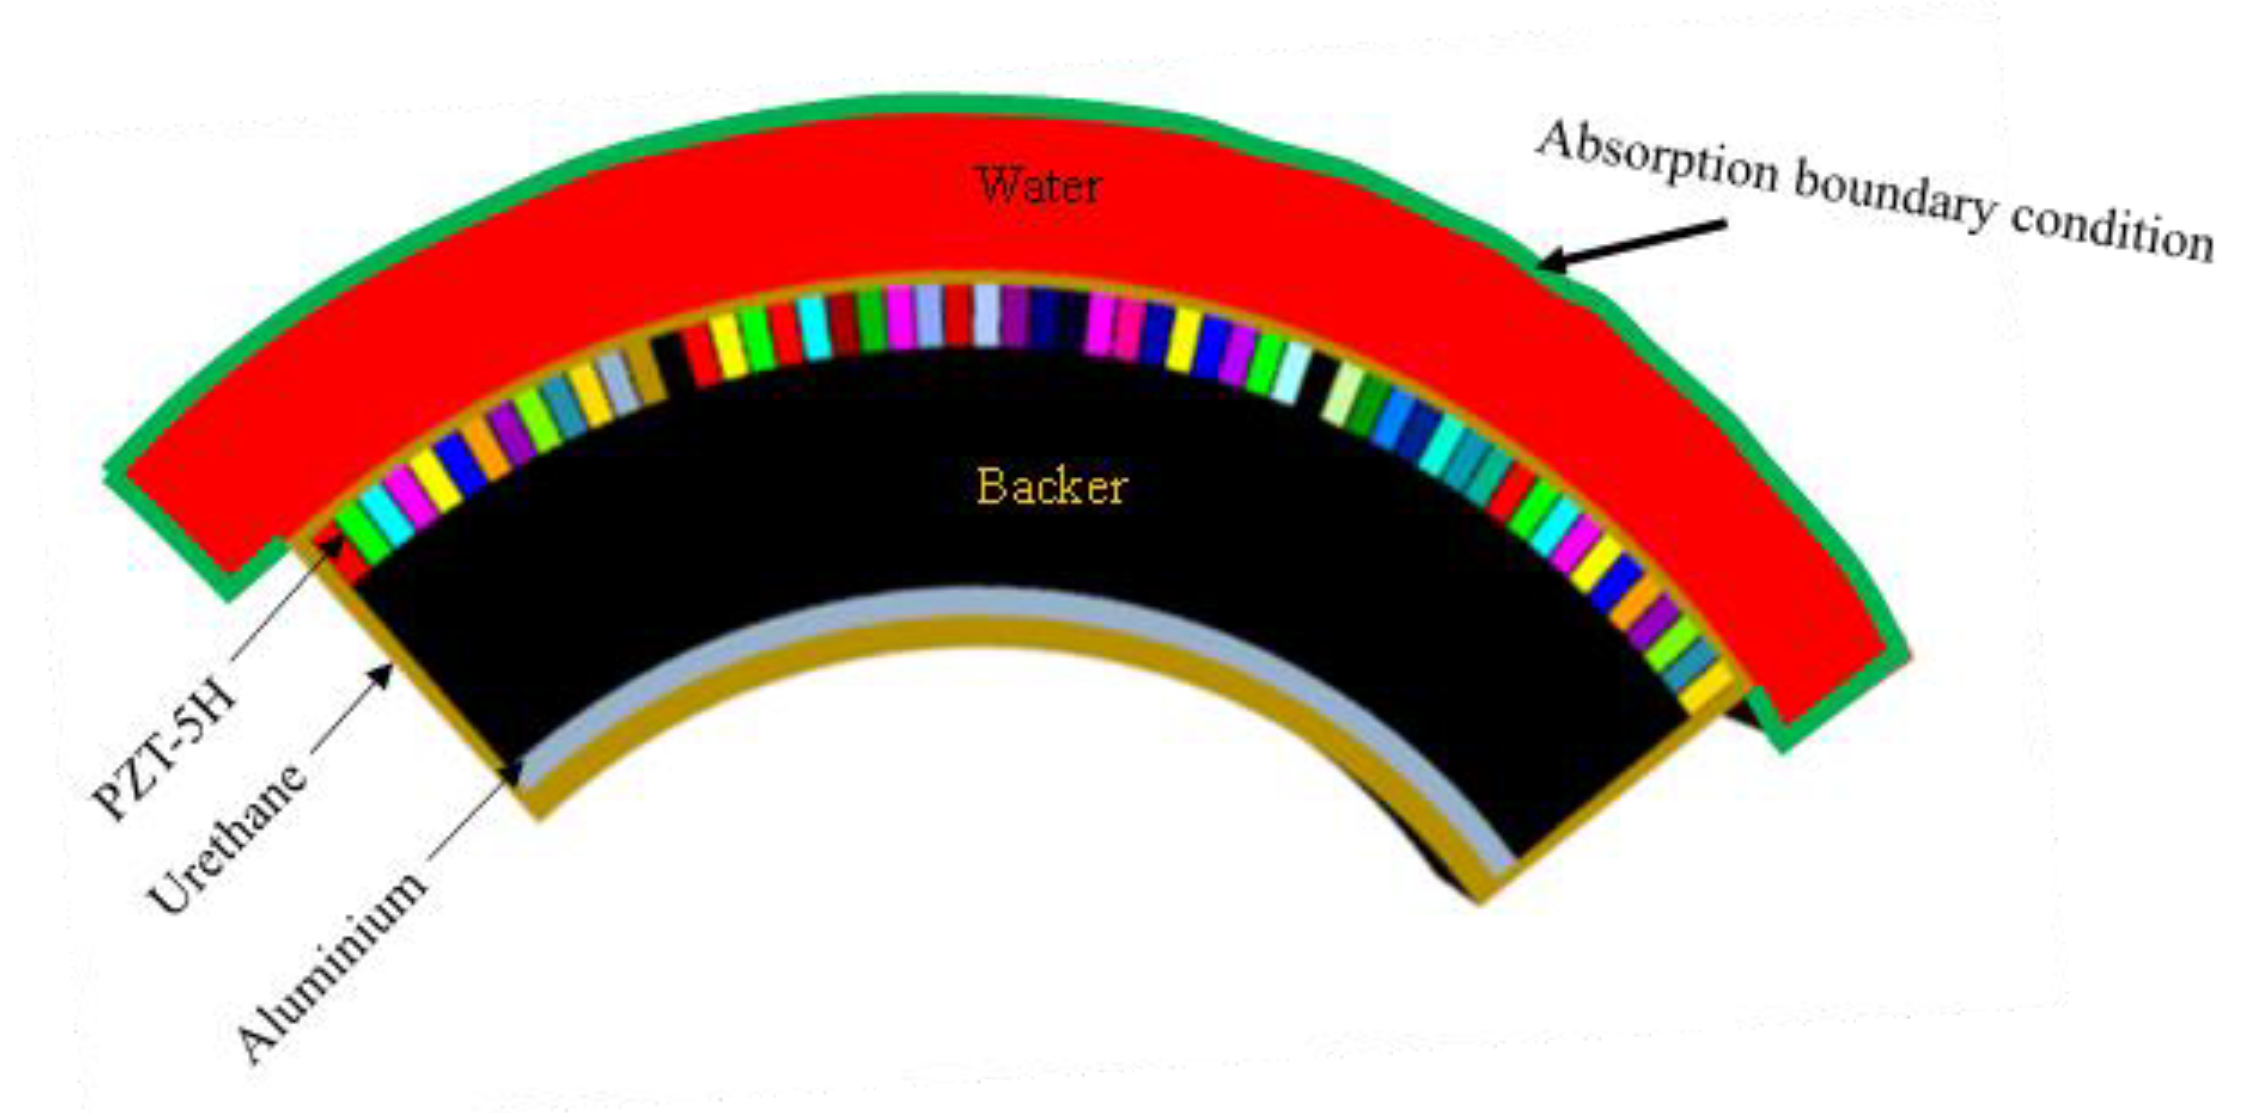
The cross-section of the FEA model of the whole array structure is shown in Figure 7. Each of the piezoceramic elements was excited with an impulse signal of 1 volt as a source of electrical energy. The ceramic element was placed between the layers of urethane and the backer. To provide an additional layer of support to the structure, aluminum was placed behind the backer. A urethane covering was applied to the entire geometrical matrix to serve both as an acoustic window for impedance matching as well as waterproofing. To simulate the transducer’s real-world working environment, water was modeled on the front surface of the array as the acoustic radiation medium. An absorption boundary condition was applied around the water domain to prevent reflection of acoustic waves. The curvature and the dimension of the radiating surface were exactly as previously obtained in the theoretical design for the rectangular element. Since the transducer vibrates in the thickness mode, the thickness of the transducer was controlled by the operating frequency.
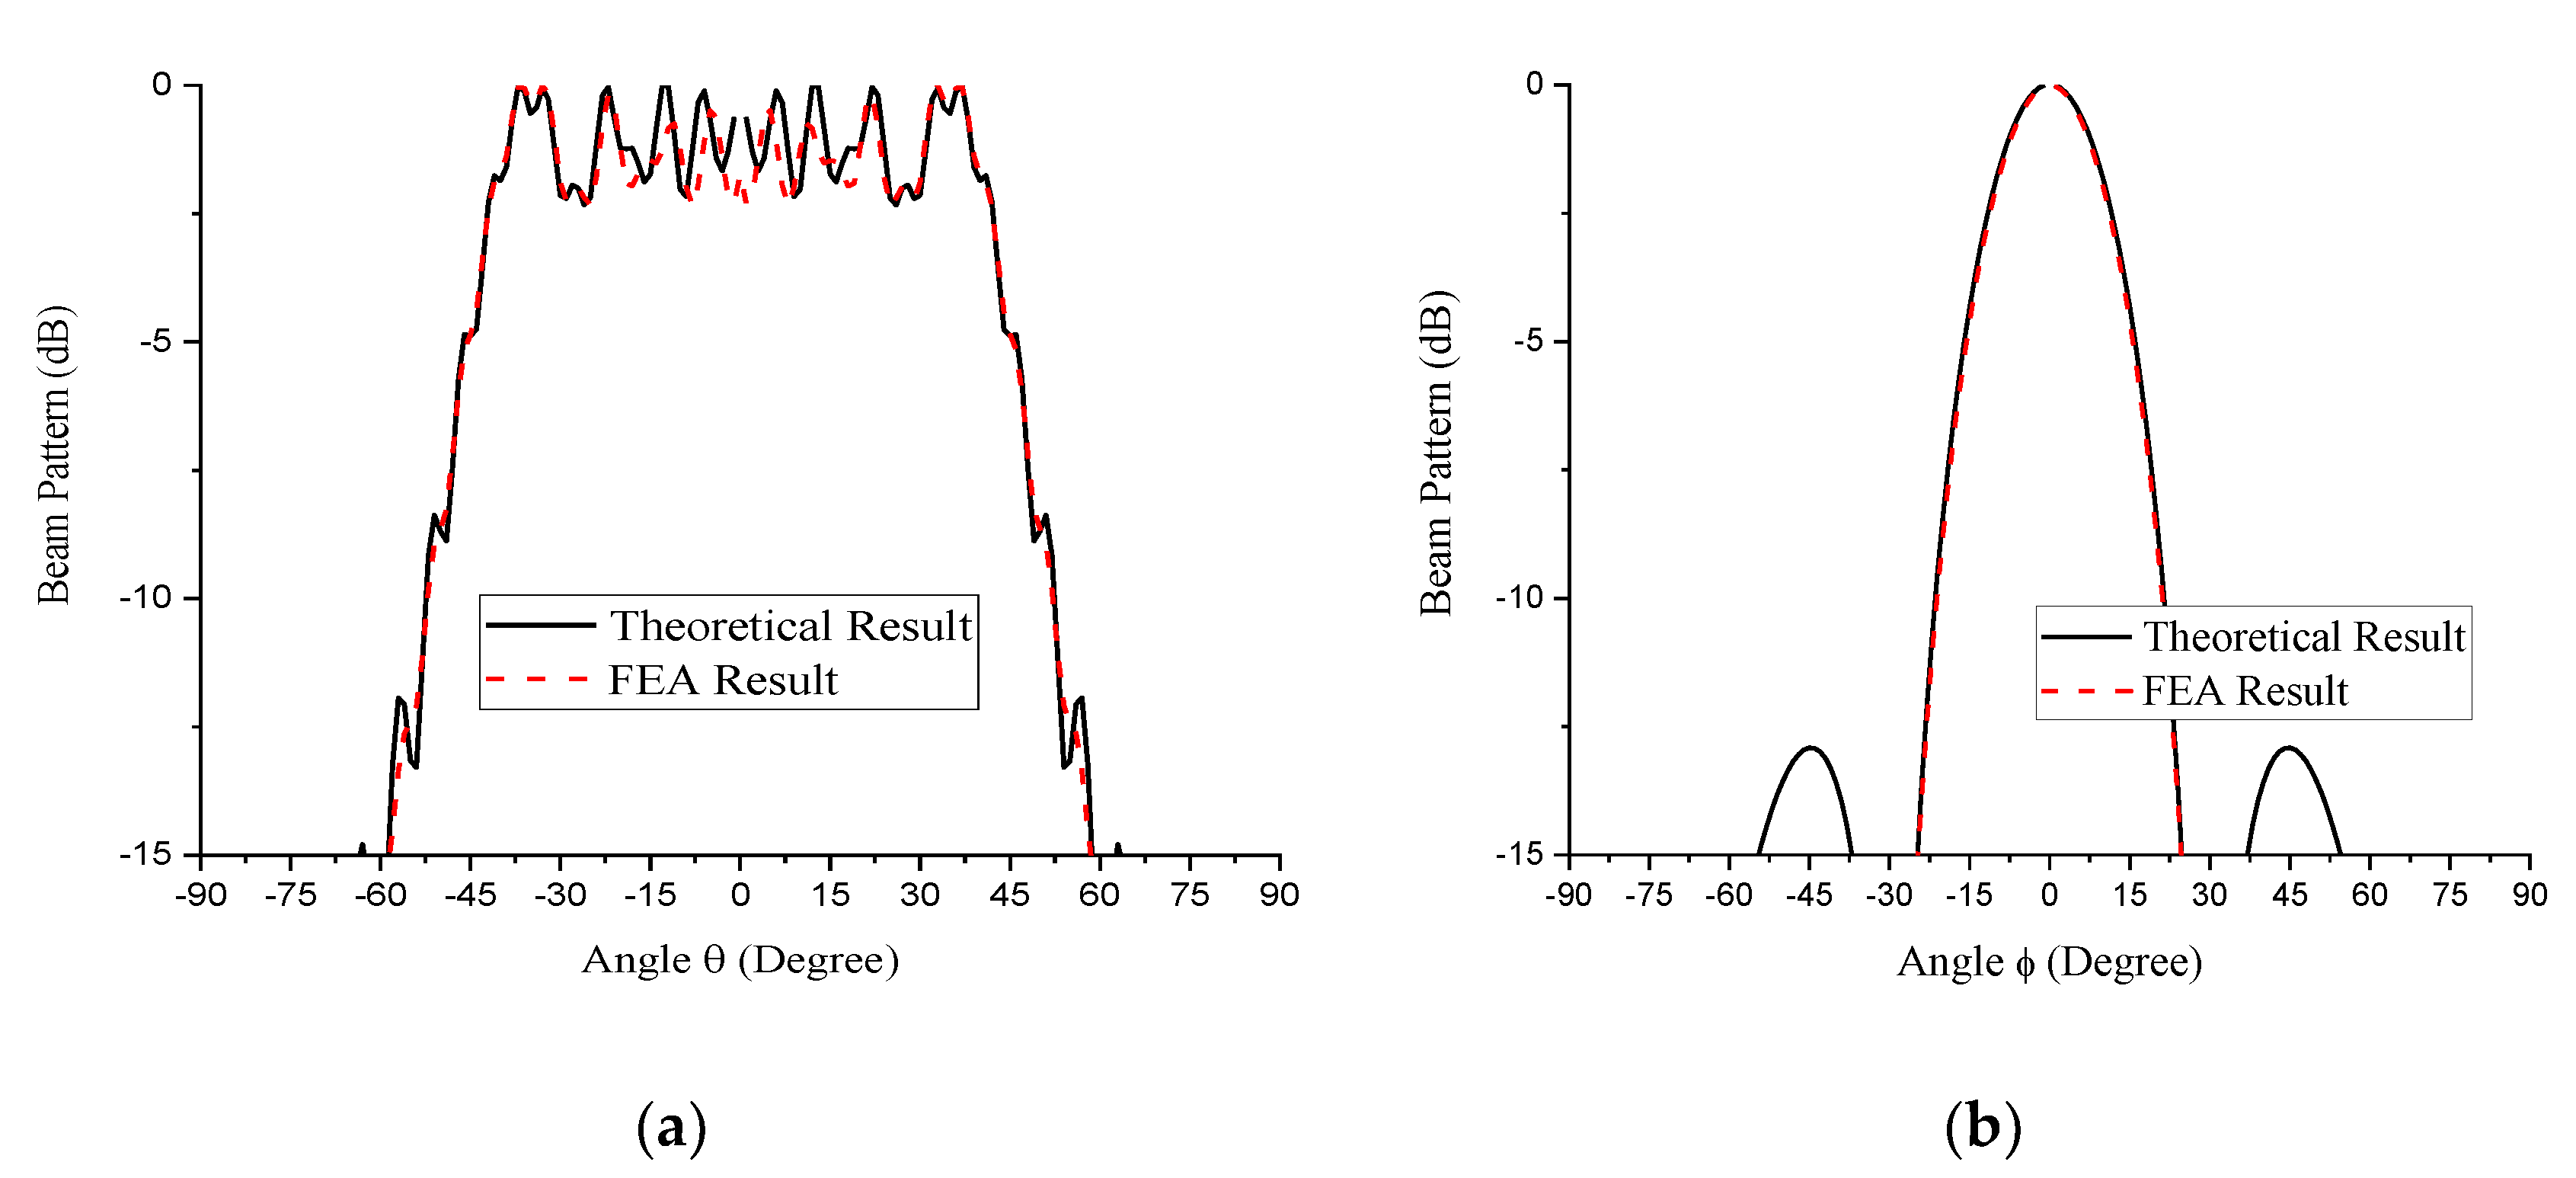
The outcome of the FEA was compared with the optimized analytical results for the M- and N-subarrays presented in Figure 5 and Figure 6, respectively, as shown in Figure 8. The excellent agreements especially at the main lobe of the beam patterns provides sound proof to the validity of our novel theoretical design approach. Additionally, the three-dimensional plot of the beam is shown in Figure 9 while the quantitative difference between the two spectra is presented in Table 6.
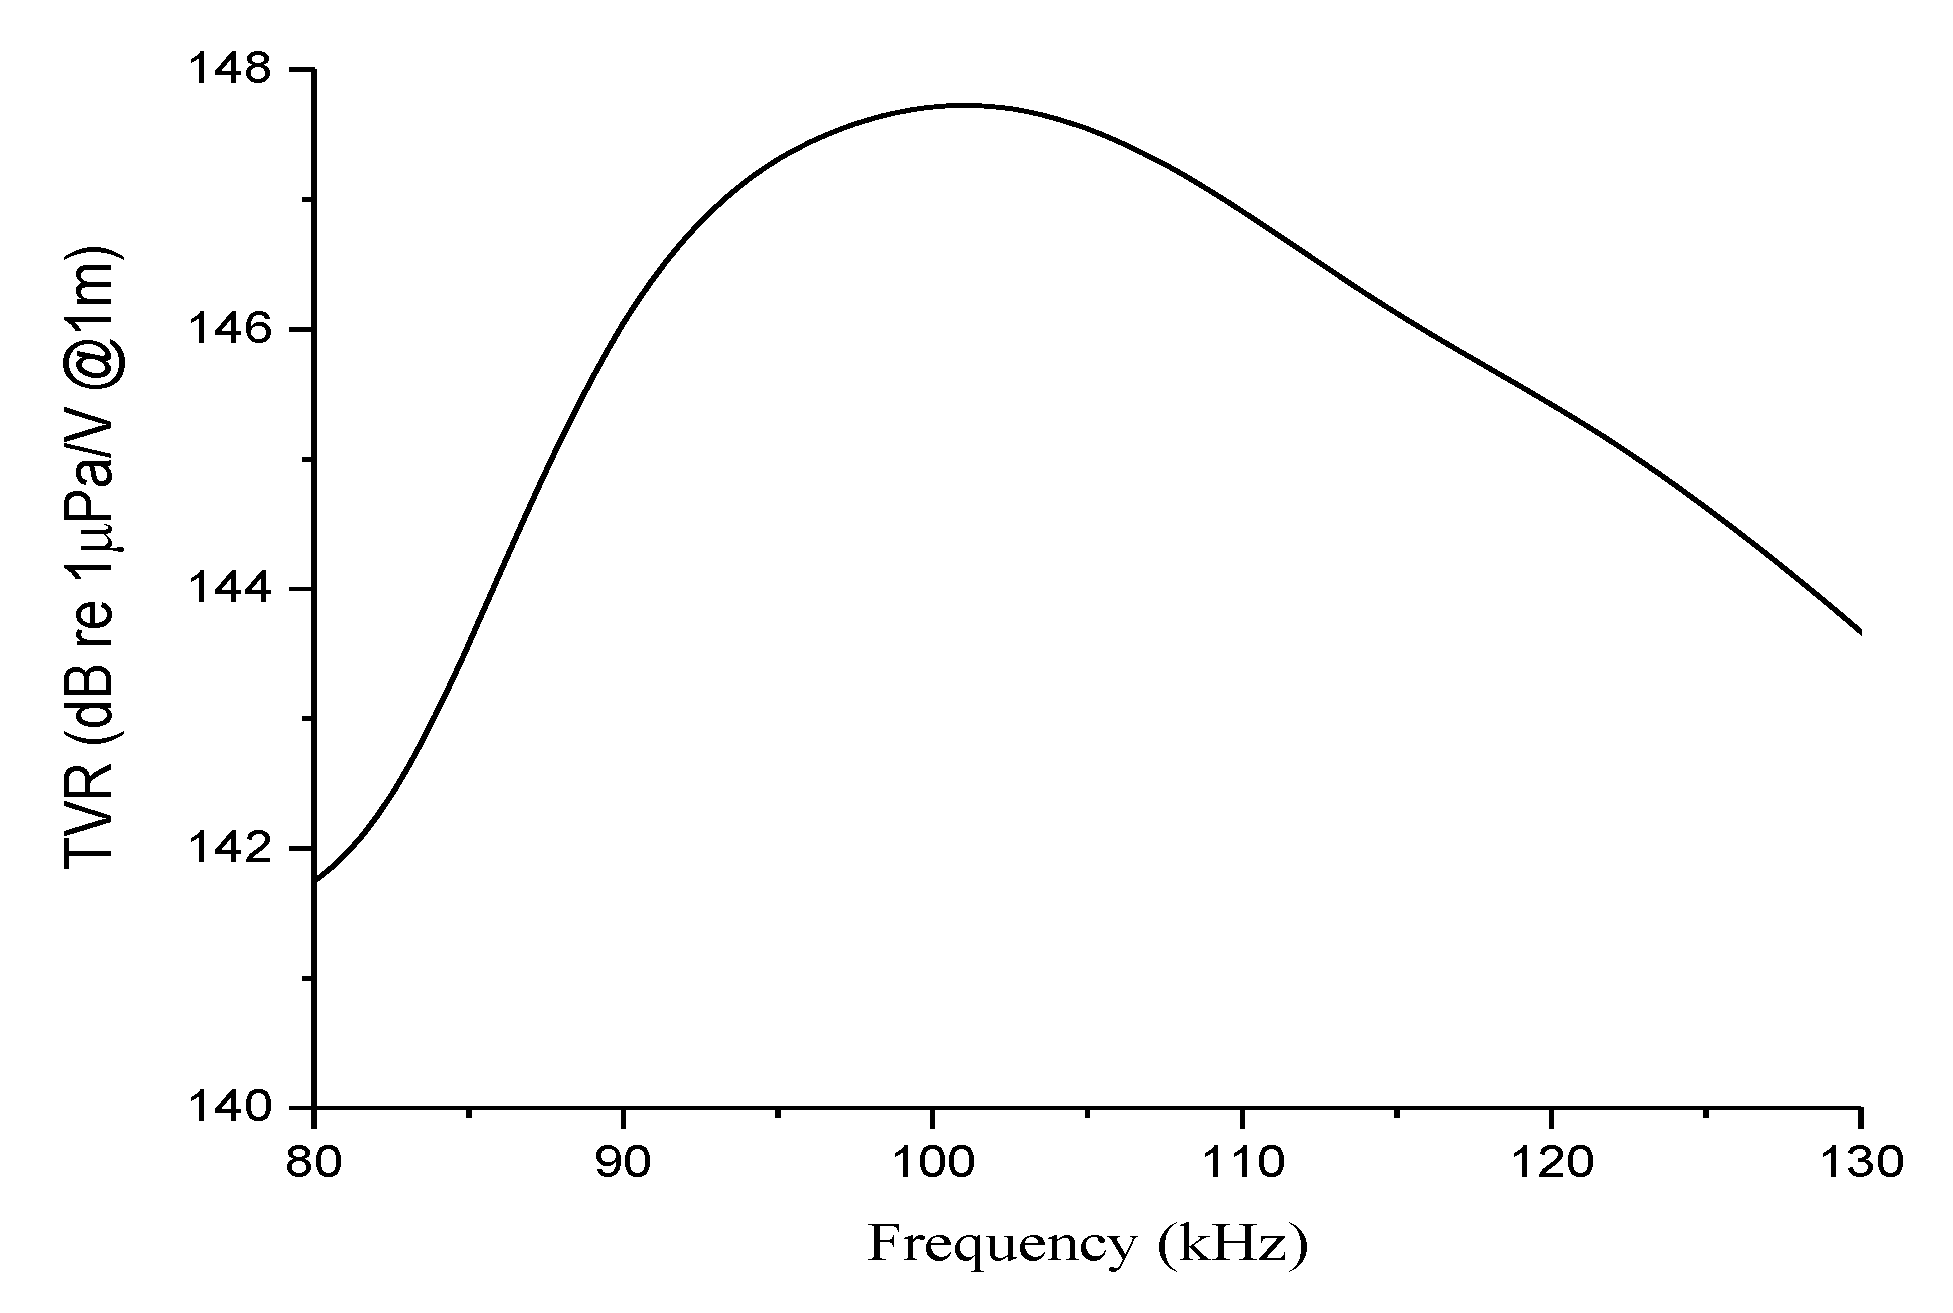
Finally, Figure 10 shows the resulting TVR spectrum with a peak level of 147.7 dB, further satisfying the design target of the proposed conformal volumetric array.

8. Conclusions

This study presents a novel, simple, and systematic design technique for a 5 × 55 conformal volumetric array for sonar detection to solve the maritime security challenge posed by underwater mines. The design was conducted using the maximum low-frequency of 100 kHz, beamwidth of 85° at a controlled aperture size, and a transmitting voltage response of 147.7 dB to break even from the major performance issues in underwater acoustic imaging for sonar detection. The combination of odd-number elements and optimization technique were used to determine the least possible ripple magnitude. It is spectacular that the minimum ripple was obtained at the effective pitch of 0.38λ in exact agreement with the existing theory. The maximum array size of 31.3 cm also falls within the small category of the acceptable range indicating the economic value of the design. Nevertheless, the integrity of our approach was again validated using the finite element analysis and an excellent compliance was attained. This method is not only computationally accurate but also uniquely simpler, faster, and more natural. It has been used to design a structure with a specific curvature and frequency in the present work as a sample case. However, the design equation was developed as a universal model for any arbitrary frequency depending on the interest of the designer. It is a versatile template that is adaptable to other curvatures for different performance specifications. Consequently, it is suitable as a good reference for future development of conformal volumetric arrays for underwater mine detection.

Author Contributions

Conceptualization, S.P. and Y.R.; methodology, T.A.Y., S.P. and Y.R.; validation, Y.R.; investigation, T.A.Y., S.P. and Y.R.; data curation, T.A.Y. and S.P.; writing—original draft preparation, T.A.Y.; writing—review and editing, Y.R.; visualization, T.A.Y.; supervision, Y.R.; project administration, Y.R.; funding acquisition, Y.R. All authors have read and agreed to the published version of the manuscript.

Funding

This work was supported by the Agency for Defense Development in Korea under Contract No. 202033600000.

Institutional Review Board Statement

Not applicable.

Informed Consent Statement

Not applicable.

Data Availability Statement

Not applicable.

Conflicts of Interest

The authors declare no conflict of interest.

References

  1. Singh, R.S.; Culjat, M.O.; Vampola, S.P.; Williams, K.; Taylor, Z.D.; Lee, H.; Grundfest, W.S.; Brown, E.R. P3D-6 simulation, fabrication, and characterization of a novel flexible, conformal ultrasound transducer array. In Proceedings of the 2007 IEEE Ultrasonics Symposium, New York, NY, USA, 28–31 October 2007; pp. 1824–1827. [Google Scholar]
  2. Culjat, M.O.; Singh, R.S.; Utley, C.D.; Vampola, S.P.; Sharareh, B.; Lee, H.; Brown, E.R.; Grundfest, W.S. A flexible, conformal ultrasound array for medical imaging. Stud. Health Technol. Inform. 2008, 132, 95–97. [Google Scholar] [PubMed]
  3. Zhou, T.; Lan, Y.; Zhang, Q.; Yuan, J.; Li, S.; Lu, W. A conformal driving class IV flextensional transducer. Sensors 2018, 18, 2102. [Google Scholar] [CrossRef] [Green Version]
  4. Evans, M.B.; Stutin, T.A. Anticipating the Waiting Weapon: U.S. Ports and Terrorist Sea Mining; US Merchant Marine Academy: Kings Point, NY, USA, 2006. [Google Scholar]
  5. Rios, J.J. Naval Mines in the 21st Century: Can NATO Navies Meet the Challenge? Naval Postgraduate School: Monterey, CA, USA, 2005. [Google Scholar]
  6. Tellez, O.L.L.; Borghgraef, A.; Mersch, E. The special case of sea mines. In Mine Action—The Research Experience of the Royal Military Academy of Belgium; Beumier, C., Closson, D., Lacroix, V., Milisavljevic, N., Yvinec, Y., Eds.; TechOpen: London, UK, 2017; pp. 251–279. [Google Scholar]
  7. Arimatsu, L. International Law Applicable to Naval Mines. In International Security Department Workshop Summary; Chatham Housethe Royal Institute of International Affairs: London, UK, 2014. [Google Scholar]
  8. Shimoyama, T.; Nanri, M.; Murakami, Y.; Tamakawa, K. Maritime infrastructure security using underwater sonar systems. Hitachi Rev. 2013, 62, 214–218. [Google Scholar]
  9. Köhntopp, D.; Lehmann, B.; Kraus, D.; Birk, A. Classification and localization of naval mines with superellipse active contours. IEEE J. Ocean. Eng. 2019, 44, 767–782. [Google Scholar] [CrossRef]
  10. Köhntopp, D.; Lehmann, B.; Kraus, D.; Birk, A. Seafloor Classification for Mine Counter Measure Operations using Synthetic Aperture Sonar Image. In Proceedings of the IEEE Oceans, Aberdeen, UK, 19–22 June 2017; pp. 1–5. [Google Scholar]
  11. Dura, E.; Bell, J.; Lane, D. Superellipse fitting for the recovery and classification of mine-like shapes in sidescan sonar images. IEEE J. Ocean. Eng. 2008, 33, 434–444. [Google Scholar] [CrossRef]
  12. Reed, S.; Petilot, Y.; Bell, J. A Model Based Approach to Mine Detection and Classification in Sidescan Sonar. In Proceedings of the IEEE Oceans, San Diego, CA, USA, 22–26 September 2003; Volume 3, pp. 1402–1407. [Google Scholar]
  13. Quidu, I.; Malkasse, J.P.; Burel, G.; Vilbe, P. Mine Classification Using a Hybrid Set of Descriptors. In Proceedings of the OCEANS 2000 MTS/IEEE Conference and Exhibition, Conference Proceedings (Cat. No.00CH37158), Providence, RI, USA, 11–14 September 2000; Volume 1, pp. 291–297. [Google Scholar]
  14. Dura, E.; Zhang, Y.; Liao, X.; Dobeck, G.J.; Carin, L. Active learning for detection of mine-like objects in side-scan sonar imagery. IEEE J. Ocean. Eng. 2005, 30, 360–371. [Google Scholar] [CrossRef] [Green Version]
  15. Dobeck, G.J. Algorithm Fusion for Automated Sea Mine Detection and Classification. In Proceedings of the MTS/IEEE Oceans 2001. An Ocean Odyssey. Conference (IEEE Cat. No.01CH37295), Honolulu, HI, USA, 5–8 November 2001; pp. 130–134. [Google Scholar]
  16. Phung, S.L.; Nguyen, T.N.A.; Le, H.T.; Chapple, P.B.; Ritz, C.H.; Bouzerdoum, A.; Tran, L.C. Mine-Like Object Sensing in Sonar Imagery with a Compact Deep Learning Architecture for Scarce Data. In Proceedings of the Digital Image Computing: Techniques and Applications (DICTA), Perth, Australia, 2–4 December 2019; pp. 1–7. [Google Scholar]
  17. Josefsson, L.; Persson, P. Conformal array antenna theory and design. In IEEE Press Series on Electromagnetic Wave Theory; El-Hawary, M.E., Ed.; John Wiley & Sons, Inc.: Hoboken, NJ, USA, 2006; p. 182. [Google Scholar]
  18. Knott, P.; Bertuch, T.; Wilden, H.; Peters, O.; Brenner, A.R.; Walterscheid, I. SAR experiments using a conformal antenna array radar demonstrator. Int. J. Antenn. Propag. 2012, 2012, 142542. [Google Scholar] [CrossRef]
  19. Gallaudet, T.C.; de Moustier, C.P. On optimal shading for arrays of irregularly-spaced or noncoplanar elements. IEEE J. Ocean. Eng. 2000, 25, 553–567. [Google Scholar] [CrossRef]
  20. Persson, P. Analysis and Design of Conformal Array Antennas; Universitetsservice US AB: Stockholm, Sweden, 2001; p. 66. [Google Scholar]
  21. Zhao, Y.Q.; Peng, Z. Three-Dimensional Phased Array Antenna Analysis and Simulation. In Proceedings of the 3rd IEEE International Symposium on Microwave, Antenna, Propagation and EMC Technologies for Wireless Communications, Beijing, China, 27–29 October 2009; pp. 538–542. [Google Scholar]
  22. Ito, Y. Design and performance of an acoustic antenna for a phased array Doppler sodar. Meteorol. Appl. 1997, 5, 149–156. [Google Scholar] [CrossRef]
  23. Saleh, K.Y.; Smith, N.B. Two-dimensional ultrasound phased array design for tissue ablation for treatment of benign prostatic hyperplasia. Int. J. Hyperth. 2004, 20, 7–31. [Google Scholar] [CrossRef]
  24. Sun, D.; Shen, R.; Yan, X.A. Broadband conformal phased array antenna on spherical surface. Int. J. Antennas Propag. 2014, 2014, 206736. [Google Scholar] [CrossRef]
  25. Ferreira, D.B.; de Paula, C.B.; Daniel, C.; Nascimento, D.C. Design techniques for conformal microstrip antennas and their arrays. In Advancement in Microstrip Antennas with Recent Applications; Kishk, A., Ed.; InTechOpen: London, UK, 2013; pp. 3–31. [Google Scholar]
  26. Pyo, S.; Lim, Y.; Roh, Y. Analysis of the transmitting characteristics of an acoustic conformal array of multimode tonpilz transducers by the equivalent circuit method. Sens. Actuator A Phys. 2021, 318, 112507. [Google Scholar] [CrossRef]
  27. Shankar, S.G.; Beenamole, K.S.; Tamilarasan; Sreejith, C.A.; Shanthi, P.; Singh, A.K. A Comparative Study on Arc Conformal Arrays for Different Curvatures. In Proceedings of the 10th International Radar Symposium India, NIMHANS Convention Centre, Bangalore, India, 15–19 December 2015; pp. 1–4. [Google Scholar]
  28. Wei, Z.; Junfeng, Y. A design of vertical polarized conformal antenna and its array based on UAV structure. Int. J. Antennas Propag. 2017, 2017, 9769815. [Google Scholar] [CrossRef] [Green Version]
  29. Han, R. Simulation of radiation characteristics for cylindrical conformal phased array. Comput. Inf. Sci. 2010, 3, 175–179. [Google Scholar] [CrossRef] [Green Version]
  30. He, Q.Q.; Wang, B.Z. Radiation patterns synthesis for a conformal dipole antenna array. Prog. Electromagn. Res. 2007, 76, 327–340. [Google Scholar] [CrossRef] [Green Version]
  31. Lei, J.; Yang, J.; Chen, X.; Zhang, Z.; Fu, G.; Hao, Y. Experimental demonstration of conformal phased array antenna via transformation optics. Sci. Rep. 2018, 8, 3807. [Google Scholar] [CrossRef] [Green Version]
  32. Deng, L.; Wu, Y.; Hong, W.; Zhu, J.; Peng, B.; Li, S. Conformal array design on arbitrary polygon surface with transformation optics. AIP Adv. 2016, 6, 065011. [Google Scholar] [CrossRef] [Green Version]
  33. Smiley, A.; Howell, M.; Clement, G.T.; Fleischman, A.J. Toward transcranial ultrasound tomography: Design of a 456-element low profile conformal array. Biomed. Phys. Eng. Express 2019, 5, 025025. [Google Scholar] [CrossRef]
  34. Kim, H.H.; Chang, J.H.; Cannata, J.M.; Shung, K.K. 2F-3 Design of 20 MHz Convex Array Transducers for High Frequency Ophthalmic Imaging. In Proceedings of the 2007 IEEE Ultrasonics Symposium Proceedings, New York, NY, USA, 28–31 October 2007; pp. 88–91. [Google Scholar]
  35. Freitag, L.; Grund, M.; Catipovic, J.; Nagle, D.; Pazol, B.; Glynn, J. Acoustic Communication with Small UUVs Using a Hull-Mounted Conformal Array. In Proceedings of the MTS/IEEE Oceans 2001. An Ocean Odyssey, Conference (IEEE Cat. No.01CH37295), Honolulu, HI, USA, 5–8 November 2001; pp. 2270–2275. [Google Scholar]
  36. Benjamin, K.C. Recent advances in 1–3 piezoelectric polymer composite transducer technology for AUV/UUV acoustic imaging applications. J. Electroceram. 2002, 8, 145–154. [Google Scholar] [CrossRef]
  37. Yang, Y.; Tian, H.; Yan, B.; Sun, H.; Wu, C.; Shu, Y.; Wang, L.; Ren, T. A flexible piezoelectric micromachined ultrasound transducer. RSC Adv. 2013, 3, 24900–24905. [Google Scholar] [CrossRef]
  38. Zhu, S.; Yang, Y.; Wang, Y.; Yang, Q.; Yan, X. Performance of a Cylindrical Hydrophone Array for Practical Use. In Proceedings of the 2017 IEEE International Conference on Signal Processing, Communications and Computing, Xiamen, China, 22–25 October 2017; pp. 1–5. [Google Scholar]
  39. Stepnowski, A.; Szczucka, J.; Pankiewicz, L. Computer simulation of beam patterns for a sonar phased cylindrical array. In Progress in Underwater Acoustics; Merklinger, H.M., Ed.; Springer: Boston, MA, USA, 1987; pp. 627–638. [Google Scholar]
  40. Huissoon, J.P. Multiobjective design of curved array sonar transducers. In Acoustical Imaging; Ermert, H., Harjes, H.P., Eds.; Springer: Boston, MA, USA, 1992; pp. 231–236. [Google Scholar]
  41. Lesniak, W. High-precision bearing estimation for active sonar with cylindrical array performed by interpolated array transformation. Hydroacoustic 2016, 19, 238–265. [Google Scholar]
  42. Bertilone, D.C.; Killeen, D.S.; Bao, C. Array gain for a cylindrical array with baffle scatter effects. J. Acoust. Soc. Am. 2007, 122, 2679–2685. [Google Scholar] [CrossRef]
  43. Yen, J.T.; Steinberg, J.P.; Smith, S.W. Sparse 2-D array design for real time rectilinear volumetric imaging. IEEE Trans. Ultrason Ferroelectr. Freq. Control 2000, 47, 93–110. [Google Scholar] [CrossRef] [Green Version]
  44. Barott, W.C.; Steffes, P.G. A Three-Dimensional Pattern-Space Representation for Volumetric Arrays. IEEE Antennas Wirel Propag. Lett. 2008, 7, 1–5. [Google Scholar] [CrossRef]
  45. Zhang, Y.; Wang, L.; Qin, L.; Liao, Q.; Zhong, C.A. Doubly-Curved Piezoelectric Composite with 1–3 Connectivity for Underwater Transducer Applications. In Proceedings of the IOP Conferences Series: Materials Science and Engineering, 4th International Conference on Advanced Engineering and Technology, Shanghai, China, 15–17 December 2017; IOP Publishing Ltd.: Bristol, UK, 2018; Volume 317, pp. 1–6. [Google Scholar]
  46. Rigelsford, J.M. Design and Analysis of an Acoustic Random Spherical Volumetric Array. Ph.D. Thesis, The University of Hull, Cottingham, UK, 2001. [Google Scholar]
  47. Ahmad, K.A.; Abd Manaf, A.; Mohd Yaacob, M.H.; Rahman, M.F.A. Design of Polyimide based Piezoelectric Micromachined Ultrasonic Transducer for Underwater Imaging Application. In Proceedings of the International Conference on Imaging, Signal Processing and Communication, Penang, Malaysia, 26–28 July 2017; Association for Computing Machinery: New York, NY, USA, 2017; pp. 63–66. [Google Scholar]
  48. Sonar. Available online: https://www.sciencedirect.com/topics/physics-and-astronomy/sonar (accessed on 8 April 2021).
  49. Wettergren, T.A.; Traweek, C.M. Optimization of conventional beamformer shading weights for conformal velocity sonar. IEEE J. Ocean. Eng. 2005, 30, 213–220. [Google Scholar] [CrossRef]
  50. Kinsler, L.E.; Frey, A.R.; Coppens, A.B.; Sanders, J.V. Fundamentals of Acoustics, 4th ed.; John Wiley & Sons Inc.: New York, NY, USA, 2000; p. 195. [Google Scholar]
  51. Foote, K.G. Discriminating between the nearfield and the farfield of acoustic transducers. J. Acoust. Soc. Am. 2014, 136, 1511–1517. [Google Scholar] [CrossRef] [Green Version]
  52. Butler, J.L.; Sherman, C.H. Transducers and Arrays for Underwater Sound, 2nd ed.; Springer: Boston, MA, USA, 2008; p. 349. [Google Scholar]
  53. Lasdon, L.S.; Plummer, J.C. Multistart algorithms for seeking feasibility. Comput. Oper. Res. 2008, 35, 1379–1393. [Google Scholar] [CrossRef]
  54. Ugray, Z.; Lasdon, L.; Plummer, J.; Glover, F.; Kelly, J.; Martí, R. Scatter search and local NLP solvers: A multistart framework for global optimization. Inf. J. Comput. 2007, 19, 328–340. [Google Scholar] [CrossRef]
  55. Abazid, M.; Alkoud, D. A least-squares approach to prediction the future sales of pharmacy. Int. J. Innov. Technol. Explor. Eng. 2018, 7, 1–4. [Google Scholar]
  56. Koukouvinos, C. Orthogonal 2k and 3k factorial designs constructed using sequences with zero autocorrelation. Stat. Probab. Lett. 1996, 28, 59–63. [Google Scholar] [CrossRef]
  57. Dobson, J.; Tweedie, A.; Harvey, G.; O’Leary, R.; Mulholland, A.; Tant, K.; Gachagan, A. Finite element analysis simulations for ultrasonic array NDE inspections. AIP Conf. Proc. 2016, 1706, 040005. [Google Scholar]
  58. Augustyniak, M.; Usarek, Z. Finite element method applied in electromagnetic NDTE: A review. J. Nondestruct. Eval. 2016, 35, 39. [Google Scholar] [CrossRef] [Green Version]
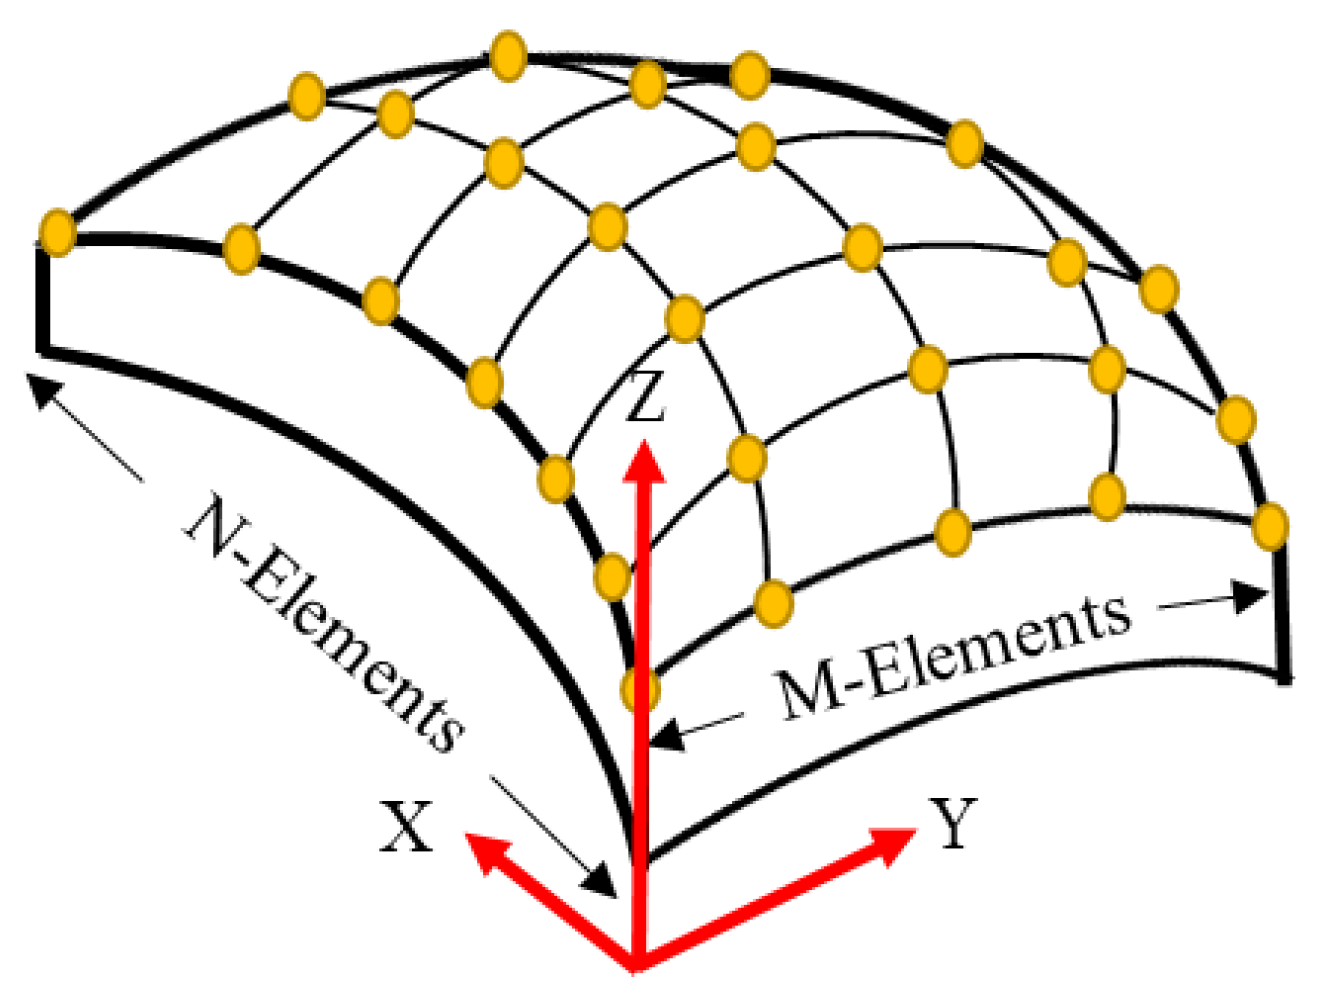
Figure 1. The schematic structure of the M × N volumetric array of point sources.
Sensors 21 03591 g001
Figure 2. Idealized geometry of the conformal array: (a) M-subarray part; (b) N-subarray part.
Sensors 21 03591 g002
Figure 3. Analytical geometry for calculating the directional factor of the rectangular element.
Sensors 21 03591 g003
Figure 4. Flowchart for the optimization of the conformal array.
Sensors 21 03591 g004
Figure 5. The beam pattern of the M-subarray part of the optimized conformal structure compared with the basic model.
Sensors 21 03591 g005
Figure 6. The beam pattern of the N-subarray part of the optimized conformal structure compared with the basic model.
Sensors 21 03591 g006
Figure 7. The cross-section of the FEA model of the 5 × 55 conformal array.
Sensors 21 03591 g007
Figure 8. Two-dimensional theoretical beam pattern of the 5 × 55 conformal array compared with those from the FEA: (a) M-subarray part; (b) N-subarray part.
Sensors 21 03591 g008
Figure 9. Three-dimensional beam pattern of the 5 × 55 conformal array.
Sensors 21 03591 g009
Figure 10. TVR spectrum of the 5 × 55 conformal array.
Sensors 21 03591 g010
Table 1. Variation range of the design variables for the M-subarray part.
Design VariableLower BoundBasicUpper Bound
Radius of Curvature, RM (mm)182.5202.8223.1
Length of Element, L (mm)5.05.25.4
Table 2. Comparison between basic and optimized models for the M-subarray part.
ModelGeometrical ParametersPerformance Parameters
MRM (mm)L (mm)Ripple (dB)Beamwidth (°)
Basic55202.85.22.675.1
Optimized55182.55.22.385.1
Table 3. Variation range of design variables for the N-subarray part.
Design VariablesLower BoundBasicUpper Bound
Radius of Curvature, RN (mm)80120160
Width of Element, W (mm)1.63.65.6
Table 4. Comparison between basic and optimized models for the N-subarray part.
ModelGeometrical ParametersPerformance Parameters
NRN (mm)W (mm)Ripple (dB)Beamwidth (°)
Basic51203.6038.0
Optimized51505.6025.3
Table 5. Material properties of constituent components of the conformal array.
MaterialDensity (kg/m3)Longitudinal Velocity (m/s)Shear Velocity (m/s)
Urethane/Kerf10651284252
Backer171218150
Aluminum270061493097
Water100015000
Table 6. Quantitative comparison between the theoretical and FEA results.
M-Array PartN-Array Part
Measured ParametersTheoreticalFEATheoreticalFEA
−3 dB Beamwidth (°)85.185.225.324.5
Ripple level (dB)2.32.300
Publisher’s Note: MDPI stays neutral with regard to jurisdictional claims in published maps and institutional affiliations.