Abstract
Human presence detection is an application that has a growing need in many industries. Hotel room occupancy is critical for electricity and energy conservation. Industrial factories and plants have the same need to know the occupancy status to regulate electricity, lighting, and energy expenditures. In home security there is an obvious necessity to detect human presence inside the residence. For elderly care and healthcare, the system would like to know if the person is sleeping in the room, sitting on a sofa or conversely, is not present. This paper focuses on the problem of detecting presence using only the minute movements of breathing while at the same time estimating the breathing rate, which is the secondary aim of the paper. We extract the suspected breathing signal, and construct its Fourier series (FS) equivalent. Then we employ a generalized likelihood ratio test (GLRT) on the FS signal to determine if it is a breathing pattern or noise. We will show that calculating the GLRT also yields the maximum likelihood (ML) estimator for the breathing rate. We tested this algorithm on sleeping babies as well as conducted experiments on humans aged 12 to 44 sitting on a chair in front of the radar. The results are reported in the sequel.
1. Introduction
The need for remote human presence detection is growing. Home security systems use cameras and passive infra-red (PIR) sensors to determine if a person approaching or is inside the house. Passive infra-red sensors suffers from many false alarm, but more importantly, they cannot sense minute movements like a still, sleeping person and cameras are not suitable for applications in which privacy is needed like monitoring an elderly in the restroom. Radars have become a readily available solution for the consumer, so in this paper we will focus on the usage of a radar to detect the micro-Doppler effect of breathing, and thereby determine if a person is there or not. The problem of presence sensing is basically an decision problem: is there someone in the radar search volume or not? If the person walks or moves inside the room, a simple moving target indicator (MTI) followed by a constant false alarm rate (CFAR) detector can be employed to detect the walking or movement. However, this method will not work properly on a person who is immobile and only breathing, such as the situation when a person is asleep. Another critical example is baby monitoring applications: inside the car (in-cabin) elimination of the forgotten baby syndrome, in-crib detection of sudden infant death syndrome (SIDS), both relies on accurate, true presence detection.
The topic of human presence detection using radars had been studied before both in the context of moving and stationary subjects. In [1], the authors showed the possibility of presence detection with a FMCW 24 GHz radar and compared it to passive-infrared (PIR) measurements. They utilized an energy detector on the range-Doppler map to decide whether a target is present or not, and did not deal with complete stationary or sleeping targets. The algorithm proposed in [2] is based on calculation of the Doppler power to identify doorway crossing and thus infer on the occupancy of a given room or space. This work also dealt with the problem of walking humans only. WiFi signals were used in [3] for passive-occupancy detection of humans. Though they did not deal with stationary targets, they reported promising results on people counting and presence detection of walking humans. Fourier processing with constant energy threshold detector was utilized in [4], however, stationary human presence accuracy was not reported.
The feasibility of using breathing to detect presence was proven in [5,6], where they showed that a mechanical target which simulates a breathing human can be detected in a room with 93% accuracy by using a Doppler radar with a threshold on the root mean square (RMS) of the received signal, while in [7] a non-adaptive energy threshold detector calculated from pre-recorded noise data was employed to determine if there is one person or two in the radar search volume, both in movement and stationary settings. However, high energy does not mean breathing, or presence. Finally, the usage of convolutional neural networks (CNN) were investigated in [8], where a Doppler radar and and infrared imaging device were jointly employed for presence detection of one human in a specific room. They reported an accuracy of . The usage of CNNs bares a complex implementation for real-time purposes, as well as it relies heavily on visual information from the infrared imaging device.
Another application in which sensing the vital signs of a human subject is critical is through-wall and through-debris life sensing. In [9], the detection of vital signs through walls was investigated. They showed the feasibility of detecting the breathing and heart-rate of a human subject standing behind a wall, while in [10] they proposed a continuous wave radar architecture for the purpose of detecting vital signs through highly dense construction materials of about m thick. In [11], they used empirical mode decomposition to prove feasible the detection of breathing, hand waving and body bending behind an obstacle emulating debris. Through-debris breathing detection was also shown feasible in [12], where they experiment with a debris setup and a live person lying and breathing under it. They showed visual results that the human can be detected, though they did not show how to detect the human in an automated manner. The underlying assumption of the above papers is that the subject is there. The accurate estimation of the breathing frequency is also of importance for many applications, including baby monitoring, elderly care, sleep monitoring and more.
Breathing rate extraction with a pulse-Doppler architecture was presented in [13], where they visually showed feasibility of extracting the breathing rate of a stationary and moving human using Fourier analysis. They employed range-Doppler processing, but there was no outline of how to detect the ’breathing targets’ and verify that it is in fact breathing, also the accuracy was not evaluated. The authors in [14,15] used the wavelet transform to overcome the discrete Fourier transform (DFT) resolution insufficiency, and for the same reason the chirp Z transform was used in [16] to estimate breathing rate. The chirp Z transform was also used in [17] coupled with an analytical model for the remote estimation of both breathing and heart-rate. The accuracy of these methods and a comparison against a known bound was not analyzed. More recent work on remote breathing extraction can be found in [18,19], in which breathing was extracted with a radar and a verification that the peak is falling within the breathing band of frequencies was done. While [18,19] reported accuracy results and evaluation of proposed methods, as we show in this paper, we achieve better results by using a maximum likelihood estimator. Furthermore, the verification presented there is not optimal, and does not test adherence to a breathing model, as the detector we present in this paper does.
The need to rely on the breathing movement for human presence detection stems from the fact that the use of a moving target indicator (MTI) [20], often fails to detect stationary humans. MTI is essentially a high-pass filter (HPF) that filters out close to zero-Doppler targets. This HPF caveat is that it most often filters out the breathing, being that breathing frequency is very close to the zero frequency (DC), hence, will fail to detect a sleeping person.
We propose an algorithm that detects presence using the minute movements of the abdomen and torso due to breathing, while at the same time, estimates the breathing frequency. Since detecting moving targets, even targets that slightly shift in their chair, can be done using MTI, we intentionally deal only with strictly stationary subjects.
Thus, this paper’s contribution is three fold. First, we present a framework of detecting presence using only the breathing movement. We develop a GLRT detector which, as an input, takes the suspected breathing pattern and as an output decides whether its breathing (presence) or not. Second, a maximum likelihood (ML) estimator of the breathing rate is developed, and shown to asymptotically achieve the Cramer–Rao lower bound (CRB), and lastly, we show that the GLRT detector and ML estimator are the same mathematical expression so we inherently get both with one evaluation. We tested this algorithmic framework performance on various scenarios such as sleeping babies and stationary adults, and results are reported.
In Section 2, we explain the measurement setup, and immediately move to derive both the GLRT detector as well as the ML estimator in Section 3. The estimator is also compared to the CRB. In Section 4, we explain the experiments we have done to verify our algorithms as well as report the results. We discuss future work in Section 5 and we conclude the paper in Section 6.
2. Measurement Setup
The radar we use is an ultra wide-band (UWB) radar module named X4M300 (Novelda AS, Oslo, Norway) which carries XeThru X4 UWB radar chip. We collect the raw data to the PC through USB. The data are then feeding the algorithm we propose. The radar parameters are depicted in Table 1.

Table 1.
Radar parameters.
The radar manufacturer tested this hardware for the specific application of breathing movement sensing for different angles and ranges. They concluded that even when the torso is 90 degrees rotated towards the radar, the micro-Doppler of the breathing is still present, and can be reliably detected even from m away [21].
Radar Operation
The radar is transmitting a pulse with a pulse repetition frequency of MHz and receiving the returned pulse. Integration is done on many pulses in order to increase the signal to noise ratio (SNR) so that the output is an integrated pulse, called a frame, every s. In general, the return signal represents a superposition of reflected pulses from the environment, including, if present, a breathing target. Each sample of this returned frame represents a range bin or a fast-time bin. Let be the number of range bins. If we wait T seconds in slow time or K frames we will get a slow time vs. fast-time matrix of size , in which each row is a radar frame and each column is the change of radar return amplitude over T seconds (and K radar frames) of slow time.
If we know the specific range bin in which the breathing phenomenon is present and extract this column, then we will get a slow time signal that is periodic with a fundamental breathing frequency . The method to extract the relevant range-bin is detailed in the next section.
3. Method
3.1. Extracting the Suspected Breathing Signal
Let denote the matrix of size as described above, l is the current frame index such that the last row in is the lth received radar frame and the first row is the frame.
The columns of this matrix are then filtered with a HPF that filters out all frequencies below a minimal breathing frequency of Hz. Next, each column spectrum is calculated using the fast Fourier transform (FFT), generating a range-Doppler map.
A maximum peak is then searched for inside the range Doppler map, and its corresponding range-bin is declared as the range bin of the target. The respective column out of the matrix is extracted and is denoted in this paper as the signal .
This signal is then used in to estimate breathing frequency while at the same time to detect the breathing signal, as seen in the next subsections.
3.2. Fourier Series Expansion
In this section, we show how we represent the extracted signal using Fourier series (FS), which constructs the detection and estimation problem as a least squares problem. Since the extracted signal is suspected to be a periodic breathing signal with a deterministic period inside the observation window, we can represent it as a FS model
where is a zero mean circularly complex Gaussian r.v. with variance , is the breathing frequency, is the m’th Fourier coefficient and M is the number of relevant breathing harmonies in the signal. Note that is unknown as well as the Fourier coefficients . Arranging (1) in a vector-matrix form to account for samples we can write
where , the entry in the matrix is given by , and , thus, .
3.3. Maximum Likelihood Estimation of the Breathing Rate
3.3.1. Derivation of the ML Estimator
Define the parameters in (2) as , then the ML estimator of is given by
Note that the matrix is a function of the parameter , thus, for the sake of brevity will be referred to as in the sequel.
Since the ML estimator of the coefficient vector for a given is given by , inserting it back into (3) will yield
Since the term in (4) is the projection matrix into the column space of , we define . Moreover, since is also a projection matrix, it satisfies , we can write
but
where the last line in (6) is due to the property that a projection matrix will satisfy .
Since the term is independent of the parameter we can write
which can be solved by a line search across valid values of the breathing rate Hz.
We will see in the next subsection that the value of evaluated at is also the GLRT value, so we get both the breathing rate estimation as well as the evaluation of the GLRT test value in one calculation.
3.3.2. Cramér–Rao Lower Bound
The CRB for the estimation of the breathing frequency can be divided to different cases, dependent on which parameters are assumed to be known. In our case, we are only interested in the frequency while the amplitudes and phases are unknown and nuisance. For this case, the CRB for estimating is given by [19,22]
where K is the number of samples, the SNR is defined in (9) and the effective bandwidth, is defined in (10).
The effective bandwidth is also knows in the literature as r.m.s. bandwidth [23]. As seen in (8)–(10) if more harmonies are presented in the signal, the SNR effective bandwidth increases and the CRB decreases in an inverse relation.
The performance of the estimator in (7) for various values compared to the CRB is depicted in Figure 1, where it is shown that for dB the estimator meets the bound.
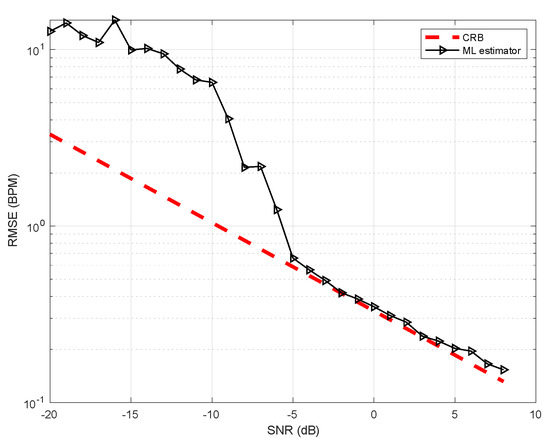
Figure 1.
Root mean squared error vs. CRB for number of harmonics and fundamental frequency of 0.312 Hz.
3.4. Generalized Likelihood Ratio Test (GLRT)
As derived in Appendix A the test is given by
where is the test threshold and is computed in our experiments to a constant false alarm rate of . The calculation of this threshold was done empirically and numerically using Neyman-Pearson’s theorem [24].
Monte-Carlo simulation was performed in order to study the separation between hypotheses. Thus, histograms of the detector value, under both hypotheses for various SNRs is shown in Figure 2. As shown, a very good separation is achieved for SNR greater than dB. The Receiver Operating Characteristics (ROC) curve of the test for various SNR values is given in Figure 3. As depicted for SNR dB we might be able to estimate the breathing frequency and meet the CRB but at the operating point we will have quite a few misses and false-alarms in detection. For lower SNR, the values of the area under the (ROC) curve or AUC is more informative. It can be seen that as expected for very low (∼ dB) SNR regime the AUC is about meaning there is no separation capability between the hypotheses, but as we go up in SNR and close to dB the near 1 AUC suggest a very good separation between the hypotheses as shown in Figure 4.
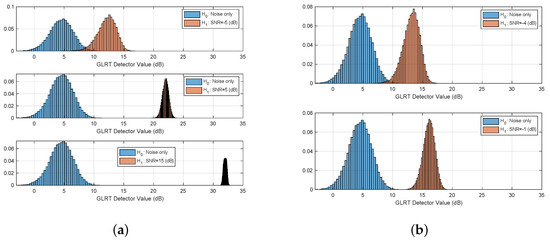
Figure 2.
Histograms of the detector value for both hypotheses and various SNRs. (a) SNR dB. (b) SNR= dB.
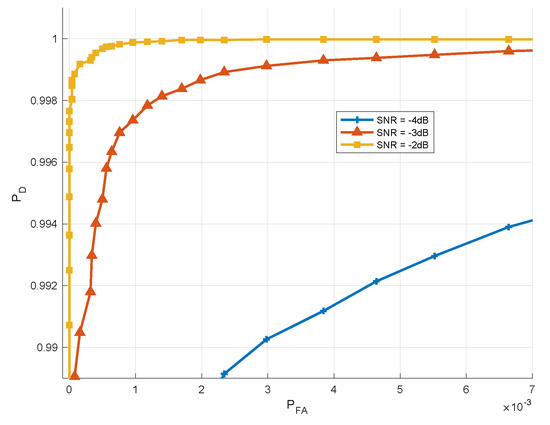
Figure 3.
ROC Curve—Detection Probability vs. False alarm for various SNR values.
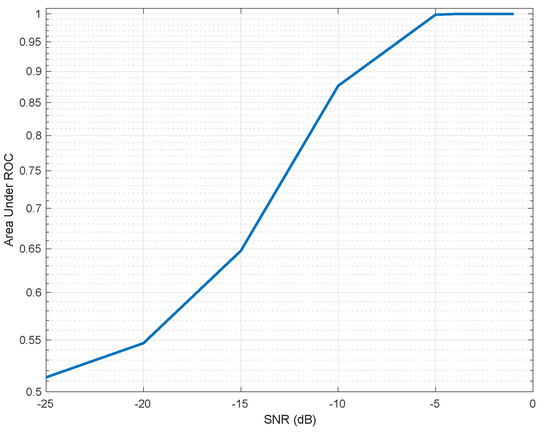
Figure 4.
Area Under Curve for various SNR values.
4. Experimental Results
The algorithm was tested in two distinct settings (Experiments approved by IRB number FES-HSES1901):
- Baby sleeping. The proposed method was tested on 2 babies across 4 nights, each of which representing an uninterrupted, full night sleep, so total of 8 nights were tested. We placed the radar at half a meter and one meter away from the crib directly facing its long-side as depicted in Figure 5. Both babies were wearing a swaddle, and the babies were moving in the crib so random poses with respect to the radar were presented during the night. Analysis of the SNRs and test distribution are described below. No false alarms or misses were reported.
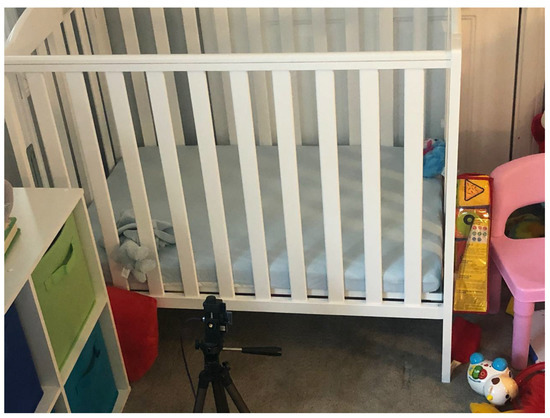 Figure 5. Baby crib—radar setup.
 - Adults sitting: The proposed method was tested on nine test subjects, ages 12 to 44, sitting still without moving in front of the sensor, in various distances, breathing. The duration was approx. 60 s and sometimes more per test subject. The purpose of this these experiments was to analyze the errors in breathing rate as reported below. The setup is as seen in Figure 6. The test subject was sitting on the chair, leaning back, sitting as still as they can, looking straight to the radar. The distance was measured both with the radar as well as a measuring tape as seen in the figure.
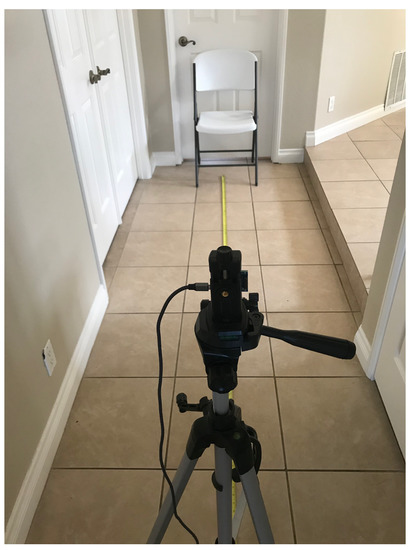 Figure 6. Breathing rate estimation—test setup.
4.1. Efficacy of Breathing Signal Extraction
The efficacy of the breathing signal extraction was discussed in [18]. It was tested on various subjects wearing on their abdomen a Neulog’s respiration monitoring Belt logger NUL-236 (Neulog, Rochester, NY, USA) [25], used as ground truth. In [18], the efficacy of the extracted breathing signal was not tested under various distances so we decided to further test it with different radar ranges, from 1 m to 4 m. Table 2 summarizes the subjects parameters, while Table 3 shows the correlation coefficients of the radar extracted breathing signal to the ground truth. A few examples of the two signals superimposed on each other are shown in Figure 7, Figure 8 and Figure 9. We report a maximum correlation of 0.971 and minimum of 0.781.The mean correlation coefficient we get over all distances and subjects is 0.881 which suggests a high efficacy of breathing signal extraction.

Table 2.
Subjects information.

Table 3.
Experiment scenarios correlation coefficients.
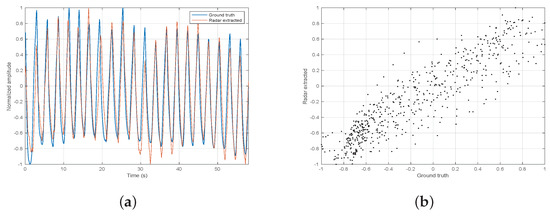
Figure 7.
Experiment 1 signal extraction. (a) ground truth and radar extracted on top of each other. (b) correlation scatter.
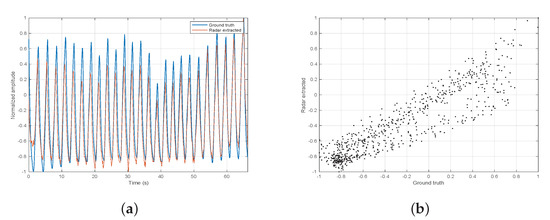
Figure 8.
Experiment 2 signal extraction. (a) ground truth and radar extracted on top of each other. (b) correlation scatter.
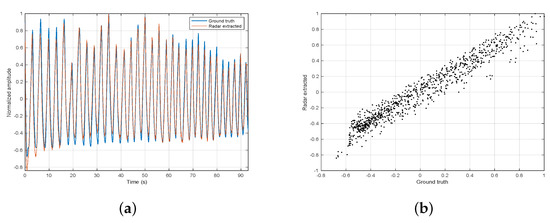
Figure 9.
Experiment 3 signal extraction. (a) ground truth and radar extracted on top of each other. (b) correlation scatter.
4.2. Examples of the Test Distribution for Various SNR Regimes
Baby I and II (see Table 4) were recorded sleeping for 4 nights each. We placed the radar at distances of half a meter and a meter away from the crib directly facing its long-side as depicted in Figure 5. The two different scenarios make for a variation in estimated SNR which we can use to visually test the adherence of the test distribution under both hypotheses to the theoretical above. As can be seen in Figure 10 and Figure 11 the graphs resembles the theoretical results depicted in Figure 2 for SNR dB.

Table 4.
Baby information.
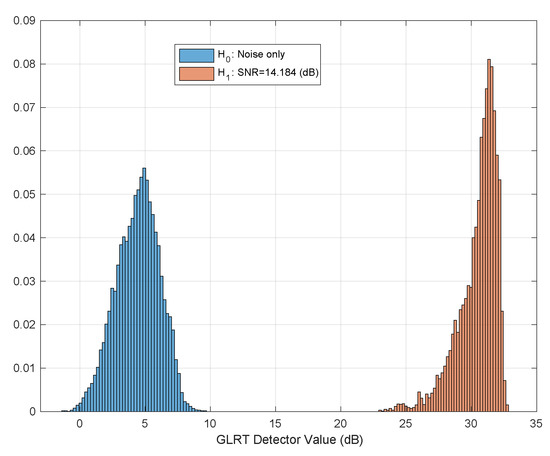
Figure 10.
Real example of test hypothesis separation. SNR dB. Extracted from an overnight sleep of Baby I.
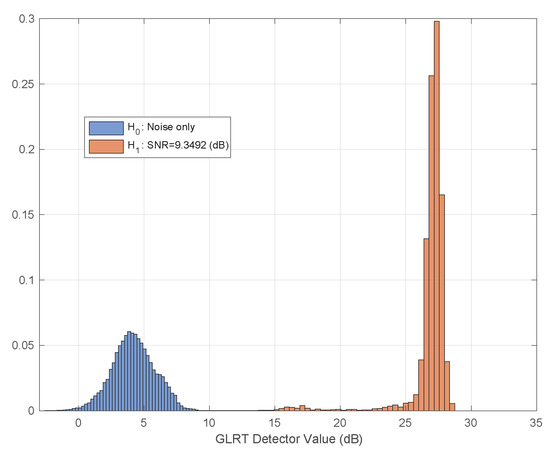
Figure 11.
Real example of test hypothesis separation. SNR dB. Extracted from an overnight sleep of Baby II.
4.3. Accuracy Results
This section will outline the detector performance and ML estimation accuracy results. In our experiments we took harmonies and a time window of 10 s or samples. The time window affects the estimation accuracy as per Equation (8). Shortening it will provide less information in the observation window and the estimation accuracy will drop, increasing it will improve it but at the same time increase the risk of losing local stationarity, i.e., breathing rate change inside the time window. Ten seconds is what we chose as a trade-off.
4.3.1. Detector Accuracy
The detector accuracy was evaluated across 8 combined nights of sleeping, split between two baby subjects. The ground truth was a camera synced to the radar. Over these 8 nights no false alarm or misses were reported. The reason for that is we work on a good SNR regime in which the separation between hypotheses is good and the sensitive detector probably needs months of operations to have a false or a miss. Figure 10 and Figure 11 depicts the real, empirical, distribution of the test under both hypotheses. The babies move and change pose throughout the night, thus, the test value has a range of between 14 dB to 33 dB.
4.3.2. ML Estimation Accuracy
The results of the experiments described above performed on the nine subjects in Table 2 are shown in Table 5, Table 6 and Table 7. The root mean squared error (RMSE) in BPM for different distances are summarized. At times, the subjects were instructed to either breathe normally, or fast, to allow for variations in breathing rate. The table layout the breathing rate, the RMSE in BPM and the percentage of the RMSE with respect to the true breathing rate. The true breathing rate is reported and any rate higher than 20 BPM is considered fast. We report maximal error of 0.170 BPM and maximum percentage of of true breathing rate across all experiments and subjects, which is much better than the performance of the algorithm we proposed in [18].

Table 5.
Root mean squared error results on test subjects for ranges 1–2 m.

Table 6.
Root mean squared error results on test subjects for ranges 2–3 m.

Table 7.
Root mean squared error results on test subjects for ranges 3–4 m.
5. Future Work
The below points were identified for future work.
5.1. Sleep Stages Classification
The proposed algorithm is dealing only with presence detection, hence, there is a spread in values of the detector across time as shown in Figure 10 and Figure 11. It is interesting to investigate if the GLRT value along with the breathing rate can be used as a descriptor to classify sleep stages, like awake, deep, light sleep, and Rapid Eye Movement sleep (REM).
5.2. Breathing Extraction under Movements
The proposed algorithm is detecting the movement of the breathing, however, when shifting in the chair or in bed, the breathing is “masked” by the bulk movement of the body. While a simple MTI will detect the movement, the breathing estimation during this movement will be wrong, because the movement is not taken into account in the proposed breathing model. Investigation of how to deal with remote breathing extraction under movement is something we plan for the future.
6. Conclusions
A method for the simultaneous presence detection and breathing rate estimation was presented. The method relies on the detection of minute movements of the torso due to breathing, such that even when the person is sitting still and breathing only, the detector is still effectively able to tell that there is a presence. The algorithm expands the breathing signal using Fourier series, and uses a simple line search for the maximum likelihood estimation of the breathing rate and the detector value simultaneously. We analyzed both the detector’s performance as well as the estimator’s performance, both in a Monte-Carlo setting as well as real life, and concluded that the estimator meets the CRB and for SNR values greater than dB. Moreover, we report a maximum error of 0.170 BPM for distances up to 4 m. In order to analyze the detector performance in real life, we tested the algorithm on eight full nights recordings of two babies sleeping, reporting zero false alarm and zero misses.
Author Contributions
Data gathering, experiments, formal analysis, method development, algorithm development—N.R.; Supervision—D.W. All authors have read and agreed to the published version of the manuscript.
Funding
This research received no external funding.
Institutional Review Board Statement
The study was approved by the Ben-Gurion University of the Negev, Human Subjects Research Committee, No. FES-HSES1901.
Informed Consent Statement
Informed consent was obtained from all subjects involved in the study.
Conflicts of Interest
The authors declare no conflict of interest.
Appendix A. Derivation of the GLRT Detector
The hypotheses testing problem we are dealing with here can be written as
where of size and of size are unknown deterministic parameters and is a vector of noise such that in the general case .
Using maximum likelihood estimation of the parameters, the GLRT is given by
If we substitute the ML estimator of and we get
The distribution of under each hypothesis is complex Gaussian and is given by
The Gaussian under both hypotheses has the same multiplicative coefficient, hence after taking the natural logarithm of (A2), omitting the operation for brevity, we get
Since the ML estimator of , denoted here by , is given by the weighted least squares estimator we can write
and
Since is a projection matrix into the column space of , and is also a projection matrix, hence, noting that any projection matrix will satisfy we can write
and
Thus, calculating the first term in the left hand side (LHS) of (A5) we get
Plugging this result into the LHS of (A5) we get
Setting , re-instating omitted the operation and moving the constant noise variance into the RHS to be absorbed in the new threshold brings us to the next expression which concludes our derivation.
References
- Deiana, D.; Suijker, E.M.; Bolt, R.J.; Maas, A.P.M.; Vlothuizen, W.J.; Kossen, A.S. Real time indoor presence detection with a novel radar on a chip. In Proceedings of the 2014 International Radar Conference, Lille, France, 13–17 October 2014; pp. 1–4. [Google Scholar]
- Kalyanaraman, A.; Soltanaghaei, E.; Whitehouse, K. Doorpler: A Radar-Based System for Real-Time, Low Power Zone Occupancy Sensing. In Proceedings of the 2019 IEEE Real-Time and Embedded Technology and Applications Symposium (RTAS), Montreal, QC, Canada, 16–18 April 2019; pp. 42–53. [Google Scholar]
- Tang, C.; Li, W.; Vishwakarma, S.; Chetty, K.; Julier, S.; Woodbridge, K. Occupancy Detection and People Counting Using WiFi Passive Radar. In Proceedings of the 2020 IEEE Radar Conference (RadarConf20), Florence, Italy, 21–25 September 2020; pp. 1–6. [Google Scholar] [CrossRef]
- Santra, A.; Ulaganathan, R.V.; Finke, T. Short-Range Millimetric—Wave Radar System for Occupancy Sensing Application. IEEE Sens. Lett. 2018, 2, 1–4. [Google Scholar] [CrossRef]
- Yavari, E.; Nuti, P.; Boric-Lubecke, O. Occupancy detection using radar noise floor. In Proceedings of the 2016 IEEE/ACES International Conference on Wireless Information Technology and Systems (ICWITS) and Applied Computational Electromagnetics (ACES), Honolulu, HI, USA, 13–17 March 2016; pp. 1–3. [Google Scholar]
- Nuti, P.; Yavari, E.; Boric-Lubecke, O. Doppler radar occupancy sensor for small-range motion detection. In Proceedings of the 2017 IEEE Asia Pacific Microwave Conference (APMC), Kuala Lumpur, Malaysia, 13–16 November 2017; pp. 192–195. [Google Scholar] [CrossRef]
- Baird, Z.; Gunasekara, I.; Bolic, M.; Rajan, S. Principal component analysis-based occupancy detection with ultra wideband radar. In Proceedings of the 2017 IEEE 60th International Midwest Symposium on Circuits and Systems (MWSCAS), Boston, MA, USA, 6–9 August 2017; pp. 1573–1576. [Google Scholar] [CrossRef]
- Abedi, M.; Jazizadeh, F. Deep-Learning for Occupancy Detection Using Doppler Radar and Infrared Thermal Array Sensors. In Proceedings of the 36th International Symposium on Automation and Robotics in Construction (ISARC), Banff, AB, Canada, 21–24 May 2019; Al-Hussein, M., Ed.; International Association for Automation and Robotics in Construction (IAARC): Banff, AB, Canada, 2019; pp. 1098–1105. [Google Scholar] [CrossRef]
- Liang, X.; Deng, J.; Zhang, H.; Gulliver, T.A. Ultra-Wideband Impulse Radar Through-Wall Detection of Vital Signs. Sci. Rep. 2018, 8. [Google Scholar] [CrossRef] [PubMed]
- JalaliBidgoli, F.; Moghadami, S.; Ardalan, S. A Compact Portable Microwave Life-Detection Device for Finding Survivors. IEEE Embed. Syst. Lett. 2016, 8, 10–13. [Google Scholar] [CrossRef]
- Narayanan, R.M. Earthquake Survivor Detection Using Life Signals from Radar Micro-Doppler. In Proceedings of the 1st International Conference on Wireless Technologies for Humanitarian Relief, Kollam, India, 18–21 December 2011; pp. 259–264. [Google Scholar] [CrossRef]
- Grazzini, G.; Pieraccini, M.; Parrini, F.; Spinetti, A.; Macaluso, G.; Dei, D.; Atzeni, C. An ultra-wideband high-dynamic range GPR for detecting buried people after collapse of buildings. In Proceedings of the XIII Internarional Conference on Ground Penetrating Radar, Lecce, Italy, 21–25 June 2010; pp. 1–6. [Google Scholar] [CrossRef]
- Koo, Y.S.; Ren, L.; Wang, Y.; Fathy, A.E. UWB MicroDoppler Radar for human Gait analysis, tracking more than one person, and vital sign detection of moving persons. In Proceedings of the 2013 IEEE MTT-S International Microwave Symposium Digest (MTT), Seattle, WA, USA, 2–7 June 2013; pp. 1–4. [Google Scholar] [CrossRef]
- Karthikeyan, S.; Renga Preethi, N.S. Life detection system using UWB Radar During Disaster. In Proceedings of the 2018 Second International Conference on Green Computing and Internet of Things (ICGCIoT), Bangalore, India, 16–18 August 2018; pp. 361–365. [Google Scholar] [CrossRef]
- Tariq, A.; Shiraz, H.G. Doppler radar vital signs monitoring using wavelet transform. In Proceedings of the Antennas and Propagation Conference (LAPC), Loughborough, UK, 8–9 November 2010; pp. 293–296. [Google Scholar] [CrossRef]
- Hsieh, C.H.; Shen, Y.H.; Chiu, Y.F.; Chu, T.S.; Huang, Y.H. Human respiratory feature extraction on an UWB radar signal processing platform. In Proceedings of the 2013 IEEE International Symposium on Circuits and Systems (ISCAS), Beijing, China, 19–23 May 2013; pp. 1079–1082. [Google Scholar] [CrossRef]
- Lazaro, D.G.A.; Villarino, R. Analysis of vital signs monitoring using an IR-UWB radar. Prog. Electromagn. Res. 2010, 100, 265–284. [Google Scholar] [CrossRef]
- Regev, N.; Wulich, D. Multi-Modal, Remote Breathing Monitor. Sensors 2020, 20, 1229. [Google Scholar] [CrossRef] [PubMed]
- Regev, N.; Wulich, D. Remote sensing of vital signs using an ultra-wide-band radar. Int. J. Remote Sens. 2019, 40, 6596–6606. [Google Scholar] [CrossRef]
- Skolnik, M. Radar Handbook, 3rd ed.; McGraw Hill: New York, NY, USA, 2008; pp. 2.33–2.39. [Google Scholar]
- Novelda, A.S. X4M300 Datasheet. 2018; pp. 14–15.
- Nehorai, A.; Porat, B. Adaptive comb filtering for harmonic signal enhancement. IEEE Trans. Acoust. Speech Signal Process. 1986, 34, 1124–1138. [Google Scholar] [CrossRef]
- Helstrom, C. Statistical Theory of Signal Detection; International Series of Monographs on Electronics and Instrumentation; Pergamon Press: Oxford, UK, 1968. [Google Scholar]
- Kay, S.M. Fundamentals of Statistical Signal Processing, Volume 2: Detection Theory; Prentice-Hall Inc.: Hoboken, NJ, USA, 1993. [Google Scholar]
- Neulog’s Respiration Monitor Belt logger NUL-236. Available online: https://neulog.com/respiration-monitor-belt/ (accessed on 2 October 2020).
Publisher’s Note: MDPI stays neutral with regard to jurisdictional claims in published maps and institutional affiliations. |
© 2021 by the authors. Licensee MDPI, Basel, Switzerland. This article is an open access article distributed under the terms and conditions of the Creative Commons Attribution (CC BY) license (https://creativecommons.org/licenses/by/4.0/).