
Dimensionally Stable Anode Based Sensor for Urea Determination via Linear Sweep Voltammetry


 ,
,  and
and 
Abstract
1. Introduction
2. Materials and Methods
2.1. Electrode Preparation
2.2. Sample Preparation
2.3. Physicochemical Characterizations
2.4. Electrochemical Characterizations
3. Results and Discussion
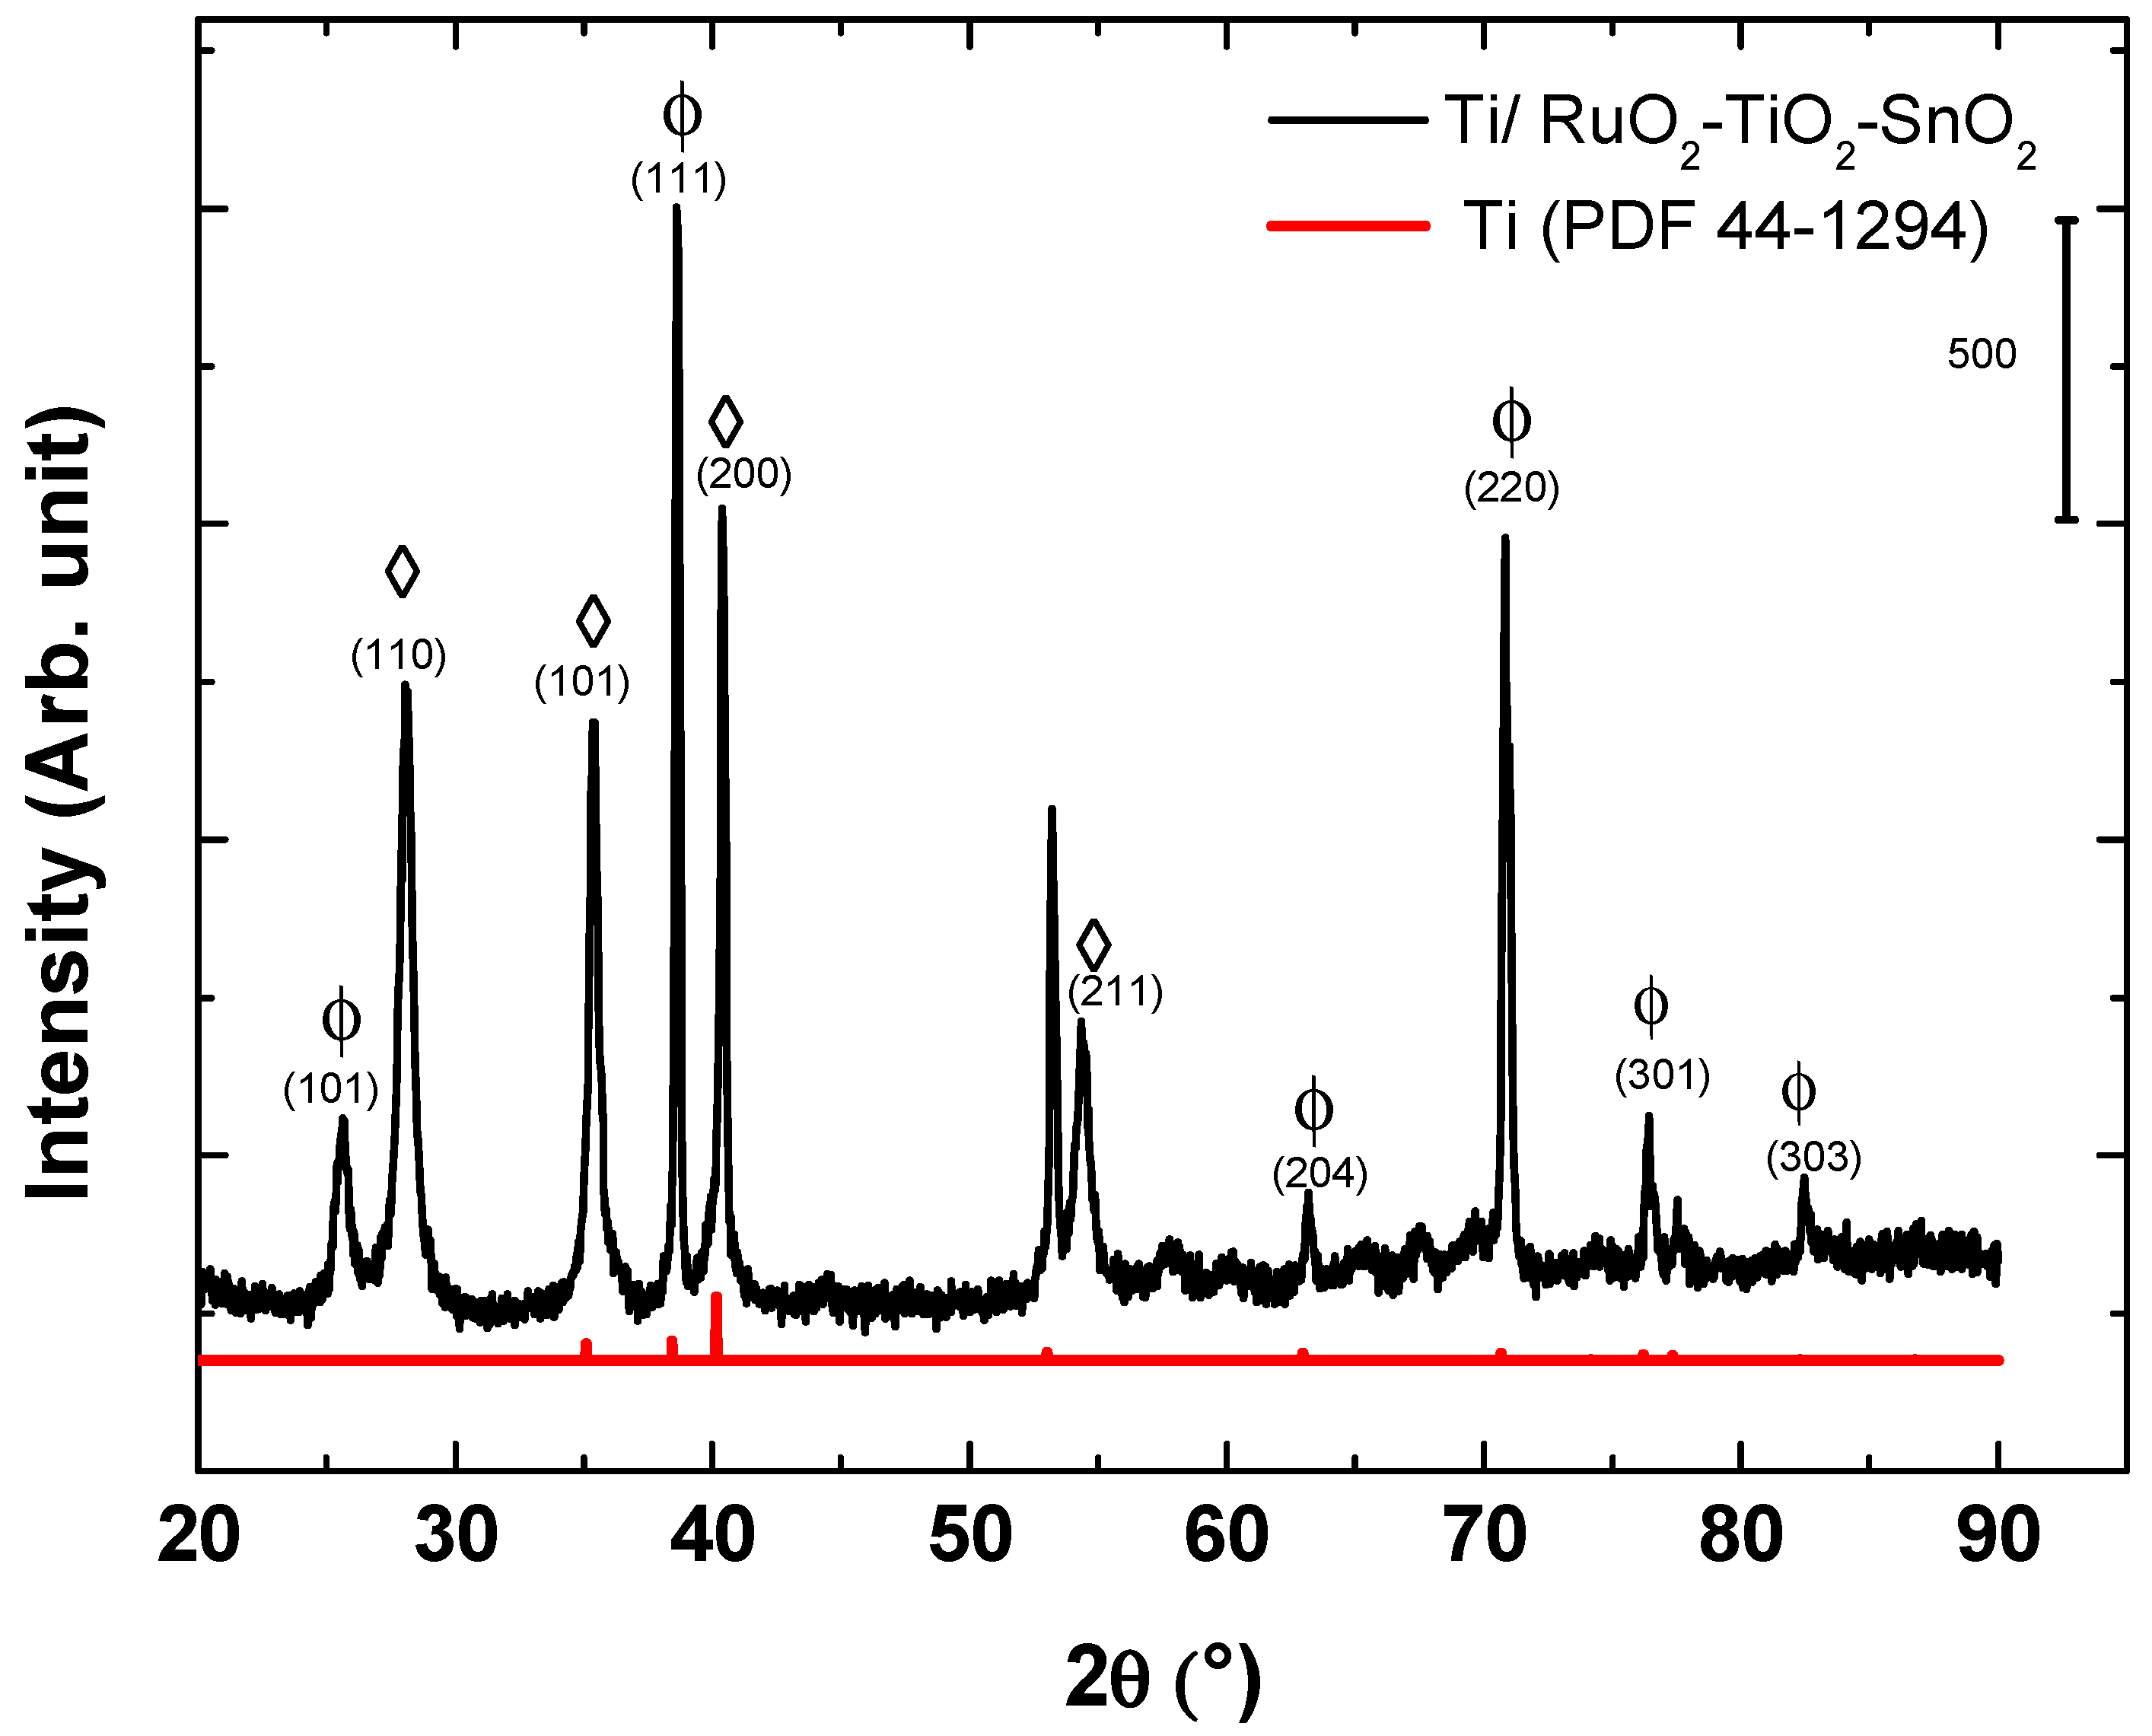
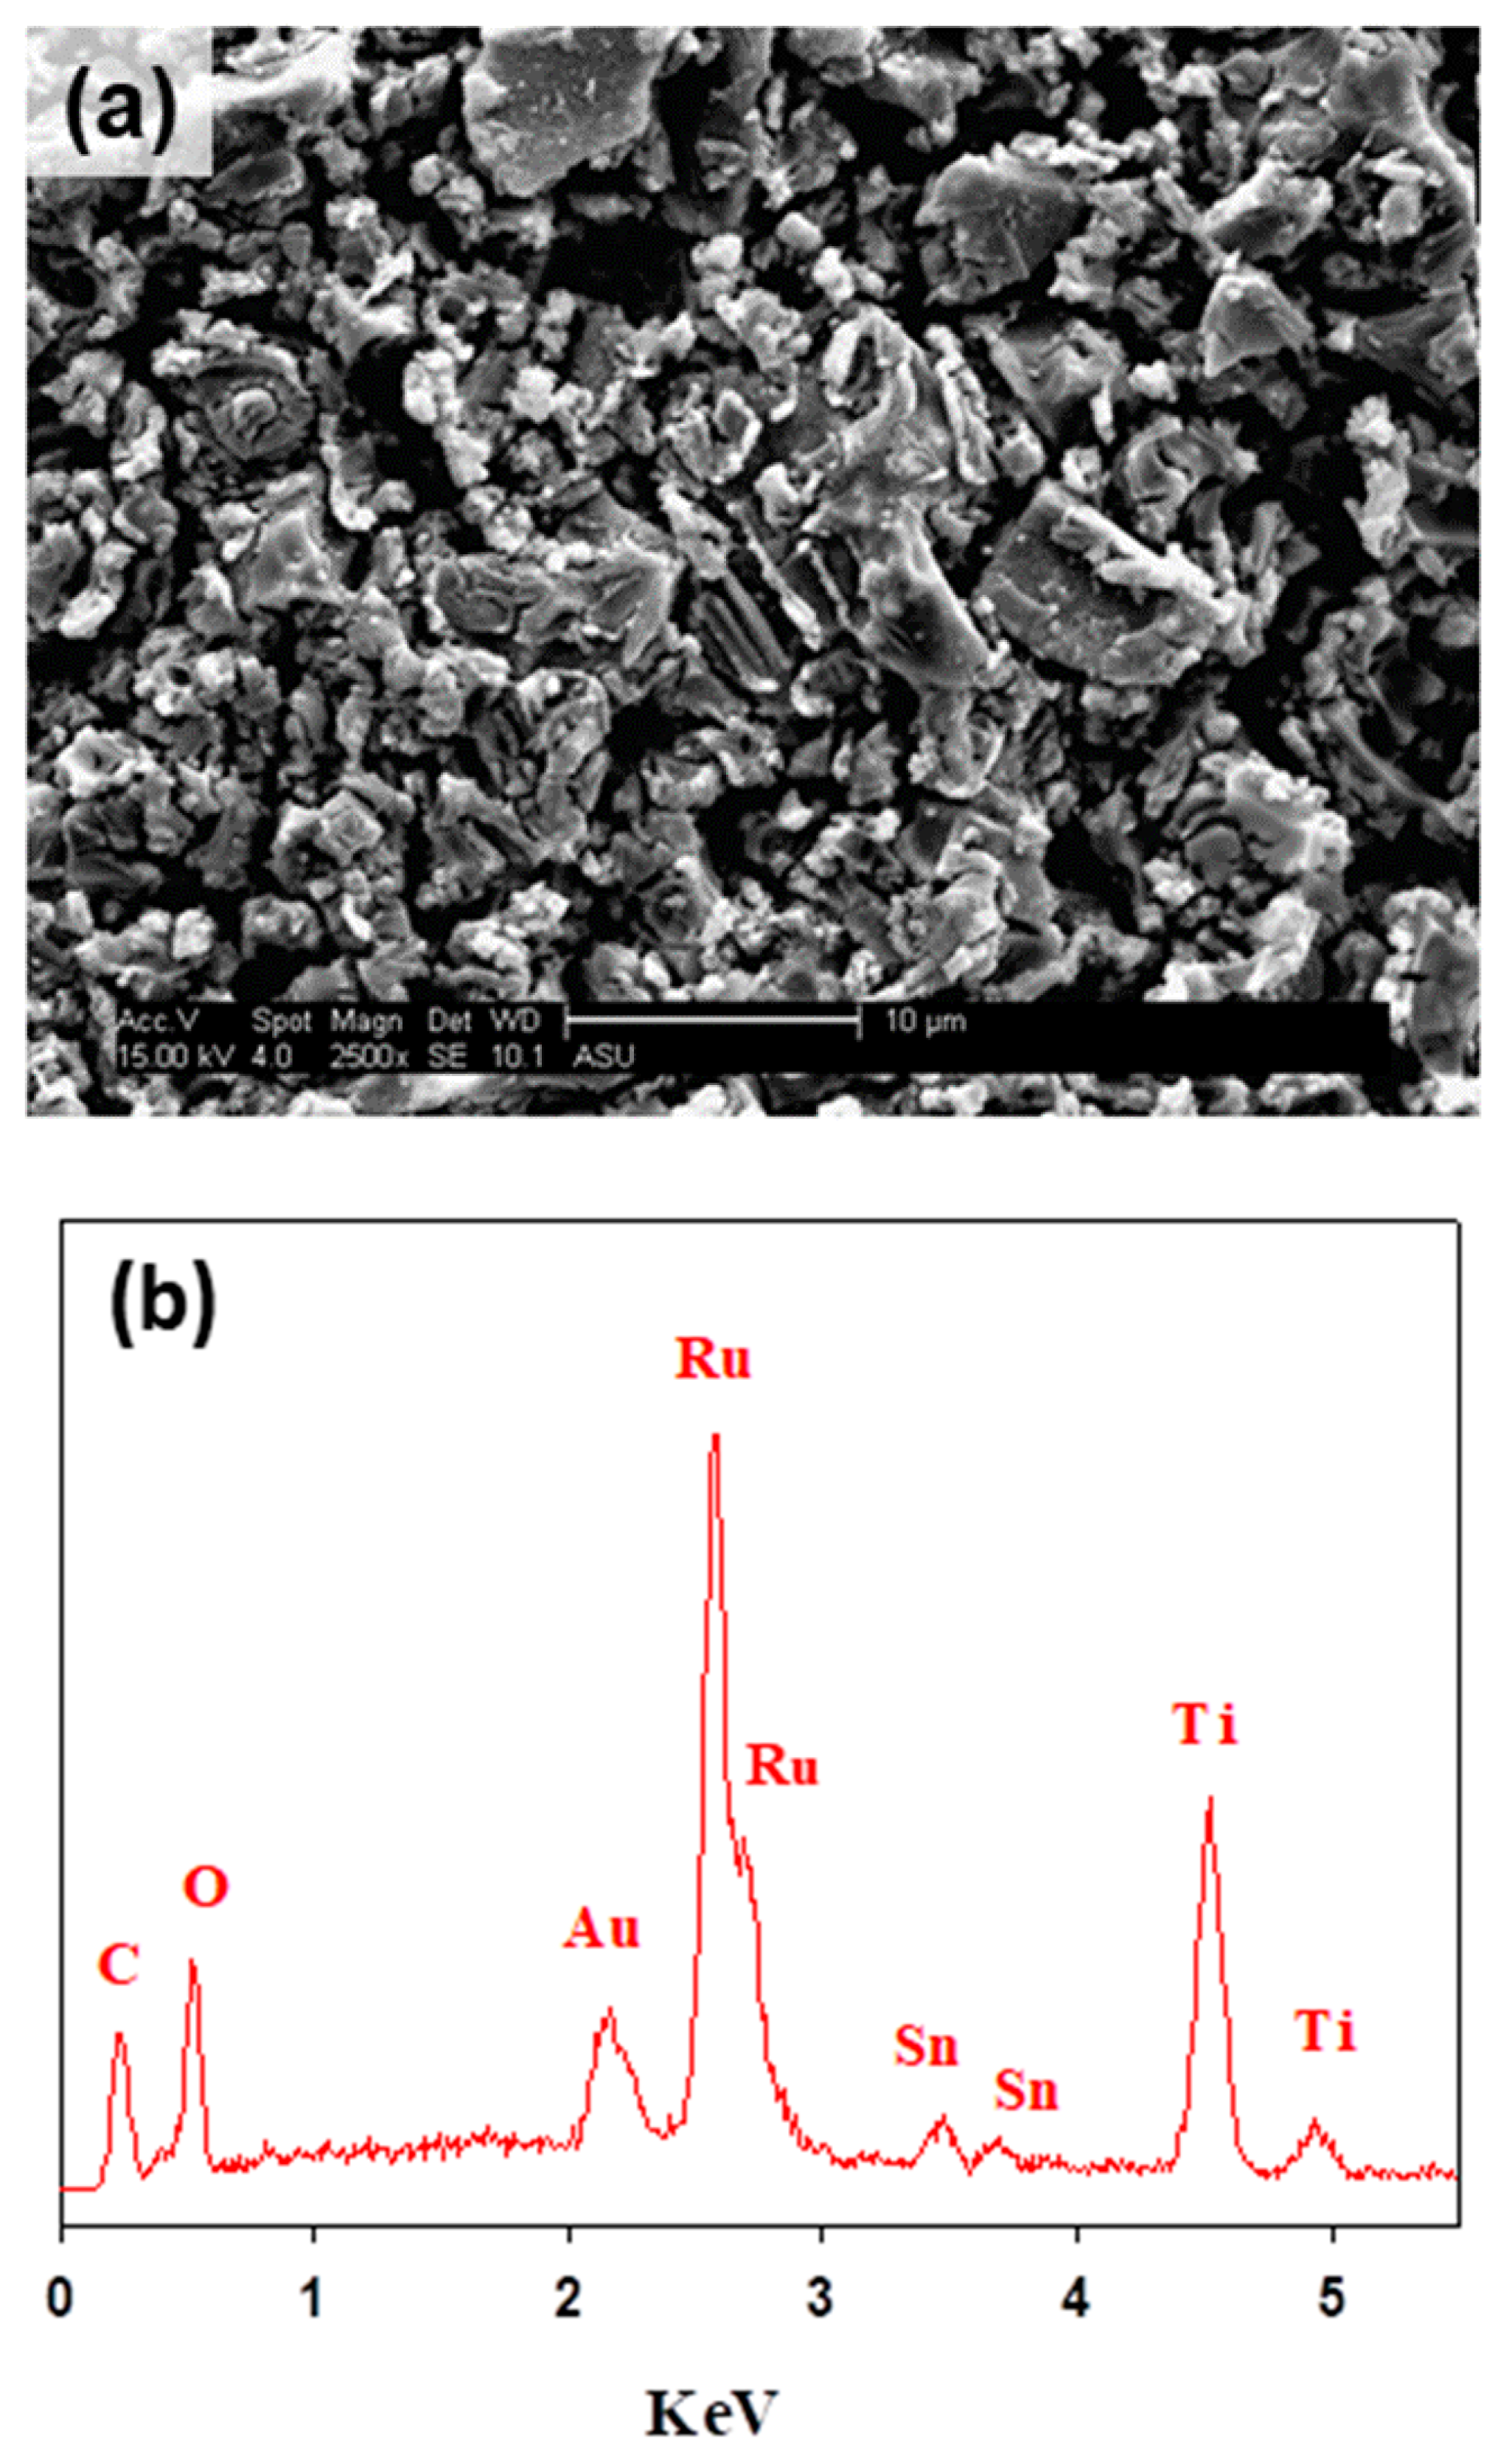
3.1. Physicochemical Characterizations of Ti/RuO2-TiO2-SnO2
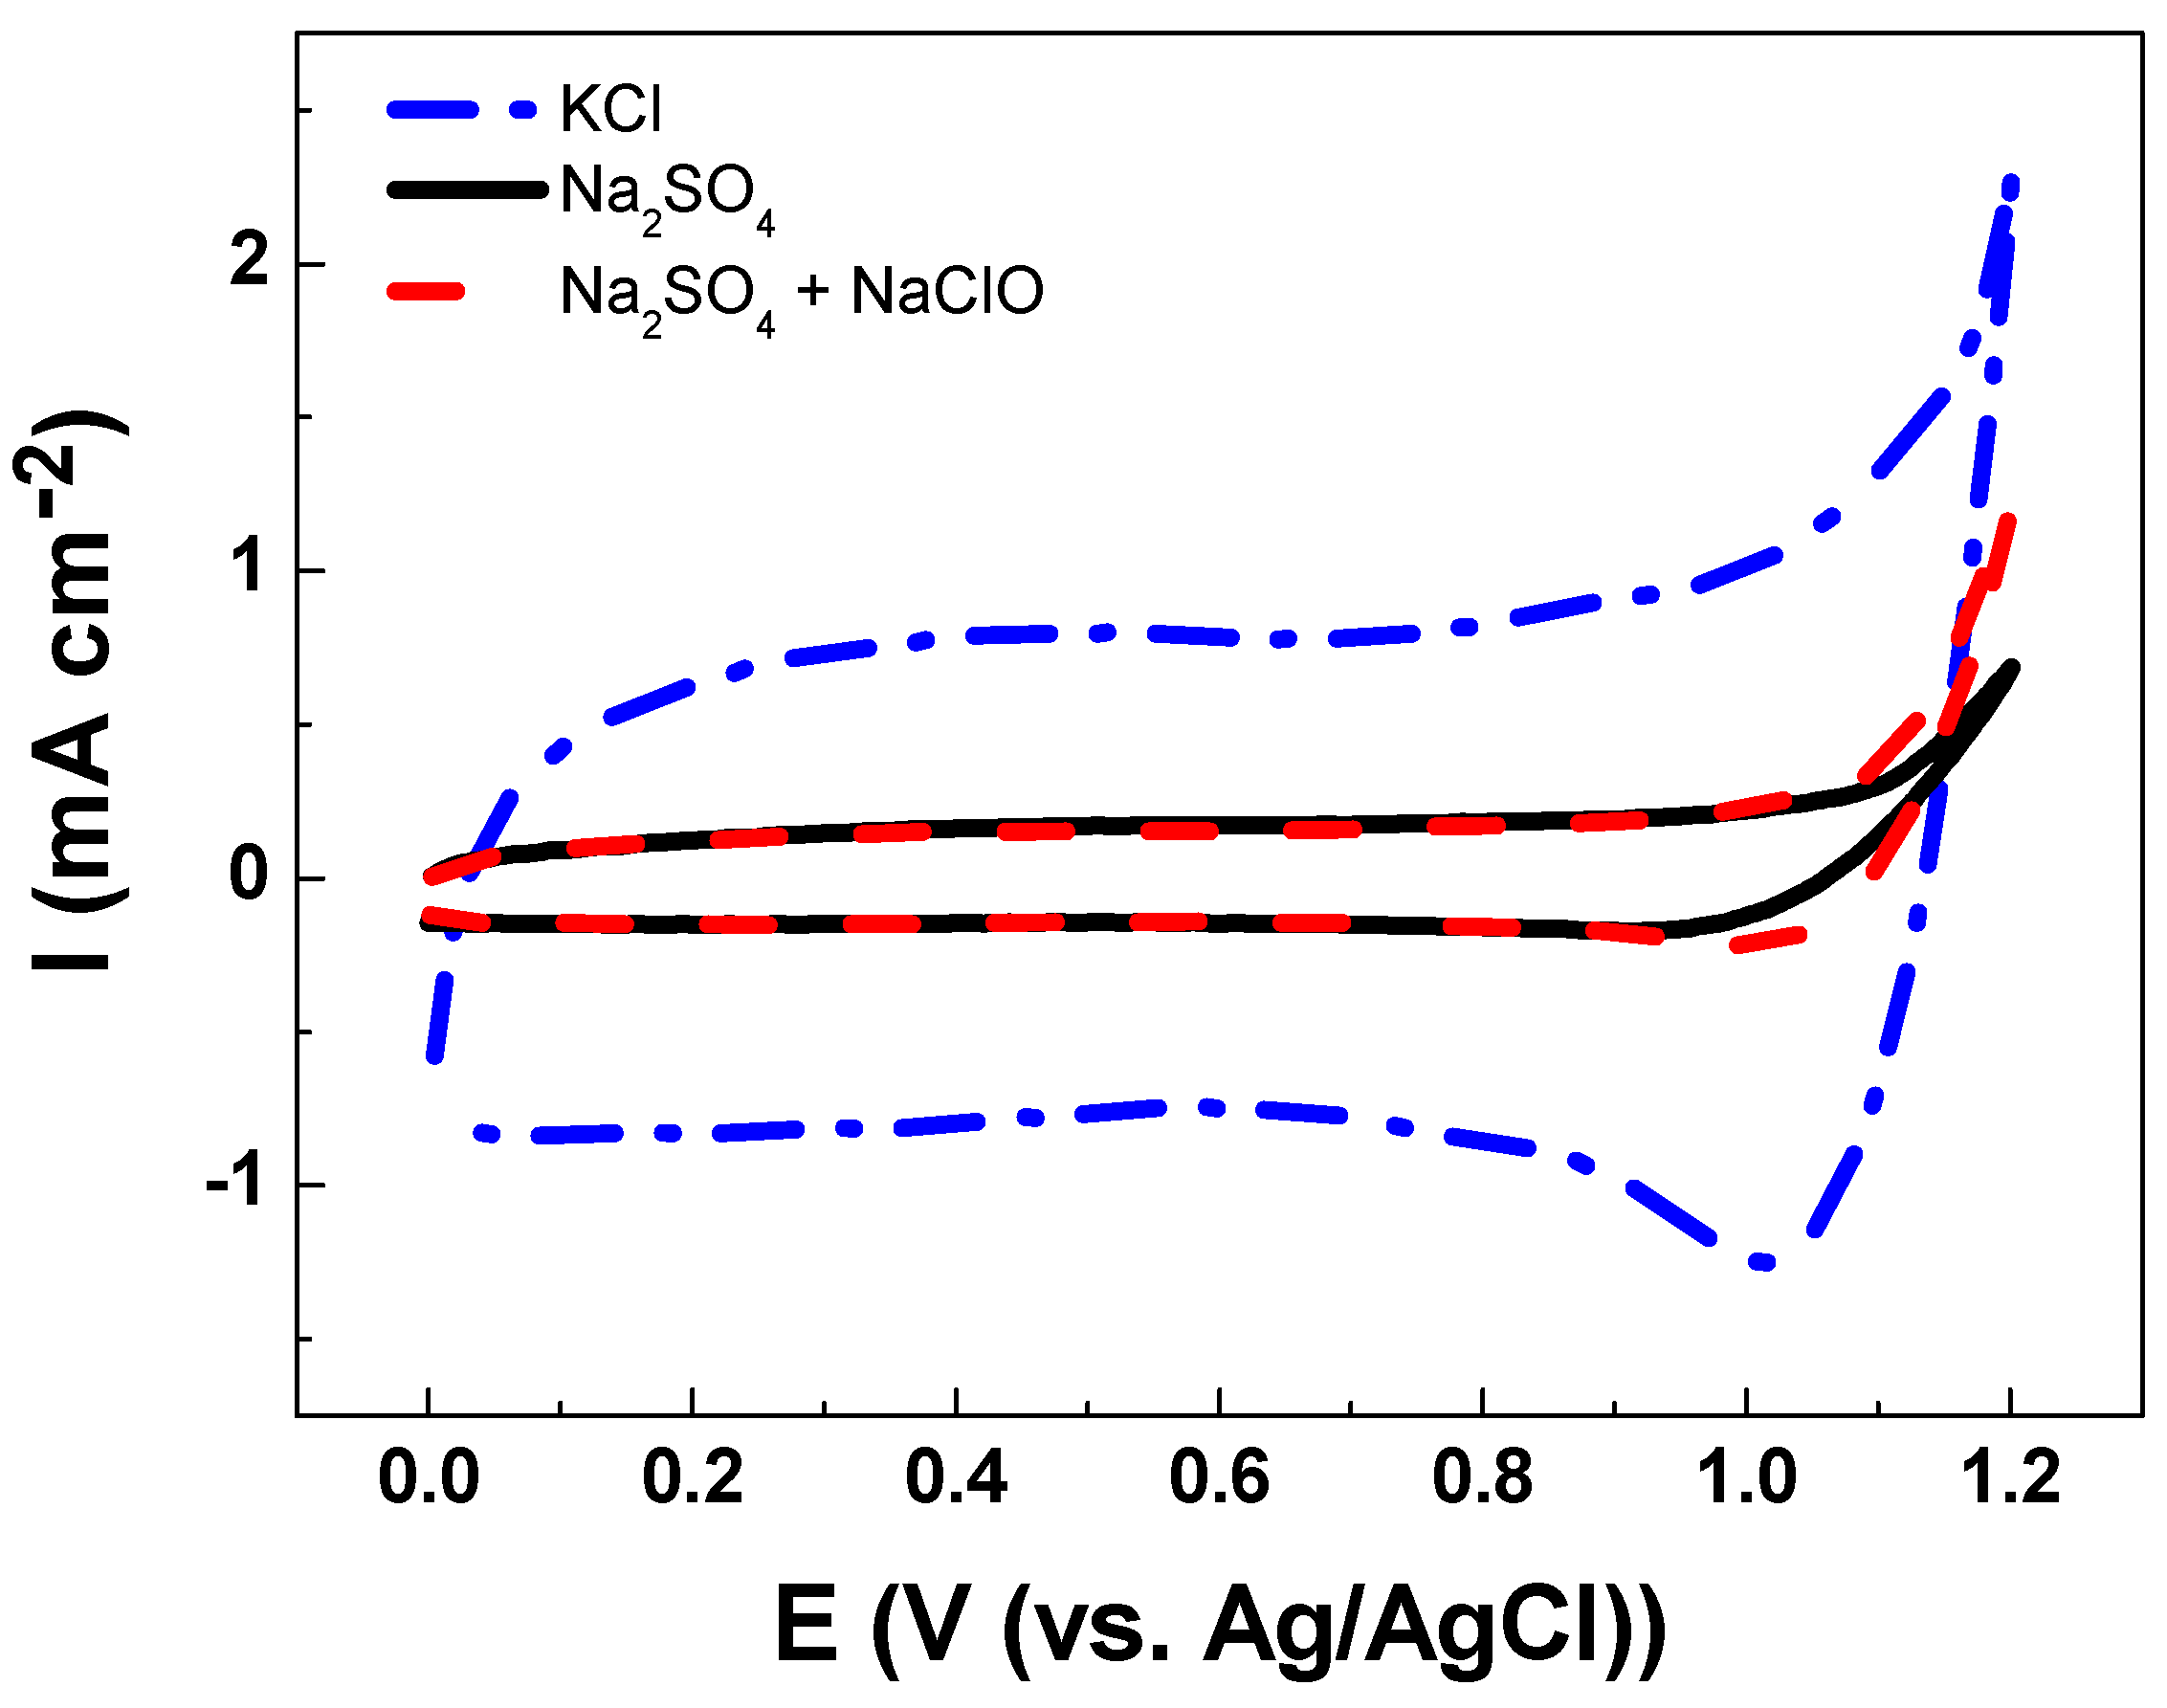
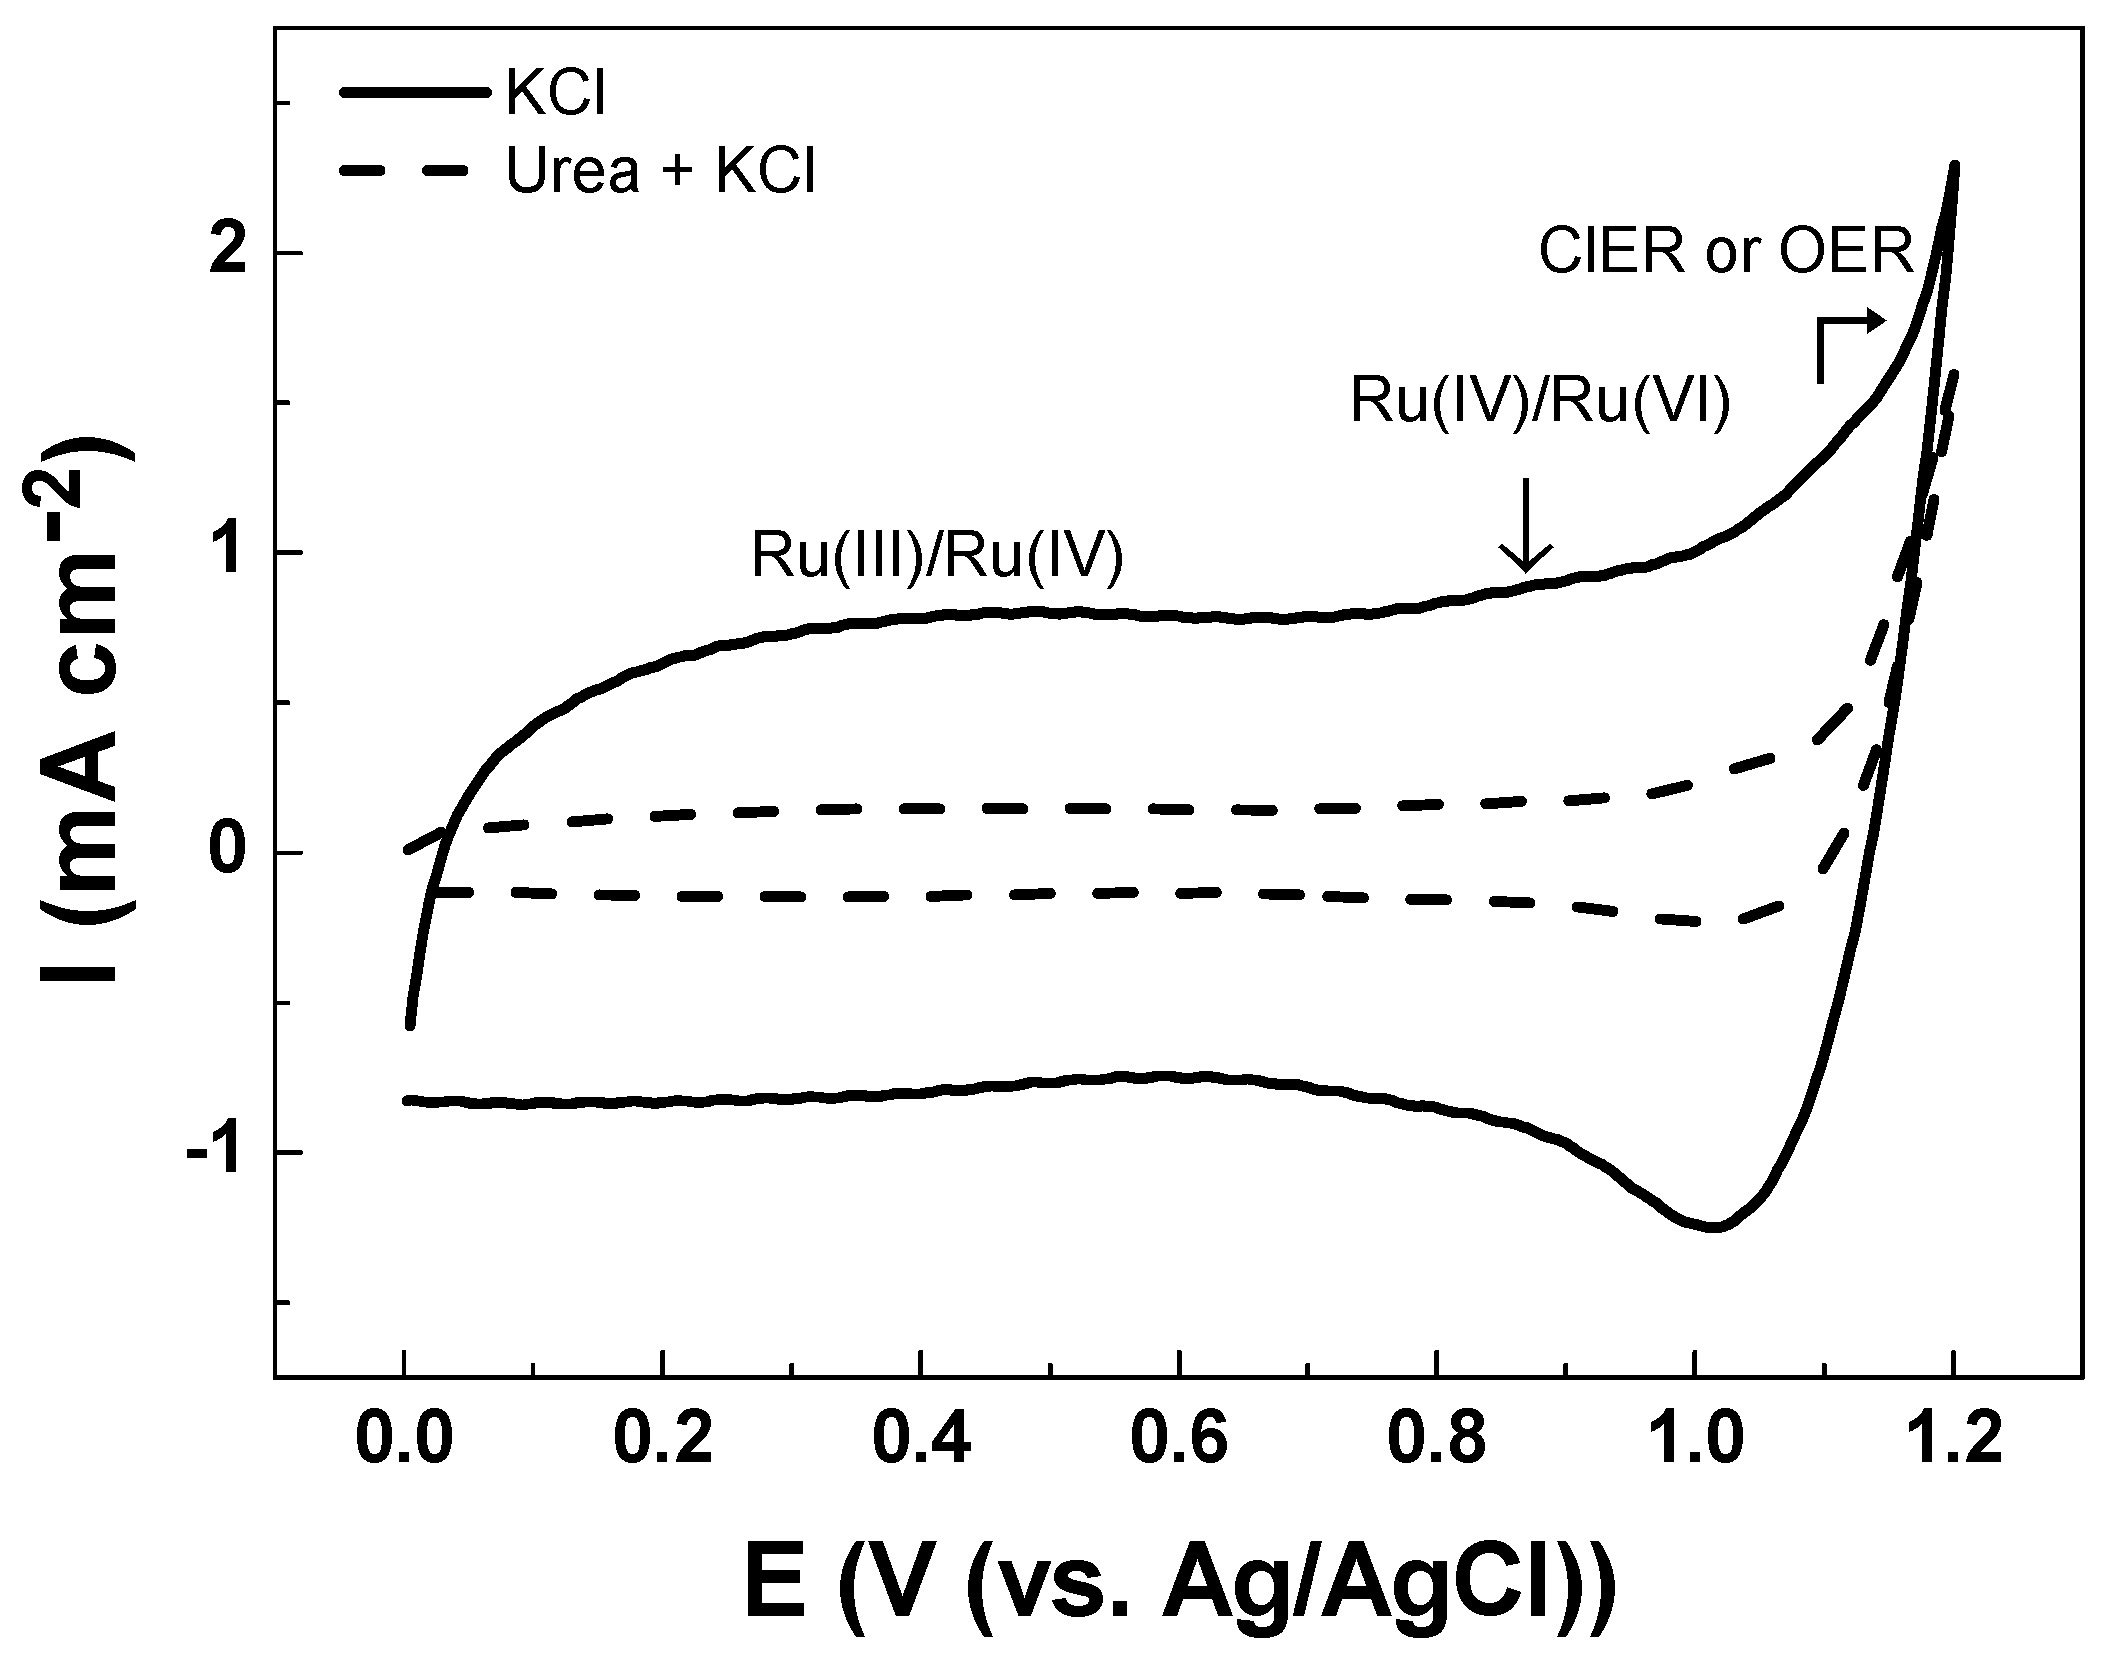
3.2. Electrochemical Characterizations
4. Conclusions
Author Contributions
Funding
Institutional Review Board Statement
Informed Consent Statement
Data Availability Statement
Conflicts of Interest
References
- Erfkamp, J.; Guenther, M.; Gerlach, G. Enzyme-Functionalized piezoresistive hydrogel biosensors for the detection of urea. Sensors 2019, 19, 2858. [Google Scholar] [CrossRef]
- Li, L.; Long, Y.; Gao, J.-M.; Song, K.; Yang, G. Label-free and pH-sensitive colorimetric materials for the sensing of urea. Nanoscale 2016, 8, 4458–4462. [Google Scholar] [CrossRef]
- Fiorillo, A.S.; Tiriolo, R.; Pullano, S.A. Absorption of Urea Into Zeolite Layer Integrated With Microelectronic Circuits. IEEE Trans. Nanotechnol. 2014, 14, 214–217. [Google Scholar] [CrossRef]
- Pundir, C.; Jakhar, S.; Narwal, V. Determination of urea with special emphasis on biosensors: A review. Biosens. Bioelectron. 2018, 123, 36–50. [Google Scholar] [CrossRef] [PubMed]
- Rahmanian, R.; Mozaffari, S.A.; Abedi, M. Disposable urea biosensor based on nanoporous ZnO film fabricated from omissible polymeric substrate. Mater. Sci. Eng. C 2015, 57, 387–396. [Google Scholar] [CrossRef]
- Hilding-Ohlsson, A.; Fauerbach, J.A.; Sacco, N.J.; Bonetto, M.C.; Corton, E. Voltamperometric Discrimination of Urea and Melamine Adulterated Skimmed Milk Powder. Sensors 2012, 12, 12220–12234. [Google Scholar] [CrossRef] [PubMed]
- Manjakkal, L.; Szwagierczak, D.; Dahiya, R. Metal oxides based electrochemical pH sensors: Current progress and future perspectives. Prog. Mater. Sci. 2020, 109, 100635. [Google Scholar] [CrossRef]
- Li, S.; Simonian, A.; Chin, B.A. Sensors for Agriculture and the Food Industry. Electrochem. Soc. Interface 2010, 19, 41–46. [Google Scholar] [CrossRef]
- Zhuiykov, S. Solid-state sensors monitoring parameters of water quality for the next generation of wireless sensor networks. Sens. Actuators B Chem. 2012, 161, 1–20. [Google Scholar] [CrossRef]
- Grgur, B.N. Electrochemical Oxidation of Bromides on DSA/RuO2Anode in the Semi-Industrial Batch Reactor for On-Site Water Disinfection. J. Electrochem. Soc. 2019, 166, E50–E61. [Google Scholar] [CrossRef]
- Wang, L.; Morison, K. Implementation of online security assessment. IEEE Power Energy Mag. 2006, 4, 46–59. [Google Scholar] [CrossRef]
- Nakamura, K.C.; Guimarães, L.S.; Magdalena, A.G.; Angelo, A.C.D.; De Andrade, A.R.; Garcia-Segura, S.; Pipi, A.R. Electrochemically-driven mineralization of Reactive Blue 4 cotton dye: On the role of in situ generated oxidants. J. Electroanal. Chem. 2019, 840, 415–422. [Google Scholar] [CrossRef]
- Garcia-Segura, S.; Nienhauser, A.B.; Fajardo, A.S.; Bansal, R.; Coonrod, C.L.; Fortner, J.D.; Marcos-Hernández, M.; Rogers, T.; Villagran, D.; Wong, M.S.; et al. Disparities between experimental and environmental conditions: Research steps toward making electrochemical water treatment a reality. Curr. Opin. Electrochem. 2020, 22, 9–16. [Google Scholar] [CrossRef]
- Trasatti, S. Electrocatalysis in the anodic evolution of oxygen and chlorine. Electrochimica Acta 1984, 29, 1503–1512. [Google Scholar] [CrossRef]
- Trieu, V.; Schley, B.; Natter, H.; Kintrup, J.; Bulan, A.; Hempelmann, R. RuO2-based anodes with tailored surface morphology for improved chlorine electro-activity. Electrochimica Acta 2012, 78, 188–194. [Google Scholar] [CrossRef]
- Papulova, G.N.; Kvasnikov, M.Y. Water-Soluble Urea-Formaldehyde Oligomers in Paint for Single-Firing Decoration of Ceramic. Glas. Ceram. 2020, 77, 116–118. [Google Scholar] [CrossRef]
- Kapałka, A.; Katsaounis, A.; Michels, N.-L.; Leonidova, A.; Souentie, S.; Comninellis, C.; Udert, K.M. Ammonia oxidation to nitrogen mediated by electrogenerated active chlorine on Ti/PtOx-IrO2. Electrochem. Commun. 2010, 12, 1203–1205. [Google Scholar] [CrossRef]
- Carneiro, J.F.; Silva, J.R.; Rocha, R.S.; Ribeiro, J.; Lanza, M.R.V. Morphological and Electrochemical Characterization of Ti/MxTiySnzO2 (M = Ir or Ru) Electrodes Prepared by the Polymeric Precursor Method. Adv. Chem. Eng. Sci. 2016, 6, 364–378. [Google Scholar] [CrossRef]
- Ribeiro, J.; Alves, P.D.P.; De Andrade, A.R. Effect of the preparation methodology on some physical and electrochemical properties of Ti/IrxSn(1−x)O2 materials. J. Mater. Sci. 2007, 42, 9293–9299. [Google Scholar] [CrossRef]
- Manjakkal, L.; Cvejin, K.; Kulawik, J.; Zaraska, K.; Szwagierczak, D.; Stojanovic, G. Sensing mechanism of RuO2–SnO2 thick film pH sensors studied by potentiometric method and electrochemical impedance spectroscopy. J. Electroanal. Chem. 2015, 759, 82–90. [Google Scholar] [CrossRef]
- Shin, Y.-U.; Yoo, H.-Y.; Kim, S.; Chung, K.-M.; Park, Y.-G.; Hwang, K.-H.; Hong, S.W.; Park, H.; Cho, K.; Lee, J. Sequential Combination of Electro-Fenton and Electrochemical Chlorination Processes for the Treatment of Anaerobically-Digested Food Wastewater. Environ. Sci. Technol. 2017, 51, 10700–10710. [Google Scholar] [CrossRef] [PubMed]
- Neto, S.A.; de Andrade, A. Electrooxidation of glyphosate herbicide at different DSA® compositions: pH, concentration and supporting electrolyte effect. Electrochim. Acta 2009, 54, 2039–2045. [Google Scholar] [CrossRef]
- Lopez-Ojeda, G.C.; Gutierrez-lara, M.R.; Duran-Moreno, A. Efecto del pH sobre la oxidación electroquímica de fenol empleando un ánodo dimensionalmente estable de SnO2-Sb2O5-RuO2. Rev. Mex. Ing. Quím. 2015, 14, 437–452. [Google Scholar]
- Crittenden, J.C.; Trussell, R.R.; Hand, D.W.; Howe, K.J.; Tchobanoglous, G. Water Treatment Principles and Design, 3rd ed.; Wiley: Hoboken, NJ, USA, 2012; pp. 532–542. [Google Scholar]
- Garcia-Segura, S.; Mostafa, E.; Baltruschat, H. Electrogeneration of inorganic chloramines on boron-doped diamond anodes during electrochemical oxidation of ammonium chloride, urea and synthetic urine matrix. Water Res. 2019, 160, 107–117. [Google Scholar] [CrossRef] [PubMed]
- Deroco, P.B.; Vicentini, F.C.; Oliveira, G.G.; Rocha-Filho, R.C.; Fatibello-Filho, O. Square-wave voltammetric determination of hydroxychloroquine in pharmaceutical and synthetic urine samples using a cathodically pretreated boron-doped diamond electrode. J. Electroanal. Chem. 2014, 719, 19–23. [Google Scholar] [CrossRef]
- Laube, N.; Mohr, B.; Hesse, A. Laser-probe-based investigation of the evolution of particle size distributions of calcium oxalate particles formed in artificial urines. J. Cryst. Growth 2001, 233, 367–374. [Google Scholar] [CrossRef]
- Dbira, S.; Bensalah, N.; Cañizares, P.; Rodrigo, M.A.; Bedoui, A. The electrolytic treatment of synthetic urine using DSA electrodes. J. Electroanal. Chem. 2015, 744, 62–68. [Google Scholar] [CrossRef]
- Cullity, B.D. Elements of X-Ray Diffraction, 3rd ed.; Addison-Wesley: San Francisco, CA, USA, 2001; pp. 99–106. [Google Scholar]
- Comninellis, C.; Vercesi, G.P. Characterization of DSA|oxygen evolving electrodes: Choice of a coating. J. Appl. Electrochem. 1991, 21, 335–345. [Google Scholar] [CrossRef]
- Coteiro, R.D.; Teruel, F.S.; Ribeiro, J.; De Andrade, A.R. Effect of solvent on the preparation and characterization of DSA®-type anodes containing RuO2-TiO2-SnO2. J. Braz. Chem. Soc. 2006, 17, 771–779. [Google Scholar] [CrossRef][Green Version]
- Hutchings, R.; Stucki, S. A structural investigation of stabilized oxygen evolution catalysts. J. Mater. Sci. 1984, 19, 3987–3994. [Google Scholar] [CrossRef]
- Srinivasan, N.; Kiruthika, G. Conductivity studies on the substituted stannate pyrochlore system Gd2Sn2-x-yMxAyO7 (M= Ti and A = Ru; x = 0.5, 1.0 and 1.5; y = 0.2) . Solid State Sci. 2019, 96, 105957. [Google Scholar] [CrossRef]
- Kolesnikov, V.A.; Novikov, V.T.; Isaev, M.K.; Alekseeva, T.V.; Kolesnikov, A.V. Investigation of Electrodes with an Active Layer of a Mixture of the Oxides TiO2, RuO2, SnO2. Glas. Ceram. 2018, 75, 148–153. [Google Scholar] [CrossRef]
- Ribeiro, J.; De Andrade, A.R. Characterization of RuO[sub 2]-Ta[sub 2]O[sub 5] Coated Titanium Electrode. J. Electrochem. Soc. 2004, 151, D106–D112. [Google Scholar] [CrossRef]
- Zeradjanin, A.R.; Schilling, T.; Seisel, S.; Bron, M.; Schuhmann, W. Visualization of Chlorine Evolution at Dimensionally Stable Anodes by Means of Scanning Electrochemical Microscopy. Anal. Chem. 2011, 83, 7645–7650. [Google Scholar] [CrossRef] [PubMed]
- Bulska, E. Metrology in Chemistry, 1st ed.; Springer: Cham, Switzerland, 2018; pp. 109–110. [Google Scholar]
- Liu, J.; Moakhar, R.S.; Perumal, A.S.; Roman, H.N.; Mahshid, S.; Wachsmann-Hogiu, S. An AgNP-deposited commercial electrochemistry test strip as a platform for urea detection. Sci. Rep. 2020, 10, 1–11. [Google Scholar] [CrossRef]
- Irzalinda, A.D.; Gunlazuardi, J.; Wibowo, R. Development of a non-enzymatic urea sensor based on a Ni/Au electrode. J. Phys. Conf. Ser. 2020, 1442, 012054. [Google Scholar] [CrossRef]
- Naik, T.S.K.; Saravanan, S.; Saravana, K.N.S.; Pratiush, U.; Ramamurthy, P.C. A non-enzymatic urea sensor based on the nickel sulfide / graphene oxide modified glassy carbon electrode. Mater. Chem. Phys. 2020, 245, 122798. [Google Scholar] [CrossRef]
- Nguyen, N.S.; Das, G.; Yoon, H.H. Nickel/cobalt oxide-decorated 3D graphene nanocomposite electrode for enhanced electrochemical detection of urea. Biosens. Bioelectron. 2016, 77, 372–377. [Google Scholar] [CrossRef]
- Nguyen, N.S.; Yoon, H.H. Nickel oxide-deposited cellulose/CNT composite electrode for non-enzymatic urea detection. Sens. Actuators B Chem. 2016, 236, 304–310. [Google Scholar] [CrossRef]
- Gimeno-García, E.; Andreu, V.; Boluda, R. Heavy metals incidence in the application of inorganic fertilizers and pesticides to rice farming soils. Environ. Pollut. 1996, 92, 19–25. [Google Scholar] [CrossRef]
- Yaseen, D.A.; Scholz, M. Textile dye wastewater characteristics and constituents of synthetic effluents: A critical review. Int. J. Environ. Sci. Technol. 2018, 16, 1193–1226. [Google Scholar] [CrossRef]
- Squissato, A.L.; Richter, E.M.; Munoz, R.A. Voltammetric determination of copper and tert-butylhydroquinone in biodiesel: A rapid quality control protocol. Talanta 2019, 201, 433–440. [Google Scholar] [CrossRef] [PubMed]
- Wilson, R.E.; Stoianov, I.; O’Hare, D. Continuous Chlorine Detection in Drinking Water and a Review of New Detection Methods. Johns. Matthey Technol. Rev. 2019, 63, 103–118. [Google Scholar] [CrossRef]
- Syshchyk, O.; Skryshevsky, V.A.; Soldatkin, O.O.; Soldatkin, A.P. Enzyme biosensor systems based on porous silicon photoluminescence for detection of glucose, urea and heavy metals. Biosens. Bioelectron. 2015, 66, 89–94. [Google Scholar] [CrossRef] [PubMed]
- Lee, S.; Lee, W. Determination of Heavy Metal Inos Using Conductometric Biosensor Based on Sol-Gel Immobilized Urease. Bull. Korean Chem. Soc. 2002, 23, 1169–1172. [Google Scholar] [CrossRef][Green Version]


| D (nm) | |||||||||
|---|---|---|---|---|---|---|---|---|---|
| (101) | (110) | (200) | (211) | (111) | (204) | (220) | (301) | (303) | |
| Solid solution | 20 | 15 | 38 | 17. | - | - | - | - | - |
| TiO2 phase | 16 | - | - | - | 44 | 29 | 28 | 26 | 31 |
| Nominal Composition (atom. %) | Experimental Composition (atom. %) | ||
|---|---|---|---|
| Ru | Ti | Sn | |
| Ti/RuO2-TiO2-SnO2 (50:40:10 atom. %) | 45 | 50 | 4.7 |
| Solution | Cathodic Charge Density, qc (mC cm−2) |
|---|---|
| Na2SO4 | 0.0 |
| KCl | 9.4 |
| Na2SO4 with NaClO | 1.0 |
| Urea in KCl | 1.1 |
| Performance Characteristics * | Urea |
|---|---|
| Linear range (mol L−1) | 6.66 × 10⁻⁶ to 3.33 × 10⁻⁴ |
| Intercept | −4.02 ± 0.004 |
| Sensitivity (mA mol L−1) | 9205 ± 0.004 |
| LOQ (mol L−1) | 7.66 × 10⁻⁶ |
| LOD (mol L−1) | 1.83 × 10⁻⁶ |
| R2 | 0.997 |
| Repeatability (RSD for n = 32) | 5.10% |
| Reproducibility (RSD for n = 7) | 1.81% |
| Electrode | Technique * | Linear Range (mol L−1) | LOD (mol L−1) | Ref. |
|---|---|---|---|---|
| AgNP-deposited commercial Au-Pd electrode | CV | 1.66 × 10⁻⁴ to 1.67 × 10⁻³ | 0.141 | [38] |
| Au electrode deposited with Ni | CV | - | 0.033 | [39] |
| Glassy carbon modified with nickel sulfide/graphene oxide | DPV | 9.99 × 10⁻³ to 0.049 | 3.80 × 10⁻³ | [40] |
| 3D graphene/NiCo2O4 | CA | 0.049 to 0.249 | 2.66 × 10⁻³ | [41] |
| NiO/celulose/CNT | CA | 9.99 × 10⁻³ to 1.40 | 3.78 × 10⁻³ | [42] |
| Ti/RuO2-TiO2-SnO2 | LSV | 6.66 × 10⁻⁶ to 3.33 × 10⁻⁴ | 1.83 × 10⁻⁶ | This work |
| Current Signal Variation (%) | |
|---|---|
| Interferents | Interferent: Analyte Ratio 1:1 |
| Ni(II) | −8.2 |
| Zn(II) | +9.7 |
| S(II) | −13.2 |
| Cd(II) | −20.0 |
| Fe(III) | −20.4 |
| Pb(II) | −22.4 |
| Cu(II) | −25.0 |
Publisher’s Note: MDPI stays neutral with regard to jurisdictional claims in published maps and institutional affiliations. |
© 2021 by the authors. Licensee MDPI, Basel, Switzerland. This article is an open access article distributed under the terms and conditions of the Creative Commons Attribution (CC BY) license (https://creativecommons.org/licenses/by/4.0/).
Share and Cite
Vasconcellos, M.d.L.S.; Silva, L.R.G.; Lee, C.-S.; Fajardo, A.S.; Garcia-Segura, S.; Ribeiro, J. Dimensionally Stable Anode Based Sensor for Urea Determination via Linear Sweep Voltammetry. Sensors 2021, 21, 3450. https://doi.org/10.3390/s21103450
Vasconcellos MdLS, Silva LRG, Lee C-S, Fajardo AS, Garcia-Segura S, Ribeiro J. Dimensionally Stable Anode Based Sensor for Urea Determination via Linear Sweep Voltammetry. Sensors. 2021; 21(10):3450. https://doi.org/10.3390/s21103450
Chicago/Turabian StyleVasconcellos, Maria de Lourdes S., Luiz Ricardo G. Silva, Chung-Seop Lee, Ana Sofia Fajardo, Sergi Garcia-Segura, and Josimar Ribeiro. 2021. "Dimensionally Stable Anode Based Sensor for Urea Determination via Linear Sweep Voltammetry" Sensors 21, no. 10: 3450. https://doi.org/10.3390/s21103450
APA StyleVasconcellos, M. d. L. S., Silva, L. R. G., Lee, C.-S., Fajardo, A. S., Garcia-Segura, S., & Ribeiro, J. (2021). Dimensionally Stable Anode Based Sensor for Urea Determination via Linear Sweep Voltammetry. Sensors, 21(10), 3450. https://doi.org/10.3390/s21103450