You are currently viewing a new version of our website. To view the old version click .
Sensors
  • Article
  • Open Access

5 January 2021

An Energy-Efficient and Secure Data Inference Framework for Internet of Health Things: A Pilot Study

,
,
,
,
and
1
School of Science, Edith Cowan University, Joondalup 6027, Australia
2
Department of Computer Engineering, Islamic Azad University Tabriz Branch, Tabriz 5166616471, Iran
3
Department of Computing, Macquarie University, Sydney 2109, Australia
*
Authors to whom correspondence should be addressed.
This article belongs to the Special Issue Smart IoT & PHD (Personal Health Device) Sensors and Emerged Cryptographic Algorithms and Protocols

Abstract

Privacy protection in electronic healthcare applications is an important consideration, due to the sensitive nature of personal health data. Internet of Health Things (IoHT) networks that are used within a healthcare setting have unique challenges and security requirements (integrity, authentication, privacy, and availability) that must also be balanced with the need to maintain efficiency in order to conserve battery power, which can be a significant limitation in IoHT devices and networks. Data are usually transferred without undergoing filtering or optimization, and this traffic can overload sensors and cause rapid battery consumption when interacting with IoHT networks. This poses certain restrictions on the practical implementation of these devices. In order to address these issues, this paper proposes a privacy-preserving two-tier data inference framework solution that conserves battery consumption by inferring the sensed data and reducing data size for transmission, while also protecting sensitive data from leakage to adversaries. The results from experimental evaluations on efficiency and privacy show the validity of the proposed scheme, as well as significant data savings without compromising data transmission accuracy, which contributes to energy efficiency of IoHT sensor devices.

1. Introduction

The release of contact tracing applications in response to the COVID-19 pandemic has highlighted some of the vulnerabilities and potential privacy issues that can be associated with these applications. Private information can be vulnerable to being compromised if communication protocols with weak security are used in such applications, such as Bluetooth, which was used by some health agencies [1]. Smart home environments that are integrated with health applications are becoming increasingly prevalent as more homes are being connected to the Internet of Things (IoT) and Internet of Health Things (IoHT) networks, along with wearable devices. As the demand for these services increase, additional data transactions and network activity will increase the workload of wireless body area networks (WBAN), which consist largely of sensors and smartphones. These devices, such as physiological sensors and monitoring devices, will be affected by an increased demand in performance and battery power. The current capabilities of sensor technologies limit their interaction with IoT networks and are yet to have the intelligence [2] to securely provide data to health networks. Rather, these devices have a more passive function and only provide data at a regular interval or on an on-demand basis due to their hardware size and battery limitations. The use of some devices, such as smartphones, to interact with sensors and wearables makes it possible to overcome some of these limitations by taking advantage of the more powerful resources that are provided by smartphones. Despite this ability to access additional resources from more powerful devices, energy efficiency remains a fundamental requirement in considering IoHT network design, given that a large number of IoHT devices are powered by batteries that have a limited lifespan. In addition, privacy is another requirement for handling health information. Privacy is often defined as having the ability to protect sensitive data, such as personal information. It is expected that, as connectivity to IoHT increases, the volume of traffic and transactions of data requests to sensors in IoHT networks will increase [3]. With the increasing volume of health data being collected and utilized across multiple devices in IoHT networks, user privacy is at greater risk if health data are not securely protected. Because the field of sensor and IoHT device interactions is a novel and emerging area, there remains a scarcity of research that addresses the privacy requirements of sensitive health data within such a context. Securely transferring health data across these networks whilst maintaining user privacy poses a difficult challenge to address.
Novel approaches are needed in order to achieve both energy efficiency and privacy preservation when designing IoHT networks. In this paper, we propose an energy-efficient and secure data inference framework for IoHT applications, e.g., a smart house health care system (as demonstrated in Figure 1), which enables the collected sensitive information from the smart house health care system to be transferred in the encrypted domain while simultaneously reducing the energy consumption. The proposed framework involves two tiers, which consist of the data reduction tier and data protection tier. This two-tier approach is specifically designed for IoHT applications, where privacy in the underlying sensor data is protected by a privacy-preserving workflow. In these applications, the sensor data are first reduced, and the encrypted sensor data are then transmitted to edge servers. At the edge server, differential privacy is used to further protect privacy. In more detail, the first tier infers the data processing of sensors to reduce transactions from sensors to smartphones and IoHT networks. Processed encrypted data from wearable devices will be passed to the second tier. The second tier protects data by Laplace noise enabled differential privacy in order to protect the privacy of each user. Three major contributions to the field can be delineated from this proposal:
Figure 1. Smart home network merged with a healthcare Internet of Health Things (IoHT) network model.
  • Leveraging model driven prediction, encryption, and data points (DP) with edge computing to propose a two-tier privacy-preserving IoHT framework that does not currently exist.
  • Evaluation of the proposed system in terms of efficiency and privacy preservation with up to 98.83% and 95.95% of data savings rate (SR) and accuracy rate (AR), respectively, while maintaining sufficient accuracy that is arbitrarily required by users.
  • Presenting potential application scenarios that would benefit from this solution.
This work is a significant extension of a previously published study [4], which initially outlined the proposed concept. When compared with that study, this paper adds three key differences in terms of the solution, experiment, and motivation applications. Specifically, (1) solution: greater attention has been focused on the first tier of the solution by developing new formulations for AR and SR. (2) Experiment: regarding the new formulation, new experiments have been undertaken with different values of evaluation metrics to calculate the AR and SR. (3) Application: several potential applications of the proposed framework are listed. In view of the energy efficiency and privacy preservation concepts in this framework, a small number of beneficial applications have been examined, including patient monitoring during a pandemic, the battery conservation of personal health devices (PHD), and the use of biometrics for remote identification.
In the remainder of this paper, Section 2 reviews the existing related literature. Section 3 presents, in detail, the two-tier privacy-preserving data inference framework proposal. Section 4 discusses the results of efficiency and security analysis of the proposed system. Section 5 describes possible applications for which the proposed framework could be implemented. Section 6 finishes the paper with some concluding remarks.

3. The Proposed Solution

We propose a privacy-preserving two-tier data inference framework in order to reduce the power consumption of IoHT devices and protect sensitive health data generated by IoHT networks, which has an assumption of low data rates for transmission. The first tier in this framework involves a data inference algorithm that can reduce the number of redundant or low-value transactions to save power consumption; the second tier protects the sensitive data using encryption and differential privacy techniques. Because most battery power consumption occurs with data transmission over radio from sensors to a smart device, which collects sensed data and transfers them to a server in the cloud, the reduction of the frequency of data transmission at the source nodes are crucial in saving and conserving battery power, which is achieved by the inferencing algorithm at the source nodes. Improving accuracy and efficiency at the source node is achieved by improving an inference algorithm, which provides energy efficiency and is critical in contributing to the security of IoHT networks. The proposed two-tier data inference framework provides enhanced accuracy and efficiency when compared to the existing single layer inference algorithm [22].

3.1. The First Tier Data Reduction Using a Data Inference Algorithm

It is unnecessary to consume bandwidth and power resources by sending all available data if there could be a more effective method for reducing the volume of the original data sent. Therefore, in the first tier, it is proposed to use a data inference algorithm, which only decides to transmit data if they are significantly different from previously captured DPs, thus reducing the number of redundant or low-value data transfers [23]. Using this solution, there is a risk of reducing accuracy from the original data and that it may not properly represent data in certain situations, such as in the case of short interval sampling. To reduce these instances, it is proposed to analyze the differences between the original and inferred data and apply regular beacons (DPs, which are transmitted regardless) into the inferred results, such that they are transmitted regularly to roughly reflect the original data and can improve the accuracy when augmented with the inferred DPs. Three aspects are considered to assess the results [22], including: (1) Efficiency Ratio (ER) of saved (reduced) data volume and actual transmitted data, (2) Savings Ratio (SR) of reduced data and sensed data (%), and (3) Accuracy Ratio (AR) of total value of transmitted data and original data (%) [22].
Savings   Rate   SR   = No   of   Sensed   data No   of   Transferred   data Number   of   Sensed   data × 100
Efficiency   Rate   ER =   1 1 SR 100
Accuracy   Rate   AR   = Sum   of   original   DPs   Sum   of   differences   Sum   of   original   DPs × 100
Variance rate (VR) is used for inferring the selection and subsequent transmission of data. It compares the DP with those directly before and afterwards to screen out DPs that are too similar and do not have to be transmitted, i.e., DPs that do not provide new significant information from previous DPs. Different levels of granularity can be applied for VRs, e.g., 1% VR is finer than 10% VR. It can be applied while using the Algorithm 1 below.
Algorithm 1: Variance rate algorithm initialization;
1:
Initialization
2:
if |VcVc1|OR|Vc0Vc| > VcVr then
3:
Vx ← Vc;
4:
else
5:
Vx ← null;
where Vc is current value, Vc0 is previous value, Vc1 is next value, Vx is sampling value, and Vr is variance rate.
When a VR is applied to data, a difference between the graphs of inferred data versus the graph of original data will inevitably arise, as depicted in Figure 2. In this figure, S (Upper) represents the area of this difference or the distorted portion by the inferred values that are less than the original, whilst S (Lower) represents the areas of inferred values that are higher than the original. A larger total area of the gap refers to greater data distortion and, therefore, reducing this gap would imply better accuracy. The formula below depicts the area of upper and lower sides of the inferred graph against the original.
S u = k = 0 n ( n k ) S n ,   w h e r e   S n   =   G   S 1 ,   S 2 ,   ,   S n
Figure 2. Depiction of gaps between original data points (DPs) and inferred DPs to show the accuracy of the calculation [20].
Similarly
S l = k = 0 n n k S n ,   w h e r e   S n   =   Y   S 1 ,   S 2 ,   ,   S n
The total area of the gaps would be presented, as below. A larger value means a ‘coarser’ and higher VR inference has been used relative to a smaller total area, which means that a ‘finer’ and lower VR value has been applied.
The larger the difference ( S d = | S u S l |), the further the result is from the average and, hence, from the original trend. However, it is important to note that a smaller difference does not necessarily mean that it represents the original data graph properly—it could, however, be an indicator of how accurate the inference is to the original, along with the gaps instead. For example, a small S value as well as a small S d suggests that it is likely to be closer to the original. These figures in conjunction (i.e., S and S d ) can be used to determine how accurate each inference is, whilst the savings or the reduction of DP indicate the efficiency.
S =   S u +     S l
The following formulations can represent the accuracy rate and savings rate:
A R =   o r i g i n a l   D P s   S d o r i g i n a l   D P s   ×   100 %
S R =   D P s N D P s D P s   ×   100 %
where DPs are the number of sensed data points and N (DPs) is the number of DPs after inference.
When S = 0, it would suggest that the inference represents the original data perfectly with no distortion, whilst a S d = 0 suggests that the inference represents the mean value of the graph, despite not perfectly representing the original. Figure 2 depicts the upper and lower gaps after inferencing has been applied. The reduction of DPs is a consequence of sampling in statistical inference systems, which leads to data size reduction. However, when increasing the VR results in increased savings, there should be a threshold to ensure accuracy of the result. Privacy preservation is increasingly being recognized as a serious concern for IoHT networks where healthcare data are shared, processed, and transferred. The degree of privacy preservation in inference systems would be described in what extent that inferred data are different from the original data. The sampled data will then be encrypted while using symmetric key encryption (SKE), or attribute-based encryption (ABE). As an explanation, ABE is a public key encryption (PKE) technique [24]. The encrypted data are then passed to the second tier.

3.2. The Second Tier Data Protection with Differential Privacy

The second tier concerns the protection of sensitive health data that were created by the IoHT network in the first tier. In order to protect the privacy of sensitive data in the dataset, removing identifying and personal information, such as the user’s name, ID, and phone number, is insufficient, because the remaining data reveal identities in the dataset. Differential privacy is a technique that ensures protection against attackers to infer private information [25]. In the differential privacy algorithms, a randomized function adds a random noise to the true answer in order to produce a response to a query [26].

Definition of Differential Privacy

Let D and D’ be two neighbouring datasets and M a randomized function. M provides E-differential privacy for all sets of O ⊆ Range (M), if it satisfies the following:
Pr   M D   O   Pr   M D   O exp ϵ
It is said that algorithm M provides E-differential privacy protection. It can be seen from the definition of differential privacy that the E is used in order to control the probability ratio of the algorithm M to obtain the same output on two adjacent data sets. It reflects the level of privacy protection that M can provide. In practical applications, E usually takes a small value, such as 0.01, 0.1, or 1n 2, 1n 3. The value of E should be combined with specific requirements to achieve a balance of safety and the availability of output results. Differential privacy protection can be achieved by adding an appropriate amount of interference noise to the return value of the query function. Adding too much noise will affect the usability of the result, while too little cannot provide sufficient security. Sensitivity is a key parameter that determines the amount of noise that is added. It refers to the largest change to the query result that is caused by adding or deleting any record in the data set.
For f :   D R d , the L1-sensitivity of f is
Δ f = max D 1 ,   D 2 | | f D 1 f D 2 | |   1
for all D 1 , D 2 differing in one element at most.
The sensitivity of a function is determined by the function itself, and different functions will have different sensitivities. For functions with lower sensitivity, sufficient privacy protection can be achieved with the addition of only a small amount of noise. However, for some sensitive functions (such as the median function), it is required to add a lot of noise in order to achieve the same level of protection.
Laplace Mechanism and Exponential Mechanism are the most common implementation mechanisms. Probability Density Function (PDF) for a random variable with Laplace distribution is defined, as follows:
L a p l a c e x |   µ , b = 1 2 b e x p ( x µ b )
Let b = Δ f ϵ where f is the query function. Then, we have
L a p l a c e x |   µ ,   ϵ ,   Δ f = ϵ 2 Δ f e x p ( ϵ x µ Δ f )

4. Results and Analysis

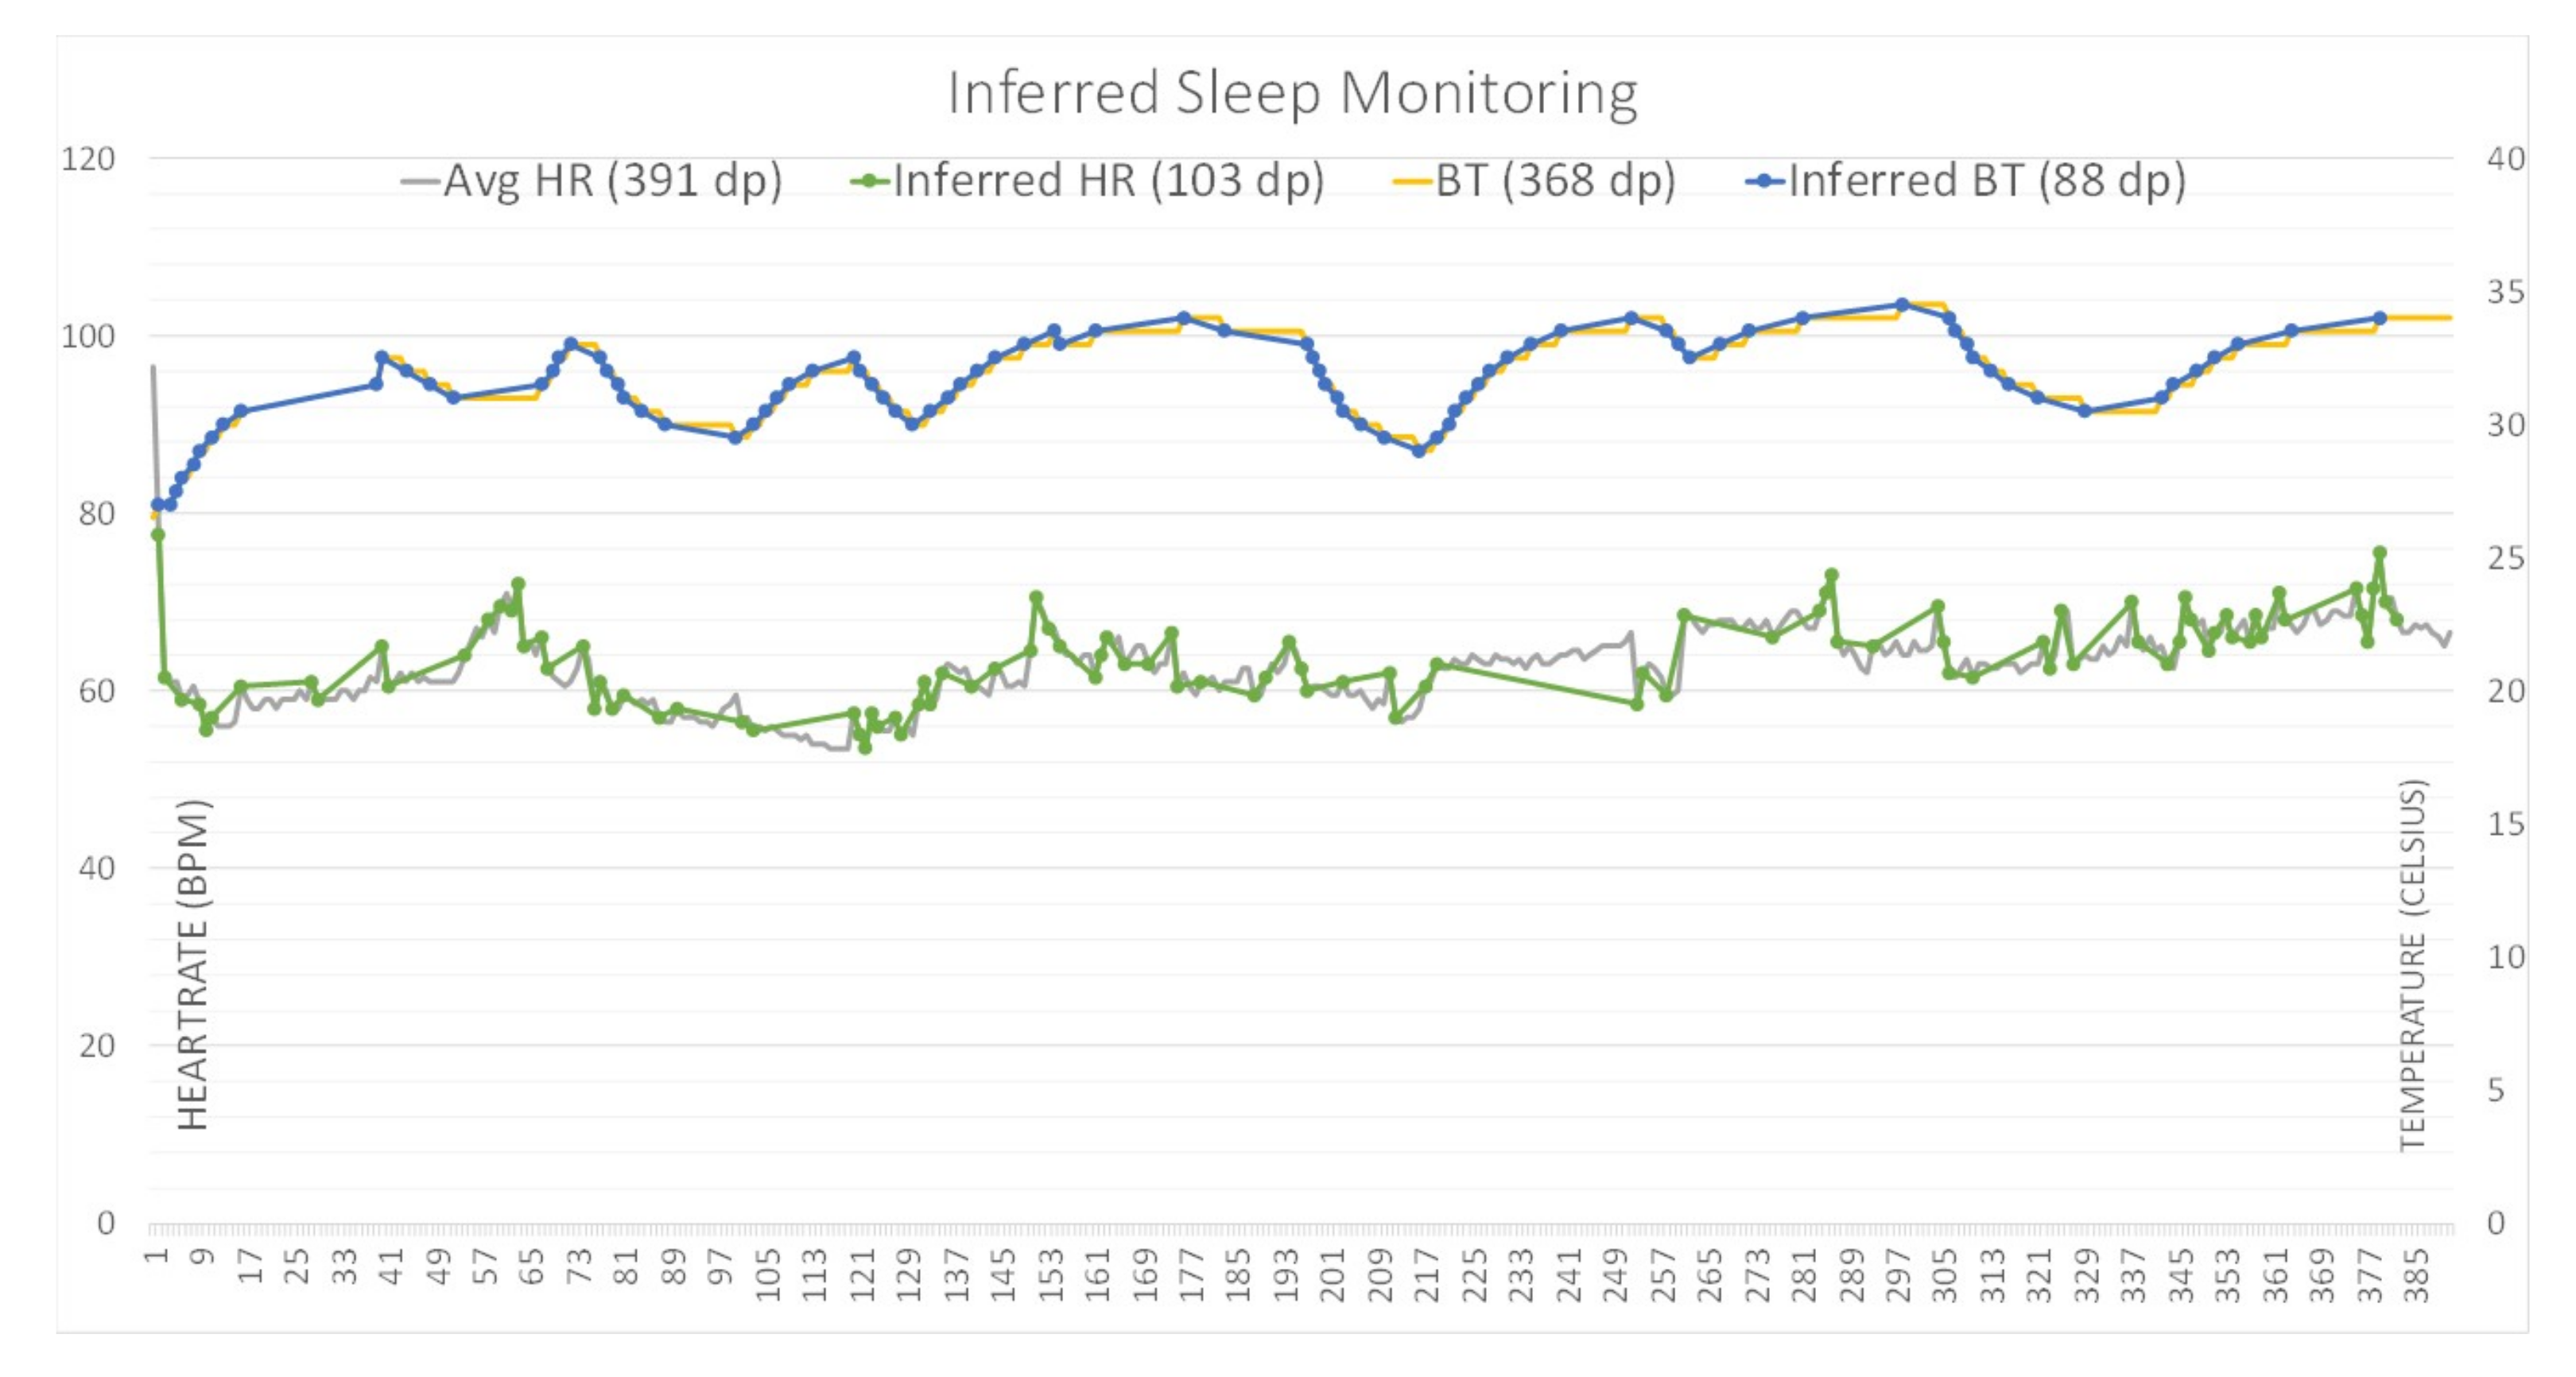
4.1. Efficiency and Accuracy Evaluation

The approach that is used for evaluation has heart rate (HR) samples, whilst other variables could also be used, such as skin temperature, blood pressure, respiration rate, and indicators of specific diseases, such as diabetes, plethora signals, etc. Because the aim of this experiment is to investigate and evaluate health data efficiency and accuracy, the algorithm created is focused on HR data, which can respond relatively quickly to the user’s activity and time. Body temperature hardly varies or fluctuates in response to changes as the human body automatically maintains its value within a tight range, as shown in Figure 3. Therefore, HR data were primarily measured and used in the experiment.
Figure 3. Inferred heart rate (HR) and body temperature (BT) of sleep monitoring data (based on sampled by minutes)–inferred BT data represents the original well whilst inferred HR data shows relatively more gaps (this could be improved by using beacon data sampling).
Fine and coarse inference algorithms were applied to show the differences and efficiency of each of these cases. Dataset [22] was used for HR and BT with Matlab R2019b for the inference algorithm.
The evaluation results are displayed in Figure 3 and they depict body temperature (BT) and heart rate (HR) sensed on a per-minute basis. In applying a 1% and 2.5% inference rate to BT and HR data, respectively, the volume of data to be transferred was reduced by 76% for BT and 73% for HR.
BT inference shows better results, representing almost identical data as opposed to HR. In other words, whilst the data savings rates are similar for both BT and HR, the accuracy of inference in both types of data were very different and they could be reflective of the inherent differences in what these data are measuring. Distortion of the original data can occur when an inference system disregards data to transmit if it does not vary sufficiently from previous or adjacent DPs, i.e., does not meet a stated VR threshold and is, therefore, determined to be of little significance and considered as unnecessary for transmission. This distortion is especially so for data that are measured at shorter intervals, as the data could be trending over a longer term, but simply due to the shorter frequency of data measurements, do not have time to vary significantly between each subsequent data measurement. This limitation was discussed in detail earlier in Section 3, along with a potential solution, which is to add DPs that function as beacons. These beacons transmit data at set intervals, regardless of whether they meet the VR threshold criteria and, therefore, helps to maintain the accuracy of the overall inference data without heavily compromising on data savings. In these experiments, beacon DPs were set to minute intervals. A finer inference VR threshold can provide greater accuracy; however, it results in lesser transmission savings and decreases the overall efficiency rate from the perspective of data transmission. Certain situations may simply require a general idea of the trend, rather than valuing exact or accurate figures—in these cases, a coarser inference VR method could be used instead, which places greater priority on data saving. The exact interval of beacon DPs would depend on the context and solution or application requirements for which this inference is being implemented.
The evaluation of efficiency and accuracy of the proposed inference system has been extended while using series 1 and series 2 of the heart rate time series dataset [27]. Each series contains 1800 evenly spaced measurements of the instantaneous heart rate from a single subject. The extension of the experiments has been done in nine cases, as follows:
Case 1: the processing method of case 1 on the original data set is to remove the same DPs in the data set. For example, when the three adjacent DPs and their corresponding value are DP1 = 84.7, DP2 = 84.7, DP3 = 84.7, only DP1 will be retained, while DP2 and DP3 will be discarded.
The original data set has 1800 DPs, as shown in Table 1. After removing consecutive similar points, the data set is left with 1716 DPs i.e., 1800 − 1716 = 84 points are reduced. When using the method of removing the same data for inference, according to the Equations (4) and (5), SR = (84/1800) × 100% = 4.67%; at the same time, AR = 99.74%.
Table 1. Efficiency and accuracy evaluation for different cases.
Case 2: it takes part of the data from the original data set as an output by time sampling. The sampling rate of the original data set used in this experiment was 0.5 s. When executing case 2, we set to extract one data point from the original data every 30 s as the output. That is, the (30 × N)/0.5, (N = 1, 2, 3, 4,...) points of the original data were used.
The original data set has 1800 DPs, as can be seen in Table 1. After sampling at 30 s intervals, there were 31 DPs left in the data set, which means a reduction of 1800 − 31 = 1769 points. According to Equations (4) and (5), SR = (1769/1800) × 100% = 98.27%; at the same time, AR = 96.26%.
Case 3: in the same vein, case 3 takes part of the data from the original data set as an output by time sampling. The sampling rate of the original data set in this experiment was 0.5 s. However, in this case, we set to extract one data point from the original data every 60 s as the output. That is, the (60 × N)/0.5, (N = 1, 2, 3, 4,...) points of the original data were used as the output.
The original data set has 1800 DPs, as shown in Table 1. After sampling at 60 s intervals, there were 16 DPs left in the data set, which means a reduction of 1800 − 16 = 1784 points. Using Equations (4) and (5), SR is equal to 99.11% and AR is equal to 95.73%.
Case 4: in case 4, the sampling rate of the original data set was again 0.5 s. However, one data point was extracted from the original data every 120 s. Therefore, the (120 × N)/0.5, (N = 1, 2, 3, 4,...) points of the original data were used.
The original data set has 1800 DPs, as shown in Table 1. After sampling at 120 s intervals, there were nine DPs left in the data set, which means a reduction of 1800 − 9 = 1791 points
According to the Equations (4) and (5), SR is equal to 99.50% and AR is equal to 94.18%.
Case 5: similar to previous cases, the sampling rate was 0.5 s in this case. One data point is extracted from the original data every 180 s while using (180 × N)/0.5, (N = 1, 2, 3, 4,...) points of the original data.
After sampling at 180 s intervals, there were six DPs left in the data set (as shown in Table 1), which means a reduction of 1800 − 6 = 1794 points. SR and AR can be calculated by Equations (4) and (5). According these formulations, SR = (1794/1800) × 100% = 99.66% and AR = 94.21%.
Case 6: in case 6, the first step was to obtain intermediate data 1 using VR inference with VR = 2%. The second step was to obtain the intermediate data set 2 after sampling with a sampling interval of 60 s. The third step was to merge the intermediate data set 1 and the intermediate data set 2 in order to obtain the final output.
The original data set has 1800 DPs, according to the Table 1. After the inference of VR = 2% and 60 s interval sampling, there were 182 DPs left in the data set. In other words, 1800 − 182 = 1618 points were reduced. Meanwhile, SR = (1618/1800) × 100% = 89.88% and AR = 97.57%.
Case 7: the first step was to obtain intermediate data 1 by using VR inference with VR = 3%. The second step was to obtain the intermediate data set 2 after sampling with a sampling interval of 60 s. The third step was to merge the intermediate data set 1 and the intermediate data set 2 to obtain the final output.
The original data set has 1800 DPs, as shown in Table 1. After the inferencing of VR = 3% and 60 s interval sampling, there were 64 DPs left in the data set. In other words, 1800 − 64 = 1736 points were reduced. Using Equations (4) and (5), SR is equal to (1736/1800) × 100% = 96.44% and AR is equal to 96.04%.
Case 8: this is similar to case 7. When compared with case 7, the difference is that, in case 8, VR is equal to 10%. After the inferencing of VR = 10% and 60 s interval sampling, there were 22 DPs left in the data set. In other words, 1800 − 22 = 1778 points were reduced. According to Equations (4) and (5), SR = (1778/1800) × 100% = 98.78% and AR = 96.14%.
Case 9: in case 9, the first step was to obtain intermediate data 1 by using VR inference with VR = 15%. The second step was to obtain the intermediate data set 2 after sampling with a sampling interval of 60 s. The third step was to merge the intermediate data set 1 and the intermediate data set 2 in order to obtain the final output.
Table 1 shows that the original data set has 1800 DPs. After the inferencing of VR = 15% and 60 s interval sampling, there were 21 DPs left in the data set. In other words, 1800 − 21 = 1779 points were reduced. According to the formulas, SR = (1779/1800) × 100% = 98.83%; at the same time, AR = 95.95%.
Figure 4 shows HR and inferred HR from case 1 to case 9. According to the experimental results, it is observed that, as the sampling interval increases, SR becomes larger, but AR becomes smaller. Moreover, as the value of VR becomes larger, SR becomes larger, but AR becomes smaller. In addition, when data inference is performed by combining time sampling (collecting beacon points) inference and VR inference, when the sampling interval is constant, the larger the VR, the more significant the AR improvement that is brought by the combined method.
Figure 4. Evaluation of data inference framework (case 1 to case 9).
Table 2 depicts the results of original data points of 6720 samples with heart rates being observed over 24 h captured every second. The results show that SR compromises AR, as SR increases when AR decreases due to higher AR requiring more DPs to process.
Table 2. Large Sample of Inference Rate for 24 h HR data (seconds) to compare variance rates (VR) related to Savings and Accuracy Rates.

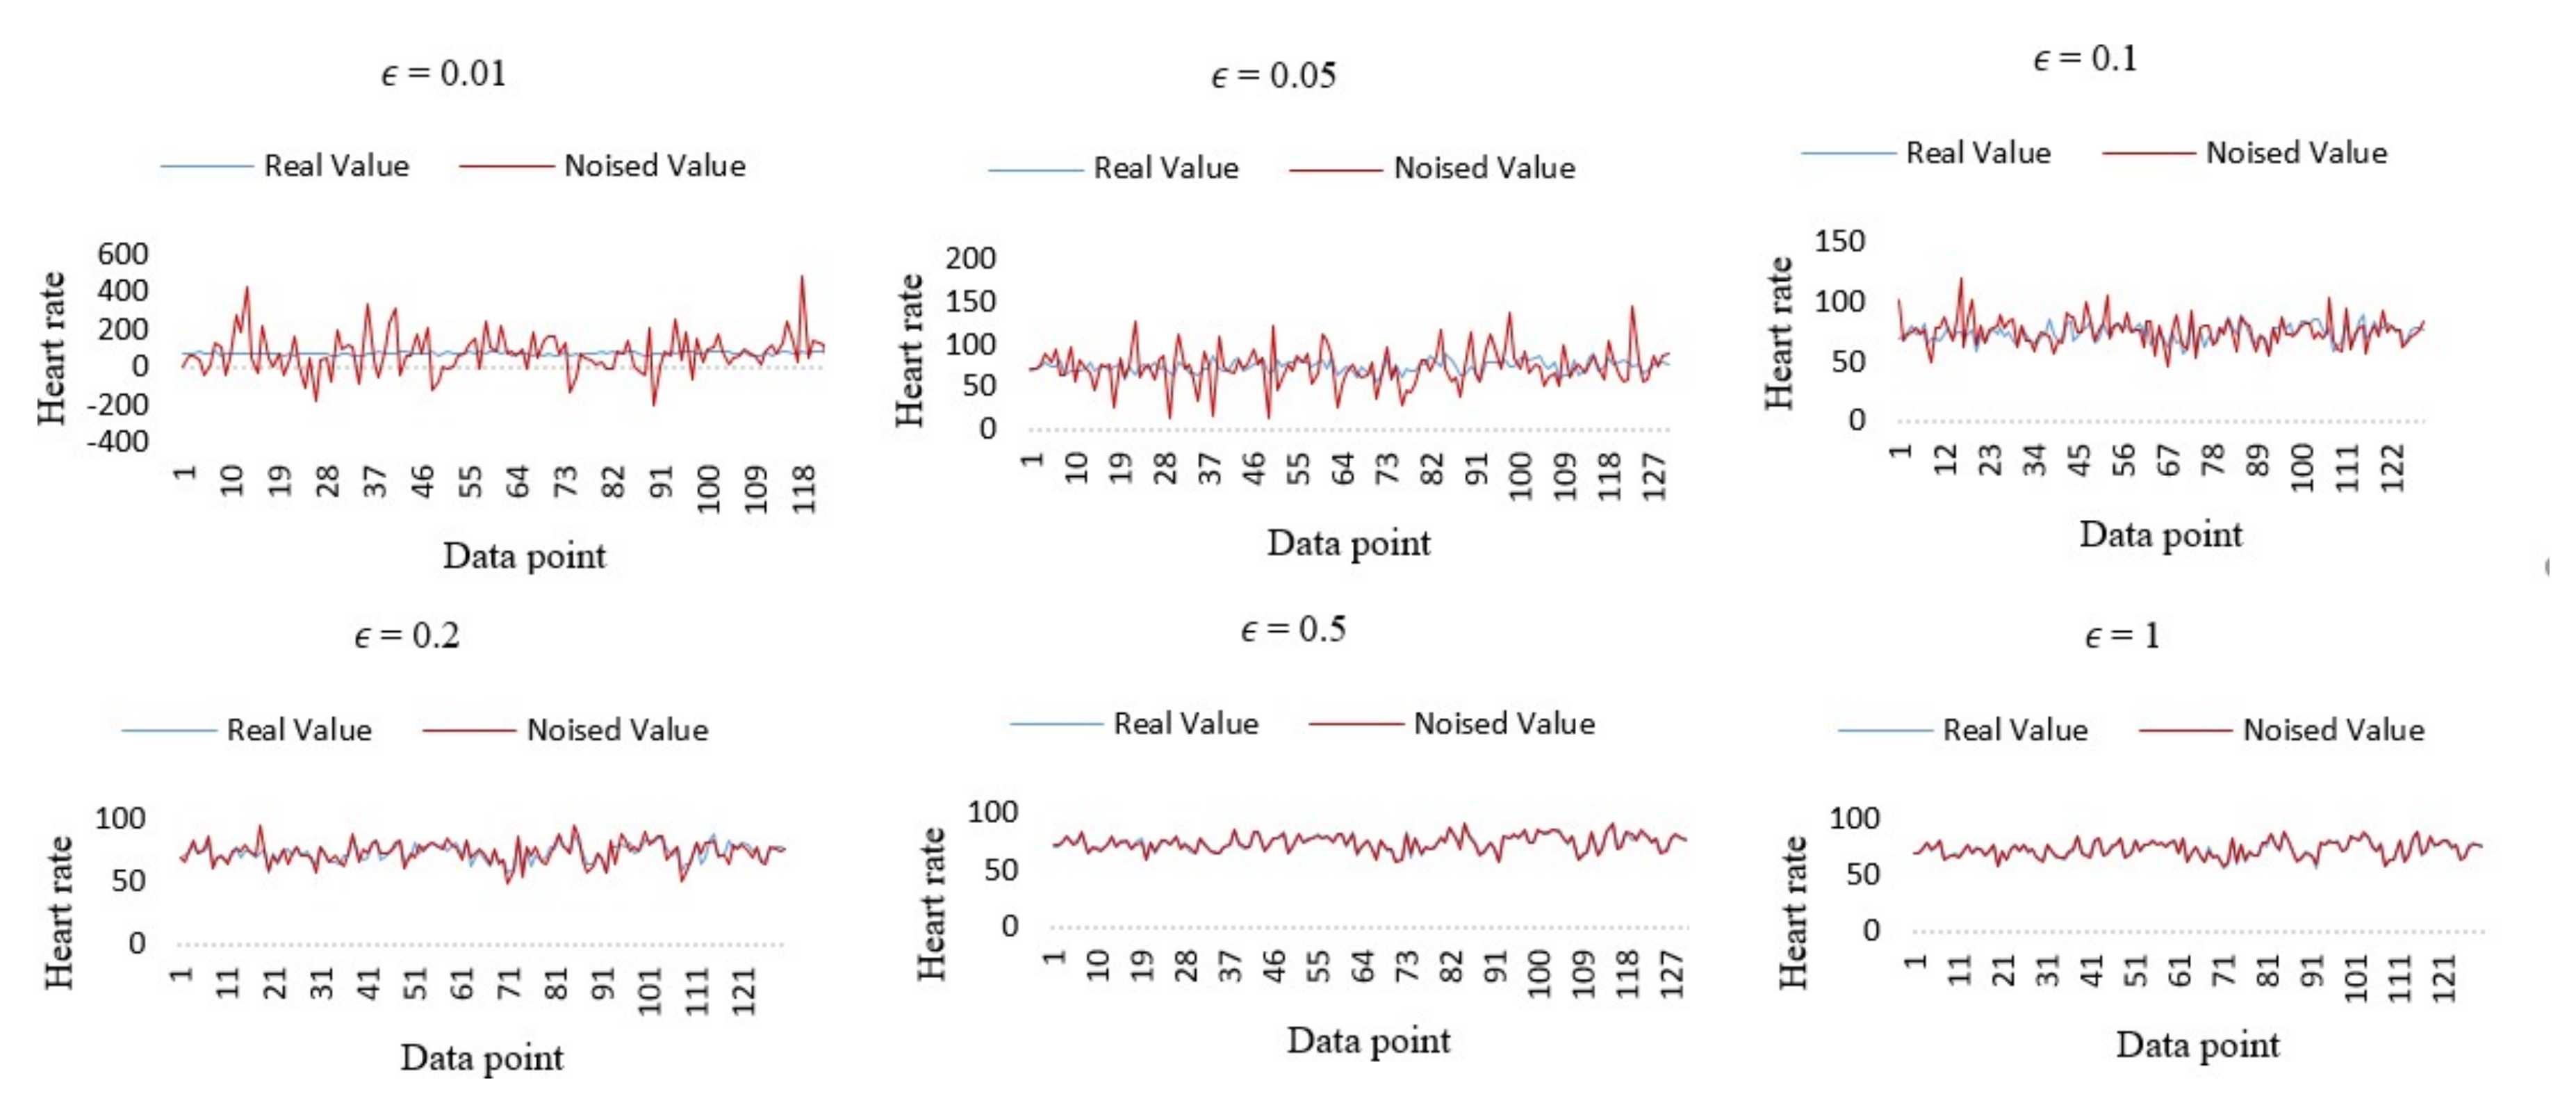
4.2. Privacy Preservation Evaluation

This section aims to study the efficiency of the proposed scheme from a privacy preservation perspective. Research on privacy-preserving approaches in eHealth clouds have commonly tended to focus on cryptographic methods, such as symmetric key encryption (SKE) and attribute-based encryption (ABE) [24,28]. In order to prove the efficiency of the proposed data inference framework for IoHT, the correlation between the plaintext size and crypto texts size can be tested in two main categories: SKE and ABE. For SKE evaluation, the simulation is conducted in OnlineDomain-Tools [29] for three main symmetric encryption techniques: advanced encryption standard (AES), data encryption standard (DES), and blowfish.
Over a course of 24 h in an experiment, a total of 1420 heart rate DPs were sensed and processed at various inference rates that ranged from 2.5%, 5%, 10%. and 20% VRs. After the inferencing algorithms are applied to the data, the number of DPs to be transferred were reduced significantly, as shown in Table 3. The VRs ranged from 0%, 2.5%, 5%, 10%, and 20%, which resulted in savings that ranged from 0%, 51.3%, 78.5%, 89.7%, and 98.8%, respectively. Plaintext size for 0% savings can be considered as 1024 B (1 MB). The plaintext size for other degree of savings can be obtained by:
p l a i n t e x t   s i z e   B = 100 s a v i n g s × 1024 100
Table 3. Data savings for different values of variance rate (24 h samples).
Figure 5 shows the impact of varying the plain text size. The mode is set to ECB (electronic code book) while maintaining the key at 128 and evaluating varying plain text sizes from 1024, 498, 220, 105, and 12 with AES, DES, and blowfish encryption functions. The results show that, as the size of the plain text size decreases, the size of crypto text also decreases accordingly. When comparing Table 3 and Figure 5, when VR is equal to 2.5%, the crypto text size for 1024 bytes of data is equal to 496 bytes. However, there is no clear evidence regarding whether one encryption technique was better than another. We have also evaluated the effectiveness of our solution by utilizing differential privacy. The dataset used in the experiment contains information regarding body temperature, gender, and heart rate for 130 people.
Figure 5. Evaluation of varying plain text size.
In the proposed model in this paper, data will eventually be used for statistical queries. For example, the average heart rate of someone in a day will be queried. The difference between one more record and one less record on the statistical results is defined as the sensitivity of the query algorithm, denoted as ∆f. In order to provide E-differential privacy protection for our data, the output result will be:
O u t _ R e s u l t = R e a l _ R e s u l t +   L a p l a c e ( Δ f ε )
The Laplace (∆f/ ε ) is the Laplace noise which was added to protect the real data. According to Equation (14), the sensitivity of our query algorithm is first required to be analyzed, from which, an appropriate ε to obtain the required Laplace noise is selected. By definition of sensitivity, it is logical to infer that the greater the sensitivity, the greater the noise, and the smaller the sensitivity, the smaller the noise. An assumption is made that ∆f = 1 (that is, the addition of each new record will cause the result to change by 1, which is very large). Therefore, the following experiments are conducted with a sensitivity of 1 (∆f = 1), and the distribution of Laplace noise that is added to the data is equal to Laplace (1/ ε ). Noise is added in order to satisfy the Laplace (1/ ε ) distribution to each heart rate data in the original data set. Six experiments were performed, where ε was set equal to 0.01, 0.05, 0.1, 0.2, 0.5, 1.0, and the results are compared to observe how differential privacy protects the original data. Following this, the average values of the original data were identified and compared with the original data statistics in order to compare the performance of differential privacy.
Figure 6 shows the experimental results under six cases of ε . The X-axis of each sub-figure shown in Figure 6 represents the index of the DP in the data set. The Y-axis represents the heart rate value of this DP. The blue line in the figure represents the heart rate value in the original data set, and the red line represents the value after the addition of Laplace noise to each DP in the original data. Lap (1/0.01), Lap (1/0.05), Lap (1/0.1), Lap (1/0.2), Lap (1/0.5), and Lap (1/1) are the distributions of Laplace noise added.
Figure 6. Evaluation of differential privacy with six different values of ε .
Based on the trend in changes of the sub-figures, it can be observed that, with the increase of E, the added noise begins to decrease i.e., the degree of deviation of red points from the blue line begins to decrease. When ε = 1, the noised data almost coincide with the original data. It can be observed that, when E is smaller (as in the sub-figure with ε = 0.01), the degree of privacy protection provided by random algorithms is greater, according to the trend of Figure 6. Conversely, when ε is larger (as in the sub-figure with ε = 1), the degree of privacy protection provided by random algorithms is lower.
Each DP, after adding Laplace noise, will deviate from the original data to a certain extent. However, this is not necessarily important, as users, in practice, may not query a specific value, such as their heart rate at a specific point, but may be more concerned about the average value over a certain period of time. The average value of both the original data set and the noised data set in all six experiments were calculated and the results are summarized in Table 3, which shows that the size of the noise added to the original data set is different in each experiment. The statistical results (after adding noise) deviate from the true statistical results (the raw data statistical results) to different degrees. The smaller the deviation, the higher the availability of data. When ε = 0.01,   ε = 0.05, ε = 0.1, and ε = 0.2, there is a relatively large deviation level, and the availability of data is low. When ε = 0.5, the degree of deviation is very small (almost close to 0) and the data availability is high. The purpose of adding Laplace Noise is to ensure the availability of data while protecting user privacy. The experimental results shown in Figure 6 and Table 3 show that there is a compromise in privacy protection and data availability—obtaining greater results in one requires compromising the other. When comparing Figure 6 and Table 4 under these considerations, data protection capability and data availability were at their best when ε = 0.5.
Table 4. Query results under different values of ε .

5. Beneficial Applications

This section describes some possible applications for which the proposed inference solution could be implemented in mHealth and IoHT networks. There remains to be a myriad of possibilities for the use of healthcare big data in improving human lifestyle and wellbeing—these are just some of the examples.

5.1. Patient Monitoring of Disease Outbreak

It is crucial in disease outbreaks to quickly identify infected patients and potential carriers. mHealth technologies have the potential to identify individuals who may have been exposed to a disease, flagging those who may meet criteria to be considered for further testing or quarantine. Governments or agencies can use these data in order to more comprehensively inform population metrics, develop modelling, and to intelligently develop a public health response that can be objective and transparent to the public—avoiding the risk of generating panic. Educating the public will be key in public health responses to future disease outbreaks, and mHealth technologies with algorithms could allow for a localization of public health response to specific geographical areas of need.

5.2. Battery Conservation of Personal Health Devices

Some PHDs, such as pacemakers, operate on battery power, which requires a costly and invasive operation to replace. Therefore, conserving battery power is of importance to PHDs that are wireless and are implanted on or in the body. Previous research [20] found that battery power can be conserved with the use of an inference algorithm, while maintaining adequate data accuracy. As devices continue to develop with greater computational power, more complex algorithms can be applied for increasing their intelligence. A complex inference system that is applied on these devices could significantly reduce battery consumption without compromising data integrity.

5.3. Health Data for Identificationes

Biometrics, such as voice recognition or fingerprints, have been used in various applications for authentication. However, this cannot be used in remote applications. Health data could have use for user identification purposes, as privacy is a key requirement in eHealth and IoHT technologies. Whilst one aspect of health data, such as heart rate, may provide no identifying information, it could, in combination with others, represent a unique pattern that is specific to an individual, especially as a trend over time, and therefore risk breaching a user’s identity. The major expected outcomes for such an application could include (1) assessment of health data traits with measurable and standardized accuracy, (2) building a model of structured attributes that can affect the effectiveness of the health data being used for identification.

6. Conclusions

Energy efficiency and privacy preservation of sensitive health data are essential in IoHT networks, which largely consist of smart devices limited by battery constraints. In this paper, a two-tier data inference framework has been proposed in order to conserve energy consumption by reducing unnecessary data transmission within the IoHT network while still maintaining high accuracy. The results suggest that applying 1% to 2.5% variance rate by the inference system achieved the best accuracy. It was also shown that this amount of VR decreases nearly half of the crypto text size while using the main symmetric encryption techniques. Another major finding was that applying differential privacy with a E = 0.5 satisfies the data protection and data availability requirements. The experimental results show that the proposed system is beneficial for saving the energy of IoT devices and security analysis suggests that the differential privacy technique can protect against sensitive health data from being obtained maliciously. In our future work, we will investigate how to incorporate highly efficient blockchain and federated learning techniques [19,30] into our solution in order to improve privacy preservation while maintaining high accuracy in the data inferencing system.

Author Contributions

Conceptualization, J.J.K.; methodology, X.Z.; software, G.L.; validation, M.D., W.Y. and J.J.K.; formal analysis, J.J.K. and M.D.; investigation, W.Y.; resources, P.H.-D.; writing—original draft preparation, J.J.K.; writing—review and editing, J.J.K., M.D., W.Y., P.H.-D. and X.Z.; supervision, P.H.-D. and X.Z.; project administration, J.J.K. and X.Z.; funding acquisition, P.H.-D. All authors have read and agreed to the published version of the manuscript.

Funding

This research received no external funding.

Institutional Review Board Statement

Ethical review and approval were waived for this study, due to the use of public open datasets.

Data Availability Statement

The data presented in this study are available within the article.

Acknowledgments

This work is supported in part by Australia Data61 CRP C020996.

Conflicts of Interest

The authors declare no conflict of interest.

References

  1. Kang, J.J.; Haskell-Dowland, P. How Safe is Covidsafe? What You Should Know about the App’s Issues, and Bluetooth-Related Risks. Available online: https://theconversation.com/how-safe-is-covidsafe-what-you-should-know-about-the-apps-issues-and-bluetooth-related-risks-137894 (accessed on 31 November 2020).
  2. Liu, S.; Dibaei, M.; Tai, Y.; Chen, C.; Zhang, J.; Xiang, Y. Cyber Vulnerability Intelligence for Internet of Things Binary. IEEE Trans. Ind. Inform. 2020, 16, 2154–2163. [Google Scholar] [CrossRef]
  3. Omale, G. Gartner Identifies Top 10 Strategic Iot Technologies and Trends. Available online: https://www.gartner.com/en/newsroom/press-releases/2018-11-07-gartner-identifies-top-10-strategic-iot-technologies-and-trends (accessed on 31 November 2020).
  4. Kang, J.J.; Dibaei, M.; Luo, G.; Yang, W.; Zheng, X. A Privacy-Preserving Data Inference Framework for Internet of Health Things Networks. Available online: https://arxiv.org/abs/2010.09427 (accessed on 31 November 2020).
  5. Sohrabi, K.; Gao, J.; Ailawadhi, V.; Pottie, G. Protocols for self-organization of a wireless sensor network. IEEE Wirel. Commun. 2000, 7, 16–27. [Google Scholar] [CrossRef]
  6. Heinzelman, W.R.; Chandrakasan, A.; Balakrishnan, H. Energy-efficient communication protocol for wireless mi-crosensor networks. In Proceedings of the 33rd Annual Hawaii International Conference on System Sciences, Maui, Hawaii, 4–7 January 2000; p. 10. [Google Scholar]
  7. Manjeshwar, A.; Agrawal, D. TEEN: A routing protocol for enhanced efficiency in wireless sensor networks. In Proceedings of the 15th International Parallel and Distributed Processing Symposium, Fuzhou, China, 8–10 July 2016; Volume 1, pp. 2009–2015. [Google Scholar]
  8. Osborne, M.A.; Roberts, S.J.; Rogers, A.; Ramchurn, S.D.; Jennings, N.R. Towards Real-Time Information Processing of Sensor Network Data Using Computationally Efficient Multi-output Gaussian Processes. In Proceedings of the 2008 International Conference on Information Processing in Sensor Networks, St. Louis, MO, USA, 22–24 April 2008; pp. 109–120. [Google Scholar]
  9. Bragg, D.; Yun, M.; Bragg, H.; Choi, H.-A. Intelligent transmission of patient sensor data in wireless hospital networks. Am. Med. Inform. Assoc. 2012, 2012, 1139. [Google Scholar]
  10. IEEE Health Informatics–Personal Health Device Communication: Application Profile—Optimized Exchange Protocol; Part 20601; IEEE: Piscataway, NJ, USA, 2019; pp. 1–253.
  11. Engel, V.J.L.; Supangkat, S.H. Context-aware inference model for cold-chain logistics monitoring. In Proceedings of the 2014 International Conference on ICT For Smart Society (ICISS), Bandung, Indonesia, 24–25 September 2014; pp. 192–196. [Google Scholar]
  12. Zhu, X.; Kui, F.; Wang, Y. Predictive Analytics by Using Bayesian Model Averaging for Large-Scale Internet of Things. Int. J. Distrib. Sens. Netw. 2013, 9, 723260. [Google Scholar] [CrossRef]
  13. Ijaz, M.; Li, G.; Wang, H.; El-Sherbeeny, A.; Awelisah, Y.M.; Lin, L.; Koubaa, A.; Noor, A. Intelligent Fog-Enabled Smart Healthcare System for Wearable Physiological Parameter Detection. Electronics 2020, 9, 2015. [Google Scholar] [CrossRef]
  14. Pazienza, A.; Anglani, R.; Mallardi, G.; Fasciano, C.; Noviello, P.; Tatulli, C.; Vitulano, F. Adaptive Critical Care Intervention in the Internet of Medical Things. In Proceedings of the 2020 IEEE Conference on Evolving and Adaptive Intelligent Systems, Bari, Italy, 27–29 May 2020; pp. 1–8. [Google Scholar]
  15. Pasupuleti, S.K.; Ramalingam, S.; Buyya, R. An efficient and secure privacy-preserving approach for outsourced data of resource constrained mobile devices in cloud computing. J. Netw. Comput. Appl. 2016, 64, 12–22. [Google Scholar] [CrossRef]
  16. Wang, S.; Zhou, J.; Liu, J.K.; Yu, J.; Chen, J.; Xie, W. An Efficient File Hierarchy Attribute-Based Encryption Scheme in Cloud Computing. IEEE Trans. Inf. Forensics Secur. 2016, 11, 1265–1277. [Google Scholar] [CrossRef]
  17. Waters, B. Ciphertext-Policy Attribute-Based Encryption: An Expressive, Efficient, and Provably Secure Realization. In International Workshop on Public Key Cryptography; Springer: Berlin, Germany, 2011; pp. 53–70. [Google Scholar]
  18. Yin, C.; Xi, J.; Sun, R.; Wang, J. Location privacy protection based on differential privacy strategy for big data in industrial internet of things. IEEE Trans. Ind. Inform. 2017, 14, 3628–3636. [Google Scholar] [CrossRef]
  19. Li, Y.; Zhou, Y.; Jolfaei, A.; Yu, D.; Xu, G.; Zheng, X. Privacy-Preserving Federated Learning Framework Based on Chained Secure Multi-Party Computing. IEEE Internet Things J. 2020, 1. [Google Scholar] [CrossRef]
  20. Xu, C.; Ren, J.; Zhang, D.; Zhang, Y. Distilling at the Edge: A Local Differential Privacy Obfuscation Framework for IoT Data Analytics. IEEE Commun. Mag. 2018, 56, 20–25. [Google Scholar] [CrossRef]
  21. Liu, J.; Zhang, C.; Fang, Y. EPIC: A Differential Privacy Framework to Defend Smart Homes against Internet Traffic Analysis. IEEE Internet Things J. 2018, 5, 1206–1217. [Google Scholar] [CrossRef]
  22. Kang, J.J.W. An Inference System Framework for Personal Sensor Devices in Mobile Health and Internet of Things Networks. Ph.D. Thesis, Deakin University, Melbourne, Australia, 2017. [Google Scholar]
  23. Kang, J.J.; Luan, T.H.; Larkin, H. Enhancement of Sensor Data Transmission by Inference and Efficient Data Processing. In Proceedings of the International Conference on Applications and Techniques in Information Security, Cairns, Australia, 26–28 October 2016; pp. 81–92. [Google Scholar]
  24. Abbas, A.; Khan, S.U. A Review on the State-of-the-Art Privacy-Preserving Approaches in the e-Health Clouds. IEEE J. Biomed. Health Inform. 2014, 18, 1431–1441. [Google Scholar] [CrossRef] [PubMed]
  25. Vadhan, S. The Complexity of Differential Privacy. In Tutorials on the Foundations of Cryptography; Springer: Berlin, Germany, 2017; pp. 347–450. [Google Scholar]
  26. Dwork, C. Differential Privacy: A Survey of Results. In Proceedings of the International Conference on Theory and Applications of Models of Computation, Xi’an, China, 25–29 April 2008; pp. 1–19. [Google Scholar]
  27. Heart Rate Time Series. Available online: http://ecg.mit.edu/time-series/ (accessed on 31 November 2020).
  28. Dibaei, M.; Zheng, X.; Jiang, K.; Abbas, R.; Liu, S.; Zhang, Y.; Xiang, Y.; Yu, S. Attacks and defenses on intelligent connected vehicles: A survey. Digit. Commun. Netw. 2020, 6, 399–421. [Google Scholar] [CrossRef]
  29. Online Domain Tools. Available online: http://online-domain-tools.com/ (accessed on 31 November 2020).
  30. Dibaei, M.; Zheng, X.; Xia, Y.; Xu, X.; Jolfaei, A.; Bashir, A.K.; Tariq, U.; Yu, D.; Vasilakos, A.V. Investigating the Prospect of Leveraging Blockchain and Machine Learning to Secure Vehicular Networks: A Survey; IEEE: Piscataway, NJ, USA, 2020. [Google Scholar]
Publisher’s Note: MDPI stays neutral with regard to jurisdictional claims in published maps and institutional affiliations.

Article Metrics

Citations

Article Access Statistics

Multiple requests from the same IP address are counted as one view.