Article

Hearing Loss Is Associated with Increased Variability in Double Support Period in the Elderly

1
Division of Otology, Neurotology, and Skull Base Surgery, Department of Otolaryngology—Head and Neck Surgery, Columbia University Vagelos College of Physicians and Surgeons, New York, NY 10032, USA
2
Department of Mechanical Engineering, Stevens Institute of Technology, School of Engineering & Science, Hoboken, NJ 07030, USA
3
Department of Mechanical Engineering, School of Engineering and Applied Science, Columbia University, New York, NY 10027, USA
4
Department of Rehabilitative and Regenerative Medicine, Columbia University Medical Center, New York, NY 10032, USA
*
Author to whom correspondence should be addressed.
These authors contributed equally to this work.
Sensors 2021, 21(1), 278; https://doi.org/10.3390/s21010278
Submission received: 20 November 2020 / Revised: 21 December 2020 / Accepted: 28 December 2020 / Published: 4 January 2021
(This article belongs to the Special Issue Wearable Sensors for Movement Analysis)

Abstract

:
Hearing loss is a disabling condition that increases with age and has been linked to difficulties in walking and increased risk of falls. The purpose of this study is to investigate changes in gait parameters associated with hearing loss in a group of older adults aged 60 or greater. Custom-engineered footwear was used to collect spatiotemporal gait data in an outpatient clinical setting. Multivariable linear regression was used to determine the relationship between spatiotemporal gait parameters and high and low frequency hearing thresholds of the poorer hearing ear, the left ear, and the right ear, respectively, adjusting for age, sex, race/ethnicity, and the Dizziness Handicap Inventory–Screening version score. Worsening high and low frequency hearing thresholds were associated with increased variability in double support period. Effects persisted after adjusting for the effects of age and perceived vestibular disability and were greater for increases in hearing thresholds for the right ear compared to the left ear. These findings illustrate the importance of auditory feedback for balance and coordination and may suggest a right ear advantage for the influence of auditory feedback on gait.

1. Introduction

Hearing loss is a disabling condition that increases with age and affects nearly two-thirds of adults aged 70 and over in the US population [1]. Among older adults, hearing loss has been linked to difficulties in walking and increased risk of falls [2,3], and some studies have suggested that the use of hearing aids may reduce the risk of falls in this group [4]. A recent retrospective cohort analysis of adults over the age of 18 in an inpatient setting showed that patients with hearing loss who did not have hearing aids had an increased risk of falls, even after controlling for age and sex; this effect was not present in patients with hearing loss who had hearing aids [5]. While there is a growing body of evidence that untreated hearing loss may lead to increased risk of falls, the mediating factors of this relationship remain unelucidated.
Falls are increasingly common with age, with more than a quarter of adults over the age of 65 falling at least once a year in the US [6,7]. Falls are tremendously detrimental to the quality of life of older adults and can lead to fear of falls, decreased mobility, injuries, fractures, and mortality [6,7,8,9,10]. Abnormalities in balance and gait are among recognized intrinsic risk factors for falls and are also prevalent in the elderly [11,12]. Indeed, the gait patterns of older adults are characterized by reduced velocity, shorter step length, and increased step timing variability [13], and shorter stride and step length, wider step width, and increased variability in gait parameters have been implicated in increased risk of falls [14]. Perceived vestibular impairment, as determined by the Dizziness Handicap Inventory–Screening version (DHI-S) score, has been found to be associated with impaired gait function [15]. In particular, patients with higher DHI-S score took shorter steps and fewer steps per minute, resulting in slower walking speed, and showed larger variability in temporal gait parameters including cadence, double support period, swing period, and stance-to-swing. It has been suggested, however, that hearing impairment may have effects on postural instability and impaired balance beyond the effects of vestibular dysfunction [16]. Auditory feedback may serve as reafferent signals that are important for locomotion and coordination [17]. While investigating whether step sounds generated during running have impacts on performance of a hurdling task, Kennel et al. found that delayed auditory feedback resulted in slower overall time and altered kinematic parameters [17]. Sallard et al. found age-related declines in processing of sensory reafference as demonstrated by an increased inter-tap interval variability in a bimanual task in the elderly group compared to the younger group [18]. In a recent study, older adults using ear plugs to inhibit auditory feedback were shown to exhibit increases in step length, thought to be a compensation that increased ground reaction forces, allowing participants to sense footsteps [19]. Auditory feedback is thought to regulate gait through providing temporal and spatial information that becomes increasingly valuable with age, as balance deteriorates. Thus, we hypothesized that worsening hearing function in the elderly would be reflected in increased gait variability. To test this hypothesis, we analyzed the gait of a group of older adults aged 60 or greater, as they completed an overground walking task at comfortable speed. We then investigated associations between participants’ spatiotemporal gait parameters and objective measures of their hearing sensitivity.

2. Materials and Methods

2.1. Participants

Participants were recruited during their visit to the Otology and Neurology clinic at Columbia University, and the study was approved by the local Institutional Review Board. Because the prevalence of hearing loss starts increasing dramatically from the age of 60 onwards [20], only individuals aged 60 or greater were involved in the study. Participants with stroke, Parkinson’s disease, or other medical conditions known to affect gait and participants who had undergone hip or knee surgery were excluded from the study. Eighty participants with available gait data and audiometric data were included for analysis.

2.2. Audiometric Data

Audiometric measurements were conducted in a sound-treated double-walled audiometric suite using insert earphones and an audiometer calibrated to the standards set by the American National Standards Institute (ANSI S3.6-2010). Hearing sensitivity was measured through pure tone air conduction audiometry by presenting pure tone signals to the ear through earphones and varying the signal intensity until the hearing threshold was determined for each frequency. Therefore, higher thresholds indicate worse hearing. Pure tone air conduction thresholds at 500, 1000, 2000, 4000, 6000, and 8000 Hz were recorded in decibel hearing level (dB). Pure tone averages (PTA) were determined as the average hearing thresholds in dB at select tested frequencies, with higher PTA representing worse hearing at those frequencies. In this study, low frequency PTA were taken for 500, 1000, and 2000 Hz, and high frequency PTA were taken for 4000, 6000, and 8000 Hz [21]. Low frequency PTA represent frequencies most commonly used in speech, while high frequency PTA represent frequencies preferentially lost in presbycusis. Low frequency PTA and high frequency PTA were calculated for the poorer hearing ear, the right ear, and the left ear. The poorer hearing ear was chosen as it best reflects a potential underlying worsening vestibular system. Additionally, as a right ear advantage has been reported previously for speech [22], left and right ear thresholds were chosen to explore whether associations with gait are stronger on either side.

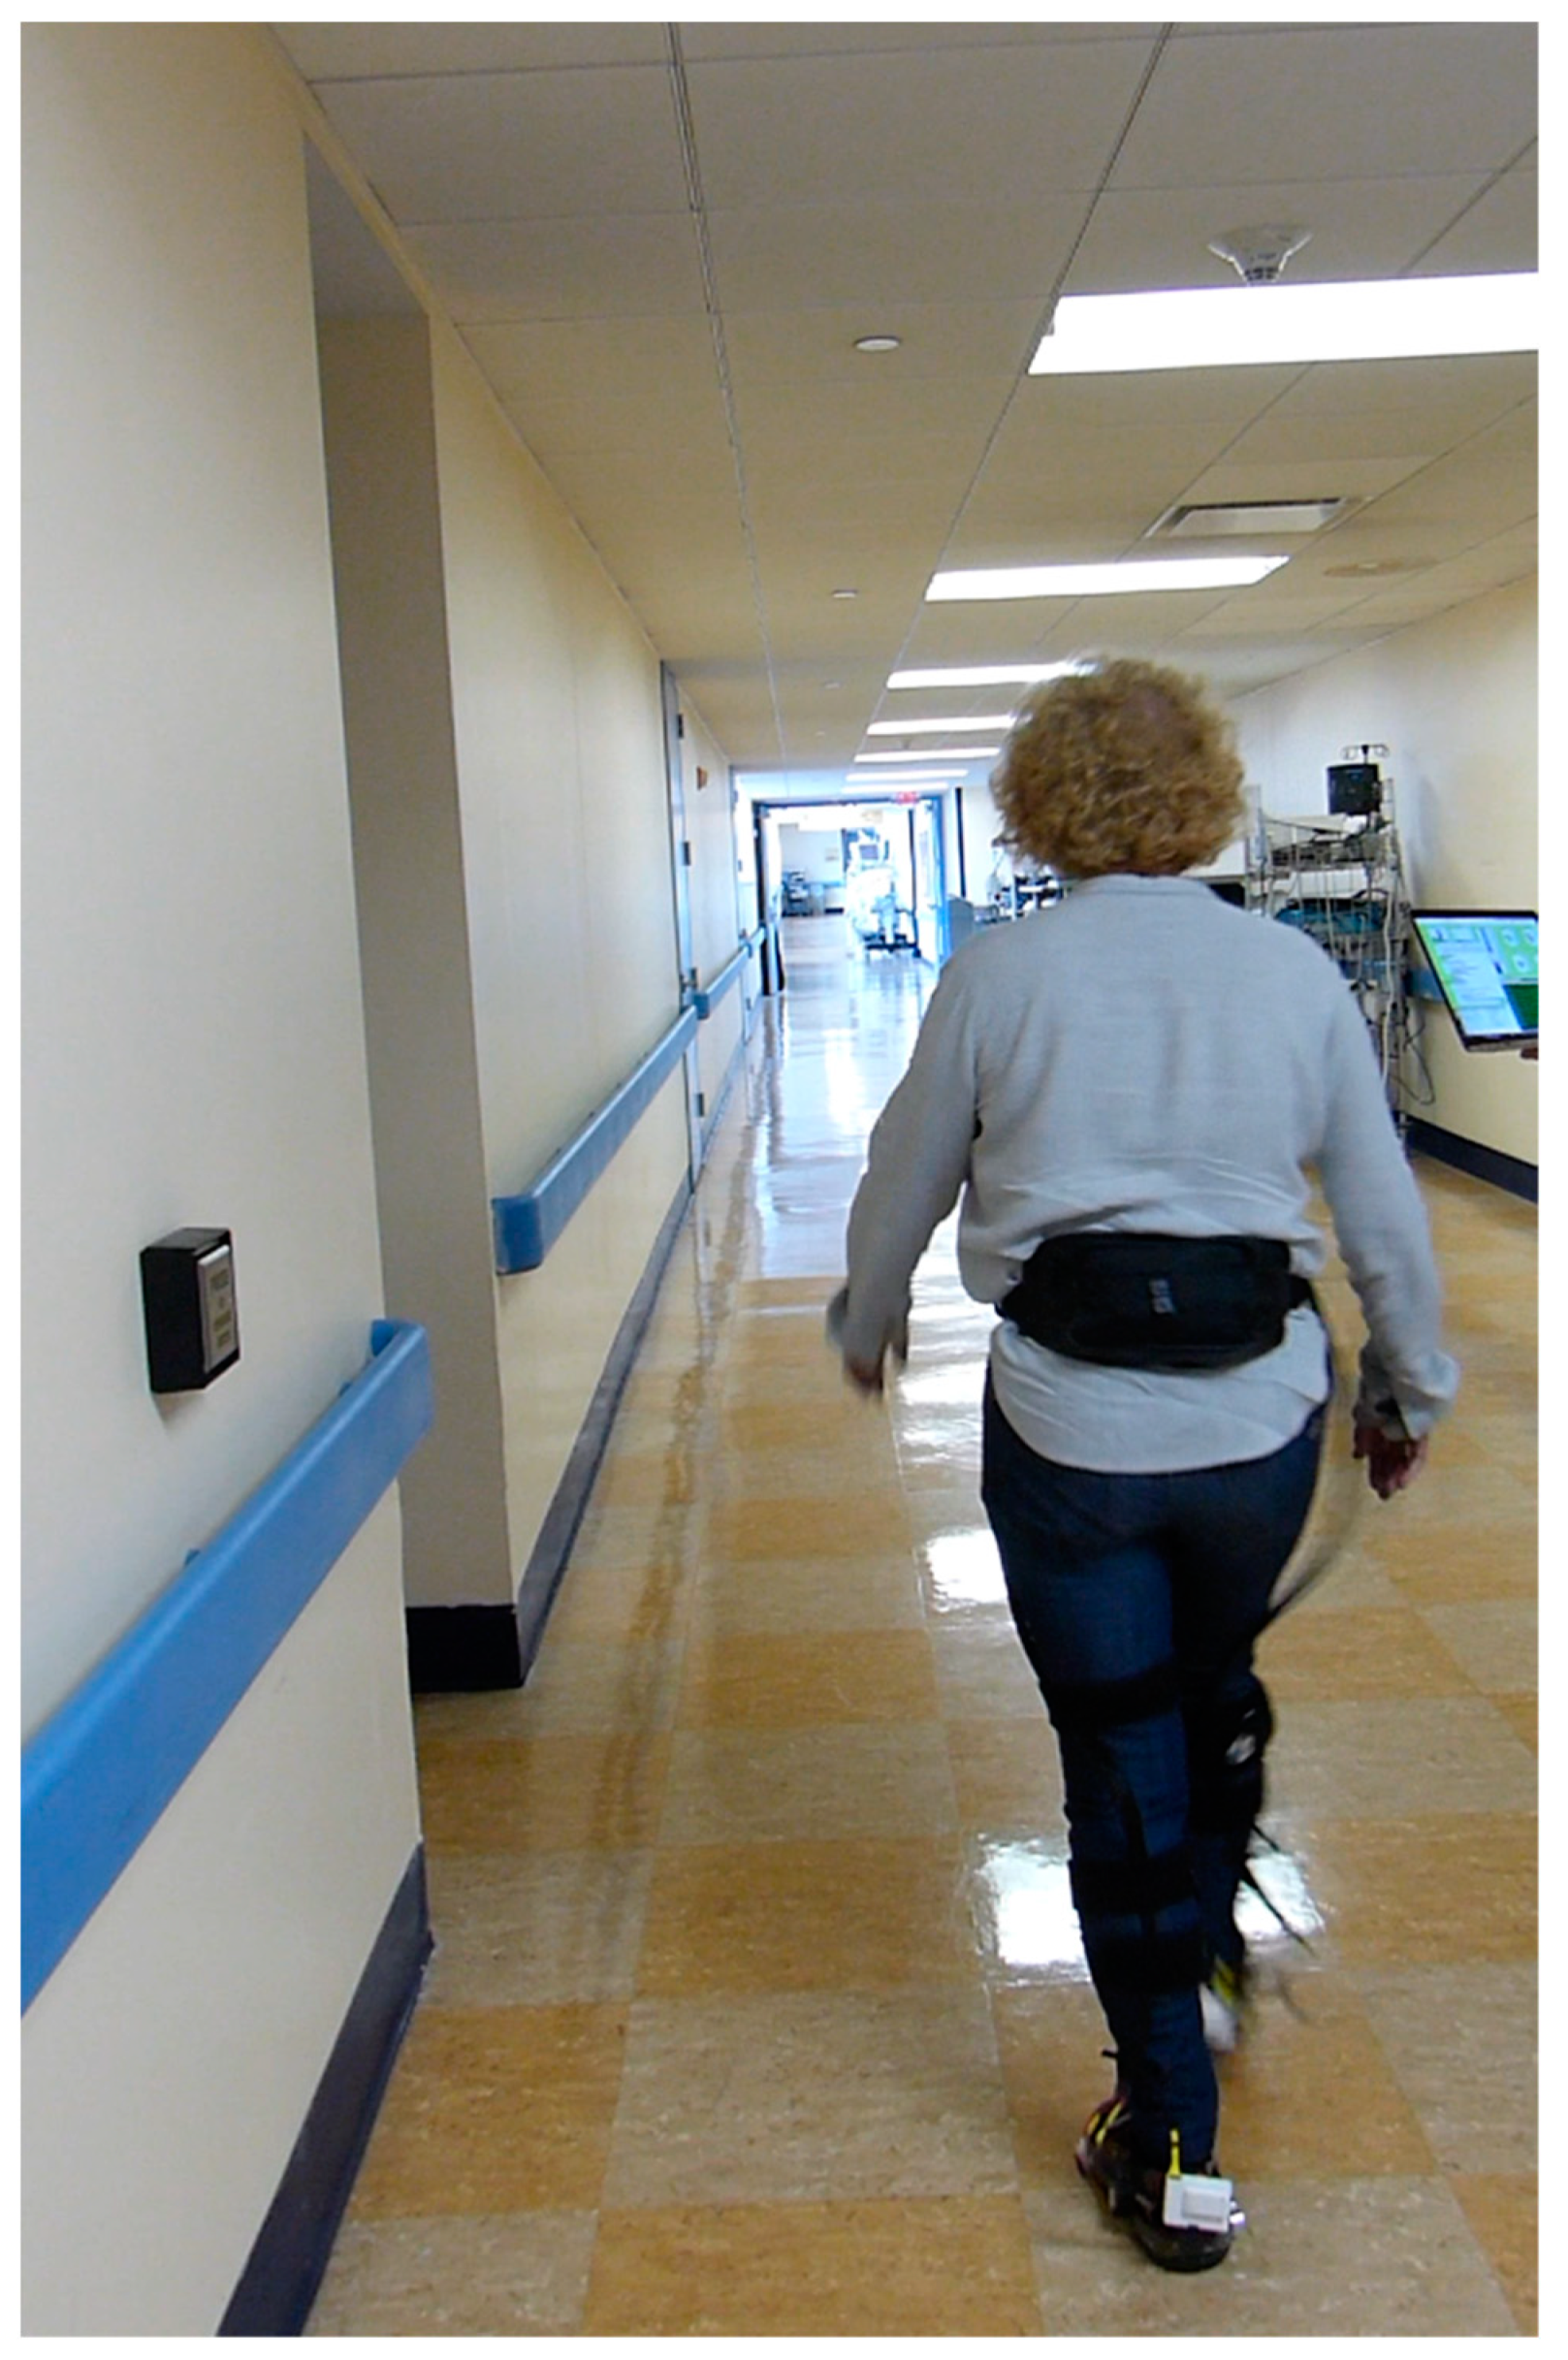
2.3. Instrumented Footwear for Gait Analysis

To collect spatiotemporal gait data in out-of-the-lab conditions, participants were asked to put on custom-engineered footwear developed in the Columbia University Robotics and Rehabilitation Laboratory (Figure 1, [23]). This wearable system is capable of measuring kinematic gait parameters and optionally delivering real-time auditory and vibrotactile feedback in response to those parameters. The gait analysis capability of the instrumented footwear was previously validated with healthy individuals [24] and patients with a neuromuscular disorder affecting the gait function [25]. The system consists of two footwear units and a hip pack unit. Each footwear unit includes four force-sensitive resistors (used as foot switches), an inertial measurement unit (IMU), and five vibrotactile transducers, all embedded in the sole of regular sandals. A second IMU is encased in a small plastic box secured with a Velcro strap to the user’s proximal shank, enabling the system to measure the shank’s kinematic data. An ultrasonic sensor is mounted on the posteromedial side of the sole to estimate stride width. The hip pack unit includes a portable single-board computer, an external sound card used to control the auditory and vibrotactile feedback, a small Wi-Fi router, and a Li-Po battery. The single-board computer synchronizes the data incoming from the footwear units, runs the feedback engine, and performs data-logging to a micro-SD card at a sample rate of 500 Hz. The total weight of the hip pack unit is 1.14 kg, and the weight of the components attached to each sandal is 0.19 kg. In this study, the feedback capability of the device was not used.

2.4. Experimental Protocol for Measurement of Gait Parameters

Participants chose an appropriate shoe size for the instrumented footwear. Subsequently, wearing the device, each participant completed four uninterrupted walking laps along a 25-m-long straight-line path, covering a total of 100 m at their chosen pace (Figure 1).
Gait parameters analyzed include stride length, cadence, walking speed, foot-ground clearance, swing period, double-support time, and stance-to-swing (i.e., the intra-limb ratio between the duration of the stance phase and that of the swing phase within one stride). For stride length, stride height, and stride velocity, normalized metrics adjusting for the subject’s stature (as described in [26]) were also analyzed. For each of these gait parameters, we extracted 40 consecutive left and right strides of steady-state walking within each lap, resulting in 160 samples for each parameter, for each participant. These samples were subsequently used to compute the mean and coefficient of variation (CV) for each individual. This large number of samples was chosen to provide a reliable estimate of gait variability [27]. Additionally, the confounding effects of gait asymmetries on gait variability were compensated for by calculating the standard deviation from residuals of each stride around the mean over the corresponding limb [28]. This method also allows for a more precise measure of gait variability, as it doubles the number of samples that can be used in the analysis.

2.5. Other Variables

Other variables of interest collected include age, sex, race/ethnicity, and the DHI-S score. The DHI-S is an abbreviated 10-question version of the original 25-question DHI score, which is used the quantify perceived vestibular disability [29,30]. The DHI-S score has been shown to be highly correlated with the original DHI [31]. Participants completed the DHI-S survey prior to measurement of gait parameters, and the DHI-S score was tabulated from the responses.

2.6. Statistical Analysis

Multivariable linear regression was employed to determine whether high and low frequency PTA of the poorer hearing ear, the left ear, and the right ear were associated with changes in gait parameters, adjusting for age, sex, race/ethnicity, and DHI-S score, which are known to affect gait patterns [15]. Models including PTA of the left or right ear were additionally adjusted for the laterality of the poorer hearing ear (i.e., right or left ear). Given the limited sample size, race/ethnicity was categorized into two groups: non-Hispanic White and Other. This categorization resulted in an even distribution of subjects across both groups. Separate linear regression models were fit to each gait parameter. Standardized coefficients were used to assess the relative importance of independent variables.
The assumption of normal distribution of the residuals was checked by inspecting the normal probability plots of the standardized residuals. Deviations from linearity and homoscedasticity were identified by inspecting the scatterplots of the standardized residuals plotted against the standardized predicted values. We checked for potential multicollinearity among predictors using tolerance and reciprocal of the variance inflation factor, with a threshold of 0.2. The assumption of independent errors was checked using the Durbin–Watson statistic.
Influential outliers were identified using the following criteria: 1) absolute value of the externally studentized residual > critical t, where df = N − p −1 with N, p being the # of data points and the # of predictors, respectively [32], and 2) either Cook’s D>1 [33] or leverage > 2p/N [34]. Sensitivity analyses were conducted including and excluding these identified outliers. All analyses were conducted using SAS 9.4 (SAS Institute, Cary, NC, USA).

3. Results

3.1. Characteristics

The characteristics of the study sample are summarized in Table 1. The study sample included 80 participants, aged 60 to 95 (mean 73.7, SD 8.8). A total of 46.2% of the sample was female and 52.5% were Non-Hispanic White; 87.5% of participants had hearing loss as a chief complaint, 42.5% had tinnitus, and 51.3% had dizziness or imbalance. Low frequency hearing thresholds were similar between the right (37.4 ± 23.9 dB) and left (37.4 ± 23.7 dB) ears. High frequency hearing thresholds were higher for both the right (52.2 ± 23.5 dB) and left (55.9 ± 24.5 dB) ears.
The mean and CV of all gait parameters are summarized in Table 2. Because of technical problems with one of the instrumented sandals, bilateral metrics were not available for 6 participants, resulting in 74 valid data points.

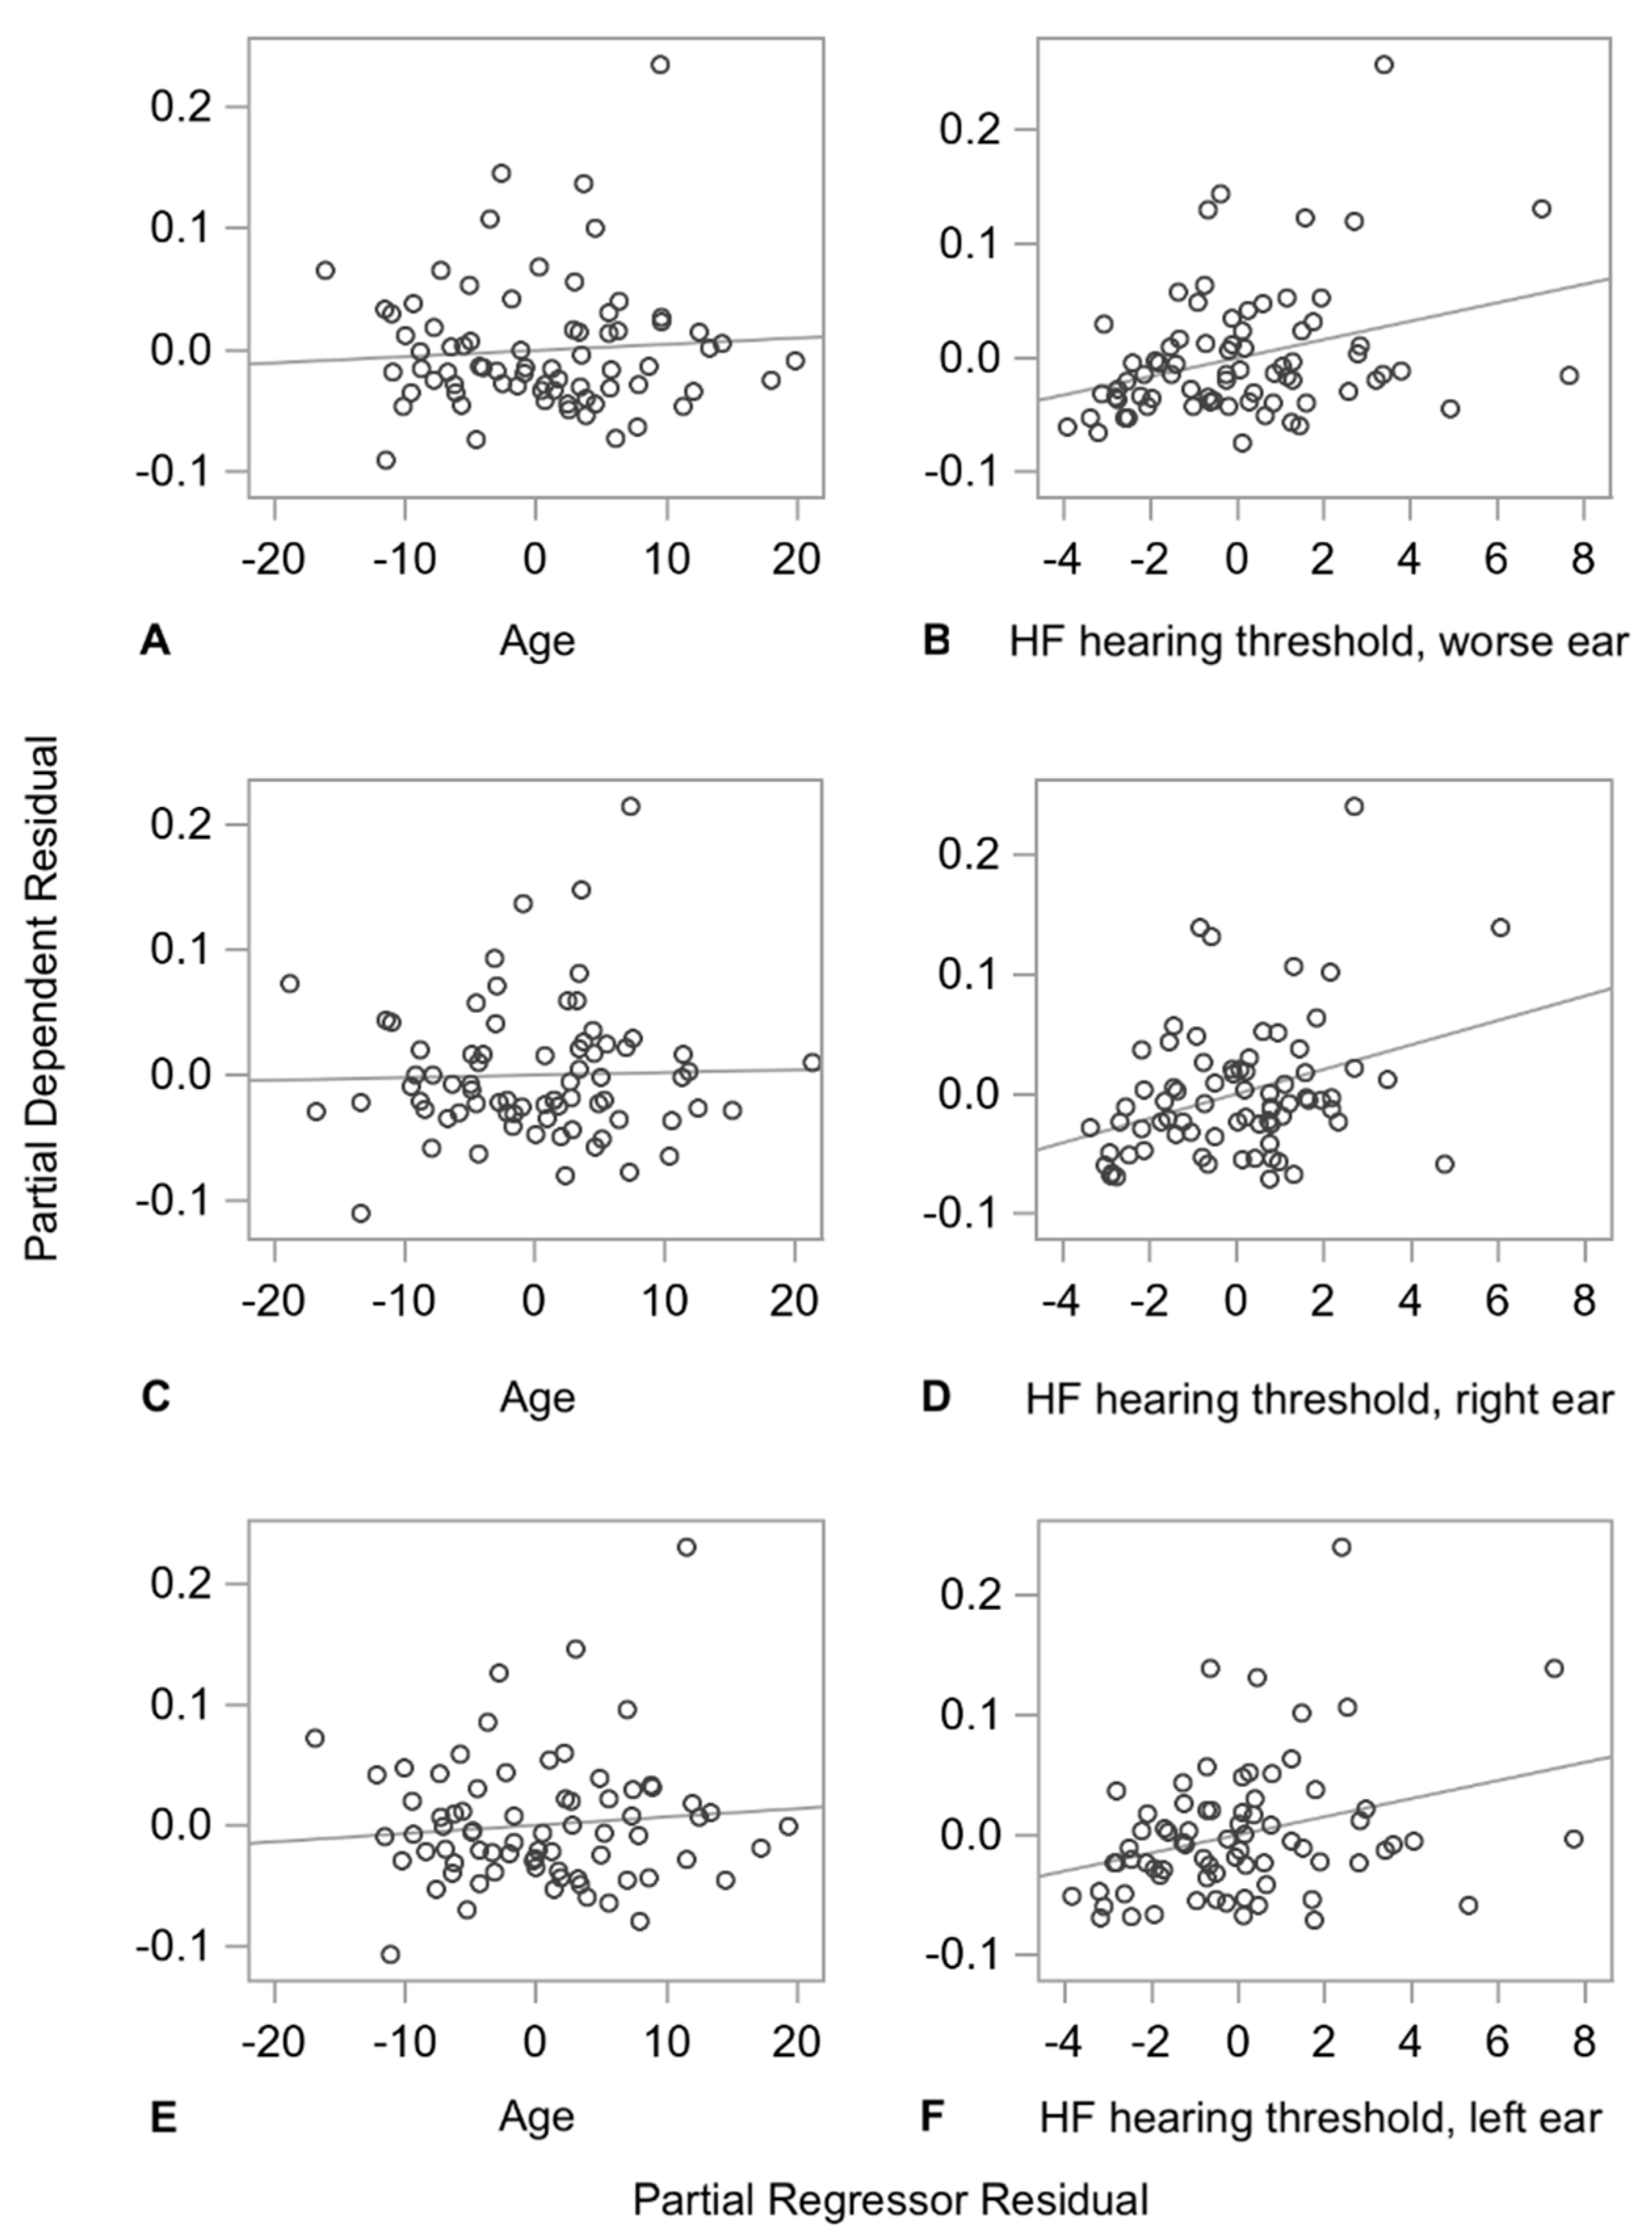
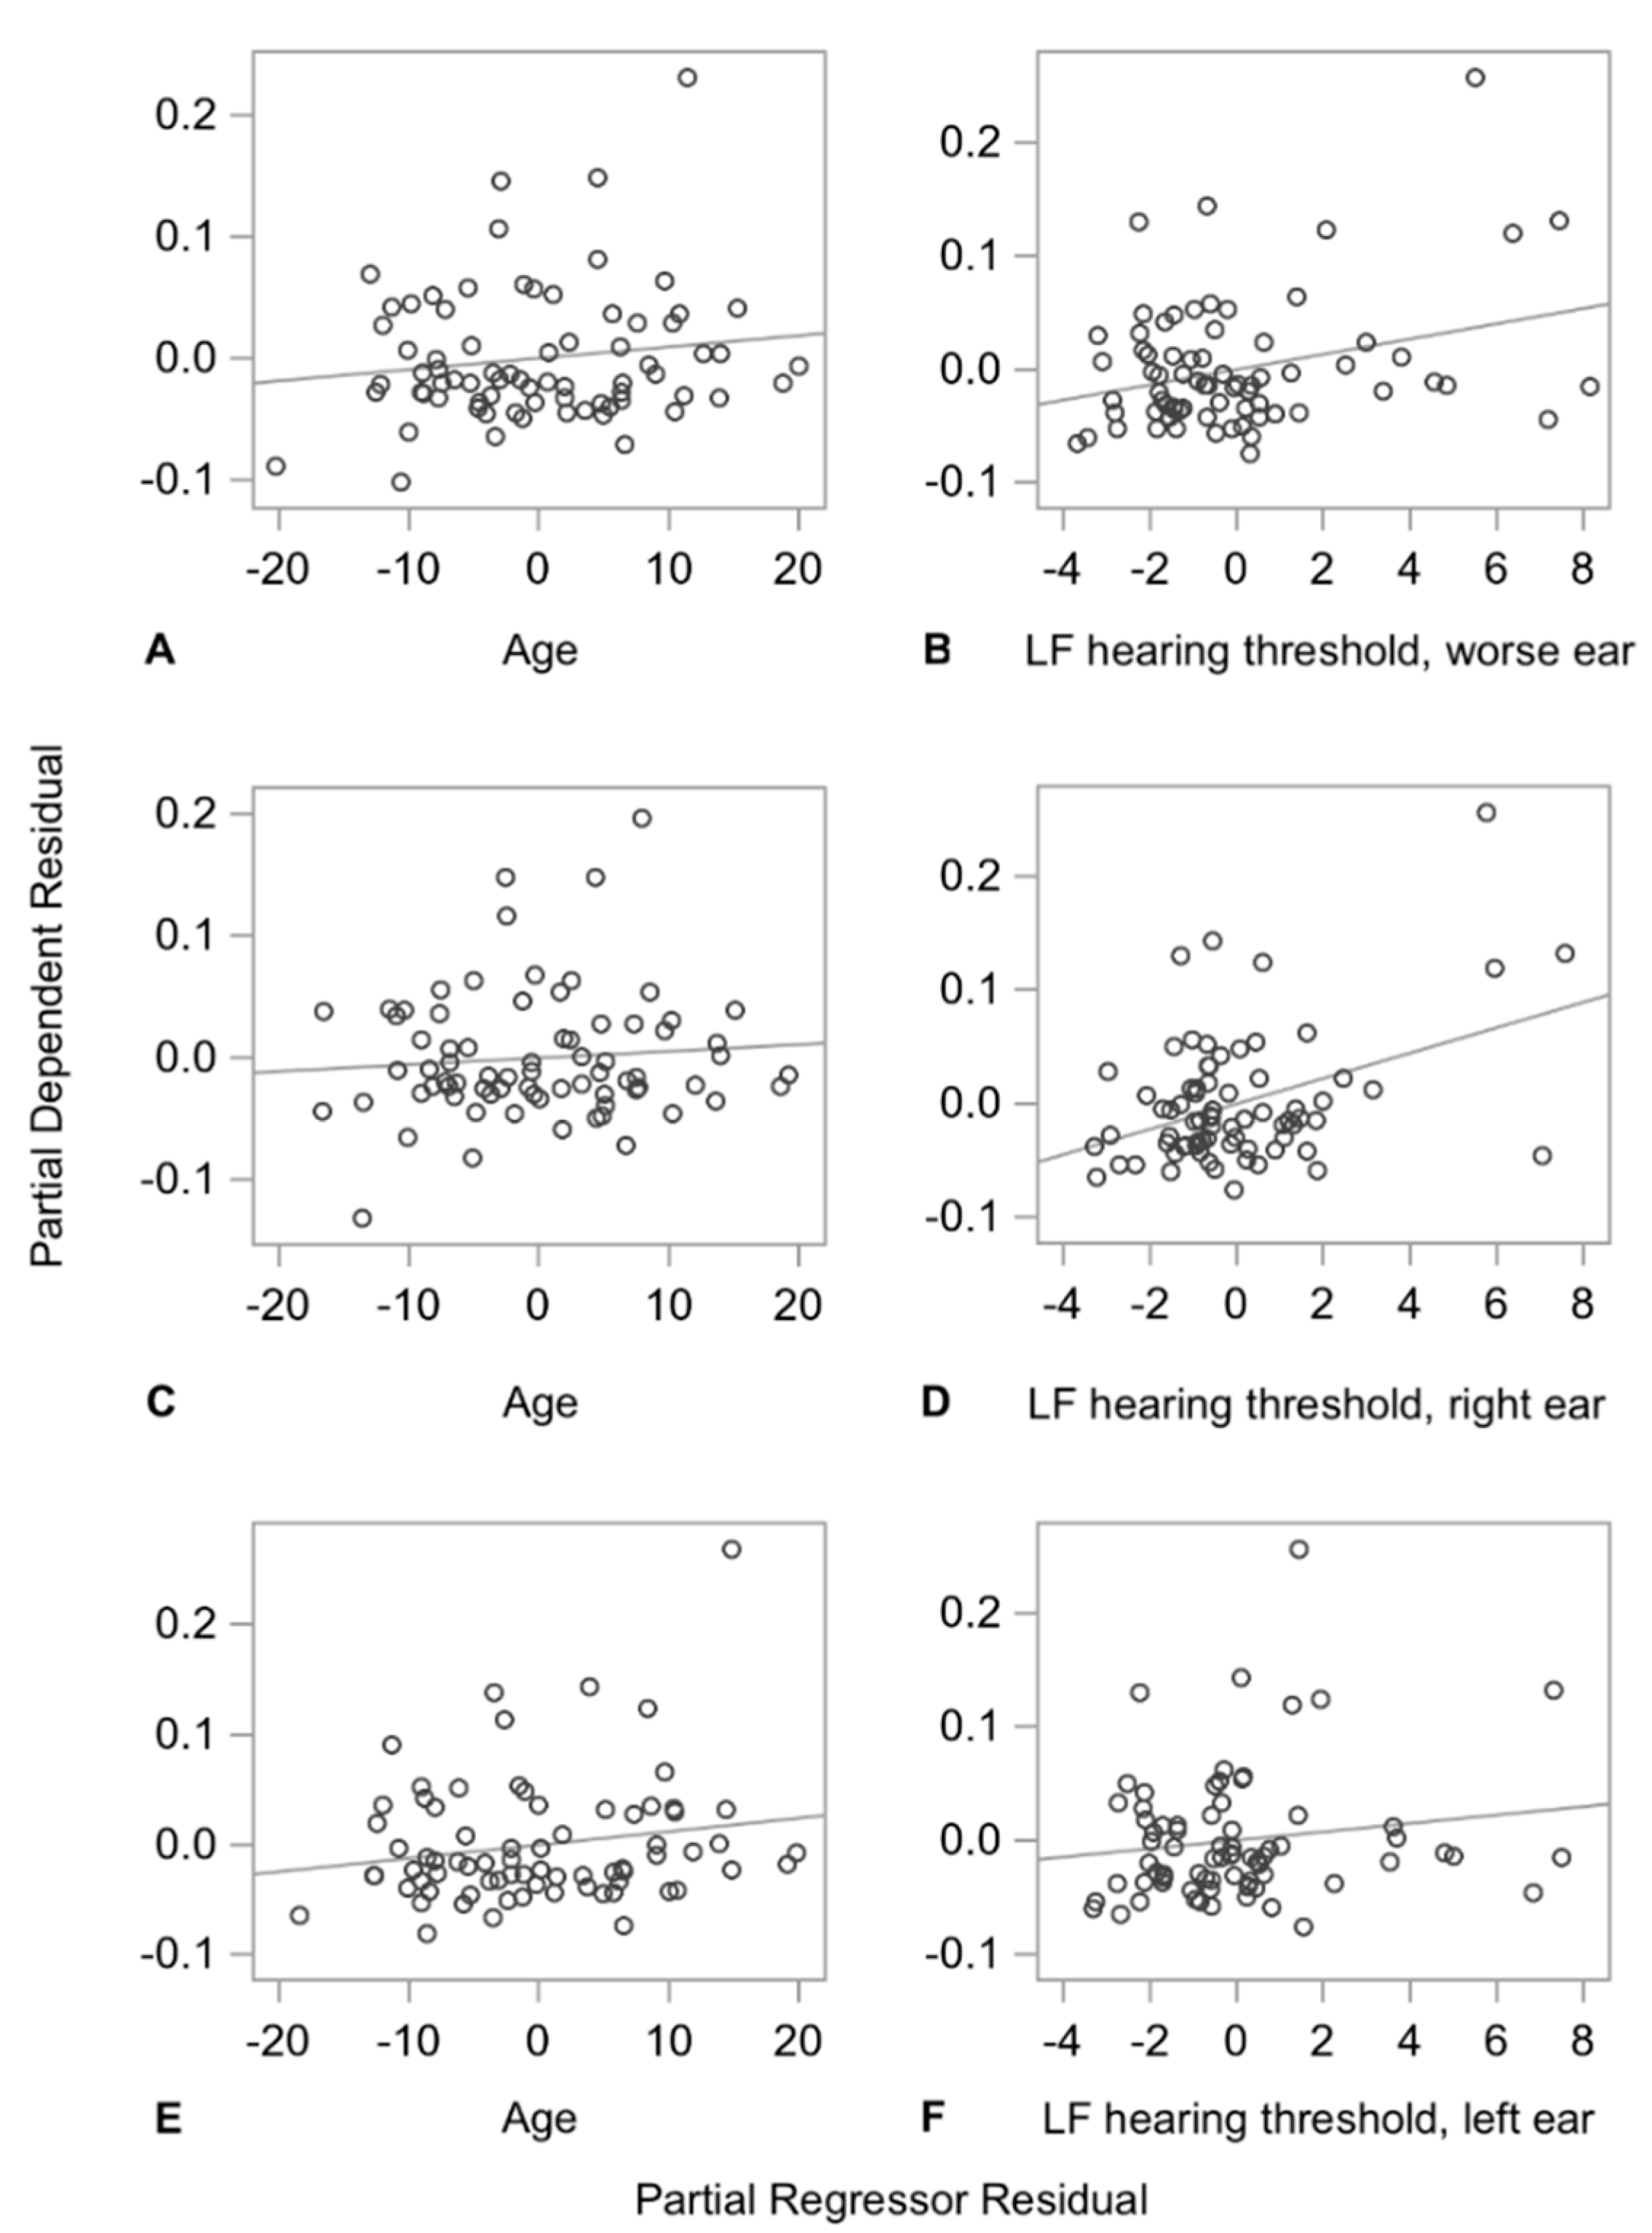
3.2. Multiple Linear Regression

To investigate the relationship between hearing thresholds and gait parameters, linear regression models were employed to model the relationship between each gait parameter as an outcome and the high frequency and low frequency PTA of the poorer hearing ear, respectively, adjusting for age, sex, race/ethnicity, and DHI-S score. Outliers were not excluded from further analyses as there was no evidence of physiologically implausible values indicating measurement errors. A 10 dB increase in high frequency PTA in the poorer hearing ear was associated with an increase in double support period (DSP) CV by 0.814 percentage points (p < 0.01), a decrease in mean normalized stride height by 0.130 percentage points (p < 0.05), and no significant changes in other gait parameters (Table S1). A 10 dB increase in low frequency PTA in the poorer hearing ear was associated with an increase in DSP CV by 0.671 percentage points (p = 0.01) and no changes in other gait parameters (Table S2).
For DSP CV and stride height, linear regression models were also used to model the relationship between these gait parameters and high and low frequency hearing thresholds of the right and left ear. These models were adjusted for age, sex, race/ethnicity, DHI-S score, and the laterality of the poorer hearing ear.
The DSP CV (Table 3) increased by 1.022 (p < 0.01) and 0.759 (p < 0.01) percentage points with every 10 dB increase in high frequency hearing thresholds in the right ear and the left ear, respectively; this increase was greater for increases in the right ear high frequency PTA. All standardized coefficients for the high frequency hearing thresholds were greater than the standardized coefficients for age in the same model, suggesting that the predictive ability of high frequency hearing loss for DSP CV is stronger than that of age. Figure 2 shows the partial regression plots for DSP CV for age and high frequency hearing thresholds for the poorer hearing ear, the right ear, and the left ear.
The DSP CV increased by 1.114 (p = 0.0006) percentage points with every 10 dB increase in low frequency hearing thresholds in the right ear, but not the left ear. The standardized coefficients for the low frequency hearing thresholds of the poorer hearing ear and the right ear were greater than the standardized coefficients for age in the same model, suggesting that the predictive ability of low frequency hearing loss for DSP CV is stronger than that of age. Figure 3 shows the partial regression plots for DSP CV for age and low frequency hearing thresholds for the poorer hearing ear, the right ear, and the left ear.
Stride height was only associated with high frequency hearing thresholds in the poorer hearing ear (Table 4).

4. Discussion

This study examined the relationship between spatiotemporal gait parameters and hearing thresholds in a group of older adults aged 60 to 95. The variability in DSP was found to increase with worsening high and low frequency hearing thresholds. The effect of hearing thresholds was greater than the effect of age on this gait parameter, as demonstrated by the magnitude of the standardized coefficients. The increase in DSP variability was greater for increases in hearing thresholds for the right ear compared to the left ear. Stride height was also found to decrease with increases in the high frequency hearing thresholds of the poorer hearing ear. No association was found between hearing thresholds and all other gait parameters included in the analysis.
Studies investigating the relationship between age, falls, and gait parameters have identified increased variability in gait parameters as a risk factor for falls that increases with age [13,35,36]. Furthermore, gait variability is a hallmark of fear of falling [37]. In particular, increased variability in the DSP has been linked to increased risk of multiple falls in older adults [38]. In nursing home residents with dementia, an increase in double support time variability by 10 percentage points was found to be associated with an increase in odds of falling within a 3-month period by 53% [39]. Double support time variability has also been linked to vestibular asymmetry [40,41], with variability ranging from 2.38% to 3.0% larger in individuals with vestibular asymmetries [41]. DSP is the only interlimb gait parameter analyzed in this study. It defines the period of time during which both feet are in contact with the ground, as the swinging leg meets the ground, and weight is transferred from the support leg to the swinging leg [42]. Increased variability in this gait parameter may indicate poor interlimb coordination and deteriorated balance-control mechanisms [43]. Interlimb coordination has been found to decline with age [44], and impaired interlimb coordination is associated with increased risk of developing mobility limitations [45]. Auditory feedback may be important for coordination by providing temporal and spatial information. In a recent study, Stepanchenko et al. found that deaf children exhibited poorer coordination of the hands and feet compared to healthy controls [46]. Auditory feedback has been found to be important for integrated timing of both hands in the learning of a bimanual task [47] and in improving interlimb coordination in juggling [48]. In this study, we found that variability in DSP increased with increasing hearing thresholds, even after adjusting for age, suggesting that auditory feedback may be important for coordination of both legs during locomotion. It is possible that increased variability in this gait parameter may be one of the mediating factors explaining the relationship between hearing loss and falls.
In a previous study, perceived vestibular impairment, as determined by increased DHI-S score, was associated with changes in several gait parameters, including reduced stride length, cadence, and walking speed, and increased variability in cadence, DSP, swing period, and stance-to-swing [15]. As the auditory and peripheral vestibular systems are intricately linked, one may expect the function of the auditory system to mirror that of the vestibular system, thus hypothesizing that hearing loss may have effects on gait parameters similar to those of vestibular impairment. In contrast, it has been suggested that hearing impairment may have effects on postural instability and impaired balance even beyond the effects of vestibular dysfunction [16]. Of note, the association of increased variability in DSP with increased hearing thresholds persisted even after adjusting for DHI-S score, suggesting that auditory feedback is important for gait coordination such that hearing loss has detrimental effects beyond the effect of vestibular impairment.
Another interesting finding in this study is that the variability of DSP increases more with hearing threshold increases in the right ear compared to the left ear. A right ear advantage for speech has been well-established, and it is thought to reflect left-hemispheric dominance [22]. Right-ear dominance has been demonstrated using otoacoustic emissions and auditory brainstem responses [49], and in children receiving bilateral cochlear implants [50]. Further investigation should determine whether a right ear advantage may also manifest for auditory feedback influencing gait.
This study has several strengths. While hearing loss increases with age, and has also been linked to falls, few studies have investigated the linkage between hearing loss and gait parameters. The use of a custom-engineered footwear-based gait analysis system enabled the collection of spatiotemporal gait parameters with high granularity, in the clinical setting, and without the space constraints associated with traditional gait laboratory equipment. The availability of rich data on hearing thresholds and spatiotemporal gait parameters enabled a thorough analysis of the relationship between spatiotemporal gait parameters and high and low frequency hearing thresholds in the right ear, left ear, and poorer hearing ear.
Our study is limited by its small sample size, which may have affected the ability to detect relationships. Furthermore, it also limited the number of variables we could adjust for in our multivariable analyses; however, we adjusted for age, sex, race, and DHI-S score, which have been previously linked to changes in gait parameters. Prospective falls were not included in this analysis; therefore, definitive conclusions about the role of DSP variability as a mediator between hearing loss and falls cannot be made. Further investigation is warranted to understand these relationships. Finally, ongoing efforts are directed toward improving form factor, weight, accuracy, and usability of the footwear-based gait analysis system [51].

5. Conclusions

In older adults, worsening high and low frequency hearing thresholds were associated with increased variability in DSP. Effects persisted after adjusting for the effects of age and perceived vestibular disability, suggesting that auditory feedback may be important for balance control and interlimb coordination beyond the effects of the peripheral vestibular system. Additionally, the increase in DSP variability was greater for increases in hearing thresholds for the right ear compared to the left ear. Future studies may investigate whether there is a right ear advantage for the influence of auditory feedback on gait.

Supplementary Materials

The following are available online at https://www.mdpi.com/1424-8220/21/1/278/s1, Table S1: Multiple regression models for 10 dB increases in high frequency pure tone averages of the poorer hearing ear, Table S2: Multiple regression models for 10 dB increases in low frequency pure tone averages of the poorer hearing ear.

Author Contributions

Conceptualization, D.Z., S.K.A., and A.K.L.; methodology, D.Z. and A.K.L.; hardware and software, D.Z.; validation, D.Z.; formal analysis, B.S. and D.Z.; investigation, D.Z., E.M.L., J.A.S., J.S.N., and A.R.C.; resources, S.K.A. and A.K.L.; data curation, B.S., D.Z., and J.A.S.; writing—original draft preparation, B.S. and D.Z.; writing—review and editing, B.S., D.Z., A.R.C., A.K.L.; visualization, B.S.; supervision, S.K.A. and A.K.L.; project administration, D.Z. and A.K.L. All authors have read and agreed to the published version of the manuscript.

Funding

This project was partially supported by the Columbia-Coulter Translational Research Partnership.

Institutional Review Board Statement

The study was conducted according to the guidelines of the Declaration of Helsinki, and approved by the Institutional Review Board of Columbia University Irving Medical Center (protocol AAAN3450).

Informed Consent Statement

Informed consent was obtained from all subjects involved in the study.

Data Availability Statement

The data presented in this study are available on request from the corresponding author. The data are not publicly available due to participant confidentiality.

Acknowledgments

The authors gratefully acknowledge Jimmy K. Duong for statistical consultation.

Conflicts of Interest

The authors declare no conflict of interest.

References

  1. Lin, F.R.; Thorpe, R.; Gordon-Salant, S.; Ferrucci, L. Hearing loss prevalence and risk factors among older adults in the United States. J. Gerontol. A Biol. Sci. Med. Sci. 2011, 66, 582–590. [Google Scholar] [CrossRef] [PubMed]
  2. Viljanen, A.; Kaprio, J.; Pyykkö, I.; Sorri, M.; Koskenvuo, M.; Rantanen, T. Hearing acuity as a predictor of walking difficulties in older women. J. Am. Geriatr. Soc. 2009, 57, 2282–2286. [Google Scholar] [CrossRef] [PubMed]
  3. Lin, F.R.; Ferrucci, L. Hearing loss and falls among older adults in the United States. Arch. Intern. Med. 2012, 172, 369–371. [Google Scholar] [CrossRef] [PubMed]
  4. Mahmoudi, E.; Basu, T.; Langa, K.; McKee, M.M.; Zazove, P.; Alexander, N.; Kamdar, N. Can Hearing Aids Delay Time to Diagnosis of Dementia, Depression, or Falls in Older Adults? J. Am. Geriatr. Soc. 2019, 67, 2362–2369. [Google Scholar] [CrossRef]
  5. Tiase, V.L.; Tang, K.; Vawdrey, D.K.; Raso, R.; Adelman, J.S.; Yu, S.P.; Applebaum, J.R.; Lalwani, A.K. Impact of Hearing Loss on Patient Falls in the Inpatient Setting. Am. J. Prev. Med. 2020, 58, 839–844. [Google Scholar] [CrossRef]
  6. Bergen, G.; Stevens, M.R.; Burns, E.R. Falls and Fall Injuries Among Adults Aged ≥65 Years—United States, 2014. MMWR Morb. Mortal. Wkly. Rep. 2016, 65, 993–998. [Google Scholar] [CrossRef]
  7. Ambrose, A.F.; Paul, G.; Hausdorff, J.M. Risk factors for falls among older adults: A review of the literature. Maturitas 2013, 75, 51–61. [Google Scholar] [CrossRef]
  8. Fletcher, P.C.; Hirdes, J.P. Restriction in activity associated with fear of falling among community-based seniors using home care services. Age Ageing 2004, 33, 273–279. [Google Scholar] [CrossRef] [Green Version]
  9. Burns, E.; Kakara, R. Deaths from Falls Among Persons Aged ≥65 Years—United States, 2007-2016. MMWR Morb. Mortal. Wkly. Rep. 2018, 67, 509–514. [Google Scholar] [CrossRef] [Green Version]
  10. Scheffer, A.C.; Schuurmans, M.J.; van Dijk, N.; van der Hooft, T.; de Rooij, S.E. Fear of falling: Measurement strategy, prevalence, risk factors and consequences among older persons. Age Ageing 2008, 37, 19–24. [Google Scholar] [CrossRef] [Green Version]
  11. Tinetti, M.E.; Speechley, M.; Ginter, S.F. Risk factors for falls among elderly persons living in the community. N. Engl. J. Med. 1988, 319, 1701–1707. [Google Scholar] [CrossRef] [PubMed]
  12. Osoba, M.Y.; Rao, A.K.; Agrawal, S.K.; Lalwani, A.K. Balance and gait in the elderly: A contemporary review. Laryngoscope Investig. Otolaryngol. 2019, 4, 143–153. [Google Scholar] [CrossRef] [PubMed] [Green Version]
  13. Menz, H.B.; Lord, S.R.; Fitzpatrick, R.C. Age-related differences in walking stability. Age Ageing 2003, 32, 137–142. [Google Scholar] [CrossRef] [PubMed] [Green Version]
  14. Mortaza, N.; Abu Osman, N.A.; Mehdikhani, N. Are the spatio-temporal parameters of gait capable of distinguishing a faller from a non-faller elderly? Eur. J. Phys. Rehabil. Med. 2014, 50, 677–691. [Google Scholar]
  15. Zanotto, D.; Mamuyac, E.M.; Chambers, A.R.; Nemer, J.S.; Stafford, J.A.; Agrawal, S.K.; Lalwani, A.K. Dizziness Handicap Inventory Score Is Highly Correlated With Markers of Gait Disturbance. Otol. Neurotol. 2017, 38, 1490–1499. [Google Scholar] [CrossRef]
  16. Berge, J.E.; Nordahl, S.H.G.; Aarstad, H.J.; Goplen, F.K. Hearing as an Independent Predictor of Postural Balance in 1075 Patients Evaluated for Dizziness. Otolaryngol. Head Neck Surg. 2019, 161, 478–484. [Google Scholar] [CrossRef]
  17. Kennel, C.; Streese, L.; Pizzera, A.; Justen, C.; Hohmann, T.; Raab, M. Auditory reafferences: The influence of real-time feedback on movement control. Front. Psychol. 2015, 6, 69. [Google Scholar] [CrossRef] [Green Version]
  18. Sallard, E.; Spierer, L.; Ludwig, C.; Deiber, M.P.; Barral, J. Age-related changes in the bimanual advantage and in brain oscillatory activity during tapping movements suggest a decline in processing sensory reafference. Exp. Brain Res. 2014, 232, 469–479. [Google Scholar] [CrossRef] [Green Version]
  19. Cornwell, T.; Woodward, J.; Wu, M.M.; Jackson, B.; Souza, P.; Siegel, J.; Dhar, S.; Gordon, K.E. Walking with Ears: Altered Auditory Feedback Impacts Gait Step Length in Older Adults. Front. Sports Act. Living 2020, 2. [Google Scholar] [CrossRef] [Green Version]
  20. Bainbridge, K.E.; Wallhagen, M.I. Hearing loss in an aging American population: Extent, impact, and management. Annu. Rev. Public Health 2014, 35, 139–152. [Google Scholar] [CrossRef] [Green Version]
  21. Kohlberg, G.D.; Demmer, R.T.; Lalwani, A.K. Adolescent Obesity Is an Independent Risk Factor for Sensorineural Hearing Loss: Results From the National Health and Nutrition Examination Survey 2005 to 2010. Otol. Neurotol. 2018, 39, 1102–1108. [Google Scholar] [CrossRef] [PubMed]
  22. Lazard, D.S.; Collette, J.L.; Perrot, X. Speech processing: From peripheral to hemispheric asymmetry of the auditory system. Laryngoscope 2012, 122, 167–173. [Google Scholar] [CrossRef] [PubMed]
  23. Zanotto, D.; Turchet, L.; Boggs, E.M.; Agrawal, S.K. SoleSound: Towards a novel portable system for audio-tactile underfoot feedback. In Proceedings of the 5th IEEE RAS/EMBS International Conference on Biomedical Robotics and Biomechatronics, São Paulo, Brazil, 12–15 August 2014; pp. 193–198. [Google Scholar]
  24. Minto, S.; Zanotto, D.; Boggs, E.M.; Rosati, G.; Agrawal, S.K. Validation of a Footwear-Based Gait Analysis System with Action-Related Feedback. IEEE Trans. Neural. Syst. Rehabil. Eng. 2016, 24, 971–980. [Google Scholar] [CrossRef] [PubMed]
  25. Montes, J.; Zanotto, D.; Dunaway Young, S.; Salazar, R.; De Vivo, D.C.; Agrawal, S. Gait assessment with solesound instrumented footwear in spinal muscular atrophy. Muscle Nerve 2017, 56, 230–236. [Google Scholar] [CrossRef] [PubMed]
  26. Hof, A.L. Scaling gait data to body size. Gait Posture 1996, 4, 222–223. [Google Scholar] [CrossRef]
  27. Hollman, J.H.; Childs, K.B.; McNeil, M.L.; Mueller, A.C.; Quilter, C.M.; Youdas, J.W. Number of strides required for reliable measurements of pace, rhythm and variability parameters of gait during normal and dual task walking in older individuals. Gait Posture 2010, 32, 23–28. [Google Scholar] [CrossRef] [PubMed]
  28. Lord, S.; Howe, T.; Greenland, J.; Simpson, L.; Rochester, L. Gait variability in older adults: A structured review of testing protocol and clinimetric properties. Gait Posture 2011, 34, 443–450. [Google Scholar] [CrossRef]
  29. Jacobson, G.P.; Newman, C.W. The development of the Dizziness Handicap Inventory. Arch. Otolaryngol. Head Neck Surg. 1990, 116, 424–427. [Google Scholar] [CrossRef]
  30. Mutlu, B.; Serbetcioglu, B. Discussion of the dizziness handicap inventory. J. Vestib. Res. 2013, 23, 271–277. [Google Scholar] [CrossRef]
  31. Ardıç, F.N.; Tümkaya, F.; Akdağ, B.; Şenol, H. The subscales and short forms of the dizziness handicap inventory: Are they useful for comparison of the patient groups? Disabil. Rehabil. 2017, 39, 2119–2122. [Google Scholar] [CrossRef]
  32. Cook, R.D.; Weisberg, S. Residuals and Influence in Regression; Chapman and Hall: New York, NY, USA, 1982. [Google Scholar]
  33. Cook, R.D. Detection of Influential Observation in Linear Regression. Technometrics 1977, 19, 15–18. [Google Scholar] [CrossRef]
  34. Stevens, J.P. Outliers and influential data points in regression analysis. Psychol. Bull. 1984, 95, 334–344. [Google Scholar] [CrossRef]
  35. Hausdorff, J.M.; Rios, D.A.; Edelberg, H.K. Gait variability and fall risk in community-living older adults: A 1-year prospective study. Arch. Phys. Med. Rehabil. 2001, 82, 1050–1056. [Google Scholar] [CrossRef] [PubMed]
  36. Hausdorff, J.M. Gait variability: Methods, modeling and meaning. J. Neuroeng. Rehabil. 2005, 2, 19. [Google Scholar] [CrossRef] [PubMed] [Green Version]
  37. Reelick, M.F.; van Iersel, M.B.; Kessels, R.P.; Rikkert, M.G. The influence of fear of falling on gait and balance in older people. Age Ageing 2009, 38, 435–440. [Google Scholar] [CrossRef] [PubMed] [Green Version]
  38. Callisaya, M.L.; Blizzard, L.; Schmidt, M.D.; Martin, K.L.; McGinley, J.L.; Sanders, L.M.; Srikanth, V.K. Gait, gait variability and the risk of multiple incident falls in older people: A population-based study. Age Ageing 2011, 40, 481–487. [Google Scholar] [CrossRef] [PubMed] [Green Version]
  39. Sterke, C.S.; van Beeck, E.F.; Looman, C.W.N.; Kressig, R.W.; van der Cammen, T.J.M. An electronic walkway can predict short-term fall risk in nursing home residents with dementia. Gait Posture 2012, 36, 95–101. [Google Scholar] [CrossRef] [PubMed]
  40. Larsson, J.; Ekvall Hansson, E.; Miller, M. Increased double support variability in elderly female fallers with vestibular asymmetry. Gait Posture 2015, 41, 820–824. [Google Scholar] [CrossRef]
  41. Larsson, J.; Miller, M.; Hansson, E.E. Vestibular asymmetry increases double support time variability in a counter-balanced study on elderly fallers. Gait Posture 2016, 45, 31–34. [Google Scholar] [CrossRef]
  42. Perry, J.; Davids, J.R. Gait analysis: Normal and pathological function. J. Pediatric Orthop. 1992, 12, 815. [Google Scholar] [CrossRef]
  43. Gabell, A.; Nayak, U.S. The effect of age on variability in gait. J. Gerontol. 1984, 39, 662–666. [Google Scholar] [CrossRef] [PubMed]
  44. Serrien, D.J.; Swinnen, S.P.; Stelmach, G.E. Age-related deterioration of coordinated interlimb behavior. J. Gerontol. B Psychol. Sci. Soc. Sci. 2000, 55, P295–P303. [Google Scholar] [CrossRef] [PubMed] [Green Version]
  45. James, E.G.; Leveille, S.G.; Hausdorff, J.M.; Travison, T.; Kennedy, D.N.; Tucker, K.L.; Al Snih, S.; Markides, K.S.; Bean, J.F. Rhythmic Interlimb Coordination Impairments and the Risk for Developing Mobility Limitations. J. Gerontol. Ser. A Biol. Sci. Med. Sci. 2017, 72, 1143–1148. [Google Scholar] [CrossRef] [Green Version]
  46. Stepanchenko, N.; Hrybovska, I.; Danylevych, M.; Hryboskyy, R. Aspects of psychomotor development of primary school children with hearing loss from the standpoint of Bernstein’s theory of movement construction. Pedagog. Phys. Cult. Sports 2020, 24, 151–156. [Google Scholar] [CrossRef] [Green Version]
  47. Ronsse, R.; Puttemans, V.; Coxon, J.P.; Goble, D.J.; Wagemans, J.; Wenderoth, N.; Swinnen, S.P. Motor learning with augmented feedback: Modality-dependent behavioral and neural consequences. Cereb. Cortex 2011, 21, 1283–1294. [Google Scholar] [CrossRef] [Green Version]
  48. Zelic, G.; Mottet, D.; Lagarde, J. Audio-tactile events can improve the interlimb coordination in Juggling. BIO Web Conf. 2011, 1, 00102. [Google Scholar] [CrossRef]
  49. Keefe, D.H.; Gorga, M.P.; Jesteadt, W.; Smith, L.M. Ear asymmetries in middle-ear, cochlear, and brainstem responses in human infants. J. Acoust. Soc. Am. 2008, 123, 1504–1512. [Google Scholar] [CrossRef] [Green Version]
  50. Henkin, Y.; Swead, R.T.; Roth, D.A.; Kishon-Rabin, L.; Shapira, Y.; Migirov, L.; Hildesheimer, M.; Kaplan-Neeman, R. Evidence for a right cochlear implant advantage in simultaneous bilateral cochlear implantation. Laryngoscope 2014, 124, 1937–1941. [Google Scholar] [CrossRef]
  51. Zhang, H.; Guo, Y.; Zanotto, D. Accurate ambulatory gait analysis in walking and running using machine learning models. IEEE Trans. Neural Syst. Rehabil. Eng. 2019, 28, 191–202. [Google Scholar] [CrossRef]
Figure 1. Participant walking while wearing custom-engineered footwear developed in the Columbia University Robotics and Rehabilitation Laboratory. Each participant completed a 100-m-long course.
Sensors 21 00278 g001
Figure 2. Partial regression plots for double support period (DSP) CV for age, and high frequency hearing thresholds for the poorer hearing ear, the right ear, and the left ear. Each plot illustrates the strength of the relationship between DSP CV and age (A,C,E), or high frequency hearing thresholds of the poorer hearing ear (B), the right ear (D), or the left ear (F). The y axis represents the residuals from regressing DSP CV against all the predictors but one (age, or high frequency hearing threshold). The x axis represents the residuals from regressing the omitted predictor against the remaining predictors in the model. There is a strong positive relationship between variability in DSP and high frequency hearing thresholds for the poorer hearing ear, the right ear, and the left ear, respectively. HF indicates high frequency.
Sensors 21 00278 g002
Figure 3. Partial regression plots for double support period (DSP) CV for age and low frequency hearing thresholds for the poorer hearing ear, the right ear, and the left ear. Each plot illustrates the strength of the relationship between DSP CV and age (A,C,E), or low frequency hearing thresholds of the poorer hearing ear (B), the right ear (D), or the left ear (F). There is a strong positive relationship between variability in DSP and low frequency hearing thresholds for the poorer hearing ear and the right ear, respectively. LF indicates low frequency.
Sensors 21 00278 g003
Table 1. Demographic characteristics of study sample.
CharacteristicN = 80
Age, mean ± SD73.7 ± 8.8
Sex, N (%)
  Male37 (46.2)
  Female43 (53.8)
Race/Ethnicity, N (%)
  Non-Hispanic White42 (52.5)
  All others38 (47.5)
BMI, kg/m2, mean ± SD26.3 ± 4.0
Height, m, mean ± SD1.67 ± 0.09
Weight, kg, mean ± SD71.2 ± 15.2
Hearing parameters, mean ± SD
  Low frequency PTA, poorer hearing ear 44.4 ± 27.2
  Low frequency PTA, right ear37.4 ± 23.9
  Low frequency PTA, left ear37.4 ± 23.7
  High frequency PTA, poorer hearing ear61.1 ± 24.7
  High frequency PTA, right ear52.2 ± 23.5
  High frequency PTA, left ear55.9 ± 24.5
Low frequency PTA, poorer hearing ear, N (%)
  0 to 25 dB22 (27.5)
  >25 dB to 40 dB22 (27.5)
  >40 dB to 60 dB22 (27.5)
  >60 dB to 80 dB6 (7.5)
  >80 dB 8 (10.0)
High frequency PTA, poorer hearing ear, N (%)
  0 to 25 dB4 (5.0)
  >25 dB to 40 dB14 (17.5)
  >40 dB to 60 dB23 (28.8)
  >60 dB to 80 dB21 (26.3)
  >80 dB 18 (22.5)
DHI-S score, mean ± SD6.3 ± 8.5
Chief complaints
  Hearing loss70 (87.5)
  Tinnitus34 (42.5)
  Dizziness or Imbalance41 (51.3)
  Other12 (15.2)
Abbreviations: PTA, pure tone average; DHI-S, Dizziness Handicap Inventory–Screening version score.
Table 2. Mean and coefficient of variation (CV) for temporal and spatial gait parameters.
Gait ParameterNMeanSDMinMax
Cadence
  Mean (stp/min)8010810.773.6130.6
  CV (%)802.711.16.1
Double supp. period
  Mean (%)74102.64.815.5
  CV (%)7410.464.140.9
Stride Height
  Mean (m)800.150.0260.0910.257
  CV (%)809.59.92.545.5
Normalized Stride Height
  Mean (%)809.11.45.614.5
  CV (%)809.59.92.545.5
Stride Length
  Mean (m)801.2230.210.5831.592
  CV (%)804.82.81.916.6
Normalized Stride Length
  Mean (%)8073.711.735.993.6
  CV (%)804.82.81.916.6
Stance-to-swing
  Mean801.520.161.221.9
  CV (%)805.73.32.322.6
Swing period
  Mean (%)8039.92.534.545.2
  CV (%)803.31.61.39.9
Walking Speed
  Mean (m/s)801.1110.2430.4751.54
  CV (%)805.93.32.420.6
Normalized Walking Speed
  Mean (%)8027.55.911.937.7
  CV (%)805.93.32.420.6
Abbreviations: CV, coefficient of variation.
Table 3. Multiple regression models for the outcome double support period CV for 10 dB increases in different hearing thresholds.
OutcomePTANR2BPTAp-ValueBDHI-Sp-ValueBagep-ValueβPTAβDHI-Sβage
Double supp. period CV (%)HF, poorer ear740.18950.8140.00550.0920.23000.0510.52860.334490.133810.07512
HF, right ear740.22771.0220.00420.0940.21430.0200.81860.386640.137200.02889
HF, left ear740.20990.7590.00960.1050.17280.0680.40110.316130.152090.10006
LF, poorer ear740.17500.6710.01070.0530.50550.0920.24000.304660.076770.13561
LF, right ear740.23971.1140.00060.0430.58420.0540.48190.430710.061830.07994
LF, left ear740.11180.3720.22090.0900.27920.1210.13470.151380.130630.17860
Abbreviations: PTA, pure tone average; HF, high frequency; LF, low frequency; DHI-S, Dizziness Handicap Inventory–Screening version score; CV, coefficient of variation; R2, coefficient of determination; B, unstandardized regression coefficient; β, standardized regression coefficient. p-Values < 0.05 are bolded.
Table 4. Multiple regression models for the outcome normalized stride height (%) for 10 dB increases in different hearing thresholds.
OutcomePTANR2BPTAp-ValueBDHI-Sp-ValueBagep-ValueβPTAβDHI-Sβage
Normalized stride height, mean (%)HF, poorer ear800.1535−0.1300.04910.0070.7059−0.0190.3052−0.226890.04105−0.11807
HF, right ear800.1514−0.1360.08590.0090.6160−0.0160.4159−0.225880.05556−0.09887
HF, left ear800.1588−0.1290.05810.0090.6027−0.0180.3391−0.225170.05744−0.11150
LF, poorer ear800.1293−0.0790.17940.0110.5625−0.0270.1353−0.152570.06531−0.16786
LF, right ear800.1414−0.0810.25550.0150.4326−0.0270.1438−0.137590.09062−0.16633
LF, left ear800.1401−0.0750.27710.0140.4673−0.0290.1041−0.126820.08328−0.18171
Abbreviations: PTA, pure tone average; HF, high frequency; LF, low frequency; DHI-S, Dizziness Handicap Inventory–Screening version score; CV, coefficient of variation; R2, coefficient of determination; B, unstandardized regression coefficient; β, standardized regression coefficient. p-Values < 0.05 are bolded.
Publisher’s Note: MDPI stays neutral with regard to jurisdictional claims in published maps and institutional affiliations.

