A Cloud-Based IoT Platform for Precision Control of Soilless Greenhouse Cultivation


Abstract
1. Introduction
1.1. Related Work
1.2. Problem Statement and Motivation
- Establish a multi-tier cloud-based IoT platform for monitoring, controlling, and managing the greenhouse microclimate.
- Implement the established platform in precision control of soilless greenhouse cultivation (cucumber as a case study) in arid regions.
- Investigate impact of the overall established cultivation system on the crop yield and product quality.
- Improve water use efficiency and electrical energy productivity.
2. Material and Methods
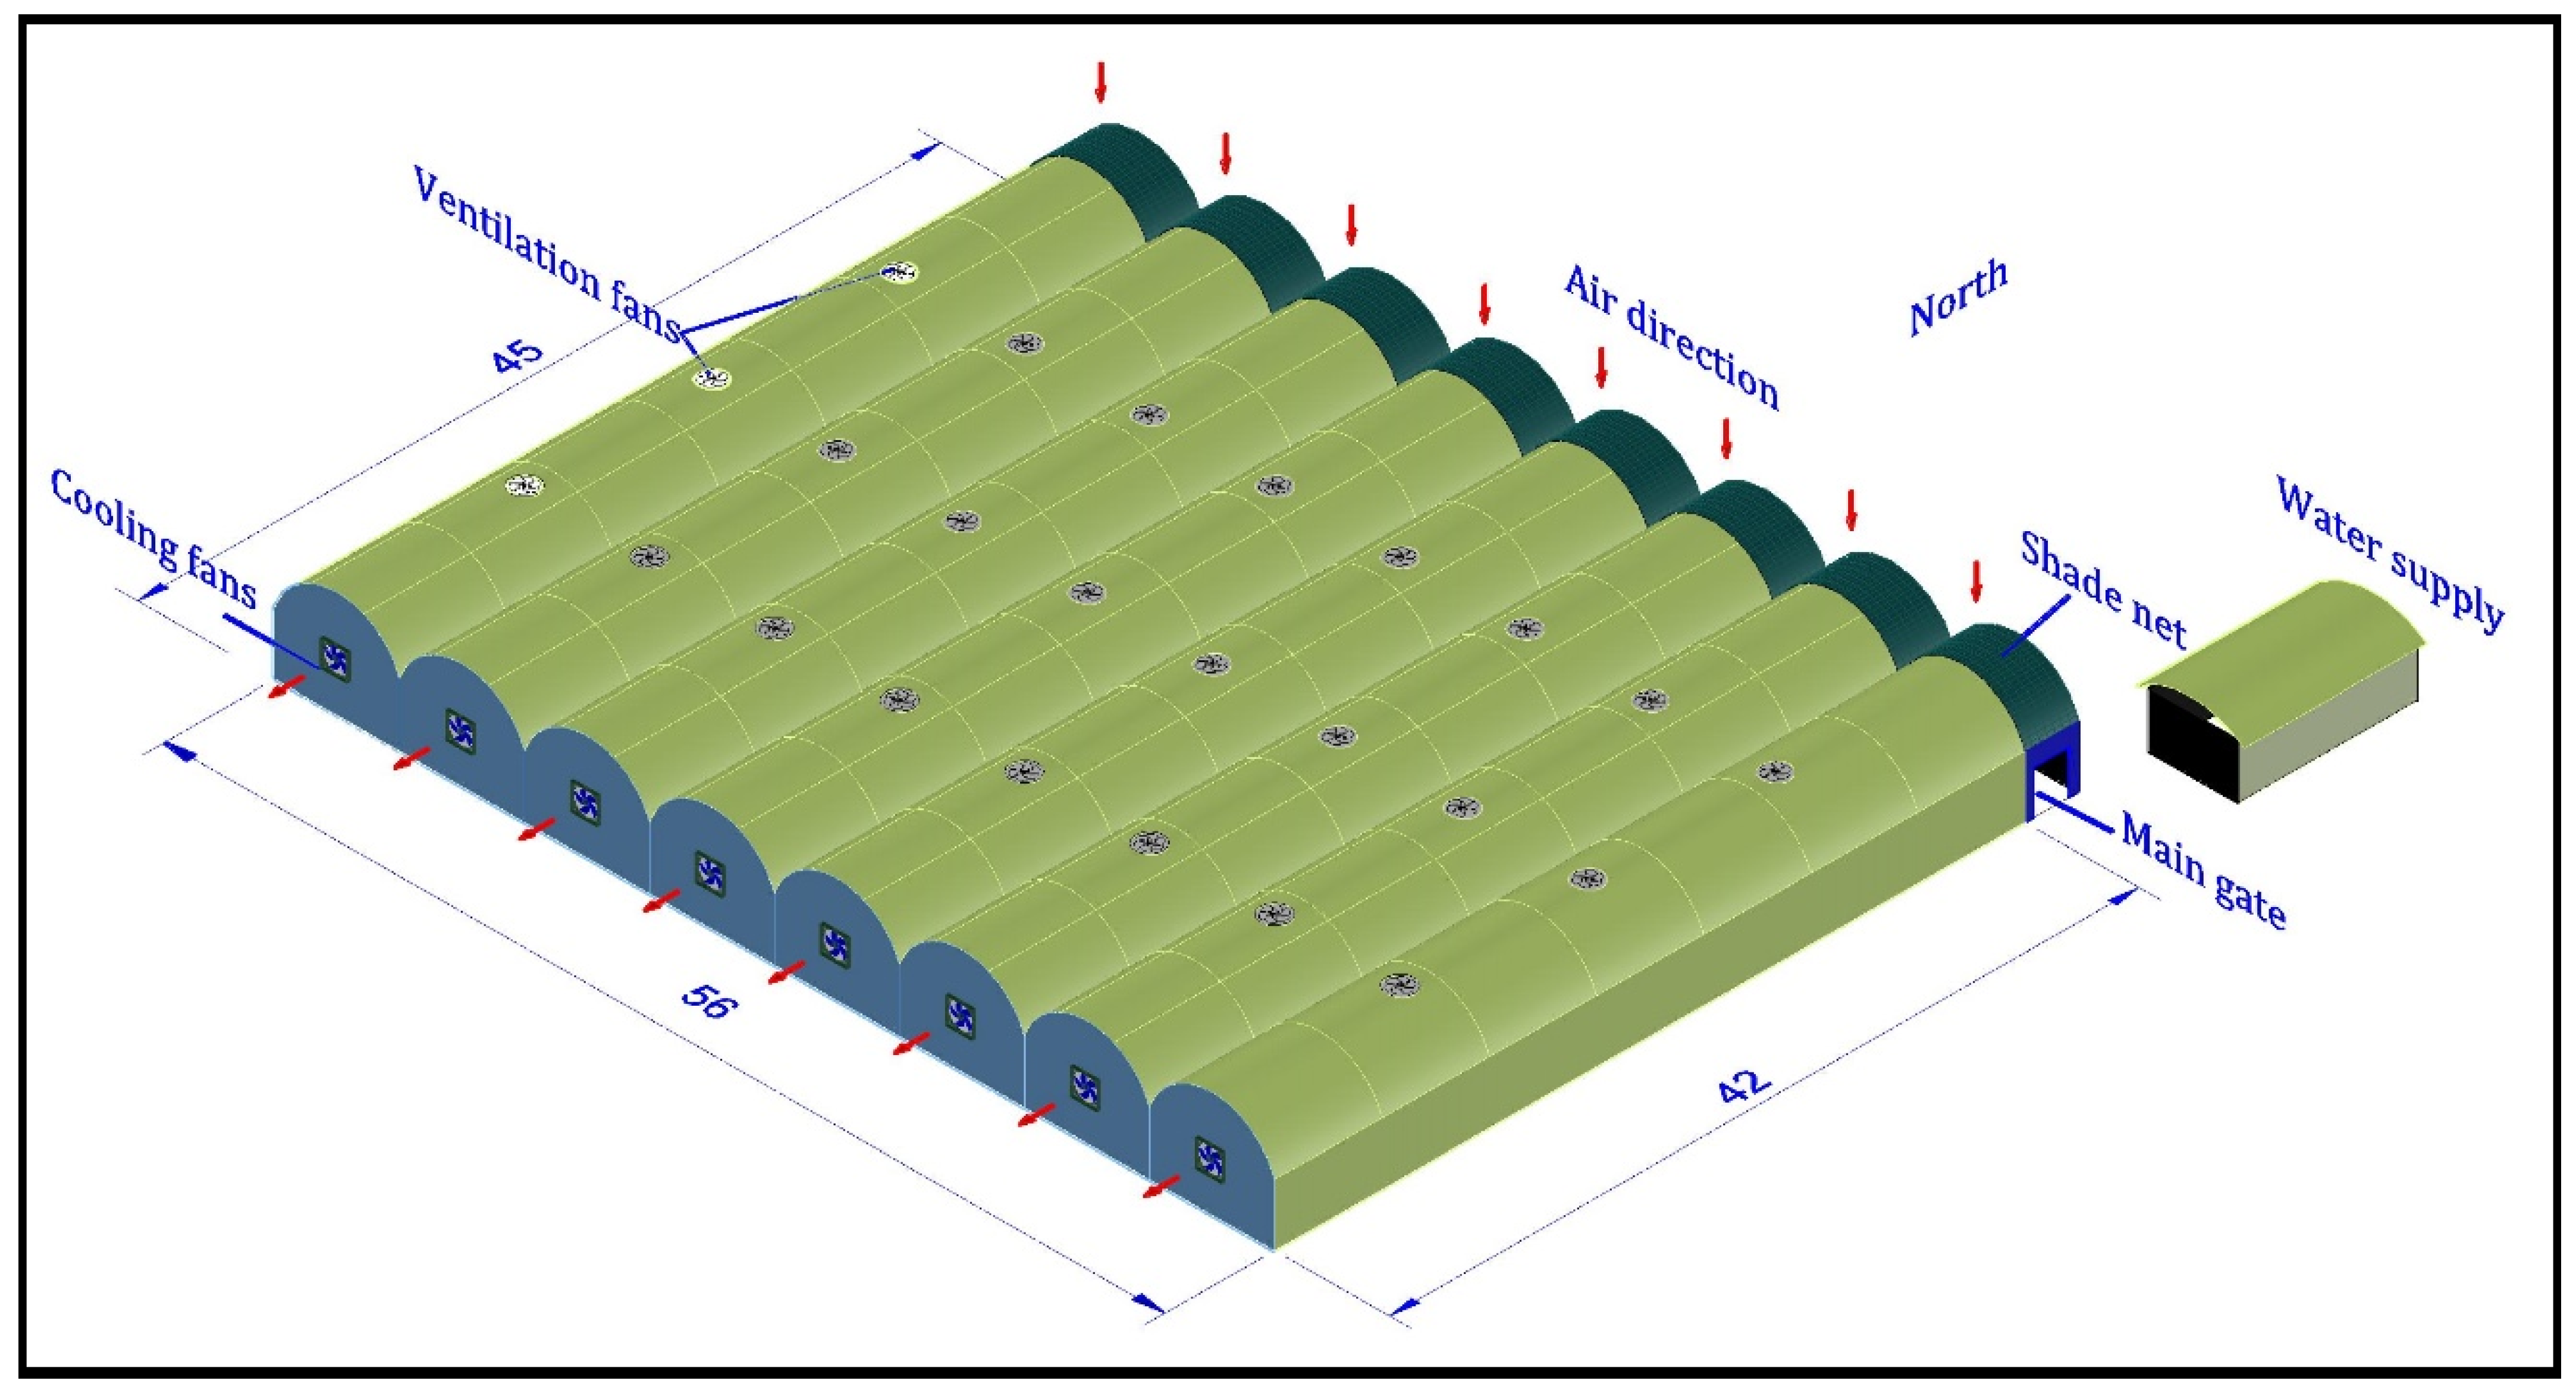
2.1. Greenhouse Description
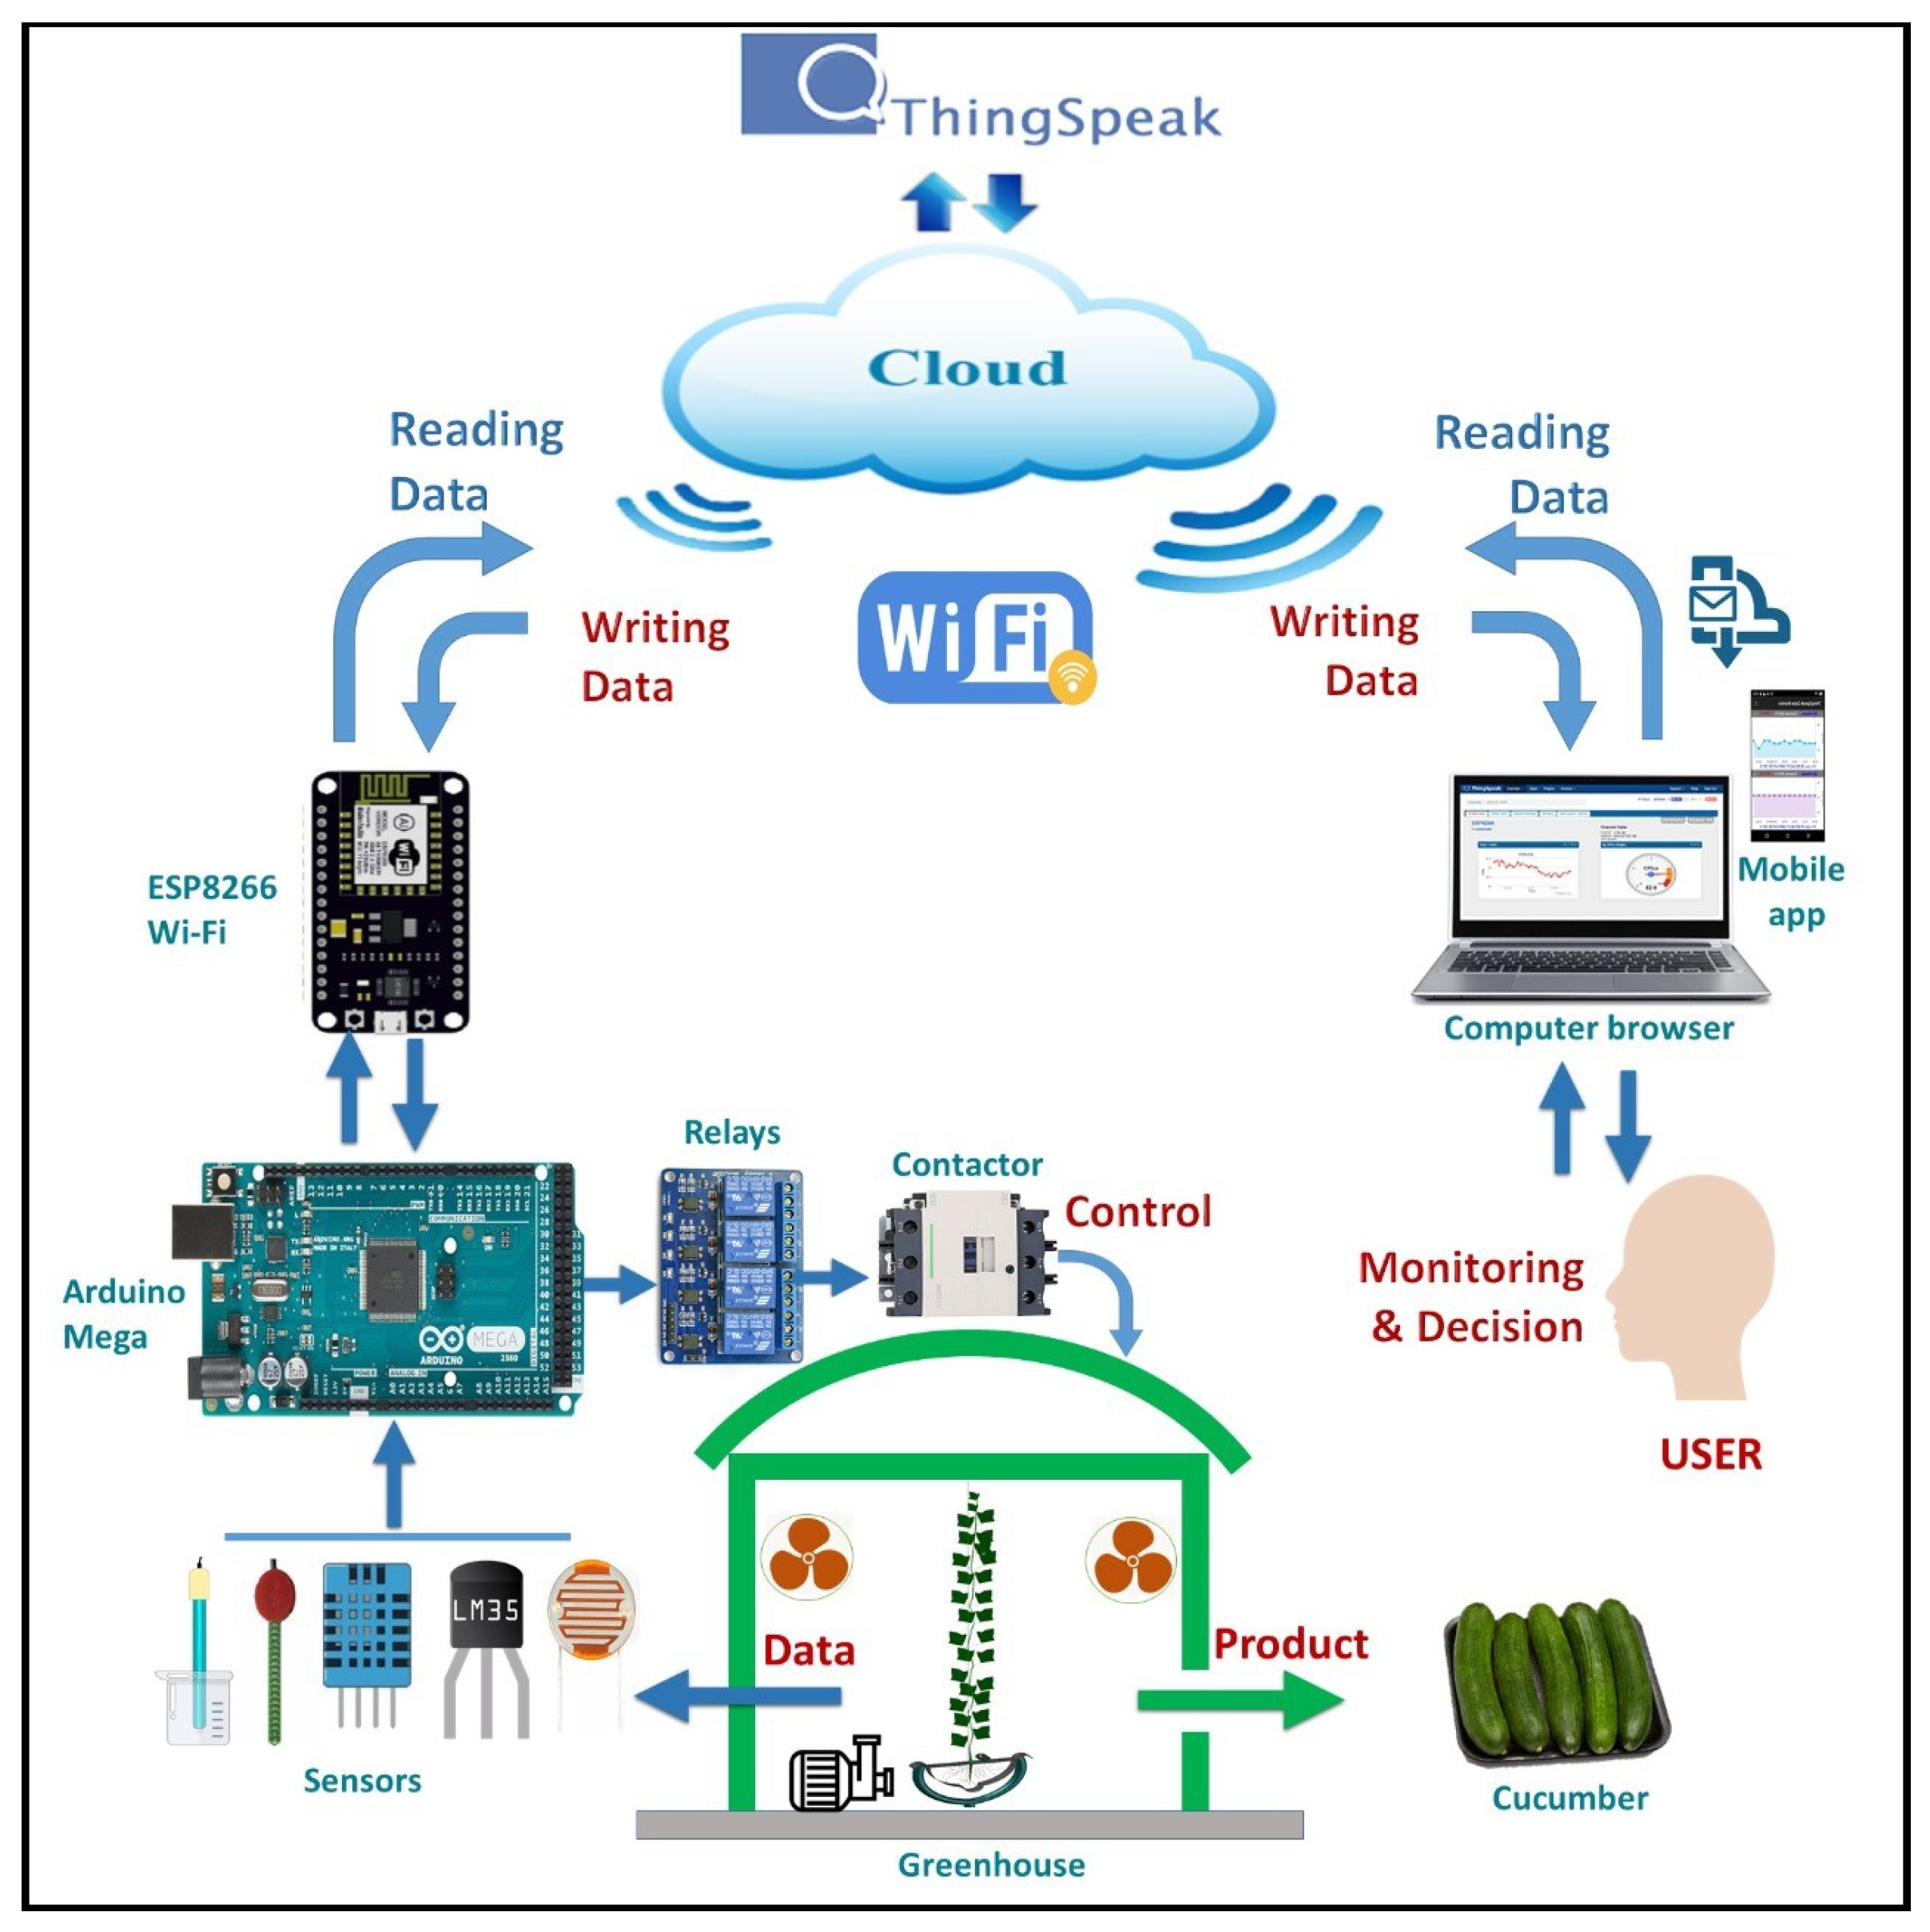
2.2. System Architecture
- Arduino microcontroller,
- A set of sensors that can be connected to the Arduino microcontroller,
- A Wi-Fi module,
- A set of motors/fans,
- ThingSpeak cloud platform, and
- User interface.
2.2.1. Simulation Environment
- DHT11 Digital Temperature & Humidity sensor,
- Analog pH sensor,
- LM35 Soil Temperature sensor,
- VH400 Soil Moisture Content sensor,
- MQ135 CO Gas sensor,
- Light Dependent Resistor (LDR)/Photoresistor,
- ESP8226 Highly Integrated Wi-Fi,
- 16 × 2 Character LCD,
- Virtual Terminal,
- G5CE-14-DC5 Relay,
- Us Resistors,
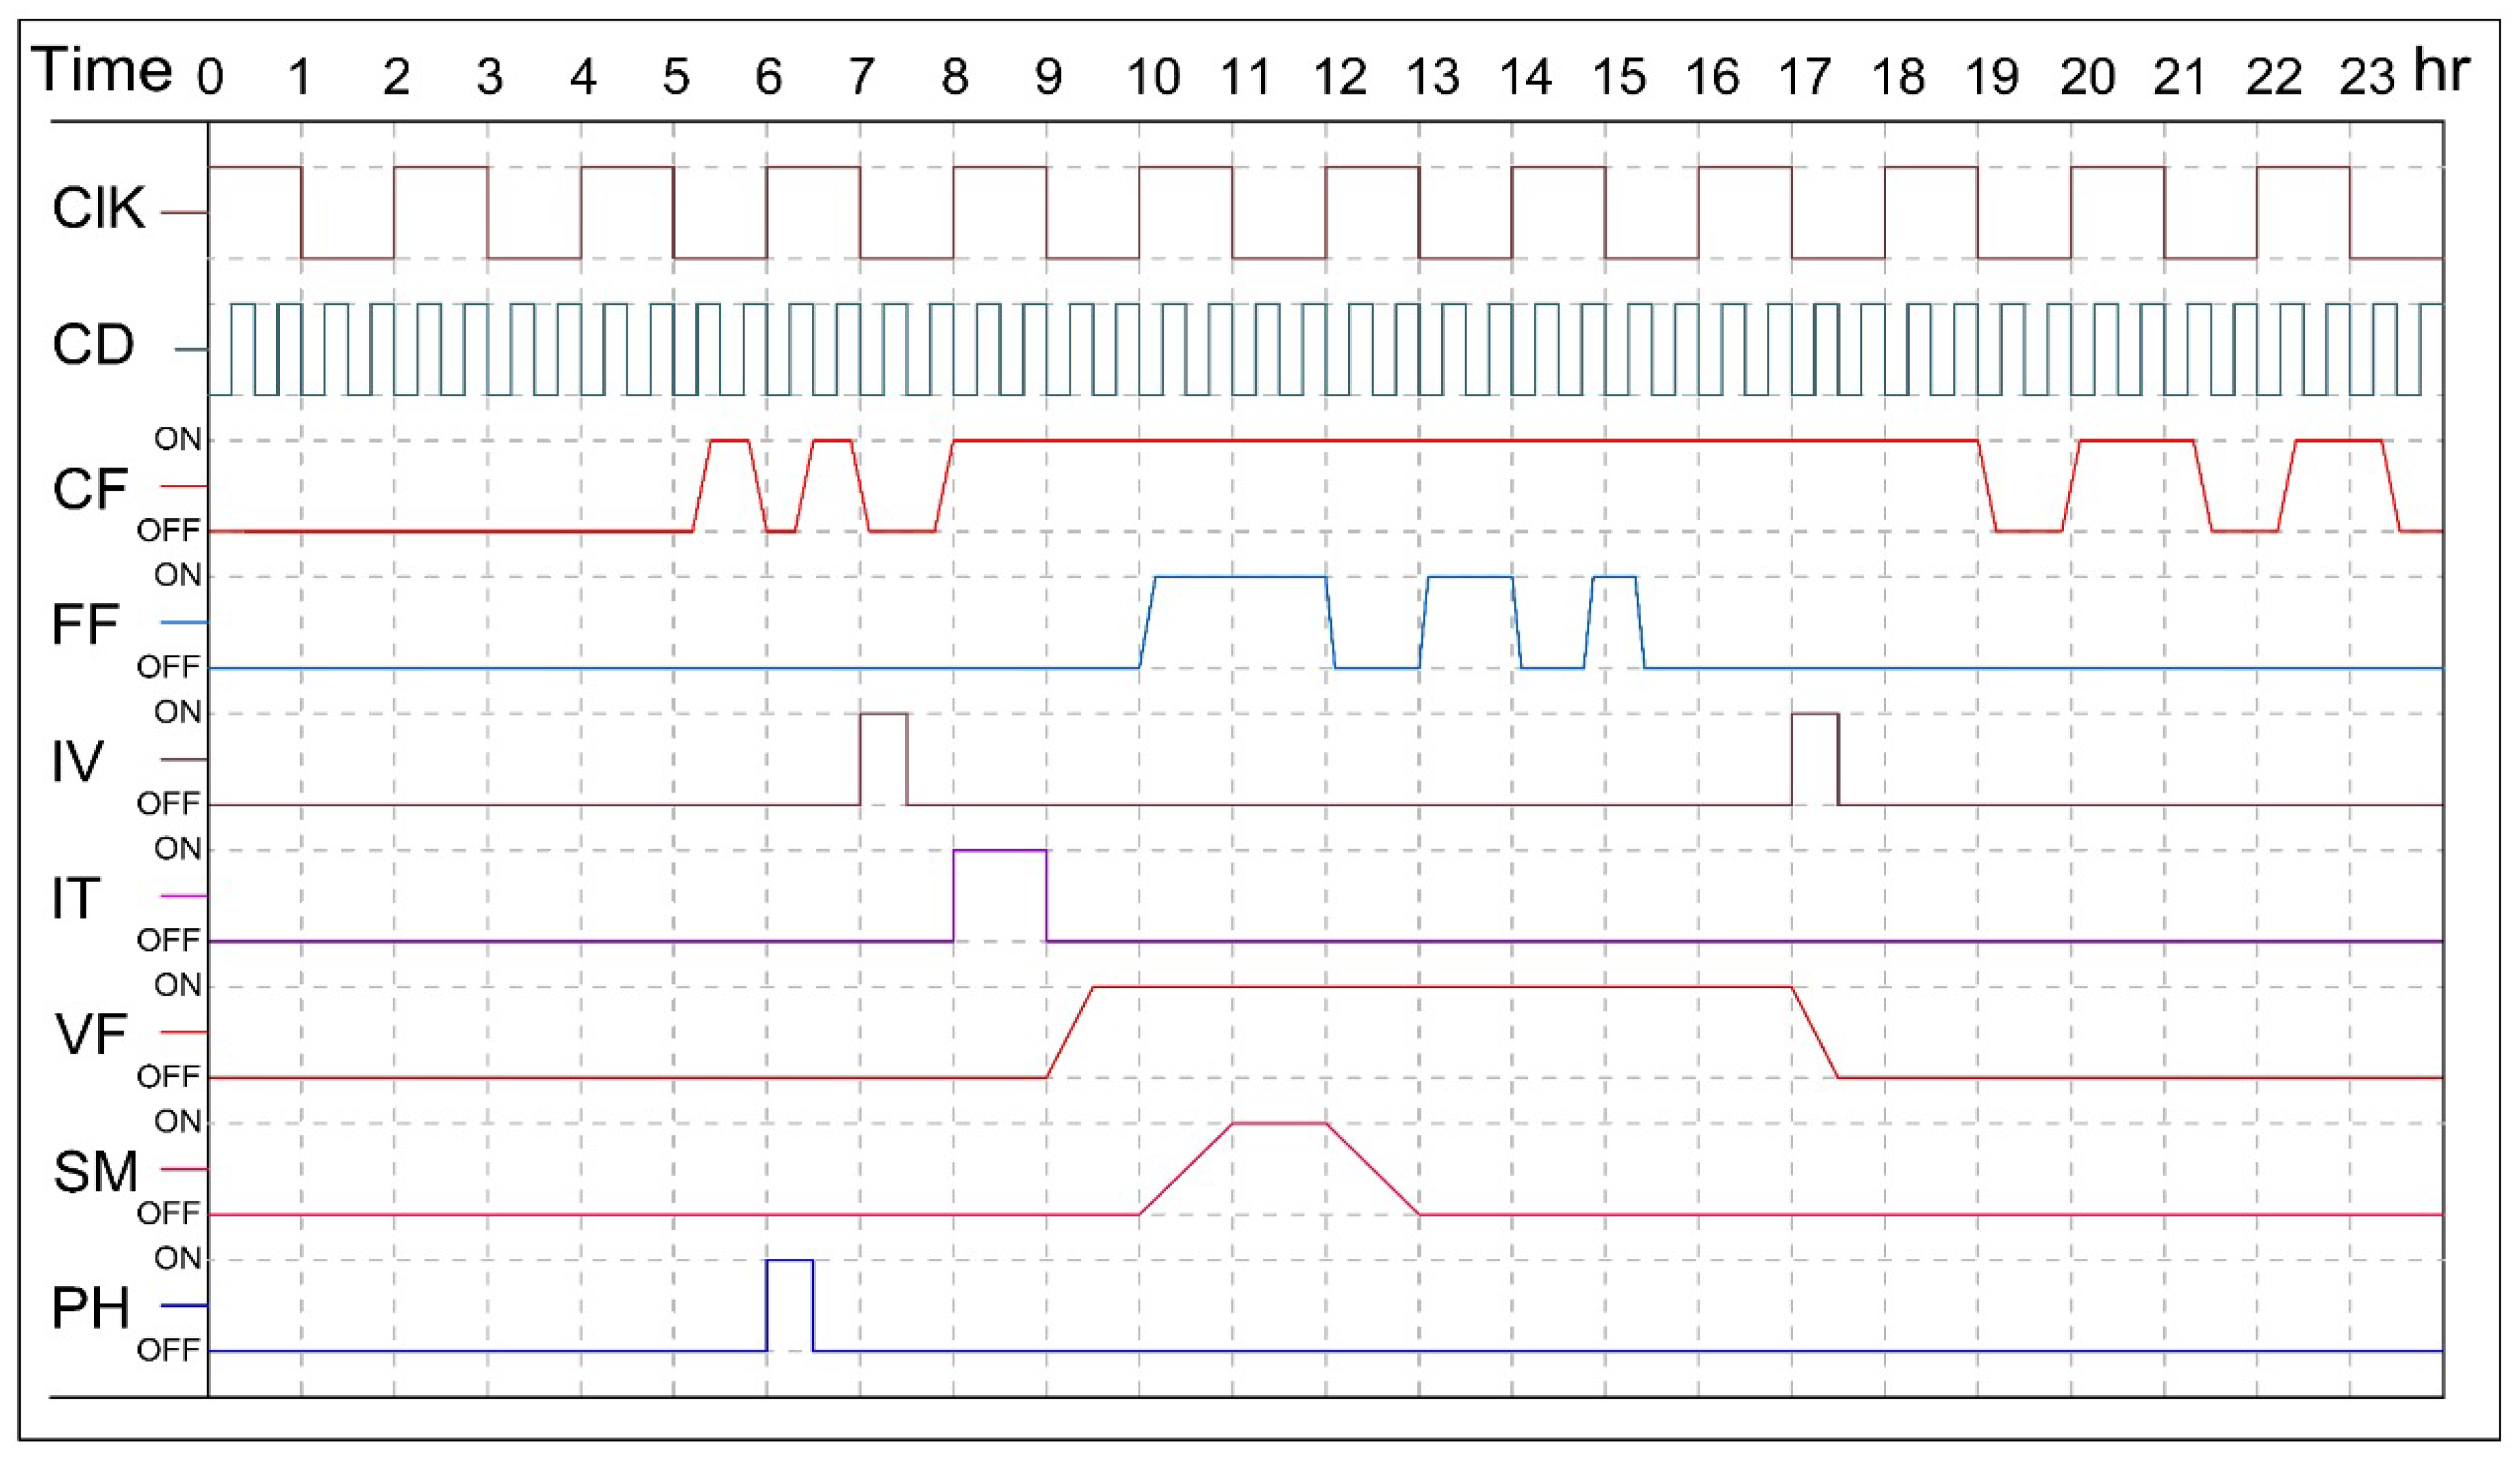
- Cooling Fans (CFs),
- Fogger Fans (FFs),
- Irrigation Valves (IVs),
- Irrigation Timers (ITs),
- Ventilation Fans (VFs),
- Shading Motors (SMs),
- PH electric valves (PHs),
2.2.2. Hardware Design
2.2.3. Software Design
- It is readable by embedding the required comments for each step,
- It displays real-time information about the status of the system at every time, such as “Starting up the System”, “Starting up the Sensors”, “Fixing a Specific Measure (pH, Moisture, Temperature, and so on)”, “Sending Data to Cloud”, and so on.
- It has the ability to alert the user if any up-normal issues occurred, and
- It has sufficient flexibility to be extended by inserting more measurements.
- Requirements: According to our real-time field experiments, we defined the required information to be collected from the greenhouse as well as the desired results from our software.
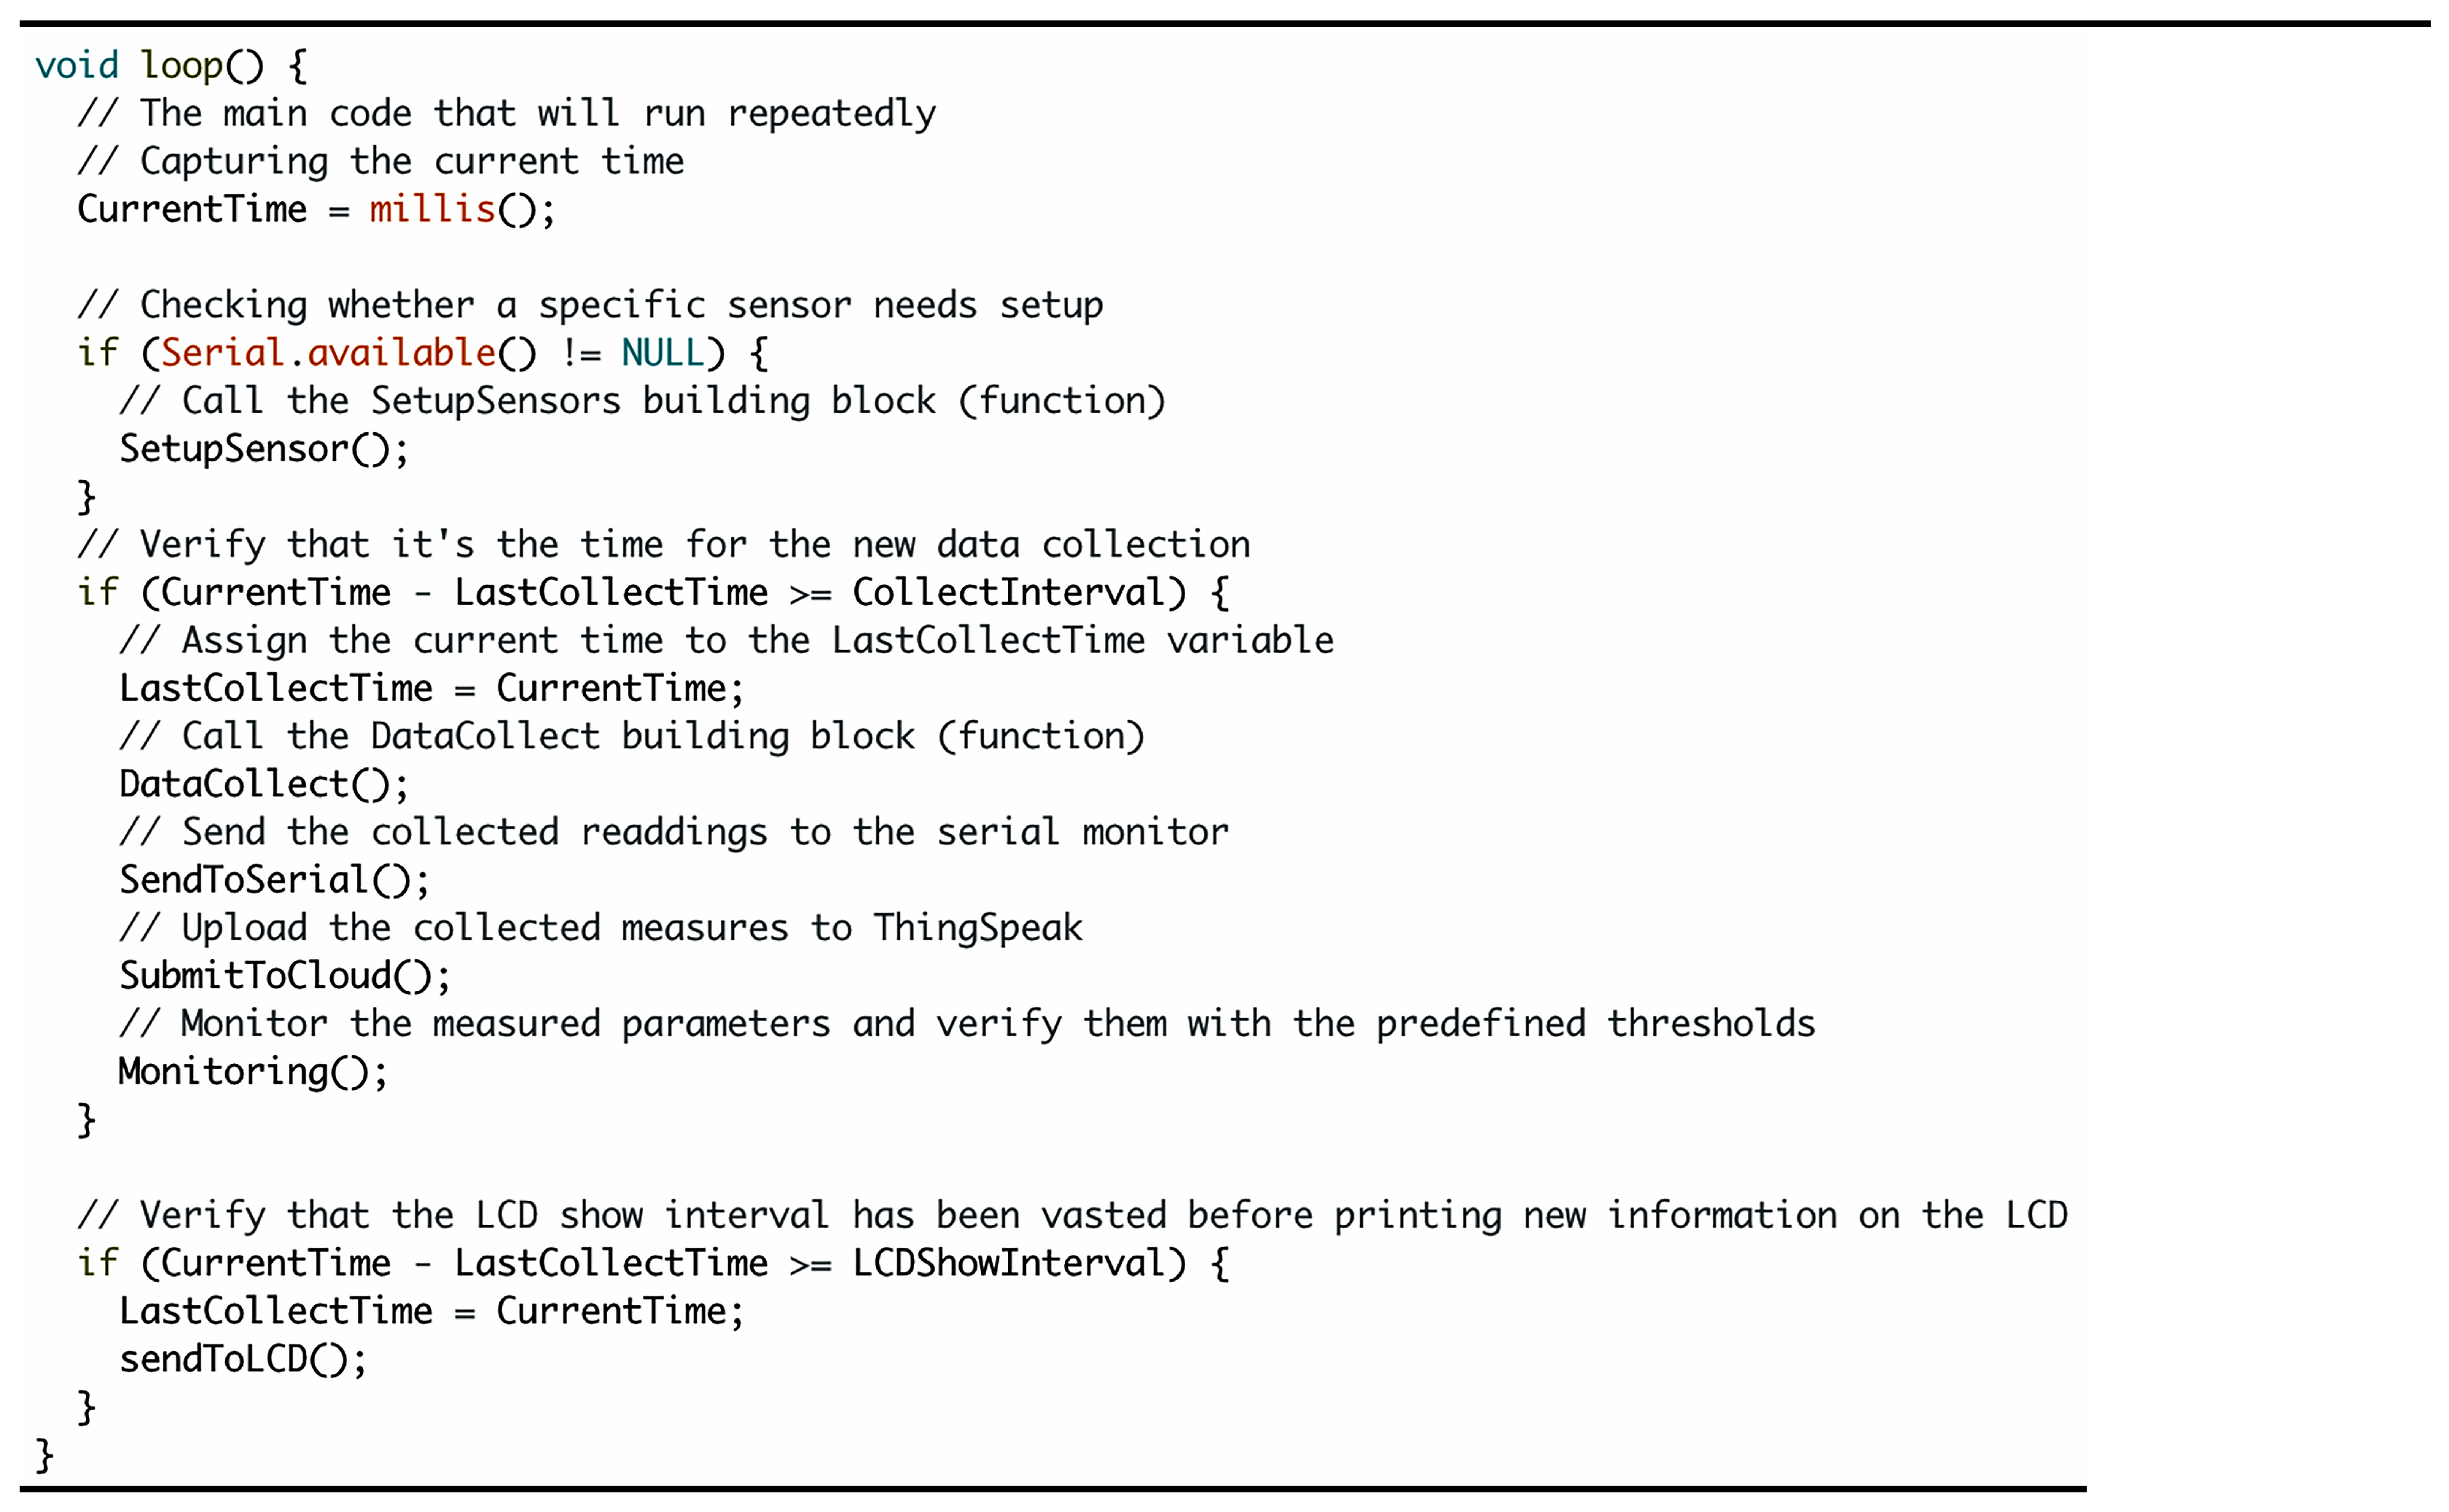
- Analysis: We broke down the main system software into manageable building blocks. As shown in Figure 5, our system software is represented in six basic building blocks:
- -
- SetupSensors( )
- -
- DataCollect( )
- -
- SendToSerial( )
- -
- SubmitToCloud( )
- -
- Monitoring( )
- -
- SendToLCD( )
- Design: We decided the required data objects and operations.
- Refinement and Coding: We implemented the required algorithms and data objects.
- Verification: We tested and introduced the correctness proofs for our systems measurements and decisions based on parallel real field measurements.
- SetupSensors( ):This building block is very important to communicate with most of the system sensors for various issues, such as resets, manual readings, and calibration. We used the SetupSensors( ) function for this purpose, where each sensor in our system is identified by a unique ID. Once the user passes the ID of the sensors to be adjusted for the SetupSensors( ) function, a new getCommand( ) function is instantiated to receive the user commands and submit them to the sensor for further adjustment.
- DataCollect( ): At each data collection interval, the DataCollect( ) function grab all the measurements and readings from the nine sensors employed in our platform. It should be mentioned that each sensor uses its own library to complete its task based on its own functionality.
- SendToSerial( ): This function is responsible for printing real-time measurements obtained from each sensor in the platform on our serial terminal.
- SubmitToCloud( ): As soon as the data has been collected using the DataCollect( ) function, this function gathers all the data in a variable of type string called “CollectedData” and sends it to the ESP8226. Once the ESP8226 receives this string variable, it submits the collected data to ThingSpeak. It should be mentioned that this process is executed once at each data collection interval.
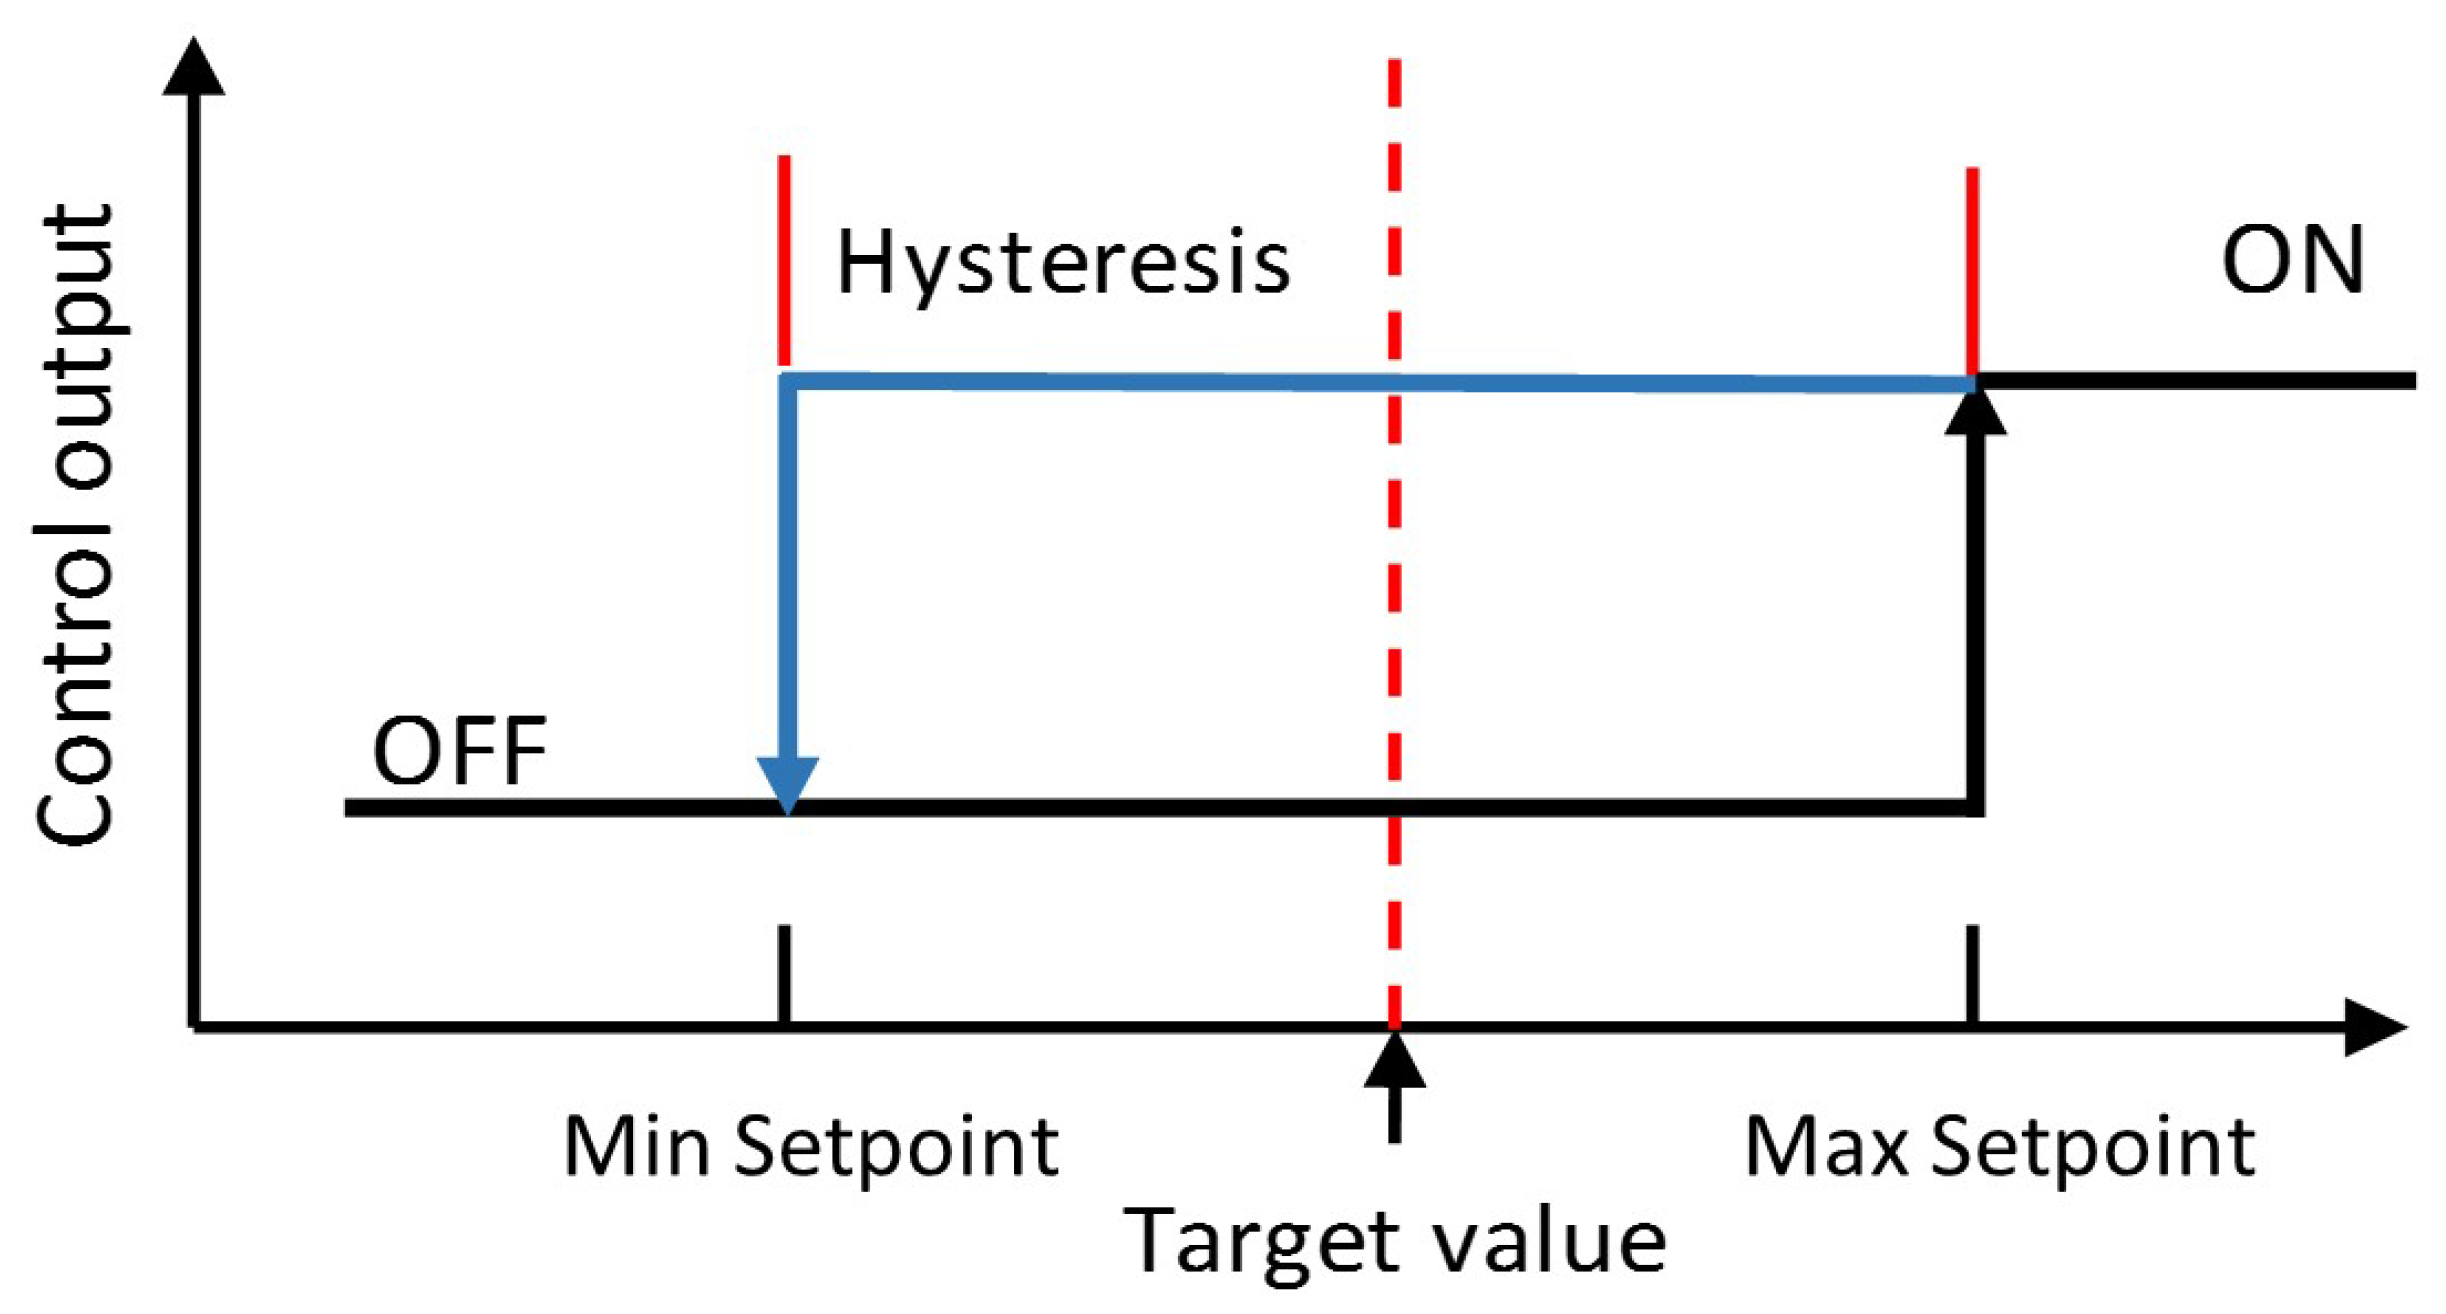
- Monitoring( ): This function monitors the measured parameters. It also controls the system motors/fans based on the predetermined thresholds for each parameter. Moreover, this function keeps the lights concerning a specific parameter on while adjusting its value to be within the normal and accepted levels. For example, if the greenhouse temperature became greater than 26 C, then the temperature alarm light will on and the cooling fans will be activated to bring the greenhouse temperature back to be 24 C. Then, the cooling fans and the temperature alarm light will stop working when the greenhouse temperature become 24C. It should be mentioned that the system monitoring state is normally viewed on our serial monitor and LCD.
- SendToLCD( ): One of our main objectives is to keep track for up to date information about all the system parameters. Thus, this function is used to scroll the information on the LCD every five seconds. It is worth to mention that, the information that is going to be displayed on the LCD is the alarming situations only such as fixing pH, fixing Temp, fixing humidity, and so on.
2.3. Substrate-Soilless Culture
2.4. Measurements
2.4.1. Cucumber Fruit Characteristics
- Dimensions, projected area, and fruit weight:We obtained the cucumber projected area, weight and dimensions using a digital camera; model Nikon Coolpix B600, camera with a LED light source. The gathered cucumber images are processed using the free open source Fiji-ImageJ2 [44] to identify the desired weight and dimensions, where the former is estimated using the sartorius electronic balance [45].
- Volume:The cucumber volume is determined according to the gas-displacement methodology in isothermal systems at pressure and temperature of 200 kPa and 25 °C, respectively, using the low-pressure cylinder and the treatment chamber. The volume of the fruit sample was estimated using the following formulas [46]:where (in kPa) and (in cm) are the pressure and volume of the low-pressure cylinder, (in kPa) is the equilibrium-pressure, (in cm) is the sample volume, and (in cm) is the treatment chamber.
- Density:The cucumber density is estimated by the ratio of the sample weight to its volume, which estimated by the gas and water displacements.
- Color:The cucumber fruit color was identified using the color spectrophotometer that developed by Hunter Laboratory. This step is performed based on the color system of chromaticity coordinates a (- a = greenness, a = redness), lightness factor L (0 = black, 100 = white), the chromaticity coordinates a (- a = greenness, a = redness), and b (- b = blueness, b = yellowness) as described in [47]. For the experiments of this paper, the color parameters are measured before and after treatment using 100 cucumber samples randomly selected. In this case, we calculate the chroma (C) and hue angle (h) as given in [47]:
- Moisture content:The fruit moisture content is estimated through dehydrating a sample in a vacuum-drying oven (Model: LVO-2041P) at about 70 °C following the common analysis methods [48]. The fruit samples were randomly selected from the cultivation lines of cucumber in the greenhouse under study, such that each fruit sample is used to determine the physicochemical parameters. Whereas, the width and length of each samples is estimated using any suitable tool, such as digital vernier slide caliper.
- pH:The pH of the cucumber fruit was determined based on the standard analysis methods (AOAC) using the pH meter (Model: EC500, Extech, China) [48].
- Total soluble solids and fruit firmness:The cucumber total soluble solids and firmness are specifically estimated using the Koehler penetrometer (Thomas Scientific, Swedesboro, NJ, USA) and laboratory refractometer (Model: RFM 840, Richmond Scientific Ltd. Unit 9, Lancashire, UK), respectively.
- Hardness:To measure the cucumber hardness we selected 10 samples randomly selected from each treatment. Usually, the hardness of any fruit crops is measured using the maximum pressure (N/cm) required to penetrate the body of the sample using a fruit pressure tester (Model: FT 327), which is fitted with a stainless steel cylindrical probe with a diameter of 8 mm.
2.4.2. Irrigation Water Requirement
- Amount of irrigation water:The measurement of the required irrigation water is conducted by using the digital flow meter whereas the drainage water volume is estimated in the collection tank. The plant water uptake is estimated based on the water balance by measuring the irrigation water input and the total of various outputs. The cumulative applied irrigation water during the experiment life time is estimated using the digital flow meter (Model: K24, SUNNY, Linyi, China). The amount of daily irrigation water requirement is calculated as follows:where, IWR refers to the irrigation water requirement (m/day), refers to the target surface area (m), ET (mm) refers to the crop evapotranspiration as given in Equation (6).
- Meteorological data:The meteorological data of the greenhouse is including the relative humidity (%), the minimum and maximum air temperature (°C), the solar radiation (W/m), sunshine duration (h), wind speed (km/h) are recorded by a weather station installed at the greenhouse.
- Growth medium moisture content:In this research, the amount of irrigated water was controlled based on the growing medium moisture content, which is estimated by using a handheld moisture meter (Model: VG-Meter-200, Vegetronix, UT, USA). The real-time moisture content is recorded by using a waterproof moisture sensor probe (Model: VH400 Vegetronix, UT, USA). To avoid any bias, the moisture content probe is calibrated versus the real medium water content that determined the gravimetrically at the greenhouse site.
2.4.3. Plant Parameters
2.4.4. Water Use Efficiency of Cucumber
2.4.5. Electrical Energy
2.5. Statistical Analysis
3. System Implementation and Results
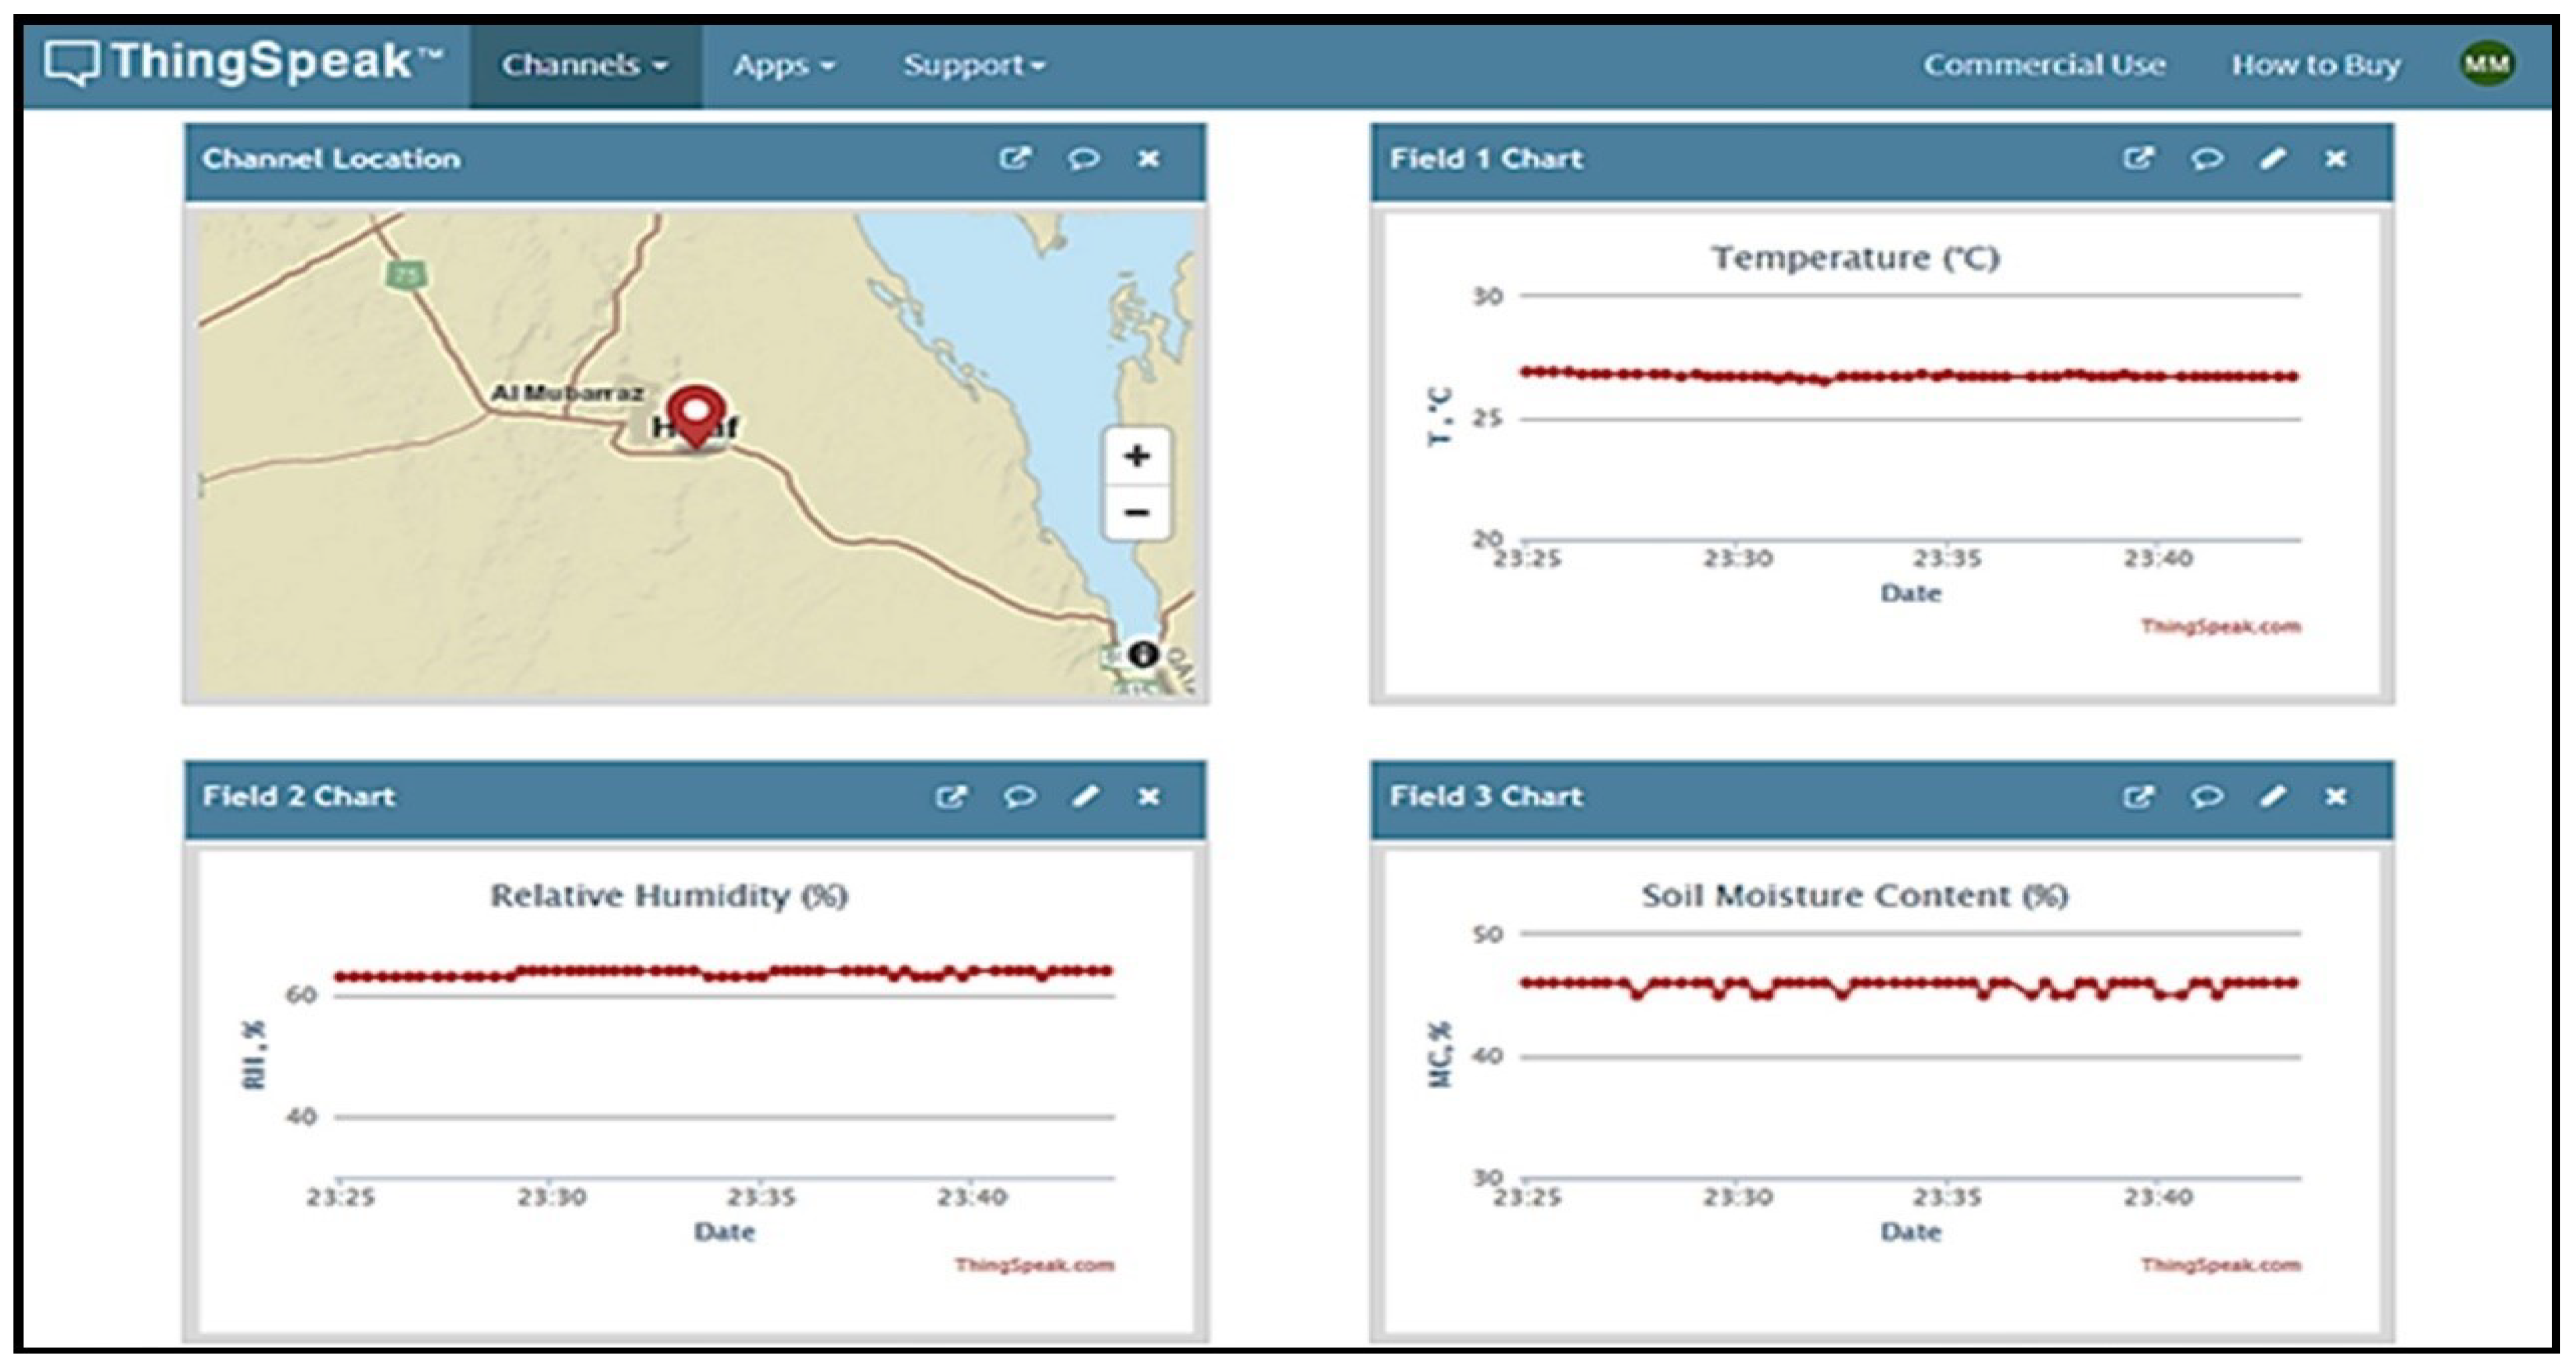
3.1. Cloud-Based IoT Monitoring
3.2. Greenhouse Microclimate Control and Automation
3.3. Impact on Cucumber Characteristics
3.4. Management of Yield and Water Productivity
3.5. Energy Consumption
4. Conclusions
Author Contributions
Funding
Acknowledgments
Conflicts of Interest
Sample Availability
References
- UN DESA. World Population Projected to Reach 9.7 Billion by 2050 | UN DESA | United Nations Department of Economic and Social Affairs. 2015. Available online: https://www.un.org/development/desa/en/news/population/world-population-prospects-2017.html (accessed on 31 December 2020).
- Godfray, H.C.J.; Beddington, J.R.; Crute, I.R.; Haddad, L.; Lawrence, D.; Muir, J.F.; Pretty, J.; Robinson, S.; Thomas, S.M.; Toulmin, C. Food security: The challenge of feeding 9 billion people. Science 2010, 327, 812–818. [Google Scholar] [CrossRef] [PubMed]
- Roser, M.; Ritchie, H.; Ortiz-Ospina, E. World Population Growth. Available online: https://ourworldindata.org/world-population-growth?source=post_page-----d904819ea029 (accessed on 30 November 2020).
- Ray, D.K.; Mueller, N.D.; West, P.C.; Foley, J.A. Yield Trends Are Insufficient to Double Global Crop Production by 2050. PLoS ONE 2013, 8, e66428. [Google Scholar] [CrossRef] [PubMed]
- Rodríguez, F.; Berenguel, M.; Guzmán, J.L.; Ramírez-arias, A. Modeling and Control of Greenhouse Crop Growth; Springer: Berlin/Heidelberg, Germany, 2014; ISBN 9783319111339. [Google Scholar]
- Postolache, O.; Pereira, J.M.; Girão, P.S.; Monteiro, A.A. Greenhouse environment: Air and water monitoring. In Lecture Notes in Electrical Engineering; Mukhopadhyay, S.C., Ed.; Springer: Berlin/Heidelberg, Germany, 2012; Volume 146, pp. 81–102. [Google Scholar]
- López-Cruz, I.L.; Fitz-Rodríguez, E.; Salazar-Moreno, R.; Rojano-Aguilar, A.; Kacira, M. Development and analysis of dynamical mathematical models of greenhouse climate: A review. Eur. J. Hortic. Sci. 2018, 83, 269–279. [Google Scholar] [CrossRef]
- El-Gayar, S.; Negm, A.; Abdrabbo, M. Greenhouse Operation and Management in Egypt. In Conventional Water Resources and Agriculture in Egypt; Springer: Cham, Switzerland, 2018. [Google Scholar]
- Therond, O.; Duru, M.; Roger-Estrade, J.; Richard, G. A new analytical framework of farming system and agriculture model diversities. A review. Agron. Sustain. Dev. 2017, 37. [Google Scholar] [CrossRef]
- Lytos, A.; Lagkas, T.; Sarigiannidis, P.; Zervakis, M.; Livanos, G. Towards smart farming: Systems, frameworks and exploitation of multiple sources. Comput. Netw. 2020, 172, 107147. [Google Scholar] [CrossRef]
- Kodali, K.; Jain, V.; Karagwal, S. IoT based smart greenhouse. In Proceedings of the 2016 IEEE Region 10 Humanitarian Technology Conference (R10-HTC), Agra, India, 21–23 December 2016. [Google Scholar] [CrossRef]
- Liu, D.; Cao, X.; Huang, C.; Ji, L. Intelligent Agriculture Greenhouse Environment Monitoring System Based on IOT Technology. In Proceedings of the Intelligent Agriculture Greenhouse Environment Monitoring System Based on IOT Technology, Halong Bay, Vietnam, 19–20 December 2015; pp. 487–490. [Google Scholar]
- Gruda, N. Current and future perspective of growing media in Europe. Acta Hortic. 2012, 960, 37–43. [Google Scholar] [CrossRef]
- EI-Kazzaz, A. Soilless Agriculture a New and Advanced Method for Agriculture Development: An Introduction. Agric. Res. Technol. 2017, 3, 63–72. [Google Scholar] [CrossRef]
- Savvas, D.; Gruda, N. Application of soilless culture technologies in the modern greenhouse industry—A review. Eur. J. Hortic. Sci. 2018, 83, 280–293. [Google Scholar] [CrossRef]
- Barrett, G.E.; Alexander, P.D.; Robinson, J.S.; Bragg, N.C. Achieving environmentally sustainable growing media for soilless plant cultivation systems—A review. Sci. Hortic. 2016, 212, 220–234. [Google Scholar] [CrossRef]
- Massa, D.; Magán, J.J.; Montesano, F.F.; Tzortzakis, N. Minimizing water and nutrient losses from soilless cropping in southern Europe. Agric. Water Manag. 2020, 241, 106395. [Google Scholar] [CrossRef]
- Mohammadi Ghehsareh, A. Effect of date palm wastes and rice hull mixed with soil on growth and yield of cucumber in greenhouse culture. Int. J. Recycl. Org. Waste Agric. 2013, 2. [Google Scholar] [CrossRef]
- Manos, D.P.; Xydis, G. Hydroponics: Are we moving towards that direction only because of the environment? A discussion on forecasting and a systems review. Environ. Sci. Pollut. Res. 2019, 26, 12662–12672. [Google Scholar] [CrossRef] [PubMed]
- El-Behairy, U.A.A. Simple Substrate Culture in Arid Lands. In Soilless Culture—Use of Substrates for the Production of Quality Horticultural Crops; Asaduzzaman, M., Ed.; IntechOpen: Rijeka, Croatia, 2015. [Google Scholar]
- Tüzel, Y.; Gül, A.; Tüzel, I.H.; Öztekin, G.B. Different Soilless Culture Systems and Their Management. J. Agric. Food Environ. Sci. 2019, 73, 7–12. [Google Scholar]
- Fiaz, S.; Noor, M.A.; Aldosri, F.O. Achieving food security in the Kingdom of Saudi Arabia through innovation: Potential role of agricultural extension. J. Saudi Soc. Agric. Sci. 2018, 17, 365–375. [Google Scholar] [CrossRef]
- Olympios, C.M. Overview of Soilless Culture: Advantages, Constraints and Perspectives for Its Use in Mediterranean Countries. Available online: https://om.ciheam.org/om/pdf/c31/CI020854.pdf (accessed on 31 December 2020).
- Han, W.; Liu, P.; Zhang, J.; Fu, J.; Yu, Y.; Wang, X.; Xu, L.; Cui, N. Intelligent Greenhouse Information Collection and Control System Based on Internet of Things. In New Developments of IT, IoT and ICT Applied to Agriculture; Springer: Singapore, 2021. [Google Scholar]
- Pallavi, S.; Mallapur, J.D.; Bendigeri, K.Y. Remote sensing and controlling of greenhouse agriculture parameters based on IoT. In Proceedings of the International Conference on Big Data, IoT and Data Science (BID), Pune, India, 20–22 December 2017; pp. 44–48. [Google Scholar] [CrossRef]
- Doshi, J.; Patel, T.; Bharti, S.K. Smart Fanning using IoT, a solution for optimally monitoring fanning conditions. Procedia Comput. Sci. 2019, 160, 746–751. [Google Scholar] [CrossRef]
- Braun, A.T.; Colangelo, E.; Steckel, T. Farming in the Era of Industrie 4.0. Procedia CIRP 2018, 72, 979–984. [Google Scholar] [CrossRef]
- Glaroudis, D.; Iossifides, A.; Chatzimisios, P. Survey, comparison and research challenges of IoT application protocols for smart farming. Comput. Netw. 2020, 168, 107037. [Google Scholar] [CrossRef]
- Kochhar, A.; Kumar, N. Wireless sensor networks for greenhouses: An end-to-end review. Comput. Electron. Agric. 2019, 163, 104877. [Google Scholar] [CrossRef]
- Patil, A.S.; Tama, B.A.; Park, Y.; Rhee, K.H. A framework for blockchain based secure smart green house farming. In Advances in Computer Science and Ubiquitous Computing; Springer: Singapore, 2018; Volume 474, pp. 1162–1167. [Google Scholar]
- Singh, M.C.; Singh, J.P.; Singh, K.G. Development of a microclimate model for prediction of temperatures inside a naturally ventilated greenhouse under cucumber crop in soilless media. Comput. Electron. Agric. 2018, 154, 227–238. [Google Scholar] [CrossRef]
- Wang, J.; Chen, M.; Zhou, J.; Li, P. Data communication mechanism for greenhouse environment monitoring and control: An agent-based IoT system. Inf. Process. Agric. 2020, 7, 444–455. [Google Scholar] [CrossRef]
- Subahi, A.F.; Bouazza, K.E. An Intelligent IoT-Based System Design for Controlling and Monitoring Greenhouse Temperature. IEEE Access 2020, 8, 125488–125500. [Google Scholar] [CrossRef]
- Al-Harbi, A.R.; Al-Omran, A.M.; Alharbi, K. Grafting improves cucumber water stress tolerance in Saudi Arabia. Saudi J. Biol. Sci. 2018, 25, 298–304. [Google Scholar] [CrossRef] [PubMed]
- Almohithef, A.H.; Al-Yahya, F.A.; Al-Hazmi, A.S.; Dawabah, A.A.M.; Lafi, H.A. Prevalence of plant-parasitic nematodes associated with certain greenhouse vegetable crops in Riyadh region, Saudi Arabia. J. Saudi Soc. Agric. Sci. 2020, 19, 22–25. [Google Scholar] [CrossRef]
- Ministry of Environment, Water, Agriculture. Statistical Year Book for 2018; General Authority for Statistics: Riyadh, Saudi Arabia, 2018.
- Ayaz, M.; Ammad-Uddin, M.; Sharif, Z.; Mansour, A.; Aggoune, E.H.M. Internet-of-Things (IoT)-based smart agriculture: Toward making the fields talk. IEEE Access 2019, 7, 129551–129583. [Google Scholar] [CrossRef]
- ThingSpeak. IoT Analytics—ThingSpeak Internet of Things. Available online: https://thingspeak.com/ (accessed on 30 November 2020).
- Gruda, N.S. Increasing sustainability of growing media constituents and stand-alone substrates in soilless culture systems. Agronomy 2019, 9, 298. [Google Scholar] [CrossRef]
- Mazahreh, N.; Nejatian, A.; Mousa, M. Effect of different growing media on cucumber production and water productivity in soilless culture under UAE conditions. Merit Res. J. Agric. Sci. Soil Sci. 2015, 3, 131–138. [Google Scholar]
- Gruda, N.; Caron, J.; Prasad, M.; Maher, M.J. Growing media. In Encyclopedia of Soil Sciences; Mukhopadhyay, S.C., Ed.; Taylor & Francis Group: Boca Raton, FL, USA, 2016; pp. 1053–1058. [Google Scholar]
- Singh, M.C.; Singh, J.P.; Pandey, S.K.; Mahay, D.; Shrivastva, V. Factors Affecting the Performance of Greenhouse Cucumber Cultivation—A Review. Int. J. Curr. Microbiol. Appl. Sci. 2017, 6, 2304–2323. [Google Scholar] [CrossRef]
- Papadopolos, A.P. Growing Greenhouse Cucumbers in Soil and in Soilless Media; Agriculture and Agri-Food Canada: Edmonton, AB, Canada, 1992. [Google Scholar]
- Rueden, C.T.; Schindelin, J.; Hiner, M.C.; DeZonia, B.E.; Walter, A.E.; Arena, E.T.; Eliceiri, K.W. ImageJ2: ImageJ for the next generation of scientific image data. BMC Bioinform. 2017, 18, 529. [Google Scholar] [CrossRef]
- Gamea, G.R.; Aboamera, M.A.; Mohmed, M.E. Design and Manufacturing of Prototype for Orange Grading Using Phototransistor. MISR J. Agric. Eng. 2011, 28, 505–523. [Google Scholar] [CrossRef]
- Mohammed, M.E.A.; El-Shafie, H.A.F.; Alhajhoj, M.R. Design and efficacy evaluation of a modern automated controlled atmosphere system for pest management in stored dates. J. Stored Prod. Res. 2020, 89, 101719. [Google Scholar] [CrossRef]
- Mohammed, M.E.A.; El-Shafie, H.A.; Sallam, A.A.A. A solar-powered heat system for management of almond moth, Cadra cautella (Lepidoptera: Pyralidae) in stored dates. Postharvest Biol. Technol. 2019, 154, 121–128. [Google Scholar] [CrossRef]
- Association Of Official Analytical Chemists. Official Methods of Analysis of AOAC International, 16th ed.; AOAC International: Gaithersburg, MD, USA, 1998. [Google Scholar]
- Allen, R.G.; Pereira, L.S.; Raes, D.; Smith, M. Crop Evapotranspiration—Guidelines for Computing Crop Water Requirements; FAO Irrigation and Drainage Paper No. 56; Food and Agriculture Organization (FAO): Rome, Italy, 1998. [Google Scholar]
- Anwar, A.; Yan, Y.; Liu, Y.; Li, Y.; Yu, X. 5-Aminolevulinic Acid Improves Nutrient Uptake and Endogenous Hormone Accumulation, Enhancing Low-Temperature Stress Tolerance in Cucumbers. Int. J. Mol. Sci. 2018, 19, 3379. [Google Scholar] [CrossRef] [PubMed]
- Thimijan, R.W.; Heins, R.D. Photometric, radiometric, and quantum light units of measure: A review of procedures for interconversion. Hortic. Sci. 1983, 18, 818–822. [Google Scholar]
- Čatský, J.; Langhans, R.W.; Tibbitts, T.W. Plant growth chamber handbook. Photosynthetica 1998, 35, 232. [Google Scholar] [CrossRef]
- Şimşek, M.; Tonkaz, T.; Kaçira, M.; Çömlekçioǧlu, N.; Doǧan, Z. The effects of different irrigation regimes on cucumber (Cucumbis sativus L.) yield and yield characteristics under open field conditions. Agric. Water Manag. 2005, 73, 173–191. [Google Scholar] [CrossRef]
- Montesano, F.F.; Van Iersel, M.W.; Parente, A. Timer versus moisture sensor-based irrigation control of soilless lettuce: Effects on yield, quality and water use efficiency. Hortic. Sci. 2016, 43, 67–75. [Google Scholar] [CrossRef]
- Boutraa, T.; Akhkha, A.; Alshuaibi, A.; Atta, R. Evaluation of the effectiveness of an automated irrigation system using wheat crops. Agric. Biol. J. N. Am. 2011, 2, 80–88. [Google Scholar] [CrossRef]
- Qu, F.; Jiang, J.; Xu, J.; Liu, T.; Hu, X. Drip irrigation and fertilization improve yield, uptake of nitrogen, and water-nitrogen use efficiency in cucumbers grown in substrate bags. Plant Soil Environ. 2019, 65, 328–335. [Google Scholar]


| Characteristic | Method | Mean | Std. Dev. | Std. Err. | Minimum | Maximum | p Value |
|---|---|---|---|---|---|---|---|
| Length (cm) | MMC | 14.12 A | 0.69 | 0.17 | 12.50 | 15.60 | 0.00 |
| ITC | 12.77 B | 0.96 | 0.24 | 11.21 | 14.5 | ||
| Diameter (cm) | MMC | 2.85 B | 0.29 | 0.07 | 2.37 | 3.30 | 0.00 |
| ITC | 3.17 A | 0.21 | 0.05 | 2.65 | 3.50 | ||
| Projected Area (cm) | MMC | 33.89 A | 5.40 | 1.35 | 25.41 | 43.61 | 0.73 |
| ITC | 33.25 A | 4.9 | 1.23 | 24.36 | 42.31 | ||
| Aspect ratio | MMC | 0.20 B | 0.02 | 0.00 | 0.17 | 0.23 | 0.00 |
| ITC | 0.25 A | 0.02 | 0.01 | 0.22 | 0.29 | ||
| Weight (g) | MMC | 75.99 B | 16.49 | 4.12 | 51.87 | 107.10 | 0.03 |
| ITC | 86.46 A | 9.07 | 2.27 | 70.00 | 99.80 | ||
| Volume (cm) | MMC | 90.46 A | 19.55 | 4.89 | 57.72 | 121.28 | 0.12 |
| ITC | 100.62 A | 16.11 | 4.03 | 64.88 | 124.29 | ||
| Density (g/cm) | MMC | 0.84 A | 0.08 | 0.02 | 0.64 | 0.95 | 0.37 |
| ITC | 0.87 A | 0.05 | 0.01 | 0.80 | 0.94 | ||
| L, Lightness | MMC | 36.29 A | 2.24 | 0.65 | 32.86 | 39.59 | 0.05 |
| ITC | 38.19 A | 2.24 | 0.65 | 34.76 | 41.49 | ||
| Hue (angle) | MMC | 104.10 A | 5.73 | 1.66 | 93.93 | 110.37 | 0.00 |
| ITC | 97.73 B | 3.94 | 1.14 | 91.27 | 102.19 | ||
| Chroma (magnitude) | MMC | 18.52 B | 2.91 | 0.84 | 13.84 | 22.50 | 0.00 |
| ITC | 27.89 A | 2.86 | 0.83 | 23.46 | 31.74 | ||
| Hardness (N) | MMC | 29.27 A | 5.19 | 1.5 | 20.60 | 37.28 | 0.34 |
| ITC | 27.39 A | 4.24 | 1.22 | 21.58 | 35.32 | ||
| Moisture content (%) | MMC | 88.63 B | 0.52 | 0.15 | 87.50 | 89.20 | 0.00 |
| ITC | 90.63 A | 0.52 | 0.15 | 89.50 | 91.20 | ||
| pH | MMC | 5.34 A | 0.11 | 0.03 | 5.12 | 5.54 | 0.90 |
| ITC | 5.33 A | 0.16 | 0.04 | 5.11 | 5.55 | ||
| TSS (%) | MMC | 3.23 A | 0.14 | 0.04 | 3.10 | 3.50 | 0.00 |
| ITC | 2.93 B | 0.14 | 0.04 | 2.80 | 3.20 |
| Parameter | Method | Mean | Std. Dev. | Std. Err. | Minimum | Maximum | p Value |
|---|---|---|---|---|---|---|---|
| Plant temperature (°C) | MMC | 23.425 B | 1.223 | 0.353 | 22.10 | 25.30 | 0.011 |
| ITC | 24.850 A | 1.276 | 0.368 | 22.20 | 26.70 | ||
| Chlorophyll (SPAD) | MMC | 34.367 B | 1.209 | 0.349 | 32.90 | 37.30 | 0.000 |
| ITC | 31.567 A | 1.328 | 0.383 | 29.50 | 33.80 | ||
| Number of fruit per plant | MMC | 14.000 A | 1.809 | 0.522 | 12.00 | 18.00 | 0.027 |
| ITC | 12.250 B | 1.815 | 0.524 | 9.00 | 15.00 | ||
| Yield per plant (kg/plant) | MMC | 1.278 A | 0.321 | 0.093 | 0.96 | 1.96 | 0.019 |
| ITC | 1.025 B | 0.039 | 0.039 | 0.80 | 1.20 |
| Parameter | Method | Mean | Std. Dev. | Std. Err. | Min | Max | p Value |
|---|---|---|---|---|---|---|---|
| Applied water per plant (m/plant) | MMC | 0.058 B | 0.003 | 0.001 | 0.05 | 0.06 | 0.000 |
| ITC | 0.073 A | 0.010 | 0.003 | 0.06 | 0.10 | ||
| WUE (kg/m) | MMC | 19.017 A | 2.456 | 0.709 | 16.30 | 24.45 | 0.000 |
| ITC | 14.378 B | 1.887 | 0.545 | 11.22 | 16.83 | ||
| Productivity (kg/m) | MMC | 4.453 A | 0.804 | 0.232 | 3.64 | 6.51 | 0.004 |
| ITC | 3.588 B | 0.471 | 0.136 | 2.80 | 4.20 |
Publisher’s Note: MDPI stays neutral with regard to jurisdictional claims in published maps and institutional affiliations. |
© 2020 by the authors. Licensee MDPI, Basel, Switzerland. This article is an open access article distributed under the terms and conditions of the Creative Commons Attribution (CC BY) license (http://creativecommons.org/licenses/by/4.0/).
Share and Cite
Sagheer, A.; Mohammed, M.; Riad, K.; Alhajhoj, M. A Cloud-Based IoT Platform for Precision Control of Soilless Greenhouse Cultivation. Sensors 2021, 21, 223. https://doi.org/10.3390/s21010223
Sagheer A, Mohammed M, Riad K, Alhajhoj M. A Cloud-Based IoT Platform for Precision Control of Soilless Greenhouse Cultivation. Sensors. 2021; 21(1):223. https://doi.org/10.3390/s21010223
Chicago/Turabian StyleSagheer, Alaa, Maged Mohammed, Khaled Riad, and Mohammed Alhajhoj. 2021. "A Cloud-Based IoT Platform for Precision Control of Soilless Greenhouse Cultivation" Sensors 21, no. 1: 223. https://doi.org/10.3390/s21010223
APA StyleSagheer, A., Mohammed, M., Riad, K., & Alhajhoj, M. (2021). A Cloud-Based IoT Platform for Precision Control of Soilless Greenhouse Cultivation. Sensors, 21(1), 223. https://doi.org/10.3390/s21010223