Article

Fast Screening of Whole Blood and Tumor Tissue for Bladder Cancer Biomarkers Using Stochastic Needle Sensors

1
Laboratory of Electrochemistry and PATLAB, National Institute of Research for Electrochemistry and Condensed Matter, 202 Splaiul Independentei Street, 060021 Bucharest-6, Romania
2
Faculty of Medicine, University of Medicine and Pharmacy ”Carol Davila”, 050474 Bucharest, Romania
*
Author to whom correspondence should be addressed.
Sensors 2020, 20(8), 2420; https://doi.org/10.3390/s20082420
Submission received: 1 March 2020 / Revised: 12 April 2020 / Accepted: 23 April 2020 / Published: 24 April 2020
(This article belongs to the Special Issue Graphene-Based Sensors for Pharmaceutical and Biomedical Analysis)

Abstract

:
Bladder cancer is one of the most common urologic malignancies, which is more frequent in men than in women. The early diagnosis for this type of cancer still remains a challenge, therefore, the development of a fast screening test for whole blood and tumor tissue samples may save lives. Four biomarkers, p53, E-cadherin, bladder tumor antigen (BTA), and hyaluronic acid were considered for the screening tests using stochastic needle sensors. Three stochastic needle sensors, based on graphite powder and modified with three types of chitosan, were designed and characterized for the screening test. The proposed sensors showed low limits of quantification, and high sensitivity and selectivity levels. The recoveries of p53, E-cadherin, BTA, and hyaluronic acid in whole blood samples and tissue samples were higher than 95.00% with a relative standard deviation lower than 1.00%.

1. Introduction

Bladder cancer (BC) is a urothelial neoplasm and can be represented by a broad spectrum of disorders with vastly different treatment pathways, ranging from papillary (Ta) grade I tumor all the way to a highly aggressive and heterogeneous disease like a muscle invasive grade II tumor. It is the most common malignancy of the urinary tract [1], the sixth most commonly occurring cancer in men, and the seventeenth most commonly occurring cancer in women [2]. There were 550,000 new cases in 2018 [2]. Lebanon had the highest rate of bladder cancer in 2018, followed by Greece [2]. Factors that may favor the development of bladder cancer are tobacco smoke, exposure to chemical compounds such as those found in the chemical and rubber industries [3], genetic susceptibility [4], occupational risk, dietary factors, environmental pollution, and medical conditions [5].
p53 is a very important marker for cancer diagnosis and treatment [6,7]. p53 is the most investigated molecular marker in cancers; changes in p53 have been used to predict bladder cancer early detection, recurrence, progression, and mortality. Lower levels of 12.0 pg/mL predict bladder cancer. E-cadherin has a high importance in cell–cell adhesion in epithelial tissues: immunohistochemistry expression and its levels in blood have been linked to tumor aggression; and lower levels than 15 pg/mL are associated with bladder cancer [8,9]. BTA is the bladder tumor antigen and is used to detect BC from urine samples. Tests such as urine dipstick, cystoscopy, and urine cytology have been replaced in the first instance by the BTA stat test for the diagnosis of BC; pg/mL levels to ng/mL levels in whole blood are associated with bladder cancer [10]. Lokeshwar et al. stated in their paper that concentrations of hyaluronic acid are elevated in several tumors [11] including cancers of the bladder, prostate, lung, colon, intestine, and breast. An elevated value is also found in the tumor tissues and urine of bladder carcinoma patients where the sensitivity associated with bladder cancer detection (91.00%) is high; the specific range for bladder cancer was 170–500 pg/mL. The selection of biomarkers for bladder cancer was undertaken by specialists in bladder cancer, according to the statistics available, as our scope was focused on the development of a new and fast method of screening for these biomarkers, which can be found in biological fluids as well as in tumoral tissues, and not to establish if they were the best to be used in the early detection of bladder cancer.
Stochastic sensors are the only sensors able to perform qualitative and quantitative analysis. These are used for the biomedical analysis of biomarkers such as HER1, HER2, interleukins, CA19-9 [12,13,14], and their mechanism of signal development has been investigated on several occasions [12,13,14,15,16,17,18].
To our knowledge, for the assay of the proposed biomarkers, the best methods recorded to date are histochemistry for the qualitative assay of p53 [19], amperometry using an immunosensor [20], and a magnetoimmunosensor [21] for the quantitative assay of p53 [20], for E-cadherin, it is amperometry using an immunosensor [22], for BTA it is an immunoassay [23], while for the assay of hyaluronic acid, the best results were obtained using a colorimetric enzyme-coupled technique [24]. None of these methods can be applied for the simultaneous assay of the four biomarkers, and these methods cannot be applied for in vivo analysis of the biomarkers in biological fluids or tumoral tissue samples. The in vivo measurements may be needed for continuous monitoring of patients with high risk of developing this type of cancer or with risk of metastasis, or for monitoring the efficiency of the treatment, and therefore, there is a need to have needle type sensors that can be used for in vivo continuous monitoring.
In this paper, we proposed three new stochastic needle sensors based on graphite paste, modified with three types of chitosan (chitosan I (n = 371–744), chitosan II (n = 682–930), and chitosan III (n = 868–1365)) for the pattern recognition of p53, E-cadherin, BTA, and hyaluronic acid in whole blood and tissue samples with high sensitivity. The materials used for the design of the stochastic sensors were chosen for the following reasons: (1) graphite and chitosan are biocompatible materials (essential if one would like to perform in vivo analysis at a later stage), and (2) chitosan has the pores needed for the development of a signal specific for stochastic sensors. The novelty of this paper is the design of the stochastic sensors as well as the simultaneous recognition and analysis of p53, E-cadherin, BTA, and hyaluronic acid in biological samples.

2. Materials and Methods

2.1. Chemicals

All chemicals were of analytical grade. p53, E-cadherin, BTA, hyaluronic acid, graphite powder, chitosan I (n = 371–744), chitosan II (n = 682–930), chitosan III (n = 868–1365), and dimethyl sulfoxide (DMSO) were purchased from Sigma Aldrich (Milwaukee, USA). The paraffin oil was purchased from Fluka (Buchs, Switzerland).
For each analyte, standard solutions were used in order to determine the biomarkers of interest. The dilutions containing p53 (concentration range between 1.17 × 10⁻¹⁵–7.14 µg/mL), E-cadherin (concentration range between 6.50 × 10⁻¹⁵–20.00 µg/mL) and hyaluronic acid (concentration range between 3.00 × 10⁻¹⁵–0.30 mg/mL) were prepared using a phosphate buffer solution (PBS) that had the same pH value (pH = 7.5) and the dilutions containing BTA (concentration range between 2.00 × 10⁻¹⁴–0.20 mg/mL) were prepared using DMSO. An wide concentration range was selected for each biomarker in order to be able to see if the proposed sensors could be used for the early and late diagnosis of bladder cancer.

2.2. Instruments

For all measurements, a potentiostat/galvanostat AUTOLAB/PGSTAT 302 (Methrom, Utrecht, The Netherland) connected to a personal computer with GPES software installed was used. An electrochemical cell containing a three electrode system was also employed. The three electrode system was made out of the working electrode, which is the proposed stochastic needle sensor; the reference electrode, also known as the Ag/AgCl electrode; and the counter electrode, represented by a platinum wire.

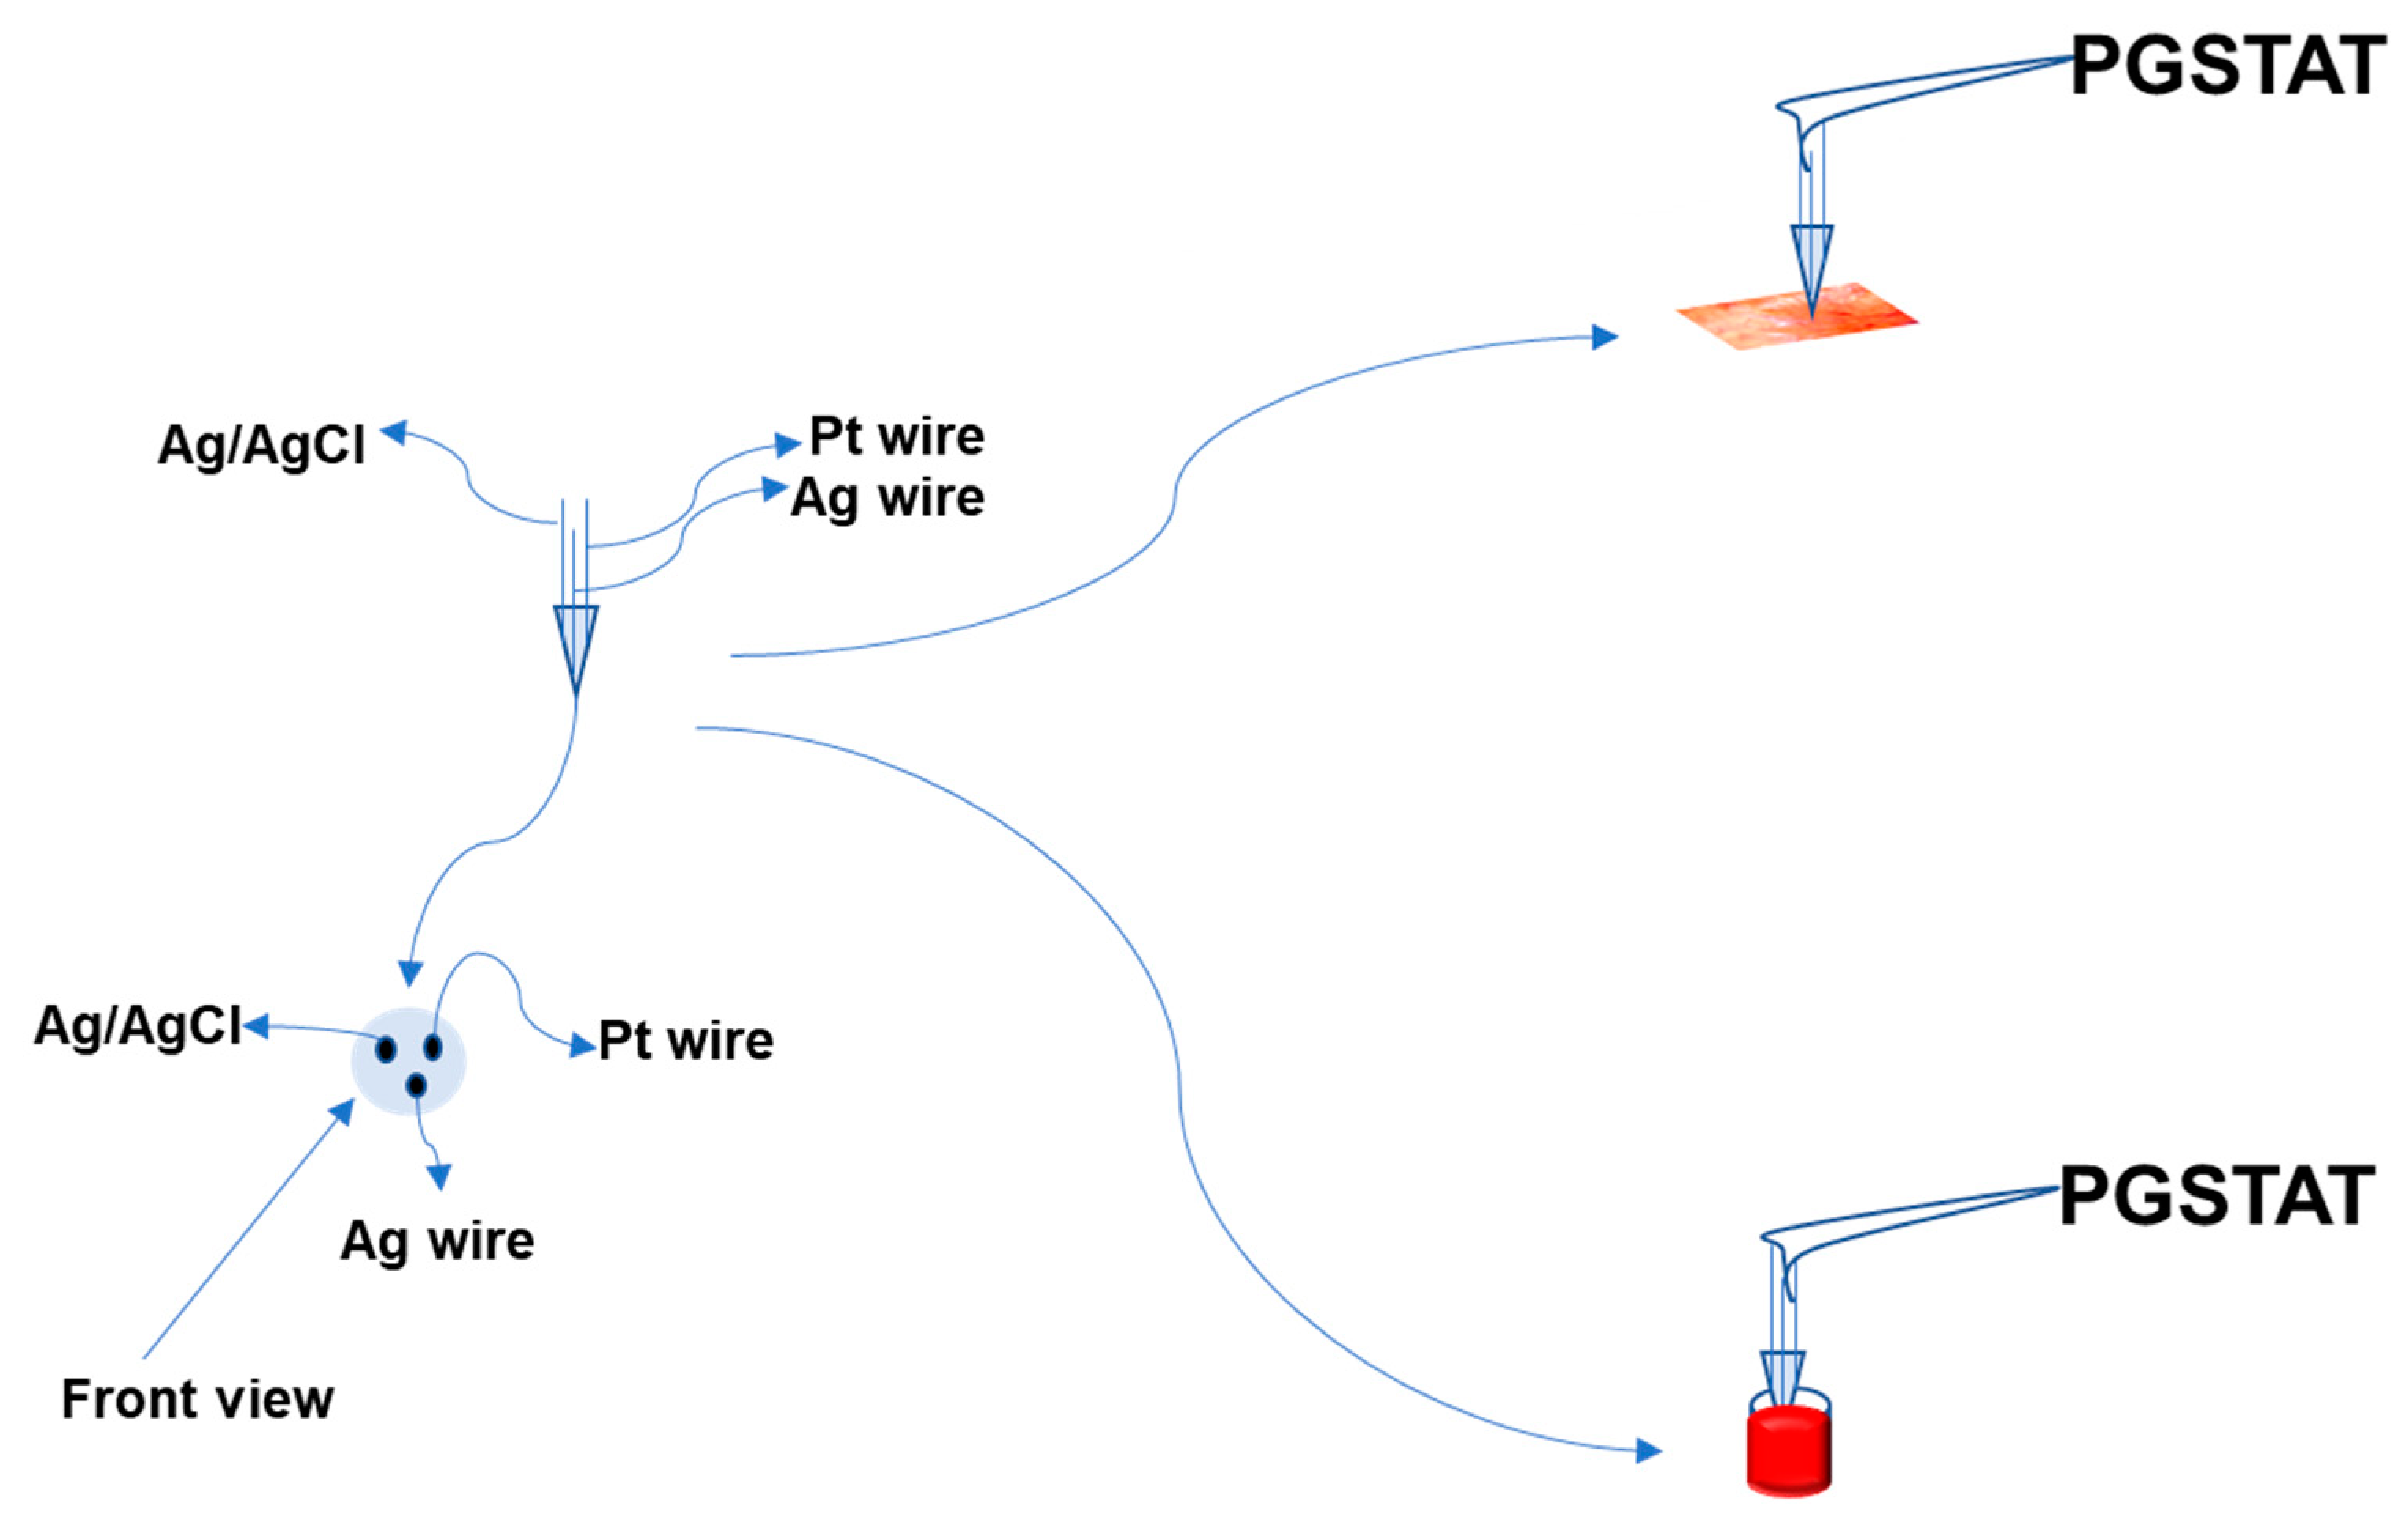
2.3. Design of the Stochastic Needle Sensors

For the construction of the three stochastic needle sensors, graphite powder was mixed with paraffin oil until a homogeneous paste was obtained. In order to obtain the modified pastes, solutions of chitosan I, chitosan II, and chitosan III (10−3 mol/L) were added to the pastes in a ratio of 1:1 (w/v; mg/µL). Each modified paste was placed in a non-conducting plastic tube (internal diameter 50 µm); a silver wire performed the electric contact between the pastes and the external circuit (Scheme 1).

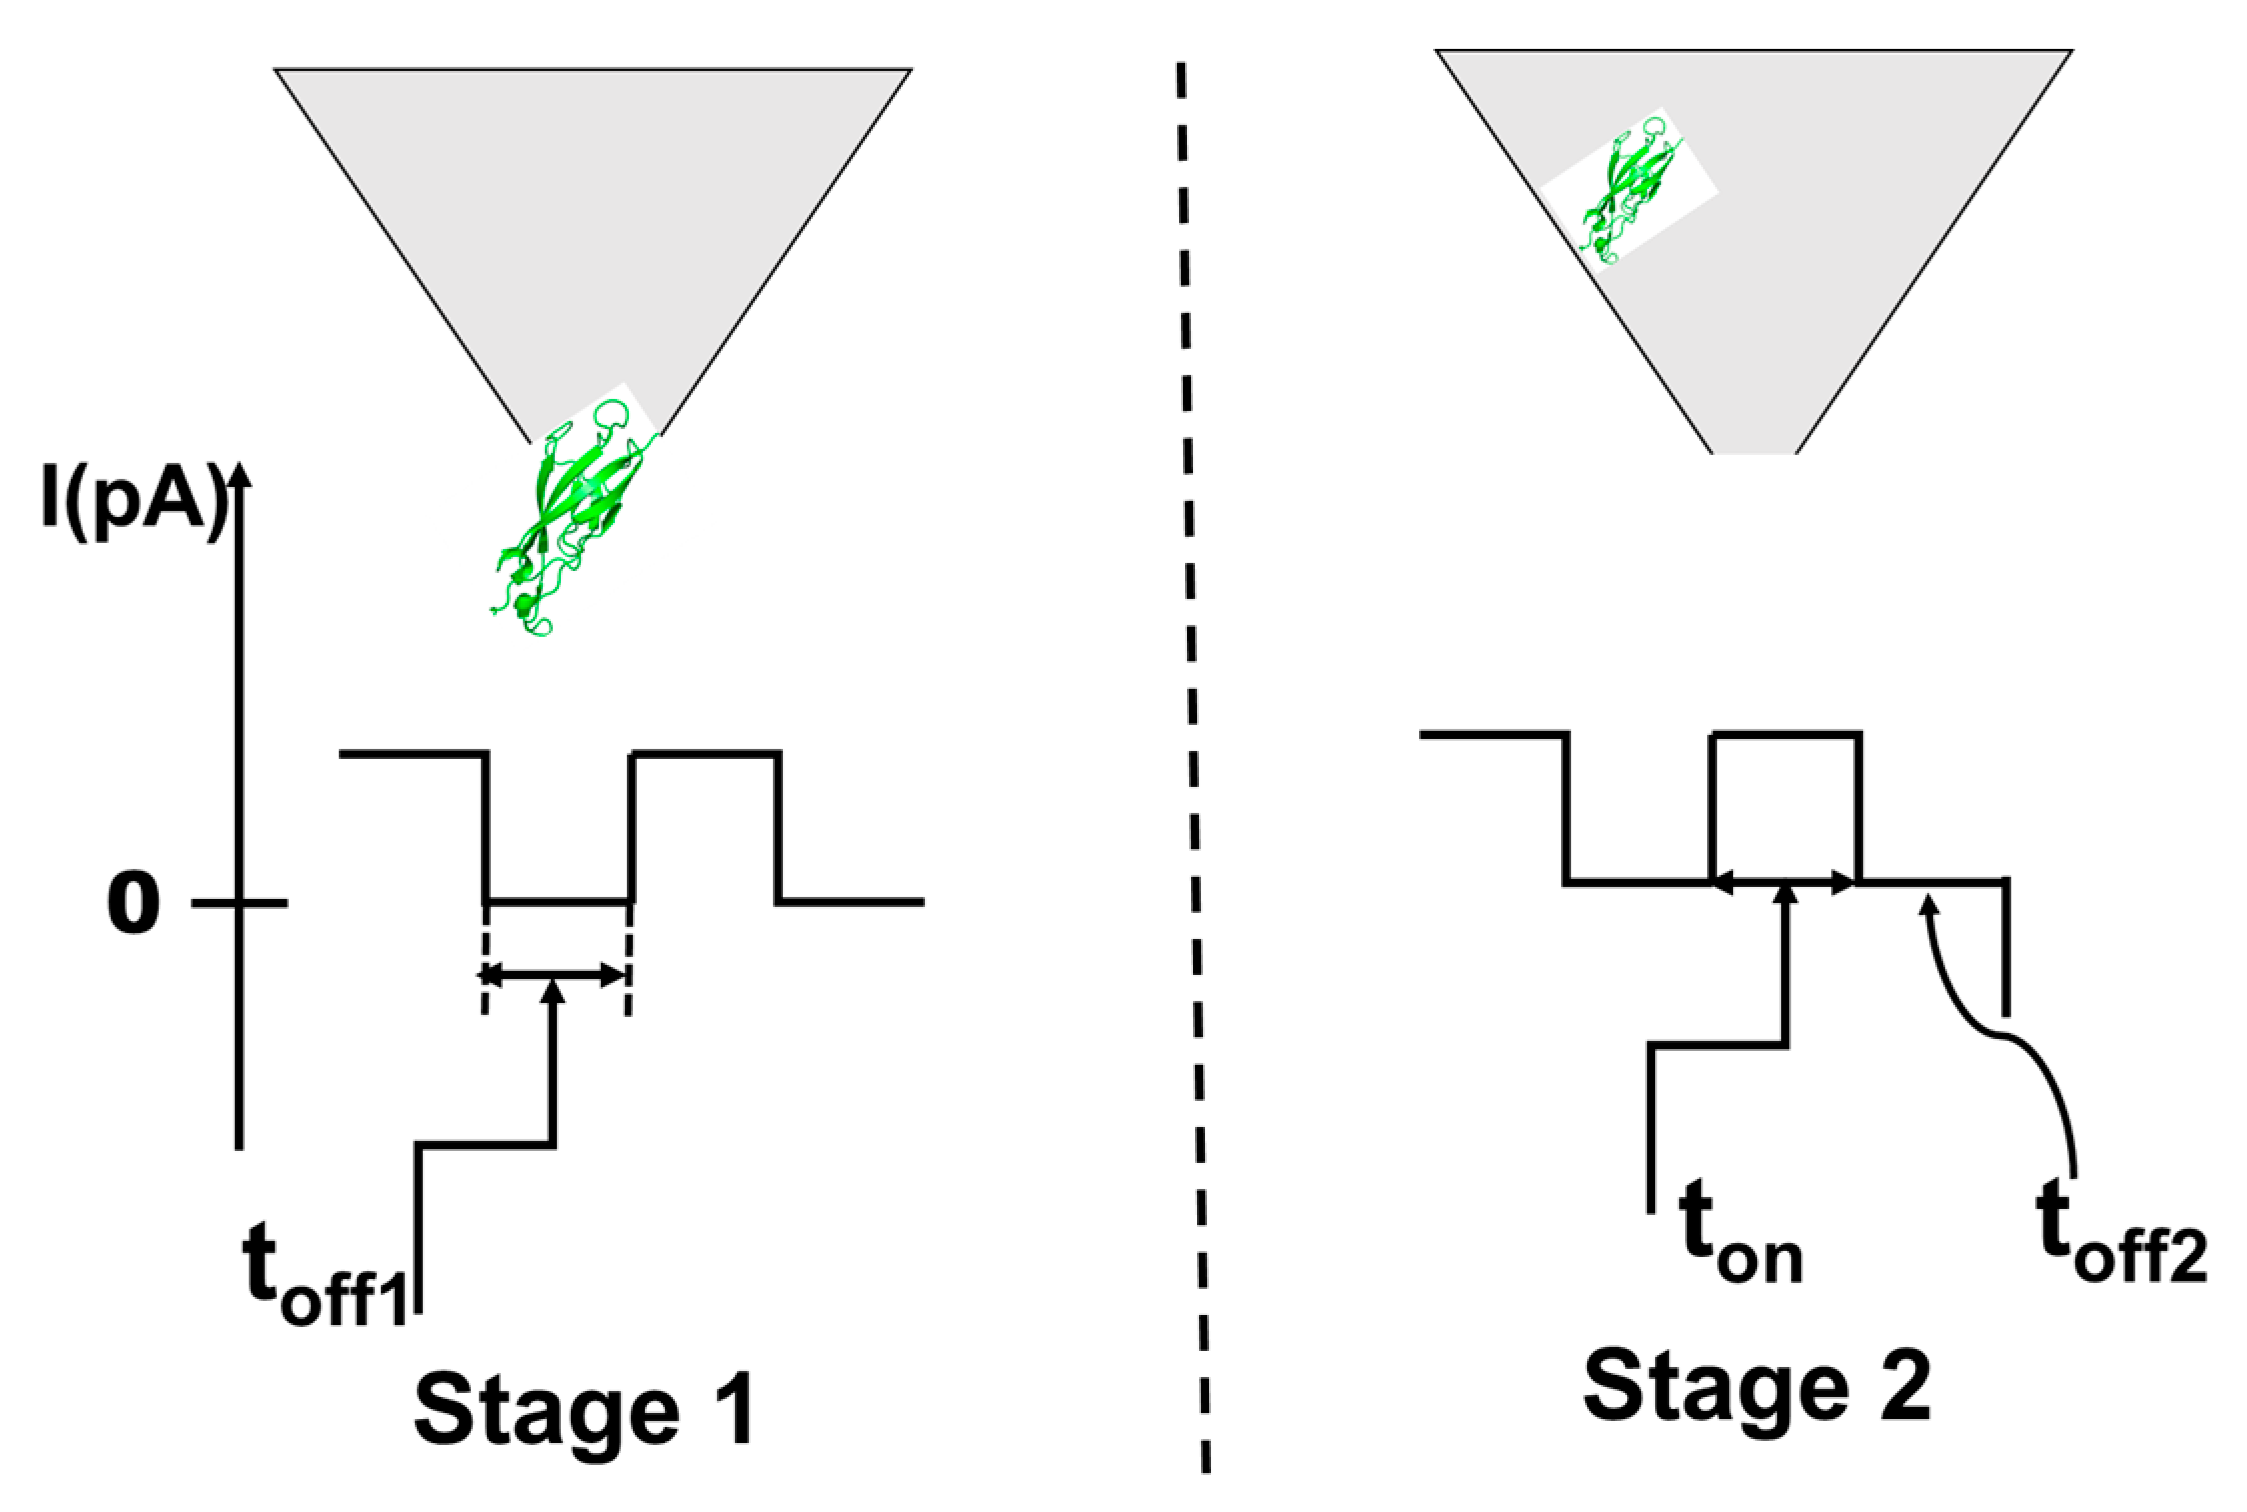
2.4. Stochastic Mode

All measurements were performed using the stochastic mode. The principle of the stochastic needle sensors is based on the channel conductivity. A constant potential of 125 mV was applied and the current was recorded; interval time for the measurements was set to 0.2 s. This method was used for both the qualitative and the quantitative analysis of p53, E-cadherin, BTA, and hyaluronic acid from whole blood and tissue samples of confirmed patients. Two parameters were identified, toff and ton, respectively. The toff is known as the signature of the analyte and its value is used for qualitative analysis in pattern recognition. The ton is known as the necessary time of equilibrium for the interaction of the analyte with the wall channel and represents the quantitative parameter (1/ton = a + bxCbiomarker) (Scheme 2, Figure 1 and Figure 2). The equations of calibration were obtained using the linear regression method.

2.5. Samples

Whole blood and tissue samples were received from the Clinic Hospital “Prof. Dr. Th. Burghele” Bucharest. Samples from healthy (10 whole blood samples) and confirmed patients with bladder cancer (whole blood and tissue samples, 30 samples from each) were collected in accordance with the procedures specified in the Ethics Committee Approval no. 11/2013 awarded by the University of Medicine and Pharmacy Carol Davila from Bucharest. Written consent was obtained from all patients. After the samples were collected, immediate analysis was performed. No sample pre-treatment was performed.

3. Results and Discussions

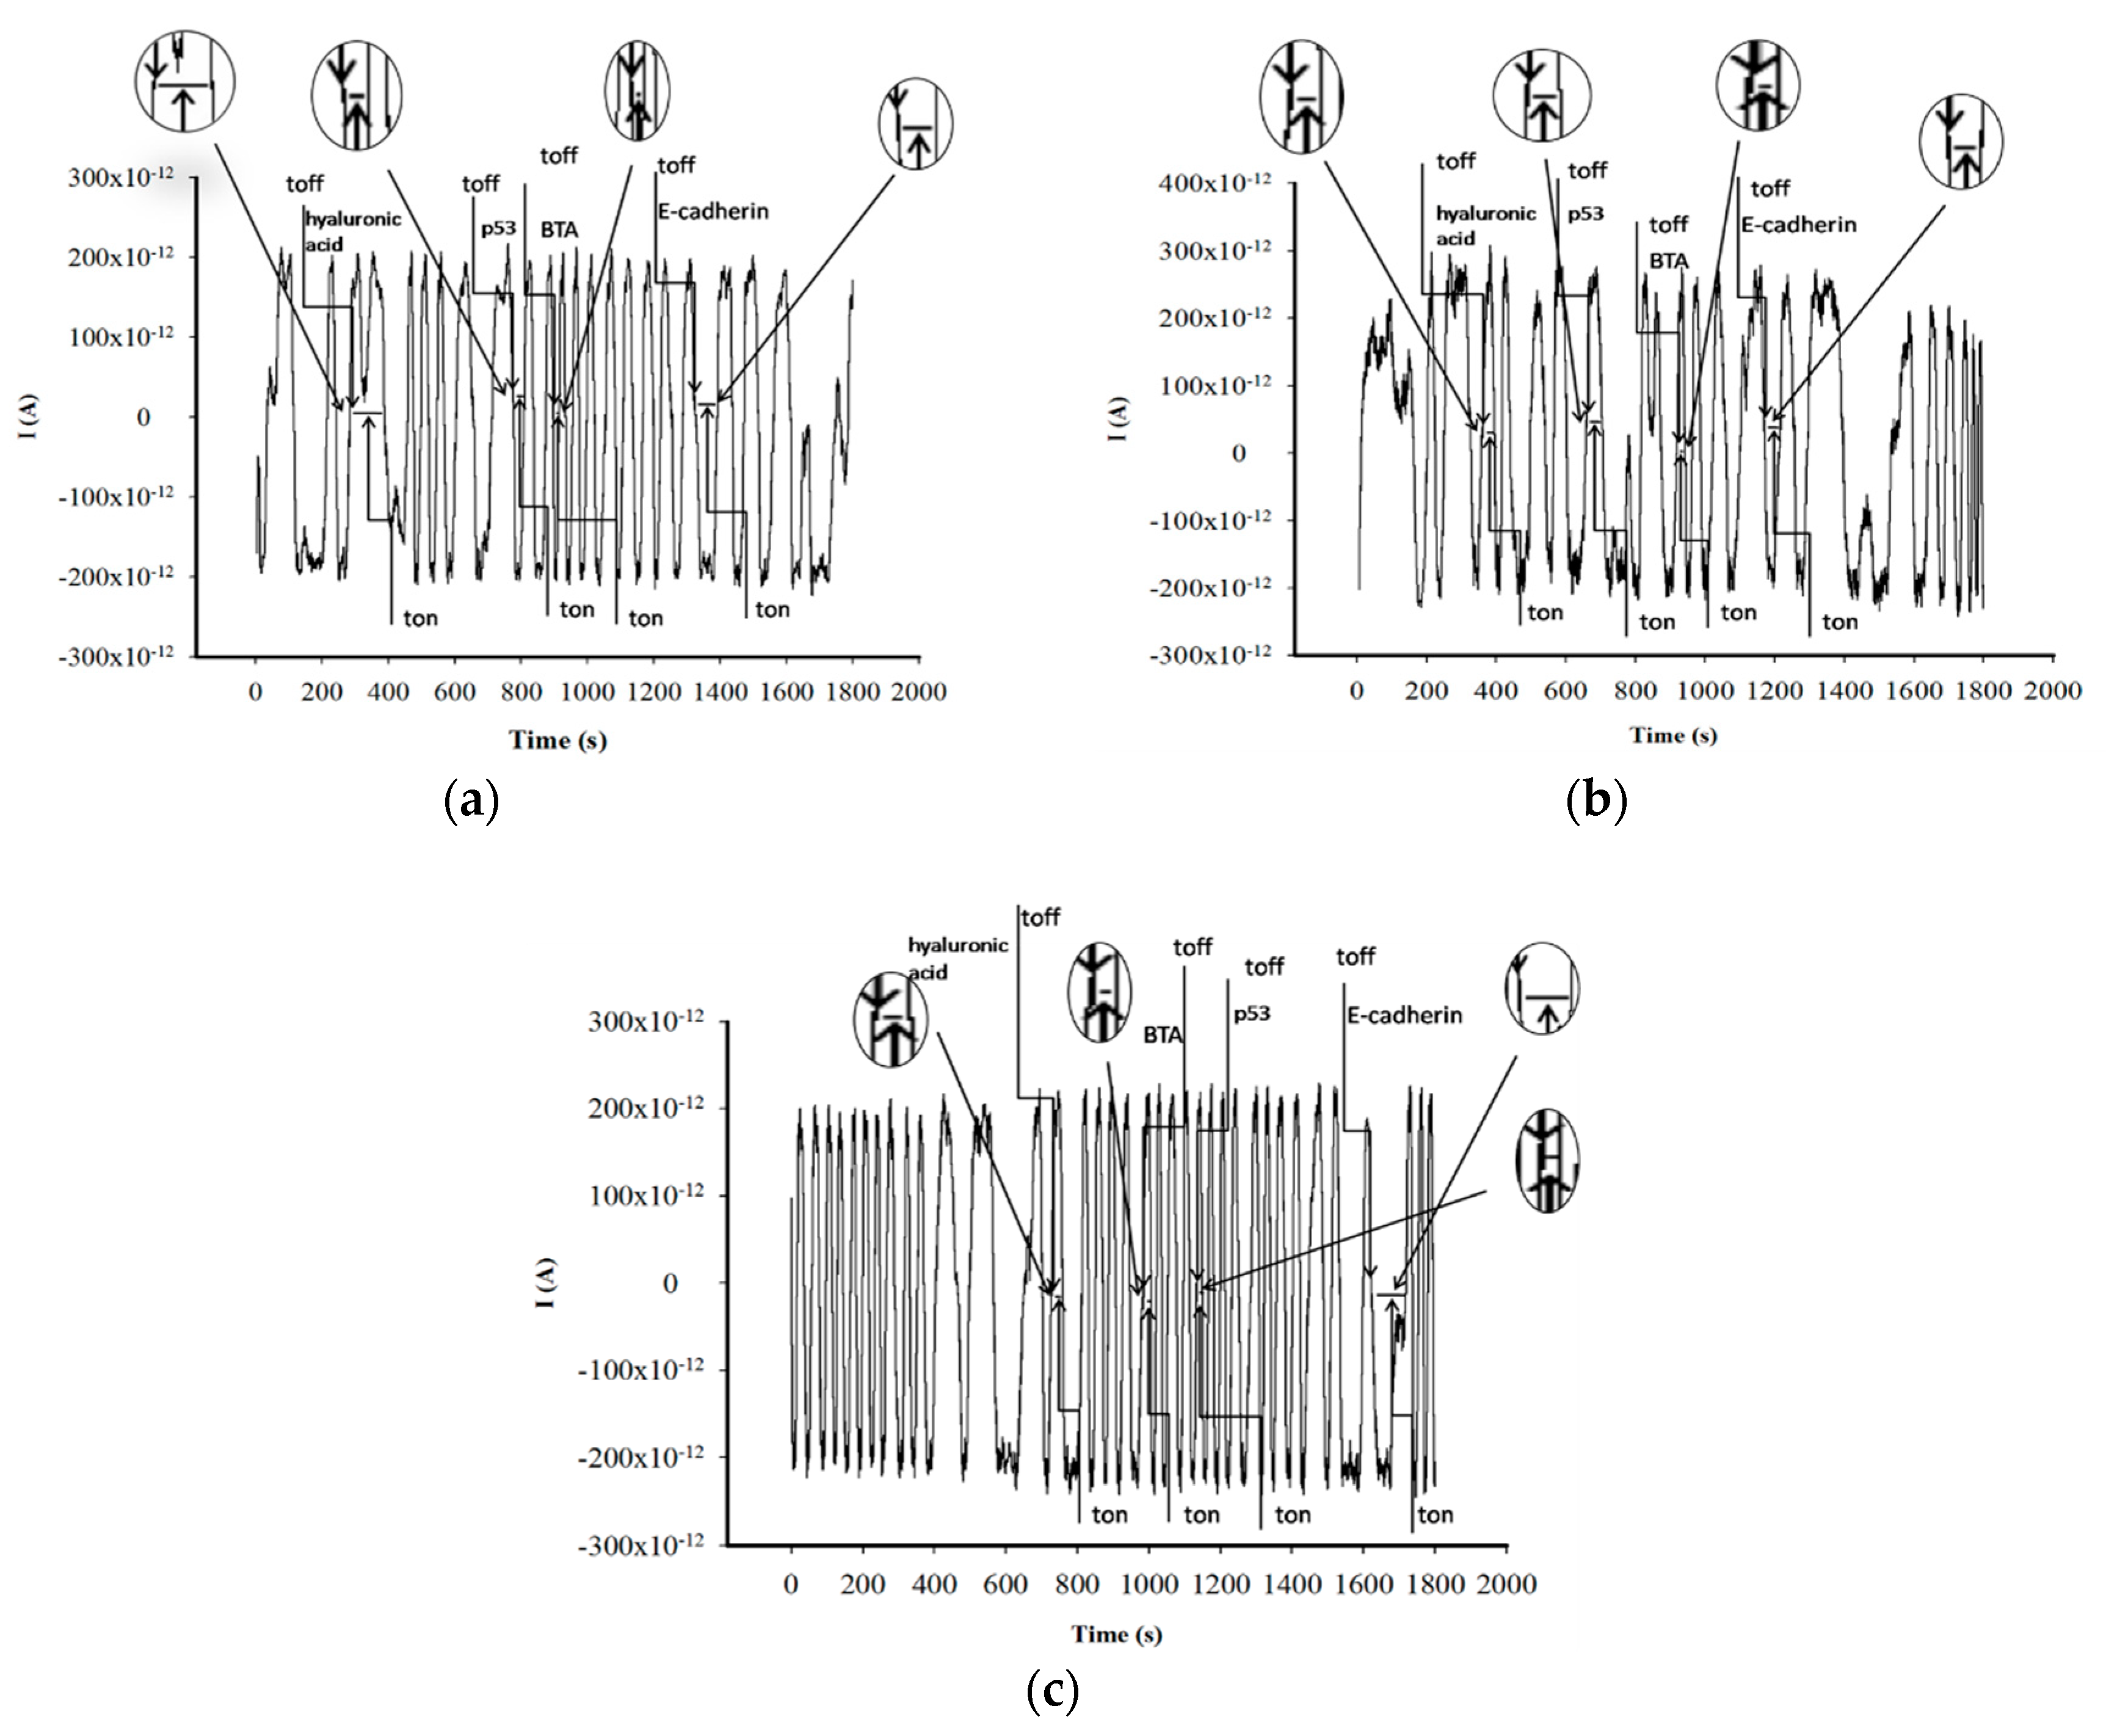
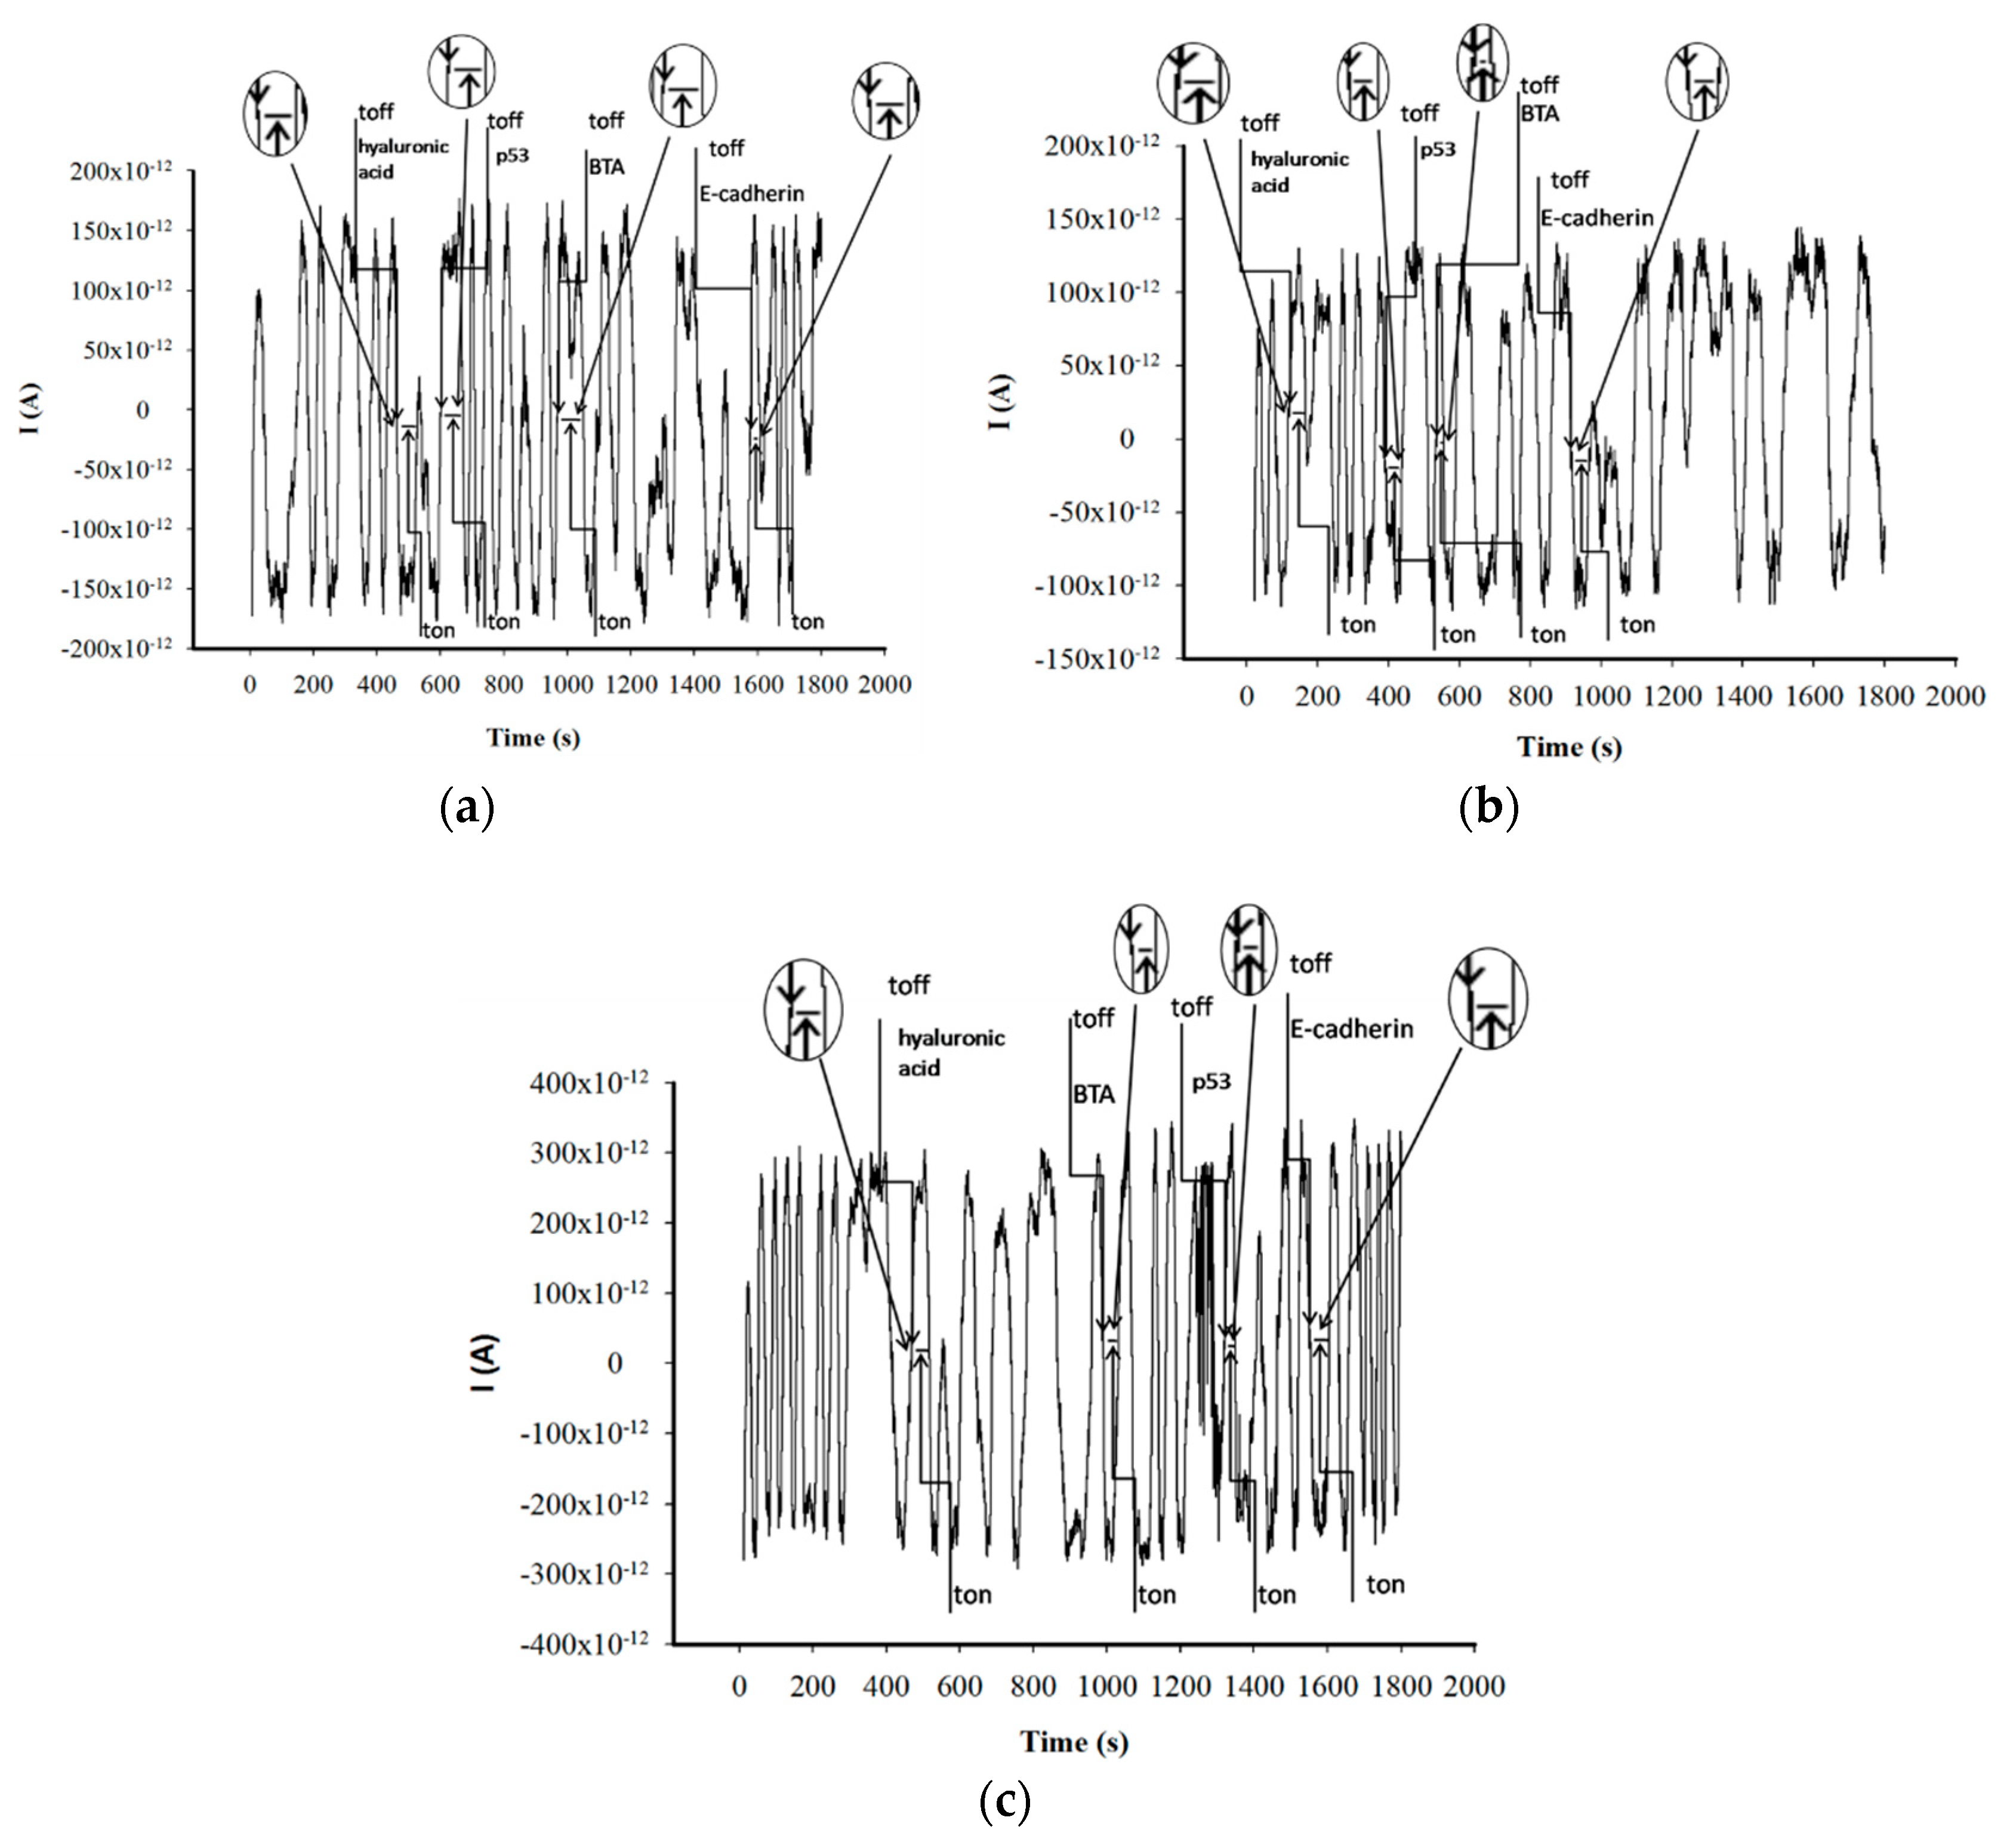
3.1. Response Characteristics of Stochastic Needle Sensors

The response of the stochastic needle sensors was based on the conductivity of the channel [12,13,14]: the current that flowed through a channel was modified when the analyte entered the channel after a constant potential of 125 mV was applied. The molecular recognition of the analyte of interest took place in two phases. During the first phase, also known as the pattern recognition phase, by applying the potential, the analyte of interest is extracted from the solution into the membrane-solution of the interface, blocking the channel, and the intensity of the channel drops to zero until the whole molecule enters the channel; the time spent on this phase is known as the signature of the analyte (toff value) and its value is used for the qualitative analysis of the analyte of interest (Scheme 2). The signature of the biomarker depends on the size of the biomarker, the geometry of the biomarker; if the biomarker has a 2D or 3D shape (e.g., is protein), the unfolding speed contributes to the value of the signature. According to this, the signature value is cumulating all the responsible time values (size, geometry, unfolding speed), resulting in the time needed to pass from the solution inside the channel. All analytes including biomarkers from a sample going inside the channel are in the order given by their size, shape, and unfolding speed. Therefore, it is difficult to find two analytes that have the same signature when analyzed with the same sensor.
The second phase, known as the binding phase, takes place when the analyte interacts with the wall channel and redox processes take place (Scheme 2). The following equations of equilibrium took place on the binding phases:
Ch(i) + p53(i) ⇔ Ch • p53(i)
Ch(i) + E-cadherin(i) ⇔ Ch • E-cadherin(i)
Ch(i) + BTA (i) ⇔ Ch • BTA (i)
Ch(i) + hyaluronic acid(i) ⇔ Ch • hyaluronic acid(i)
where Ch is the channel and i is the interface. The equilibrium time necessary for the interaction between the analyte and the wall channel, as well as for the redox processes (oxidation or reduction) depends on the molecule analyzed (if it can be oxidized or reduced). According to the redox reaction, the current oscillates between positive and negative values can be defined as ton and it represents the quantitative parameter (Figure 1 and Figure 2). After the redox processes take place, the polarity of the analyte changes and it extracted back into the solution. The value of ton is read in between two toff values (see Scheme 2).
The response characteristics for p53, E-cadherin, BTA, and hyaluronic acid were determined using the ton values and are shown in Table 1. The signatures of the biomarkers (toff values) (p53, E-cadherin, BTA, and hyaluronic acid) were different for the same stochastic needle sensor, indicating that the sensors were selective and that they could be used for the screening tests of whole blood and tissue samples.
The type of chitosan selected (the degree of polymerization) did not influence the limit of determination for E-cadherin, BTA, and hyaluronic acid; in the case of p53, the same limit of determination was obtained when chitosan I and chitosan II were used for the design of the stochastic needle sensors, while a lower limit of determination was obtained when chitosan III was used for the design of the stochastic needle sensor.
The type of chitosan influenced the sensitivity of the measurements: for the assay of p53, the highest sensitivity was obtained for the chitosan I based stochastic needle sensor; for the assay of E-cadherin, the highest sensitivity was obtained for the stochastic needle sensor based on chitosan III; for the assay of BTA, the highest sensitivity was obtained for the chitosan I based stochastic sensor; and for the assay of hyaluronic acid, the highest sensitivity was obtained for the chitosan II based stochastic sensor.
The linear concentration ranges obtained for all stochastic needle sensors covered the asymptomatic patients as well as patients in different stages of bladder cancer. Accordingly, they can be used for screening tests of both asymptomatic and clinically ill patients.
The stochastic needle sensors were used continuously for two years, for the assay of p53, E-cadherin, BTA, and hyaluronic acid. For the two year time period, the variation of their sensitivity was less than 1.00%, indicating their high reliability. Five pastes of the same sensor were made and placed in different plastic tubes; response characteristics of each of the 15 sensors were determined; for the chitosan I based stochastic needle sensor, the sensitivity varied with 0.15%; for the chitosan II based sensor, the sensitivity varied with 0.09%; and for the chitosan III based sensor, the sensitivity varied with 0.10%. These results prove that the design proposed for the sensors is reliable.
The selectivity of the stochastic sensors was determined using the toff values of the biomarkers and other analytes from the biological sample. Different toff values mean selectivity versus those biomarkers/analytes. To date, we could not find the same toff values (signatures) for two biomarkers/analytes, but this does not mean that these sensors are specific. First, the four tested biomarkers had different signatures (Table 1). Carcinoembryonic antigen (CEA), dopamine, HER 1 and HER2 were also tested as possible interfering species, but different signatures were obtained for all of them, proving the selectivity of the proposed stochastic sensors. For the chitosan I based sensor, the signatures obtained were: 3.4 s for CEA, 2.8 s for HER1, and 2.4 s for HER2; for the chitosan II based sensor, the signatures obtained were: 3.2 s for CEA, 2.8 s for HER1, and 2.3 s for HER2; and for the chitosan III based sensor, the signatures obtained were: 3.0 s for CEA, 2.7 s for HER1, and 2.3 s for HER2.
When applying histochemistry for the assay of p53, only a qualitative assay was achieved [19]; limits of detection of 14 pmol/L and 1.29 ng/mL were obtained using an amperometric immunosensor [20] and an amperometric magnetoimmunosensor [21]. For E-cadherin, the best limit of detection obtained to date has been 0.16 ng/mL using an amperometric immunosensor [22], and for BTA, the best limit of determination was 34 U/mL (achieved using immunoassay) [23], while for the assay of hyaluronic acid using a colorimetric enzyme-coupled technique, a limit of detection of 0.3 mg/L was achieved [24]. The proposed stochastic needle sensors had better performances in terms of limits of quantification/determination and sensitivity, and can be used for the simultaneous assay of the four biomarkers.

3.2. Analytical Applications

The response characteristics of the stochastic sensors enabled their utilization for the fast screening of whole blood and tissue samples for p53, E-cadherin, BTA, and hyaluronic acid. After recording the diagrams (Figure 1 and Figure 2), the biomarkers were identified in accordance with their signatures (toff values) (Table 1); the corresponding value for ton was read in the diagrams, and the concentration of each biomarker was determined according to the stochastic mode proposed above.
The first step toward validating this method consisted of assaying the biomarkers in whole blood samples obtained from healthy patients, which were spiked with p53, E-cadherin, BTA, and hyaluronic acid.
To prove the accuracy of the method, recovery tests were performed for the assay of p53, E-cadherin, BTA, and hyaluronic acid in spiked samples of whole blood, where known amounts of each biomarker were added, the results of which are shown in Table 2. To perform the recovery test, known quantities of biomarkers were added to whole blood samples and tissue samples; the quantities of the biomarkers were determined before and after the addition of the biomarkers; the difference between the total and initial quantity of the biomarker (the recovered amount) was compared with the quantity of the biomarker added to the sample. As can be seen, recoveries higher than 95.00% were recorded for all biomarkers. Ten whole blood samples from healthy people were analyzed, and the quantities of p53, hyaluronic acid, and E-cadherin were found in the ranges of healthy patients, while BTA was not found in any sample.
Whole blood (50 µL of sample) and tumor tissue samples from patients confirmed with bladder cancer were screened using the proposed stochastic needle sensors and the proposed method. The results are shown in Table 3 and Table 4. Very good correlations were obtained between the values of the determined biomarkers using the stochastic sensors, proving the high reliability of the proposed screening method.
Compared to other methods proposed to date for the assay of these biomarkers, the proposed method is highly reliable, can be used for the simultaneous assay of the proposed biomarkers, is fast, and no sample treatment is needed.
The stochastic sensors were used for more than 100 measurements without refreshing their surfaces and the active surface was washed with distilled water and dried between two measurements of whole blood or tissue samples.

4. Conclusions

Three stochastic needle sensors based on graphite paste modified with three types of chitosan: chitosan I (n = 371–744), chitosan II (n = 682–930), and chitosan III (n = 868–1365) were used for the screening of whole blood and tissue samples for four bladder cancer biomarkers. The stochastic needle sensors demonstrated high sensitivity, low limits of determination of these analytes in whole blood and tissue samples, and high reliability when used for the screening of the biological samples.

Author Contributions

R.-I.S.-v.S. and D.-C.G. performed all the electrochemical measurements; V.J., C.S.S. and M.G. selected the whole blood and tissue samples; R.-I.S.-v.S., D.-C.G., V.J., C.S.S. and M.G. contributed to data validation and wrote the manuscript. All authors have read and agreed to the published version of the manuscript.

Funding

This research received no external funding.

Conflicts of Interest

The authors declare no conflicts of interest.

References

  1. Siegel, R.; Naishadham, D.; Jemal, A. Cancer statistics, 2012. CA Cancer J. Clin. 2012, 62, 10–29. [Google Scholar] [CrossRef] [PubMed] [Green Version]
  2. World Cancer Research Fund. Available online: https://www.wcrf.org/dietandcancer/cancer-trends/bladder-cancer-statistics (accessed on 20 January 2020).
  3. Burger, M.; Catto, J.W.F.; Dalbagni, G.; Grossman, H.B.; Herr, H.; Karakiewicz, P.; Kassouf, W.; Kiemeney, L.A.; la Vecchia, C.; Shariat, S. Epidemiology and Risk Factors of Urothelial Bladder Cancer. Eur. Urol. 2012, 63, 234–241. [Google Scholar] [CrossRef]
  4. de Maturana, E.L.; Rava, M.; Anumudu, C.; Sáez, O.; Alonso, D.; Malats, N. Bladder Cancer Genetic Susceptibility. A Systematic Review. Bladder Cancer 2018, 4, 215–226. [Google Scholar] [CrossRef] [PubMed] [Green Version]
  5. Goodison, S.; Rosser, C.J.; Urquidi, V. Bladder Cancer Detection and Monitoring: Assessment of Urine- and Blood-Based Marker Tests. Mol. Diagn. Ther. 2013, 17, 71. [Google Scholar] [CrossRef] [PubMed] [Green Version]
  6. Cheng, L.; Davison, D.D.; Adams, J.; Lopez-Beltran, A.; Wang, L.; Montironi, R.; Zhang, S. Biomarkers in bladder cancer: Translational and clinical implications. Crit. Rev. Oncol. Hematol. 2014, 89, 71–111. [Google Scholar] [CrossRef]
  7. Cheng, L.; Zhang, D. Molecular Genetic Pathology; Humana Press/Springer: New York, NY, USA, 2008. [Google Scholar]
  8. Nives, S.-P. Tumor suppressor gene E-Cadherin and its role in normal and malignant cells. Cancer Cell Int. 2003, 3, 17. [Google Scholar]
  9. Gumbiner, B.M. Cell adhension: The molecular basis of tissue architecture and morphogenesis. Cell 1996, 84, 345–357. [Google Scholar] [CrossRef] [Green Version]
  10. Malkowicz, S.B. The application of human complement factor h-related protein (BTA TRAK) in monitoring patients with bladder cancer. Urol. Clin. North Am. 2000, 27, 63–73. [Google Scholar] [CrossRef]
  11. Lokeshwar, V.B.; Schroeder, G.L.; Selzer, M.G.; Hautmann, S.H.; Posey, J.T.; Duncan, R.C.; Watson, R.; Rose, L.; Markowitz, S.; Soloway, M.S. Bladder tumor markers for monitoring recurrence and screening comparison of hyaluronic acid-hyaluronidase and BTA-Stat Tests. Cancer 2002, 95, 61–72. [Google Scholar] [CrossRef]
  12. Moldoveanu, I.; Stanciu-Gavan, C.; Stefan-van Staden, R.I. Molecular recognition of HER-1 in whole blood samples. J. Molec. Recogn. 2014, 27, 653–658. [Google Scholar] [CrossRef]
  13. Moldoveanu, I.; Stefan-van Staden, R.I. Pattern recognition of HER-2 in whole blood samples using stochastic microsensors. ESC J. Solid State Sci. Technol. 2015, 4, S3067–S3070. [Google Scholar] [CrossRef] [Green Version]
  14. Stefan-van Staden, R.I.; Ilie, R.M.; Gugoasa, L.A.; Bilasco, A.; Visan, C.A.; Streinu-Cercel, A. Molecular recognition of IL-8, IL-10, IL-12, and IL-15 in biological fluids using phthalocyanine based stochastic sensors. Anal. Bioanal. Chem. 2018, 410, 7723–7737. [Google Scholar] [CrossRef] [PubMed]
  15. Campos, E.J.; Yates, J. Single molecule characterization of metal nanoparticles using nanopore-based stochastic detection methods. Sens. Actuators B 2018, 255, 2032–2049. [Google Scholar] [CrossRef]
  16. Howorka, S.; Siwy, Z. Nanopore analytics: Sensing of single molecules. Chem. Soc. Rev. 2009, 38, 2360–2384. [Google Scholar] [CrossRef]
  17. Wanunu, M.; Dadosh, T.; Ray, V.; Jin, J.; McReynolds, L.; Drndic, M. Rapid electronic detection of probe-specific microRNA using thin nanopore sensors. Nat. Nanotechnol. 2010, 5, 807–814. [Google Scholar] [CrossRef]
  18. Bayley, H.; Cremer, P.S. Stochastic sensors inspired by biology. Nature 2001, 413, 226–230. [Google Scholar] [CrossRef]
  19. Liu, J.; Li, W.; Deng, M.; Liu, D.; Ma, Q.; Feng, X. Immunohistochemical determination of p53 protein overexpression for predicting p53 gene mutations in hepatocellular carcinoma: A meta-analysis. PLoS ONE 2016, 11, e0159636. [Google Scholar] [CrossRef]
  20. Giannetto, M.; Bianchi, M.V.; Mattarozzi, M.; Careri, M. Competitive amperometric immunosensor for determination of p53 protein in urine with carbon nanotubes/gold nanoparticles screen-printed electrodes: A potential rapid and noninvasive screening tool for early diagnosis of urinary tract carcinoma. Anal. Chim. Acta 2017, 991, 133–141. [Google Scholar] [CrossRef]
  21. Pedrero, M.; de Villena, F.J.M.; Muñoz-San Martín, C.; Campuzano, S.; Garranzo-Asensio, M.; Barderas, R.; Pingarrón, J.M. Disposable amperometric immunosensor for the determination of human p53 protein in cell lysates using magnetic micro-carriers. Biosensors 2016, 6, 56. [Google Scholar] [CrossRef] [Green Version]
  22. Muñoz-San Martín, C.; Pedrero, M.; de Villena, F.J.M.; Garranzo-Asensio, M.; Rodríguez, N.; Domínguez, G.; Barderas, R.; Campuzano, S.; Pingarrón, J.M. Disposable amperometric immunosensor for the determination of the E-cadherin tumor suppressor protein in cancer cells and human tissues. Electroanalysis 2019, 31, 309–317. [Google Scholar]
  23. Priolo, G.; Gontero, P.; Martinasso, G.; Mengozzi, G.; Formiconi, A.; Pelucelli, G.; Zitella, A.; Casetta, G.; Viberti, L.; Aimo, G.; et al. Bladder tumor antigen assay as compared to voided urine cytology in the diagnosis of bladder cancer. Clin. Chim. Acta 2001, 305, 47–53. [Google Scholar] [CrossRef]
  24. Pepeliaev, S.; Hrudíková, R.; Jílková, J.; Pavlík, J.; Smirnou, D.; Černý, Z.; Franke, L. Colorimetric enzyme-coupled assay for hyaluronic acid determination in complex samples. Eur. Polym. J. 2017, 94, 460–470. [Google Scholar]
Scheme 1. Needle stochastic sensor design, and tissue and whole blood measurements set-up.
Sensors 20 02420 sch001
Scheme 2. Current development for stochastic sensors, example for the detection of one biomarker.
Sensors 20 02420 sch002
Figure 1. Pattern recognition of p53, E-cadherin, BTA, and hyaluronic acid in whole blood samples using the stochastic needle sensor based on chitosan I/graphite (a), chitosan II/graphite (b), and chitosan III/graphite (c).
Sensors 20 02420 g001
Figure 2. Pattern recognition of p53, E-cadherin, BTA, and hyaluronic acid in tissue samples using the stochastic needle sensor based on chitosan I/graphite (a), chitosan II/graphite (b), and chitosan III/graphite (c).
Sensors 20 02420 g002
Table 1. The response characteristics of the stochastic sensors used for the assay of p53, E-cadherin, BTA, and hyaluronic acid.
Sensor Based on Graphite Paste and Signature of the Biomarker toff (s)Linear Concentration Range (mg/mL) Equation of Calibration; Correlation CoefficientSensitivity
(s−1/mg mL−1)
Limit of Quantification
(mg/mL)
p53
Chitosan I0.81.17 × 10−12
1.00 × 10⁻⁸
1/ton = 0.04 + 8.88 × 10⁸ × C
r = 0.9956
8.88 × 1081.17 × 10−12
Chitosan II1.21.17 × 10−12
1.00 × 10⁻⁸
1/ton = 0.03 + 2.83 × 10⁸ × C
r = 0.9961
2.83 × 1081.17 × 10−12
Chitosan III1.35.28 × 10−15
2.93 × 10⁻⁷
1/ton = 0.03 + 7.97 × 10⁸ × C
r = 0.9998
7.97 × 1085.28 × 10−15
E-Cadherin
Chitosan I1.58.19 × 10−13
1.00 × 10⁻⁷
1/ton = 0.01 + 5.88 × 10⁹ × C
r = 0.9917
5.88 × 1098.19 × 10−13
Chitosan II1.88.19 × 10−13
1.00 × 10⁻⁸
1/ton =0.04 + 1.05 × 10⁹ × C
r = 0.9900
1.05 × 1098.19 × 10−13
Chitosan III2.08.19 × 10−13
1.00 × 10⁻⁹
1/ton = 0.01 + 6.08 × 10⁹ × C
r = 0.9949
6.08 × 1098.19 × 10−13
BTA
Chitosan I1.02.00 × 10−13
1.00 × 10⁻⁶
1/ton = 0.05 + 1.89 × 10⁹ × C
r = 0.9999
1.89 × 1092.00 × 10−13
Chitosan II1.52.00 × 10−13
1.00 × 10⁻⁷
1/ton = 0.02 + 4.62 × 10⁸ × C
r = 0.9996
4.62 × 1082.00 × 10−13
Chitosan III1.02.00 × 10−13
1.00 × 10⁻⁷
1/ton = 0.02 + 1.59 × 10⁹ × C
r = 0.9935
1.59 × 1092.00 × 10−13
Hyaluronic acid
Chitosan I 0.53.00 × 10−12
1.00 × 10⁻⁹
1/ton = 0.03 + 5.71 × 10⁷ × C
r = 0.9999
5.71 × 1073.00 × 10−12
Chitosan II 1.03.00 × 10−12
1.00 × 10⁻⁹
1/ton = 0.01 + 2.43 × 10⁸ × C
r = 0.9999
2.43 × 1083.00 × 10−12
Chitosan III 0.53.00 × 10−12
1.00 × 10⁻⁸
1/ton = 0.03 + 9.67 × 10⁷ × C
r = 0.9924
9.67 × 1073.00 × 10−12
Table 2. The recovery of p-53, E-cadherin, BTA, and hyaluronic acid in spiked samples using the stochastic needle sensors.
Needle Sensors Based on Graphite Paste and%, Recovery
p53E-CadherinBTAHyaluronic Acid
Chitosan l97.47 ± 0.1395.06 ± 0.1199.38 ± 0.1099.23 ± 0.08
Chitosan ll99.82 ± 0.1098.43 ± 0.1799.69 ± 0.1299.00 ± 0.15
Chitosan lll98.49 ± 0.2097.00 ± 0.2497.37 ± 0.2196.52 ± 0.20
Table 3. The recovery of p-53, E-cadherin, BTA, and hyaluronic acid in whole blood samples using the stochastic needle sensors (N = 10).
Sample No.Stochastic Needle Sensors Based on Graphite Paste andHyaluronic Acid
(pg/mL)
E-Cadherin
(pg/mL)
BTA
(pg/mL)
p53
(pg/mL)
1Chitosan I171.82 ± 0.232.99 ± 0.0914.30 ± 0.122.07 ± 0.08
Chitosan II123.60 ± 0.152.53 ± 0.1014.78 ± 0.112.00 ± 0.08
Chitosan III191.00 ± 0.142.51 ± 0.0814.40 ± 0.112.78 ± 0.07
2Chitosan I196.98 ± 0.186.29 ± 0.0914.64 ± 0.102.93 ± 0.07
Chitosan II214.00 ± 0.216.07 ± 0.0815.75 ± 0.152.97 ± 0.09
Chitosan III191.00 ± 0.256.46 ± 0.0814.50 ± 0.122.27 ± 0.10
3Chitosan I381.03 ± 0.228.69 ± 0.0714.52 ± 0.087.40 ± 0.05
Chitosan II382.12 ± 0.128.89 ± 0.0614.12 ± 0.097.32 ± 0.05
Chitosan III357.01 ± 0.178.74 ± 0.0813.27 ± 0.097.43 ± 0.06
4Chitosan I281.09 ± 0.1210.02 ± 0.0743.80 ± 0.139.20 ± 0.05
Chitosan II298.48 ± 0.1710.88 ± 0.0542.45 ± 0.129.51 ± 0.09
Chitosan III272.02 ± 0.2810.43 ± 0.0944.50 ± 0.139.94 ± 0.10
5Chitosan I228.75 ± 0.253.22 ± 0.0823.10 ± 0.186.47 ± 0.03
Chitosan II253.03 ± 0.193.88 ± 0.0520.60 ± 0.186.40 ± 0.07
Chitosan III253.20 ± 0.203.06 ± 0.0920.70 ± 0.126.03 ± 0.07
6Chitosan I281.01 ± 0.216.07 ± 0.0851.16 ± 0.136.39 ± 0.10
Chitosan II268.20 ± 0.196.49 ± 0.0851.88 ± 0.136.67 ± 0.10
Chitosan III255.09 ± 0.226.03 ± 0.1051.30 ± 0.096.50 ± 0.08
7Chitosan I140.30 ± 0.216.29 ± 0.0764.64 ± 0.254.12 ± 0.09
Chitosan II123.60 ± 0.156.91 ± 0.0764.13 ± 0.094.12 ± 0.03
Chitosan III191.00 ± 0.186.42 ± 0.0964.23 ± 0.094.10 ± 0.03
8Chitosan I380.80 ± 0.273.98 ± 0.0826.35 ± 0.084.06 ± 0.08
Chitosan II389.82 ± 0.153.98 ± 0.0828.19 ± 0.084.18 ± 0.06
Chitosan III392.20 ± 0.183.23 ± 0.0927.36 ± 0.074.61 ± 0.06
9Chitosan I129.40 ± 0.274.63 ± 0.0864.40 ± 0.102.42 ± 0.10
Chitosan II146.80 ± 0.174.00 ± 0.0964.18 ± 0.102.40 ± 0.07
Chitosan III154.90 ± 0.234.32 ± 0.0964.07 ± 0.082.47 ± 0.07
10Chitosan I140.94 ± 0.212.88 ± 0.0814.93 ± 0.07-*
Chitosan II137.27 ± 0.183.26 ± 0.1015.80 ± 0.07-*
Chitosan III153.00 ± 0.202.73 ± 0.0714.40 ± 0.09- *
* p53 not found.
Table 4. The recovery of p-53, E-cadherin, BTA. and hyaluronic acid in tumor tissue samples using the stochastic needle sensors (N = 10).
Sample No.Stochastic Needle Sensors Based on Graphite Paste andHyaluronic Acid
(pg/mL)
E-Cadherin
(pg/mL)
BTA
(pg/mL)
p53
(pg/mL)
1Chitosan I281.69 ± 0.124.63 ± 0.0717.40 ± 0.154.23 ± 0.10
Chitosan II266.00 ± 0.114.56 ± 0.0717.38 ± 0.174.34 ± 0.09
Chitosan III270.32 ± 0.114.69 ± 0.1017.79 ± 0.104.30 ± 0.08
2Chitosan I281.79 ± 0.157.01 ± 0.0817.19 ± 0.087.75 ± 0.05
Chitosan II275.43 ± 0.207.44 ± 0.0717.20 ± 0.127.77 ± 0.07
Chitosan III279.12 ± 0.237.45 ± 0.0617.31 ± 0.137.11 ± 0.08
3Chitosan I411.00 ± 0.2810.20 ± 0.0828.20 ± 0.099.25 ± 0.08
Chitosan II411.18 ± 0.2410.08 ± 0.0628.19 ± 0.079.40 ± 0.03
Chitosan III429.20 ± 0.1910.50 ± 0.0628.38 ± 0.079.40 ± 0.03
4Chitosan I437.40 ± 0.1113.69 ± 0.0352.15 ± 0.1110.20 ± 0.07
Chitosan II437.00 ± 0.1313.26 ± 0.0453.00 ± 0.1510.13 ± 0.07
Chitosan III433.59 ± 0.1313.42 ± 0.0452.85 ± 0.1310.27 ± 0.08
5Chitosan I502.90 ± 0.186.00 ± 0.0734.85 ± 0.178.32 ± 0.02
Chitosan II502.48 ± 0.186.59 ± 0.0734.40 ± 0.158.85 ± 0.05
Chitosan III502.93 ± 0.236.46 ± 0.0534.21 ± 0.158.59 ± 0.03
6Chitosan I372.00 ± 0.207.56 ± 0.0780.89 ± 0.1810.18 ± 0.08
Chitosan II351.20 ± 0.207.80 ± 0.0780.65 ± 0.1710.14 ± 0.06
Chitosan III369.17 ± 0.297.96 ± 0.0882.14 ± 0.1710.21 ± 0.05
7Chitosan I218.20 ± 0.187.32 ± 0.0575.45 ± 0.085.20 ± 0.10
Chitosan II215.10 ± 0.197.49 ± 0.0374.12 ± 0.075.66 ± 0.11
Chitosan III215.93 ± 0.197.01 ± 0.0377.14 ± 0.075.70 ± 0.09
8Chitosan I459.20 ± 0.186.03 ± 0.0580.38 ± 0.105.32 ± 0.07
Chitosan II475.20 ± 0.136.49 ± 0.0380.66 ± 0.105.40 ± 0.07
Chitosan III457.07 ± 0.136.46 ± 0.0380.69 ± 0.085.42 ± 0.04
9Chitosan I357.60 ± 0.218.00 ± 0.1072.23 ± 0.093.20 ± 0.08
Chitosan II385.40 ± 0.248.64 ± 0.0773.00 ± 0.083.21 ± 0.09
Chitosan III370.42 ± 0.248.76 ± 0.0773.09 ± 0.103.15 ± 0.10
10Chitosan I412.90 ± 0.208.82 ± 0.0517.82 ± 0.05- *
Chitosan II413.79 ± 0.208.89 ± 0.0717.03±0.07- *
Chitosan III407.86 ± 0.158.75 ± 0.0617.15±0.03- *
* p53 not found.

