Article

Extremely Sensitive Microwave Sensor for Evaluation of Dielectric Characteristics of Low-Permittivity Materials

1
School of Electronic and Information Engineering, Beihang University, Beijing 100191, China
2
Beijing Key Laboratory for Microwave Sensing and Security Applications, Beihang University, Beijing 100191, China
3
College of Electronics and Information Engineering, Shenzhen University, Guangdong 518060, China
*
Author to whom correspondence should be addressed.
Sensors 2020, 20(7), 1916; https://doi.org/10.3390/s20071916
Submission received: 15 February 2020 / Revised: 25 March 2020 / Accepted: 25 March 2020 / Published: 30 March 2020
(This article belongs to the Section Physical Sensors)

Abstract

:
In this paper, an extremely sensitive microwave sensor is designed based on a complementary symmetric S shaped resonator (CSSSR) to evaluate dielectric characteristics of low-permittivity material. CSSSR is an artificial structure with strong and enhanced electromagnetic fields, which provides high sensitivity and a new degree of freedom in sensing. Electromagnetic simulation elucidates the effect of real relative permittivity, real relative permeability, dielectric and magnetic loss tangents of the material under test (MUT) on the resonance frequency and notch depth of the sensor. Experiments are performed at room temperature using low-permittivity materials to verify the concept. The proposed design provides differential sensitivity between 102% to 95% as the relative permittivity of MUT varies from 2.1 to 3. The percentage error between simulated and measured results is less than 0.5%. The transcendental equation has been established by measuring the change in the resonance frequency of the fabricated sensor due to interaction with the MUT.

1. Introduction

Microwave sensors have quick response time, wide sensing range, high accuracy, no effect of temperature, and are suitable for any climate, therefore these sensors are widely used in different industries like agriculture [1,2], the biomedical sector [3,4,5,6], and electronics [7,8,9,10]. Recently microwave sensors based on metamaterial (MTM) and complementary MTM structures have achieved high level of sophistication due to the novel properties of MTM such as negative effective permittivity [11], negative effective permeability [12], negative index of refraction [13,14] and backward wave propagation [15]. Initially, these novel properties were achieved using a split-ring resonator (SRR) [16] and complementary split-ring resonator (CSRR) [17]. Later, these artificial structures were used to design microwave sensors for testing liquids [18,19,20,21,22], measurement of thickness [23,24,25,26], relative humidity [27], displacement [28,29,30,31,32], rotation [33,34,35,36], strain [37,38,39], permittivity and permeability [40,41,42]. The main advantages of SRR- and CSRR-based sensors are the small size with high sensitivity, lower cost with robustness, and high precision. The performance of the planar microwave sensor depends on the resonating structure as well as the hosting transmission line [43,44,45,46,47,48].
In [43], an SRR with a resonance frequency of 0.87 GHz is used to design a differential sensor with a size of 0.1λg2 for liquid characterization and an average sensitivity of 0.91% is achieved. In [44] a stepped impedance resonator (SIR) loaded with a microstrip transmission line is used to design a differential sensor with a size of 0.046 λg2 for comparison of three samples simultaneously, and an average sensitivity of 1.81% is achieved. In [45], a CSRR with resonance frequency of 1.7 GHz is utilized to design a differential sensor with a size of 0.098 λg2 for dielectric characterization and the average sensitivity of 1.96% is achieved. In [46], an SRR loaded with a microstrip transmission line is used to design a differential sensor with a size of 0.034 λg2 for comparison of dielectric samples and an average sensitivity of 3.4% is achieved. In [47], an SIR with resonance frequency 6.1 GHz is used to design a differential sensor with a size of 0.15 λg2 for dielectric characterization and the average sensitivity of 8.8% is achieved. In [48], a dual notch microwave sensor is designed based on complementary bisymmetric SRR with a size of 0.05 λg2 for evaluation of dielectric substrates and an average sensitivity of 29.9% is achieved. The aforementioned sensors are based on permittivity perturbation of MUT and have sensitivity limitations due to small resonance frequency. Two parameters are important for sensitivity comparison, the first being the shift in resonance frequency of the sensor due to interaction with MUT with respect to the free space resonance frequency, and second being the relative permittivity of MUT. The sensitivity of various state of art sensors [49,50,51,52,53,54] based on the resonance frequency shift is tabulated in Table 1.
If two sensors are loaded with identical MUTs then the sensor with high resonance frequency will give higher shift in resonance frequency. Therefore, we have designed a sensor based on a complementary symmetric S-shaped resonator (CSSSR), which provides free space resonance frequency of 15.17 GHz. The CSSSR is a negative image of an S-shaped resonator, which has already been used as an end reflector [55], bandpass filter [56], dual-band filter [57], waveguide filter [58], tunable metamaterial [59], and angular velocity sensor [60]. In this work, the CSSSR is coupled with a microstrip transmission line to design a sensor to test the low permittivity materials. The change in resonance frequency and notch depth of the sensor is calculated numerically by permittivity perturbation, permeability perturbation, dielectric loss and magnetic loss perturbation in Section 2. After fabrication, the sensor is tested for sensing low permittivity dielectric material using a vector network analyzer (VNA) and the measured results are formulated in Section 3 and concluded in Section 4.

2. Design and Simulation of Proposed Sensor

The design of the proposed sensor is based on a microstrip transmission line which is directly coupled to the CSSSR as shown in Figure 1a. For proper excitation of resonating structure, the microstrip transmission line (3 mm) and the CSSSR are printed on the top and bottom layer of the substrate as shown in Figure 1b,c respectively. The CSSSR structure is equivalent to parallel combination of resistance (Rc), inductance (Lc) and capacitance (Cc). The microstrip transmission line is equivalent to the inductance (L) and the thickness of the substrate provides the capacitance (C) between the transmission line and the CSSSR. The equivalent lumped element circuit model of the coupled structure is shown in Figure 1d, the resonance frequency of the equivalent circuit can be calculated using the following relation [61]:
f r = 1 2 π L c ( C + C c )
The 3D model of the proposed sensor is simulated in ANSYS HFSS software with the simulation conditions given in ref. [58]. The proposed sensor shows a resonance at 15.17 GHz with notch depth of –39.84 dB as shown in Figure 2. The unloaded quality factor of the proposed sensor is 505 which can be calculated by the following relation [62]:
Q = f r f 3 d B
The resonance frequency of the proposed sensor can be shifted to lower frequencies due to interaction with the material under test (MUT) which is the basic principle of microwave sensors. At the resonance frequency of the CSSSR, the stored electric field (E0) and magnetic field (H0) are equal to each other. When a MUT interacts with the CSSSR, it disrupts the equilibrium of the stored electromagnetic fields and generates the new electric field (E1) and magnetic field (H1) which causes it to change the resonance frequency. This change in resonance frequency (∆fr) depends on the change in permittivity (∆ɛ), permeability (∆µ) and volume (ʋ) of the MUT, which can be expressed mathematically as given in reference [63]:
f r f r = υ ( ε E 1 . E 0 + μ H 1 . H 0 ) d υ υ ( ε 0 | E 0 | 2 + μ 0 | H 0 | 2 ) d υ
The magnitude of the electric field elucidates the most sensitive region of the sensor, which is plotted in Figure 3. To check the sensitivity of the proposed sensor, MUT is placed at the CSSSR with constant dimensions (d1 = 10 mm, d2 = 10 mm, d3 = 1 mm) and an air gap of 35 µm that is equal to the thickness of the copper layer etched out in the ground plane as shown in Figure 4. For microwave materials, the complex permittivity ɛ and permeability µ can be express by the following relations [63]:
ε = ε j ε = ε ( 1 j tan δ e )
μ = μ j μ = μ ( 1 j tan δ m )
where ε and ε are real and imaginary parts of complex permittivity respectively. μ and μ are real and imaginary parts of complex permeability, respectively. tan δ e and tan δ m are dielectric and magnetic loss tangent, respectively. Natural materials are usually characterized by real relative permittivity ε r with ε = ε r ε 0 and real relative permeability with μ r with μ = μ r μ 0 at specific frequencies. Now these four parameters ( ε r , μ r , tan δ e , tan δ m ) of MUT are used to check the sensitivity of the proposed sensor. The other parameters like langde G factor = 2, bulk conductivity = 0 siemens/m, magnetic saturation = 0 tesla, mass density = 1.1614 kg/m3 are the same for all the MUTs. First, ε r of MUT is varied from 1 to 3 keeping other parameters constant as given in Table 2 and the effect of ε r on the transmission coefficient of the sensor is plotted in Figure 5. According to simulated results, as ε r of MUT increases from 1 to 3, the f0 decreases from 15.17 GHz to 13.29 GHz while notch depth increases from −39.84 dB to −42.32 dB. Second, μ r of MUT is varied from 1 to 3 keeping other parameters constant as given in Table 3 and the effect of μ r on the transmission coefficient of the sensor is plotted in Figure 6. According to simulated results, as μ r of MUT increases from 1 to 3, the f0 decreases from 15.17 GHz to 12.80 GHz and notch depth also decreases from −39.84 dB to −32.32 dB. Third, tan δ e of MUT is varied from 0 to 0.4 keeping other parameters constant as given in Table 4 and the effect of tan δ e on the transmission coefficient of the sensor is plotted in Figure 7. According to simulated results, as tan δ e of MUT increases from 0 to 0.4, the f0 increases from 15.17 GHz to 15.28 GHz and notch depth decreases from −39.84 dB to −12.96 dB. Fourth, tan δ m of MUT is varied from 0 to 0.4 keeping other parameters constant as given in Table 5 and the effect of tan δ m on the transmission coefficient of the sensor is plotted in Figure 8. According to simulated results, as tan δ m of MUT increases from 0 to 0.4, the f0 increases from 15.17 GHz to 15.30 GHz and notch depth decreases from −39.84 dB to −8.08 dB. These simulated results show that ε r and μ r affect the resonance frequency of the sensor as shown in Figure 9. While tan δ e and tan δ m affect the notch depth of the sensor as shown in Figure 10. However, all these factors do not have the same effect on resonance frequency and notch depth which means that we can distinguish the effect of each factor individually using the proposed sensor.

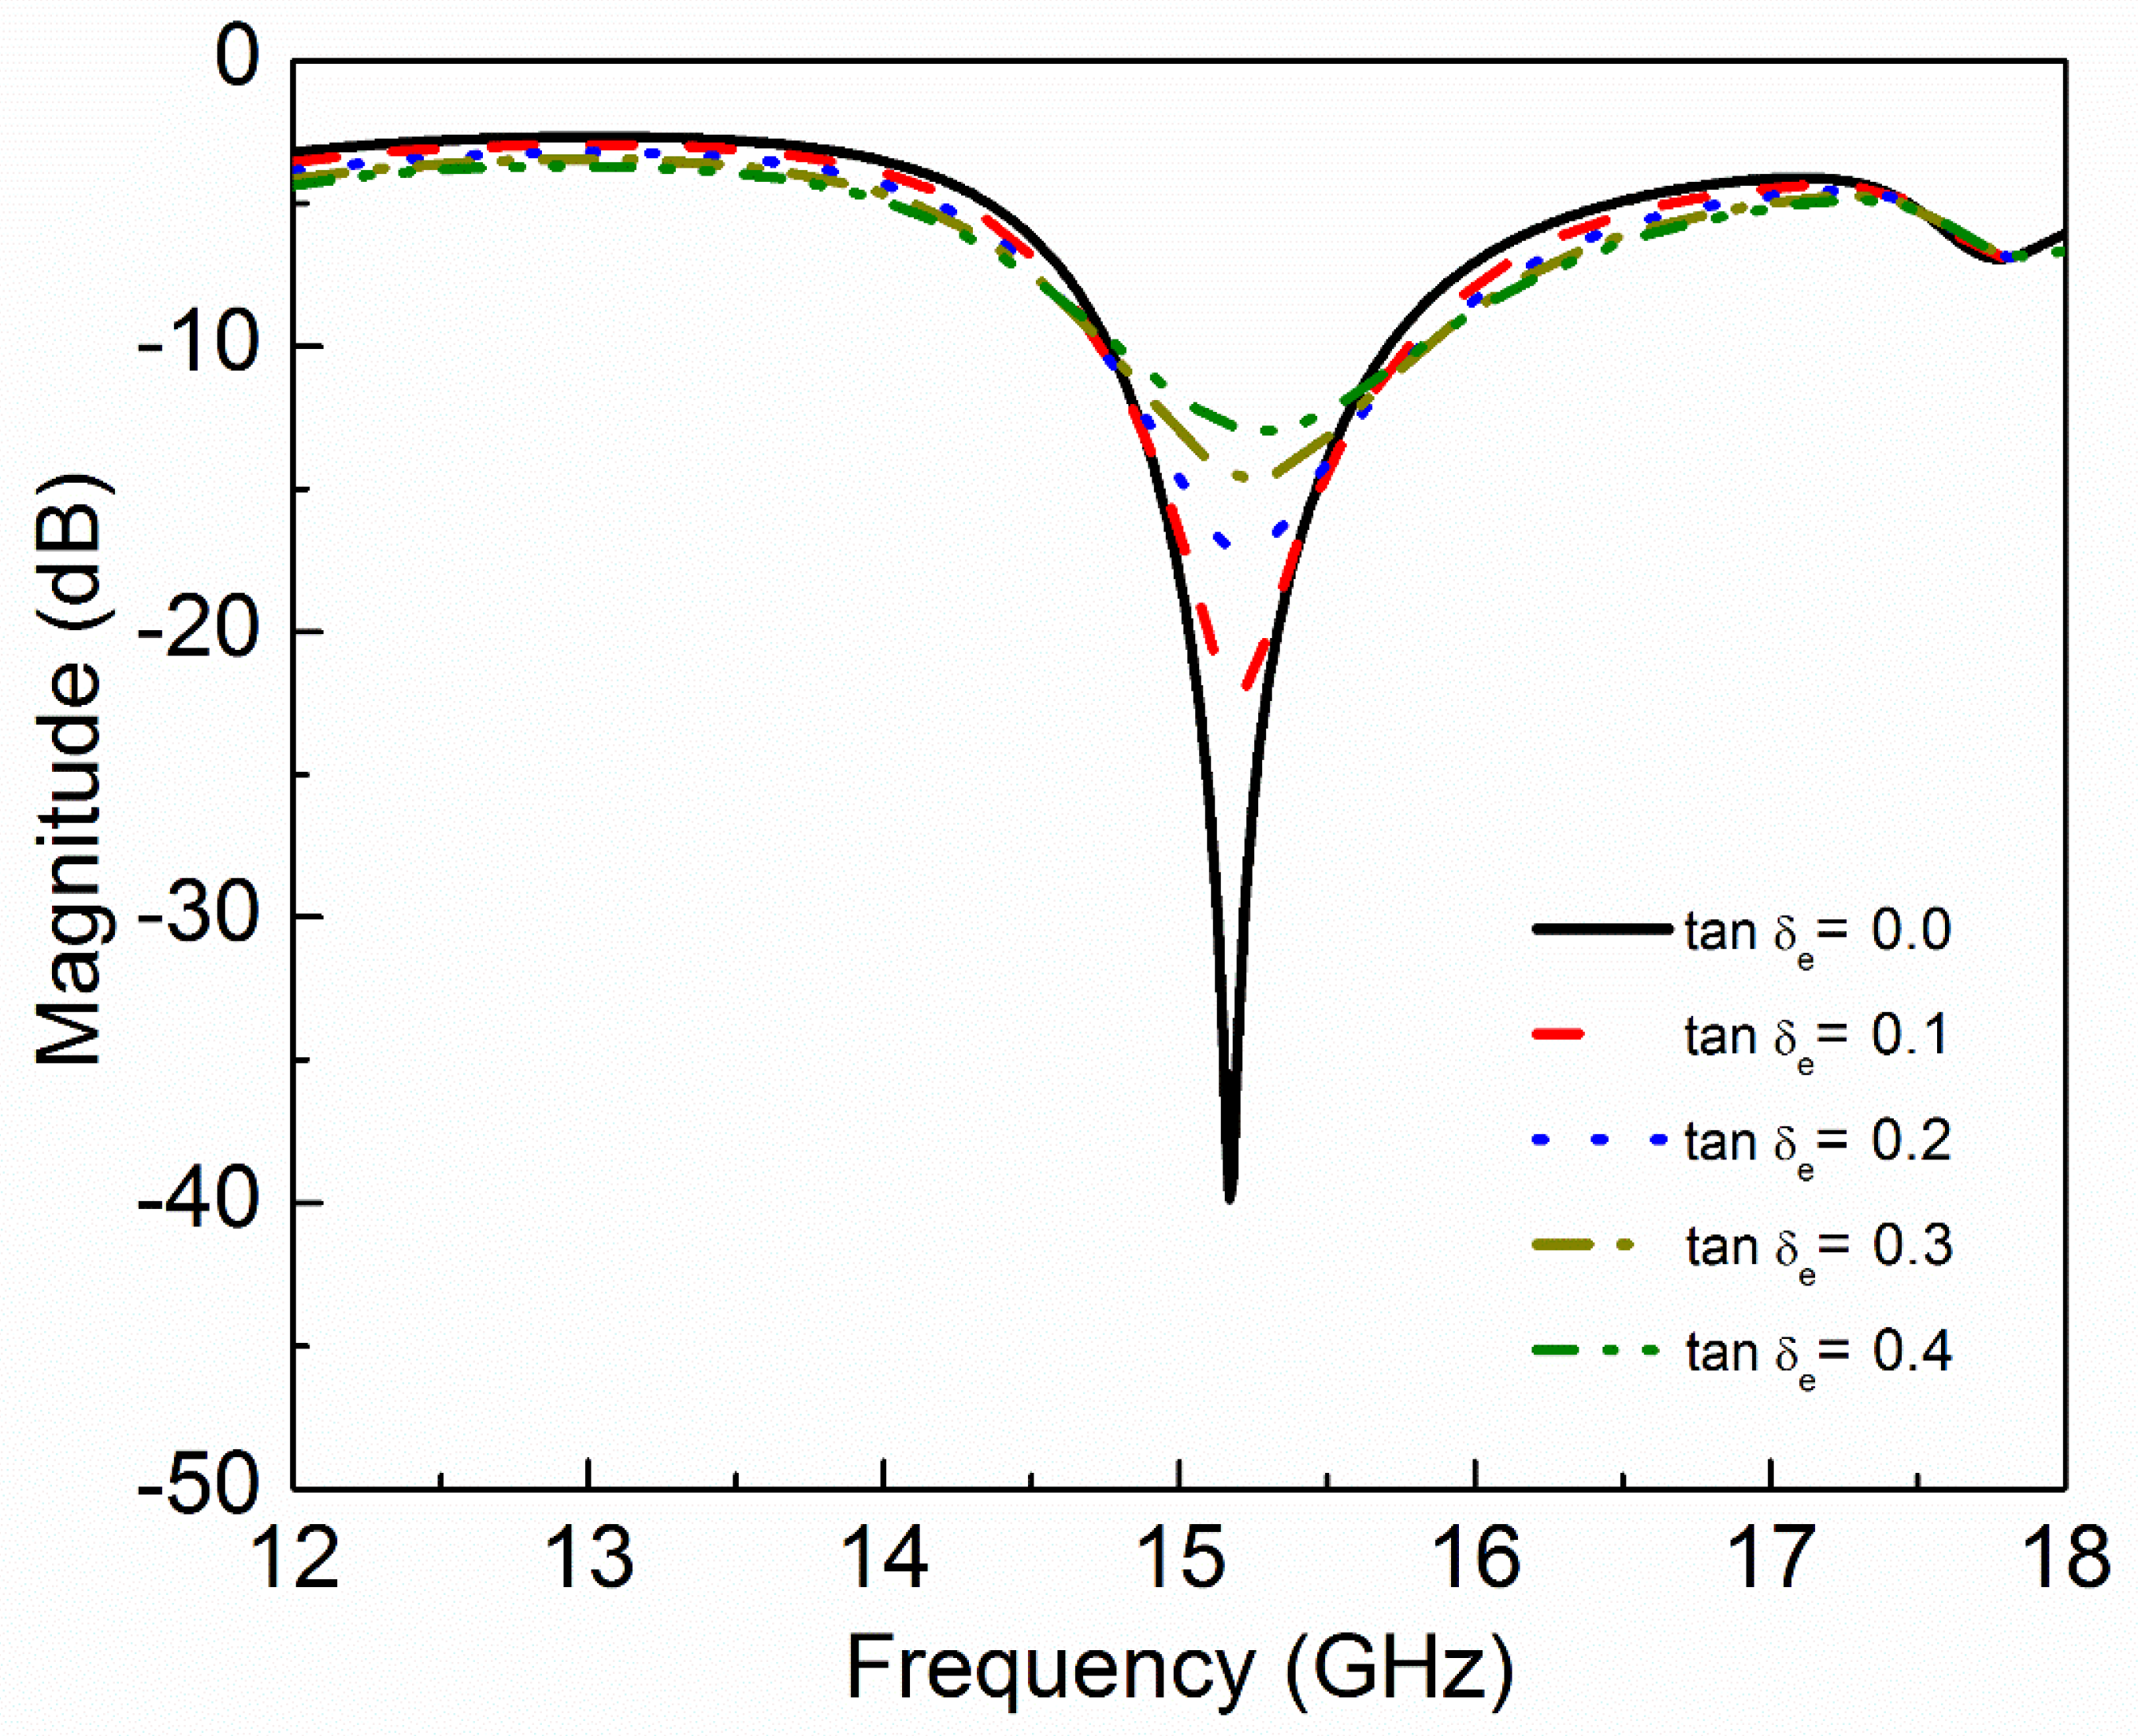
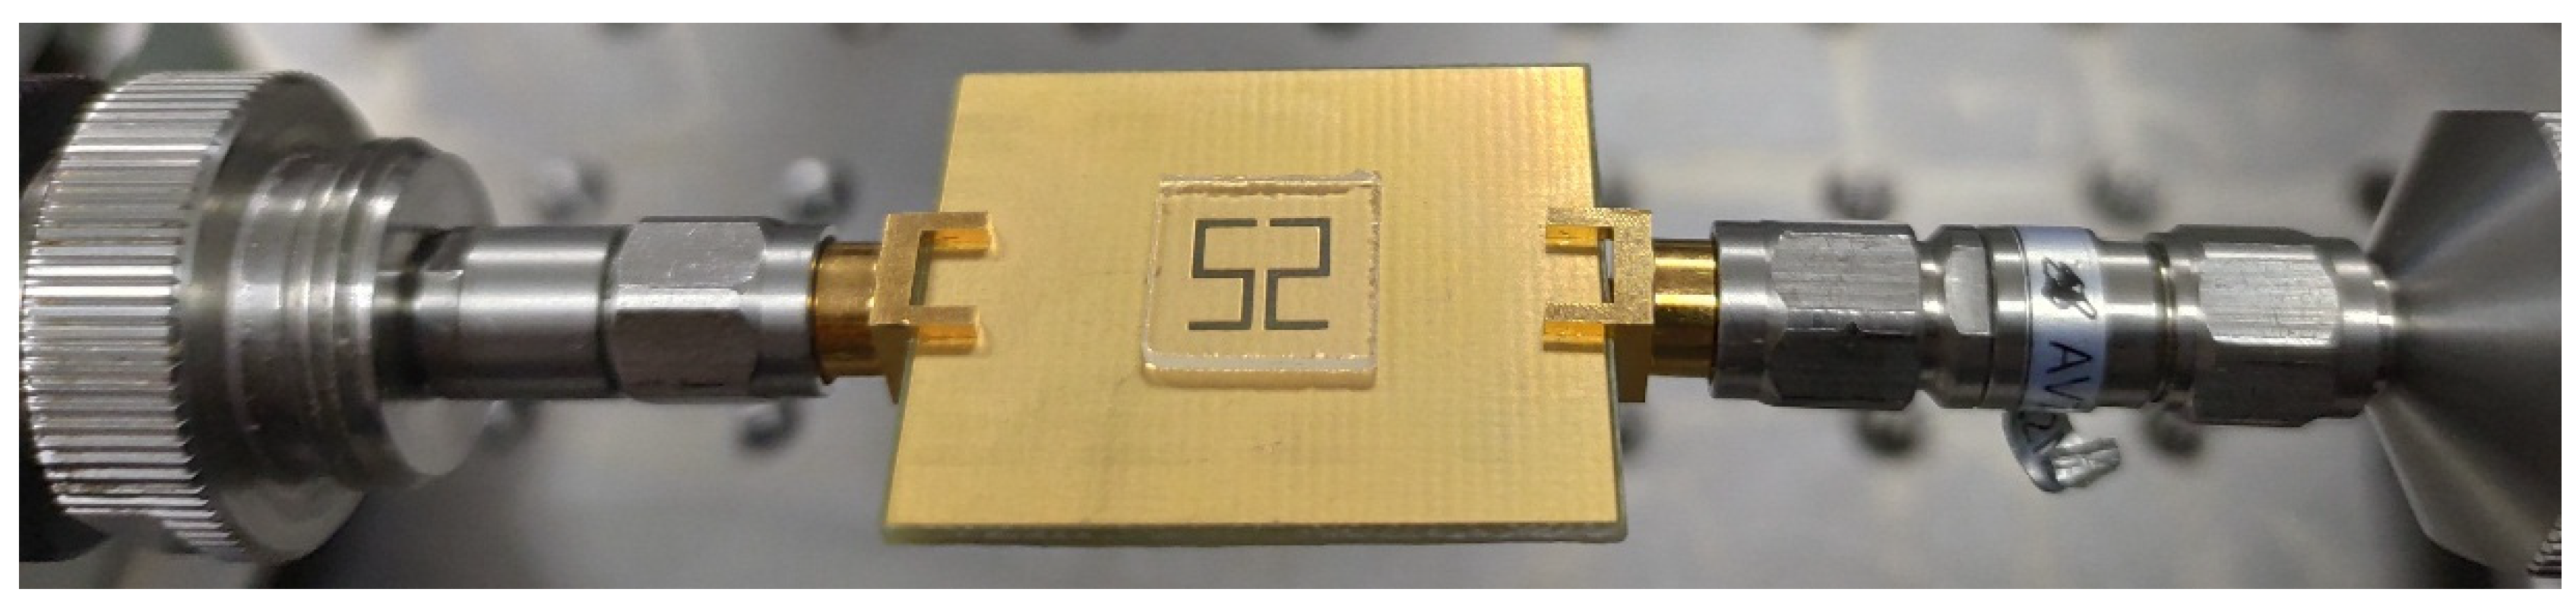
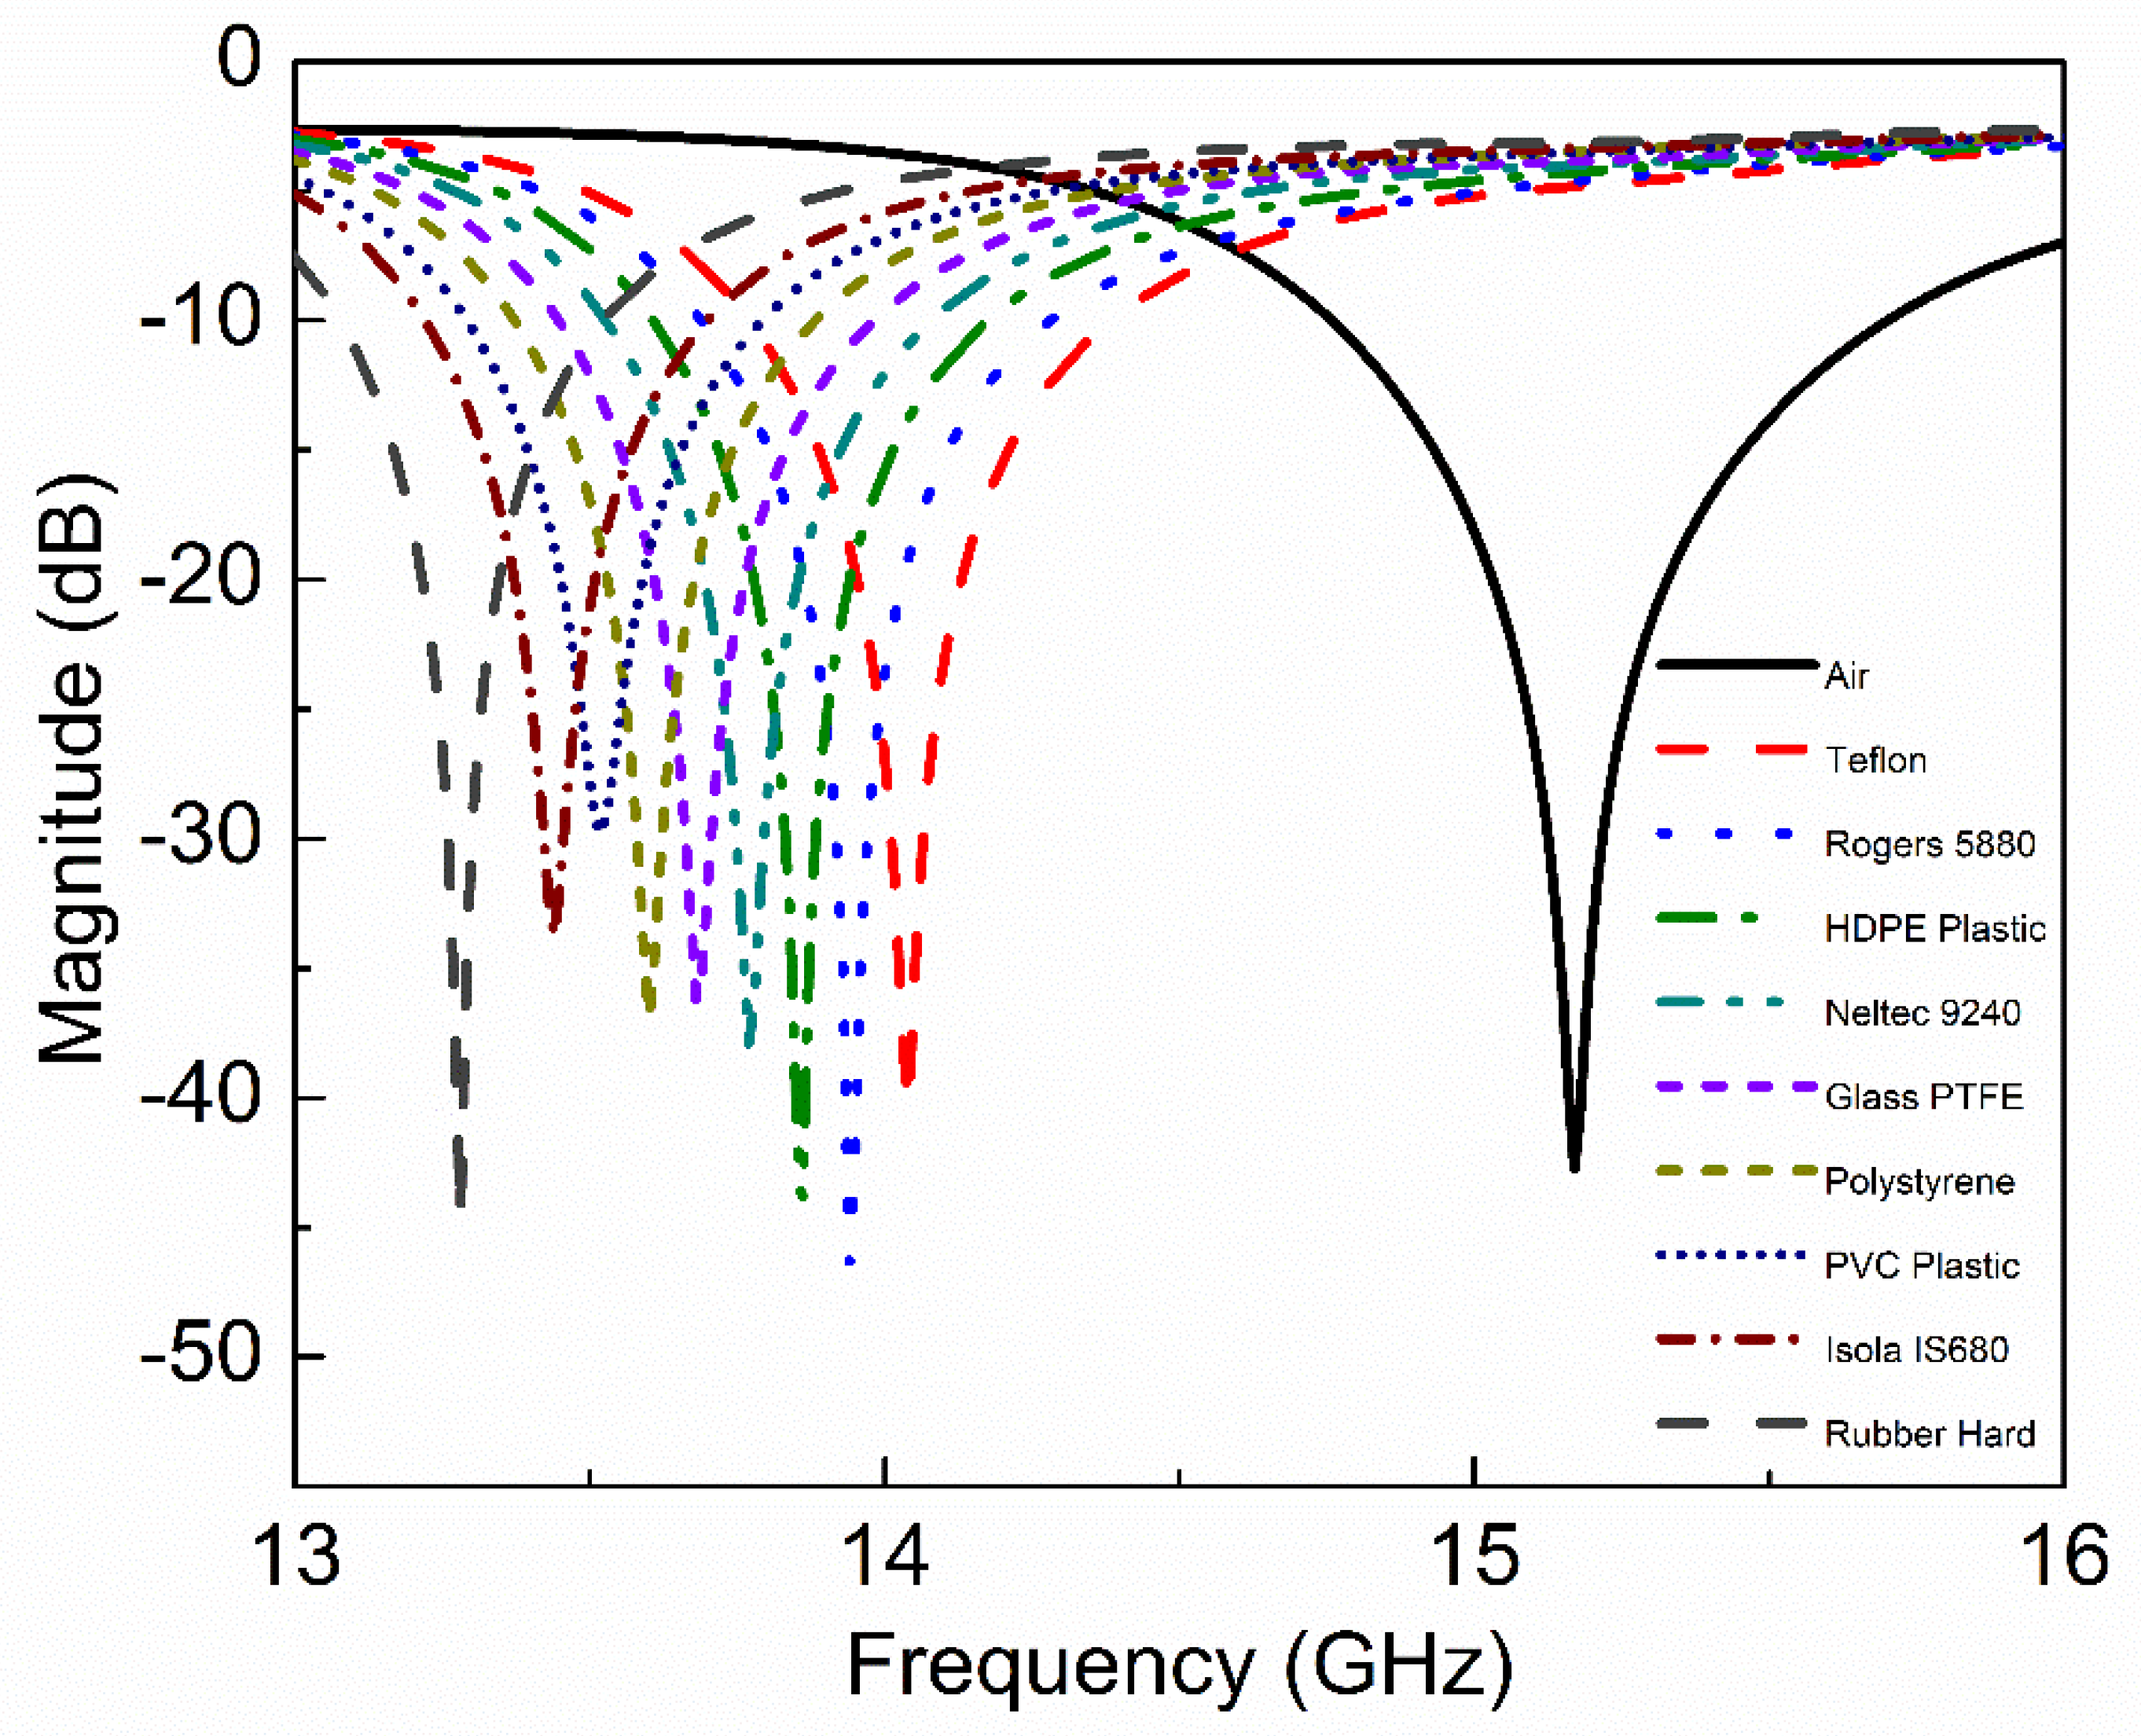
3. Measurement and Sensitivity Analysis

The CSSSR sensor is fabricated on commercially available 1.6 mm FR4 substrate using the standard photolithographic technique which is simple and inexpensive. To connect the sensor with the vector network analyzer (VNA AV3672C), a pair of high-precision subminiature version A (SMA) connectors are connected at both side of microstrip transmission line. The impedance, center contact resistance and insulation resistance of the SMA connecters are 50 Ω, ≤ 0.3 mΩ, ≥ 3000 MΩ respectively. The frequency range, resolution and accuracy of VNA AV3672C are 10 MHz~40 GHz, 1 Hz, ± 1 × 10⁻⁷ respectively. The fabricated prototype of the CSSSR sensor with SMA connectors and MUT is shown in Figure 11. The VNA AV3672C is calibrated using a 2.4 mm calibration kit (AV31123) with frequency sweep 12 GHz to 18 GHz, number of sweeping points 1601 and IF-bandwidth 100Hz. After calibration the transmission coefficient of the fabricated sensor is measured and plotted in Figure 12. The measured f0 of the fabricated sensor is 15.12 GHz with notch depth of −44.33 dB and the unloaded quality factor is 501. The difference between simulated and measured resonance frequency, notch depth and quality factor is 0.05 GHz, −4.49 dB and 4, respectively, which can be attributed to fabrication tolerance. To verify the sensitivity of fabricated sensor following low permittivity materials Teflon, Rogers RT5880, high density poly ethylene (HDPE) plastic, Netltec NX9240, glass polytetrafluoroethylene (PTFEreinf), polystyrene, polyvinyl chloride (PVC) plastic, Isola IS680-280, and Rubber Hard are selected. These MUTs are placed on the CSSSR and loaded resonance frequency of the sensor is calculated. Figure 13 shows the measured S21 of the sensor due to interaction with composite MUTs.
Measured f0 of the sensors due to interaction with Teflon, Rogers RT5880, HDPE plastic, Netltec NX9240, glass PTFEreinf, polystyrene, PVC plastic, Isola IS680-280, and rubber hard are 13.99 GHz, 13.89 GHz, 13.80 GHz, 13.72 GHz, 13.63 GHz, 13.55 GHz, 13.46 GHz, 13.38 GHz, and 13.23 GHz respectively. The electromagnetic properties of MUTs and loaded resonance frequency of the sensor are tabulated in Table 6. As the MUT’s real permittivity is more significant than the real permeability, therefore the real relative permittivity of MUT versus simulated and measured f0 of the sensor is plotted in Figure 14. The percentage error is 0.35% between measured and simulated resonance frequencies of the fabricated sensor when loaded with Teflon as MUT. The percentage error is 0.43% between simulated and measured resonance frequencies of the fabricated sensor when loaded with Rogers RT5880 and HDPE plastic as MUT. The percentage error is 0.36% between simulated and measured resonance frequencies of the fabricated sensor when loaded with Netltec NX9240, glass PTFEreinf and polystyrene as MUT. The percentage error is 0.44% between measured and simulated resonance frequencies of the fabricated sensor when loaded with PVC plastic and Isola IS680-280 as MUT. The percentage error is 0.37% between measured and simulated resonance frequencies of the fabricated sensor when loaded with rubber hard as MUT. The slope of Figure 14 is the sensitivity of the proposed sensor which is the ratio of differential output (fd = fu-fl) and differential input (ɛrd = ɛr2r1). The differential sensitivity of composite MUTs is calculated with respect to Air (εr = 1.0006, and f0 = 15.12) and tabulated in Table 7. The following relation is used to calculate the sensitivity of the fabricated sensor, as given in [47]:
S = f d ε r d = lim ε r 2 ε r 1 0 f u f l ε r 2 ε r 1
The relationship between the measured resonance frequencies and real relative permittivity of the MUT can be approximated by a polynomial function, as given in [64]:
f r , M U T = A 1 + A 2 ε r + A 3 ε r 2
The constant values (A1, A2, A3) of the polynomial are extracted using measured resonance frequencies ( f r , M U T ) of the sensor due to interaction with the MUT with different values of real relative permittivity ( ε r ). Finally, the transcendental equation becomes:
f r , M U T = 16.462 1.411 ε r + 0.112 ε r 2
Equation (8) can predict the resonance frequency of the sensor due to interaction with an MUT with real relative permittivity ranges from 2.1 to 3. Equation (8) can be rearranged to calculate relative permittivity in the following form:
ε r = 1.411 1.99 0.448 ( 16.462 f r , M U T ) 0.224
Equation (9) can be used to calculate the relative permittivity of an unknown MUT by measuring the resonance frequency of the sensor due to interaction with the unknown MUT. The relative sensitivity is most important parameter to compare the performance of with other sensors. The relative sensitivity of the microwave sensor based on permittivity perturbation is defined as [65]:
S ε r = f r , M U T f 0 f 0 ( ε r 1 ) × 100
where fr,MUT is the resonance frequency of the sensor due to interaction with the MUT with relative permittivity εr. The relative sensitivity of various state of the art sensors [66,67,68,69,70] is tabulated in Table 8.

4. Conclusions

This paper presents an extremely sensitive microwave sensor that is based on a microstrip transmission line and complementary symmetric S shape resonator (CSSSR) to measure the relative permittivity of low permittivity materials. The proposed sensor is sensitive for the four parameters of MUT ( ε r , μ r , tan δ e , tan δ m ) which is demonstrated by electromagnetic simulation. It is concluded that the fringing electromagnetic fields of CSSSR interact with the MUT, and real relative permittivity and permeability which are greater than unity cause a decrease in the resonance frequency while dielectric and magnetic loss tangents cause a decrease in the magnitude of the transmission coefficient. After fabrication, the fabricated sensor is used to measure composite MUTs and relative sensitivity of 6.7% is achieved with a measurement error less than 0.5%. The transcendental equation for the CSSSR sensor is derived by approximating the resonance frequencies of the sensor with respect to the relative permittivity of composite MUTs.

Author Contributions

T.H. proposed the structure of the sensor, simulated and fabricated and used the device to test different dielectric substrates and the method to achieve it, participated in conducting experiments and recording the data, cataloged references and analyzed the measured results, and prepared the whole manuscript. C.R. is the research head of the experiment, proposed the design and experimental idea, analyzed the data, and participated in the revision of the paper. X.Z., S.U., A.K.F. and W.H. participated in the experiment and recorded the data, and participated in the preparation of the manuscript. All authors have read and agreed to the published version of the manuscript.

Funding

This research was funded by National Natural Science Foundation of China, grant number 61831001, the High-Level Talent Introduction Project of Beihang University, grant number ZG216S1878and the Youth-Top-Talent Support Project of Beihang University, grant number ZG226S1821.

Conflicts of Interest

The authors declare no conflict of interest.

References

  1. Trabelsi, S.; Nelson, S.O. Microwave sensing of quality attributes of agricultural and food products. IEEE Instrum. Meas. Mag. 2016, 19, 36–41. [Google Scholar] [CrossRef]
  2. Wagner, N.; Emmerich, K.; Bonitz, F.; Kupfer, K. Experimental Investigations on the Frequency- and Material Properties of Soil. IEEE Trans. Geosci. Remote Sens. 2011, 49, 2518–2530. [Google Scholar] [CrossRef]
  3. Puentes, M.; Maasch, M.; Schubler, M.; Jakoby, R. Frequency multiplexed 2-dimensional sensor array based on split-ring resonators for organic tissue analysis. IEEE Trans. Microw. Theory Tech. 2012, 60, 1720–1727. [Google Scholar] [CrossRef]
  4. RoyChoudhury, S.; Rawat, V.; Jalal, A.H.; Kale, S.N.; Bhansali, S. Recent advances in metamaterial split-ring-resonator circuits as biosensors and therapeutic agents. Biosens. Bioelectron. 2016, 86, 595–608. [Google Scholar] [CrossRef] [PubMed] [Green Version]
  5. Lee, H.J.; Lee, J.H.; Moon, H.S.; Jang, I.S.; Choi, J.S.; Yook, J.G.; Jung, H.I. A planar split-ring resonator-based microwave biosensor for label-free detection of biomolecules. Sensors Actuators, B Chem. 2012, 169, 26–31. [Google Scholar] [CrossRef]
  6. Zarifi, M.H.; Sadabadi, H.; Hejazi, S.H.; Daneshmand, M.; Sanati-Nezhad, A. Noncontact and Nonintrusive Microwave-Microfluidic Flow Sensor for Energy and Biomedical Engineering. Sci. Rep. 2018, 8, 1–10. [Google Scholar] [CrossRef] [Green Version]
  7. Schueler, M.; Mandel, C.; Puentes, M.; Jakoby, R. Metamaterial inspired microwave sensors. IEEE Microw. Mag. 2012, 13, 57–68. [Google Scholar] [CrossRef]
  8. Abdolrazzaghi, M.; Zarifi, M.H.; Pedrycz, W.; Daneshmand, M. Robust Ultra-High Resolution Microwave Planar Sensor Using Fuzzy Neural Network Approach. IEEE Sens. J. 2017, 17, 323–332. [Google Scholar] [CrossRef]
  9. Zarifi, M.H.; Deif, S.; Abdolrazzaghi, M.; Chen, B.; Ramsawak, D.; Amyotte, M.; Vahabisani, N.; Hashisho, Z.; Chen, W.; Daneshmand, M. A microwave ring resonator sensor for early detection of breaches in pipeline coatings. IEEE Trans. Ind. Electron. 2017, 65, 1626–1635. [Google Scholar] [CrossRef]
  10. Zarifi, M.H.; Daneshmand, M. Monitoring Solid Particle Deposition in Lossy Medium Using Planar Resonator Sensor. IEEE Sens. J. 2017, 17, 7981–7989. [Google Scholar] [CrossRef]
  11. Kumari, R.; Patel, P.N.; Yadav, R. An ENG-Inspired Microwave Sensor and Functional Technique for Label-Free Detection. IEEE Sens. J. 2018, 18, 3932–3939. [Google Scholar] [CrossRef]
  12. Machac, J. Amorphous Metamaterial with Negative Permeability. IEEE Antennas Wirel. Propag. Lett. 2017, 16, 2138–2141. [Google Scholar] [CrossRef]
  13. Shelby, R.A.; Smith, D.R.; Schultz, S. Experimental verification of a negative index of refraction. Science 2001, 292, 77–79. [Google Scholar] [CrossRef] [PubMed] [Green Version]
  14. Ji, L.; Varadan, V.V. Negative refractive index and negative refraction of waves in lossy metamaterials. Electron. Lett. 2016, 52, 260–262. [Google Scholar] [CrossRef]
  15. Isik, O.; Esselle, K.P. Backward wave microstrip lines with complementary spiral resonators. IEEE Trans. Antennas Propag. 2008, 56, 3173–3178. [Google Scholar] [CrossRef]
  16. Pendry, J.B.; Holden, A.J.; Robbins, D.J.; Stewart, W.J. Magnetism from conductors and enhanced nonlinear phenomena. IEEE Trans. Microw. Theory Tech. 1999, 47, 2075–2084. [Google Scholar] [CrossRef] [Green Version]
  17. Falcone, F.; Lopetegi, T.; Baena, J.D.; Marqués, R.; Martín, F.; Sorolla, M. Effective negative-ε stopband microstrip lines based on complementary split ring resonators. IEEE Microw. Wirel. Components Lett. 2004, 14, 280–282. [Google Scholar] [CrossRef]
  18. Withayachumnankul, W.; Jaruwongrungsee, K.; Tuantranont, A.; Fumeaux, C.; Abbott, D. Metamaterial-based microfluidic sensor for dielectric characterization. Sensors Actuators, A Phys. 2013, 189, 233–237. [Google Scholar] [CrossRef] [Green Version]
  19. Abdolrazzaghi, M.; Zarifi, M.H.; Daneshmand, M. Sensitivity enhancement of split ring resonator based liquid sensors. Proc. IEEE Sensors 2017, 5–7. [Google Scholar] [CrossRef]
  20. Chuma, E.L.; Iano, Y.; Fontgalland, G.; Bravo Roger, L.L. Microwave sensor for liquid dielectric characterization based on metamaterial complementary split ring resonator. IEEE Sens. J. 2018, 18, 9978–9983. [Google Scholar] [CrossRef]
  21. Mohd Bahar, A.A.; Zakaria, Z.; Ab Rashid, S.R.; Isa, A.A.M.; Alahnomi, R.A. High-efficiency microwave planar resonator sensor based on bridge split ring topology. IEEE Microw. Wirel. Components Lett. 2017, 27, 545–547. [Google Scholar] [CrossRef]
  22. Zhang, X.; Ruan, C.; Ul Haq, T.; Chen, K. High-sensitivity microwave sensor for liquid characterization using a complementary circular spiral resonator. Sensors 2019, 19, 787. [Google Scholar] [CrossRef] [PubMed] [Green Version]
  23. Boybay, M.S.; Ramahi, O.M. Non-destructive thickness measurement using quasi-static resonators. IEEE Microw. Wirel. Components Lett. 2013, 23, 217–219. [Google Scholar] [CrossRef]
  24. Lee, C.S.; Yang, C.L. Thickness and permittivity measurement in multi-layered dielectric structures using complementary split-ring resonators. IEEE Sens. J. 2014, 14, 695–700. [Google Scholar] [CrossRef]
  25. Lee, C.S.; Yang, C.L. Single compound complementary split-ring resonator for simultaneously measuring permittivity and thickness. IEEE MTT-S Int. Microw. Symp. Dig. 2014, 1–3. [Google Scholar] [CrossRef]
  26. Yang, C.L.; Lee, C.S.; Chen, K.W.; Chen, K.Z. Noncontact measurement of complex permittivity and thickness by using planar resonators. IEEE Trans. Microw. Theory Tech. 2016, 64, 247–257. [Google Scholar] [CrossRef]
  27. Abdolrazzaghi, M.; Khan, S.; Daneshmand, M. A Dual-Mode Split-Ring Resonator to Eliminate Relative Humidity Impact. IEEE Microw. Wirel. Components Lett. 2018, 28, 939–941. [Google Scholar] [CrossRef]
  28. Naqui, J.; Durán-Sindreu, M.; Martín, F. Novel sensors based on the symmetry properties of split ring resonators (SRRs). Sensors 2011, 11, 7545–7553. [Google Scholar] [CrossRef] [Green Version]
  29. Naqui, J.; Durán-Sindreu, M.; Martín, F. Alignment and position sensors based on split ring resonators. Sensors 2012, 12, 11790–11797. [Google Scholar] [CrossRef] [Green Version]
  30. Horestani, A.K.; Fumeaux, C.; Al-Sarawi, S.F.; Abbott, D. Displacement sensor based on diamond-shaped tapered split ring resonator. IEEE Sens. J. 2013, 13, 1153–1160. [Google Scholar] [CrossRef]
  31. Horestani, A.K.; Naqui, J.; Shaterian, Z.; Abbott, D.; Fumeaux, C.; Martín, F. Two-dimensional alignment and displacement sensor based on movable broadside-coupled split ring resonators. Sensors Actuators, A Phys. 2014, 210, 18–24. [Google Scholar]
  32. Horestani, A.K.; Naqui, J.; Abbott, D.; Fumeaux, C.; Martín, F. Two-dimensional displacement and alignment sensor based on reflection coefficients of open microstrip lines loaded with split ring resonators. Electron. Lett. 2014, 50, 620–622. [Google Scholar] [CrossRef] [Green Version]
  33. Naqui, J.; Martin, F. Transmission lines loaded with bisymmetric resonators and their application to angular displacement and velocity sensors. IEEE Trans. Microw. Theory Tech. 2013, 61, 4700–4713. [Google Scholar] [CrossRef]
  34. Horestani, A.K.; Abbott, D.; Fumeaux, C. Rotation sensor based on horn-shaped split ring resonator. IEEE Sens. J. 2013, 13, 3014–3015. [Google Scholar] [CrossRef]
  35. Ebrahimi, A.; Withayachumnankul, W.; Al-Sarawi, S.F.; Abbott, D. Metamaterial-inspired rotation sensor with wide dynamic range. IEEE Sens. J. 2014, 14, 2609–2614. [Google Scholar] [CrossRef]
  36. Mata-Contreras, J.; Herrojo, C.; Martin, F. Application of Split Ring Resonator (SRR) Loaded Transmission Lines to the Design of Angular Displacement and Velocity Sensors for Space Applications. IEEE Trans. Microw. Theory Tech. 2017, 65, 4450–4460. [Google Scholar] [CrossRef] [Green Version]
  37. Melik, R.; Unal, E.; Perkgoz, N.K.; Puttlitz, C.; Demir, H.V. Metamaterial-based wireless strain sensors. Appl. Phys. Lett. 2009, 95, 1–3. [Google Scholar] [CrossRef]
  38. Hasani, M.; Vena, A.; Sydanheimo, L.; Ukkonen, L.; Tentzeris, M.M. Implementation of a dual-interrogation-mode embroidered RFID-Enabled strain sensor. IEEE Antennas Wirel. Propag. Lett. 2013, 12, 1272–1275. [Google Scholar] [CrossRef]
  39. Thai, T.T.; Aubert, H.; Pons, P.; Dejean, G.; Mtentzeris, M.; Plana, R. Novel design of a highly sensitive RF strain transducer for passive and remote sensing in two dimensions. IEEE Trans. Microw. Theory Tech. 2013, 61, 1385–1396. [Google Scholar] [CrossRef]
  40. Muhammed Shafi, K.T.; Ansari, M.A.H.; Jha, A.K.; Akhtar, M.J. Design of SRR-based microwave sensor for characterization of magnetodielectric substrates. IEEE Microw. Wirel. Components Lett. 2017, 27, 524–526. [Google Scholar]
  41. Muhammed Shafi, K.T.; Jha, A.K.; Akhtar, M.J. Improved Planar Resonant RF Sensor for Retrieval of Permittivity and Permeability of Materials. IEEE Sens. J. 2017, 17, 5479–5486. [Google Scholar] [CrossRef]
  42. Saadat-safa, M.; Nayyeri, V.; Member, S.; Khanjarian, M.; Soleimani, M.; Ramahi, O.M. A CSRR-Based Sensor for Full Characterization of Magneto-Dielectric Materials. IEEE Trans. Microw. Theory Tech. 2019, 67, 806–814. [Google Scholar] [CrossRef]
  43. Velez, P.; Su, L.; Grenier, K.; Mata-Contreras, J.; Dubuc, D.; Martin, F. Microwave Microfluidic Sensor Based on a Microstrip Splitter/Combiner Configuration and Split Ring Resonators (SRRs) for Dielectric Characterization of Liquids. IEEE Sens. J. 2017, 17, 6589–6598. [Google Scholar] [CrossRef] [Green Version]
  44. Su, L.; Mata-Contreras, J.; Vélez, P.; Martín, F. Configurations of splitter/combiner microstrip sections loaded with stepped impedance resonators (SIRs) for sensing applications. Sensors 2016, 16, 2195. [Google Scholar] [CrossRef] [PubMed] [Green Version]
  45. Su, L.; Mata-Contreras, J.; Velez, P.; Martin, F. Splitter/combiner microstrip sections loaded with pairs of Complementary Split Ring Resonators (CSRRs): Modeling and optimization for differential sensing applications. IEEE Trans. Microw. Theory Tech. 2016, 64, 4362–4370. [Google Scholar] [CrossRef]
  46. Ebrahimi, A.; Scott, J.; Ghorbani, K. Differential sensors using microstrip lines loaded with two split-ring resonators. IEEE Sens. J. 2018, 18, 5786–5793. [Google Scholar] [CrossRef]
  47. Naqui, J.; Damm, C.; Wiens, A.; Jakoby, R.; Su, L.; Mata-Contreras, J.; Martín, F. Transmission Lines Loaded With Pairs of Stepped Impedance Resonators: Modeling and Application to Differential Permittivity Measurements. IEEE Trans. Microw. Theory Tech. 2016, 64, 3864–3877. [Google Scholar] [CrossRef] [Green Version]
  48. Haq, T.; Ruan, C.; Ullah, S.; Kosar Fahad, A. Dual notch microwave sensors based on complementary metamaterial resonators. IEEE Access 2019, 7, 153489–153498. [Google Scholar] [CrossRef]
  49. Boybay, M.S.; Ramahi, O.M. Material characterization using complementary split-ring resonators. IEEE Trans. Instrum. Meas. 2012, 61, 3039–3046. [Google Scholar] [CrossRef]
  50. Lee, C.S.; Yang, C.L. Complementary split-ring resonators for measuring dielectric constants and loss tangents. IEEE Microw. Wirel. Components Lett. 2014, 24, 563–565. [Google Scholar] [CrossRef]
  51. Lee, C.S.; Yang, C.L. Single-compound complementary split-ring resonator for simultaneously measuring the permittivity and thickness of dual-layer dielectric materials. IEEE Trans. Microw. Theory Tech. 2015, 63, 2010–2023. [Google Scholar] [CrossRef]
  52. Ansari, M.A.H.; Jha, A.K.; Akhtar, M.J. Design and Application of the CSRR-Based Planar Sensor for Noninvasive Measurement of Complex Permittivity. IEEE Sens. J. 2015, 15, 7181–7189. [Google Scholar] [CrossRef]
  53. Florencio Díaz, R.; Rodríguez Boix, R.; Carrasco Yépez, F.; Encinar Garcinuño, J.; Barba Gea, M.; Pérez Palomino, G. Broadband reflectarrays made of cells with three coplanar parallel dipoles. Microw. Opt. Technol. Lett. 2014, 56, 748–753. [Google Scholar] [CrossRef]
  54. Alotaibi, S.A.; Cui, Y.; Tentzeris, M.M. CSRR Based Sensors for Relative Permittivity Measurement with Improved and Uniform Sensitivity throughout [0.9-10.9] GHz Band. IEEE Sens. J. 2019, 1–12. [Google Scholar] [CrossRef]
  55. Langlois, S.; Lit, J.W.Y. S-resonator with an end reflector. J. Light. Technol. 1999, 17, 1487–1492. [Google Scholar] [CrossRef]
  56. Deleniv, A.; Gashinova, M.; Eriksson, A.; Khalabuhov, A. Novel band-pass filter utilizing S-shaped slot line resonators. IEEE MTT-S Int. Microw. Symp. Dig. 2003, 2, 1081–1084. [Google Scholar]
  57. Chen, F.C.; Chu, Q.X. A compact dual-band filter using S-shaped stepped impedance resonators. 2008 Int. Conf. Microw. Millim. Wave Technol. Proceedings, ICMMT 2008, 3, 1255–1257. [Google Scholar]
  58. Suntheralingam, N.; Budimir, D. Compact S-shaped resonator loaded waveguide bandpass filters. IEEE Antennas Propag. Soc. AP-S Int. Symp. 2009, 1–4. [Google Scholar]
  59. Khan, M.F.; Mughal, M.J. Tunable metamaterials by varying the inductance and capacitance of S-shaped resonator. In Proceedings of the 2009 3rd IEEE International Symposium on Microwave, Antenna, Propagation and EMC Technologies for Wireless Communications, Beijing, China, 27–29 October 2009; pp. 140–143. [Google Scholar]
  60. Herrojo, C.; Mata-Contreras, J.; Paredes, F.; Martín, F. Microwave Encoders for Chipless RFID and Angular Velocity Sensors Based on S-Shaped Split Ring Resonators. IEEE Sens. J. 2017, 17, 4805–4813. [Google Scholar] [CrossRef] [Green Version]
  61. Bonache, J.; Gil, M.; Gil, I.; García-García, J.; Martín, F. On the electrical characteristics of complementary metamaterial resonators. IEEE Microw. Wirel. Components Lett. 2006, 16, 543–545. [Google Scholar] [CrossRef]
  62. Haq, T.; Ruan, C.; Zhang, X.; Kosar, A.; Ullah, S. Low cost and compact wideband microwave notch filter based on miniaturized complementary metaresonator. Appl. Phys. A Mater. Sci. Process. 2019, 125, 1–7. [Google Scholar] [CrossRef]
  63. Pozar, D.M. Microwave Engineering; John Wiley & Sons, Inc.: Hoboken, NJ, USA, 2012; ISBN 9789896540821. [Google Scholar]
  64. Haq, T.U.; Ruan, C.; Zhang, X.; Ullah, S. Complementary Metamaterial Sensor for Nondestructive Evaluation of Dielectric Substrates. Sensors 2019, 19, 2100. [Google Scholar] [CrossRef] [PubMed] [Green Version]
  65. Ebrahimi, A.; Scott, J.; Ghorbani, K. Ultrahigh-Sensitivity Microwave Sensor for Microfluidic Complex Permittivity Measurement. IEEE Trans. Microw. Theory Tech. 2019, 67, 4269–4277. [Google Scholar] [CrossRef]
  66. Ebrahimi, A.; Withayachumnankul, W.; Al-Sarawi, S.; Aboott, D. High-Sensitivity Metamaterial-Inspired Sensor. IEEE Sens. J. 2014, 14, 1345–1351. [Google Scholar] [CrossRef] [Green Version]
  67. Rowe, D.J.; Abduljabar, A.A.; Porch, A.; Barrow, D.A.; Allender, C.J. Improved Split-Ring Resonator for Micro Fluidic Sensing. IEEE Trans. Microw. Theory Tech. 2014, 62, 689–700. [Google Scholar] [CrossRef]
  68. Abdolrazzaghi, M.; Daneshmand, M.; Iyer, A.K. Strongly Enhanced Sensitivity in Planar Microwave Sensors Based on Metamaterial Coupling. IEEE Trans. Microw. Theory Tech. 2018, 66, 1843–1855. [Google Scholar] [CrossRef] [Green Version]
  69. Galindo-Romera, G.; Javier Herraiz-Martínez, F.; Gil, M.; Martínez-Martínez, J.J.; Segovia-Vargas, D. Submersible Printed Split-Ring Resonator-Based Sensor for Thin-Film Detection and Permittivity Characterization. IEEE Sens. J. 2016, 16, 3587–3596. [Google Scholar] [CrossRef]
  70. Su, L.; Mata-Contreras, J.; Vélez, P.; Fernández-Prieto, A.; Martín, F. Analytical method to estimate the complex permittivity of oil samples. Sensors 2018, 18, 984. [Google Scholar] [CrossRef] [Green Version]
Figure 1. (a) Sensor design based on FR4 epoxy substrate (a1 = 1.6 mm). (b) Top view of sensor (b1 = 25 mm, b2 = 30 mm, b3 = 3 mm). (c) Bottom view of sensor (e1 = e2 = 6 mm, e3 = e4 = 0.5 mm). (d) Equivalent circuit model with L and C for the unit length inductance and capacitance of the microstrip transmission line respectively and (RLC)C for the complementary symmetric S-shaped resonator (CSSSR).
Sensors 20 01916 g001
Figure 2. Simulated reflection (S11) and transmission (S21) coefficient of the proposed sensor based on CSSSR. The proposed sensor shows resonance at 15.17 GHz with notch depth −39.84 dB.
Sensors 20 01916 g002
Figure 3. Magnitude of electric field at the resonance frequency of the proposed sensor. The electric field is concentrated at the edges of the CSSSR and its maximum value is 1.10 x 10⁵ V/m.
Sensors 20 01916 g003
Figure 4. (a) Sensor based on CSSSR with material under test (MUT) in the ground plane with air gap (35 µm). (b) Bottom view of the sensor with MUT (d1= 10 mm, and d2 = 10 mm). (c) Front view of the sensor with MUT (d3 = 1 mm).
Sensors 20 01916 g004
Figure 5. Simulated transmission coefficient (S21) of the sensor due to interaction with the MUT with different values of permittivity (εr). As the relative permittivity of MUT increases, the resonance frequency decreases.
Sensors 20 01916 g005
Figure 6. Simulated transmission coefficient (S21) of the sensor due to interaction with the MUT with different values of permeability (µr). As the relative permeability of MUT increases, the resonance frequency decreases.
Sensors 20 01916 g006
Figure 7. Simulated transmission coefficient (S21) of the sensor due to interaction with the MUT with different values of dielectric loss tangent (tanδe).
Sensors 20 01916 g007
Figure 8. Simulated transmission coefficient (S21) of the sensor due to interaction with the MUT with different values of magnetic loss tangent (tanδm).
Sensors 20 01916 g008
Figure 9. Real relative permittivity and permeability of MUT versus resonance frequency of the sensor.
Sensors 20 01916 g009
Figure 10. Dielectric loss tangent and magnetic loss tangent of MUT versus notch depth of the sensor.
Sensors 20 01916 g010
Figure 11. Photograph of fabricated prototype of the sensor based on CSSSR with glass as MUT and high-precision SMA connectors (impedance = 50 Ω, center contact resistance ≤0.3 mΩ, insulation resistance ≥3000 MΩ).
Sensors 20 01916 g011
Figure 12. Magnitude of transmission (S21) coefficient for simulated and measured sensor based on CSSSR. Simulated resonance frequency is 15.17 GHz with notch depth of −39.84 dB while measured resonance frequency is 15.12 GHz with notch depth of −44.33 dB.
Sensors 20 01916 g012
Figure 13. Measured transmission coefficient (S21) of the sensor due to interaction with composite MUTs.
Sensors 20 01916 g013
Figure 14. Real relative permittivity of MUT versus resonance frequency of the sensor. Relative permittivity of the MUT is inversely proportional to the resonance frequency of the sensor.
Sensors 20 01916 g014
Table 1. Comparison of frequency shift with various state of art sensors.
RefHosting Transmission LineResonating StructureFrequency Band (GHz)Shift in Resonance Frequency
[49]MicrostripRectangular CSRR0.8–1.338%
[50]MicrostripRectangular CSRR1.8–2.836%
[51]MicrostripSingle Compound CSRR1.08–1.6334%
[52]MicrostripCircular CSRR1.75–2.7536%
[53]MicrostripHexagonal CSRR5.23–8.4538%
[54]MicrostripSingle CSRR0.90–10.9050%
This WorkMicrostripCSSSR13.28–15.17100%
Table 2. Effect of relative permittivity of MUT on resonance frequency and notch depth of the sensor.
Material Under Test
(MUT)
Resonance FrequencyNotch Depth
εrµrtanδetanδmGHzdB
1.010015.17−39.84
1.510014.57−44.88
2.010014.07−38.41
2.5 10013.69−40.77
3.0 10013.29−42.32
Table 3. Effect of relative permeability of MUT on resonance frequency and notch depth of the sensor.
Material Under Test
(MUT)
Resonance FrequencyNotch Depth
εrµrtanδetanδmGHzdB
11.00015.17−39.84
11.50014.01−40.11
12.00013.39−37.41
1 2.50013.05−37.93
1 3.00012.80−32.23
Table 4. Effect of dielectric loss tangent of MUT on resonance frequency and notch depth of the sensor.
Material Under Test
(MUT)
Resonance FrequencyNotch Depth
εrµrtanδetanδmGHzdB
110.0015.17−39.84
110.1015.20−22.15
110.2015.22−17.21
1 1 0.3015.25−14.60
1 1 0.4015.28−12.96
Table 5. Effect of magnetic loss tangent of MUT on resonance frequency and notch depth of the sensor.
Material Under Test
(MUT)
Resonance FrequencyNotch Depth
εrµrtanδetanδmGHzdB
1100.015.17−39.84
1100.115.21−15.15
1100.215.28−11.06
1 1 00.315.32−9.19
1 1 00.415.30−8.08
Table 6. Simulated and measured resonance frequencies of the sensor due to interaction with MUTs.
Material Under Test
(MUT)
MUT PropertiesSimulated
Resonance Frequency
Measured
Resonance
Frequency
εrµrtanδetanδmGHzGHz
Teflon(tm)2.110.001014.0413.99
Rogers RT58802.210.0009013.9513.89
HDPE Plastic2.31 0.0005013.8613.80
Neltec NX92402.410.0016 13.7713.72
Glass PTFEreinf2.510.002013.6813.63
Polystyrene2.610013.6013.55
PVC Plastic2.710.007013.5213.46
Isola IS680-2802.810.0025013.4413.38
Rubber Hard31 0013.2813.23
Table 7. Differential sensitivity of the fabricated sensor with respect to MUT.
Material Under Test
(MUT)
Differential InputDifferential OutputDifferential Sensitivity
ε M U T ε A i r f u f l %
Teflon(tm)1.09941.13102
Rogers RT58801.19941.23102
HDPE Plastic1.29941.32101
Netltec NX92401.39941.40100
Glass PTFEreinf1.49941.4999
Polystyrene1.59941.5798
PVC Plastic1.69941.6698
Isola IS680-2801.79941.7497
Rubber Hard1.99941.8995
Table 8. Comparison of relative sensitivity with various state of the art sensors.
RefResonating
Structure
Resonance Frequency
(GHz)
Permittivity Range Studied Relative Sensitivity
(%)
[65]SIR1.9110–800.84
[66]CSRR2.410–800.61
[67]SRR1.7210–800.78
[68]Open-Loop Resonators2.610–1401.49
[69]SRR1.82.42–22.523.04
[70]CSRR2.52.93–3.643.58
This WorkCSSSR15.122.1–36.7

