An Impedance-Loaded Orthogonal Frequency-Coded SAW Sensor for Passive Wireless Sensor Networks


Abstract
1. Introduction
2. Principle of Impedance-Loaded OFC SAW Sensors
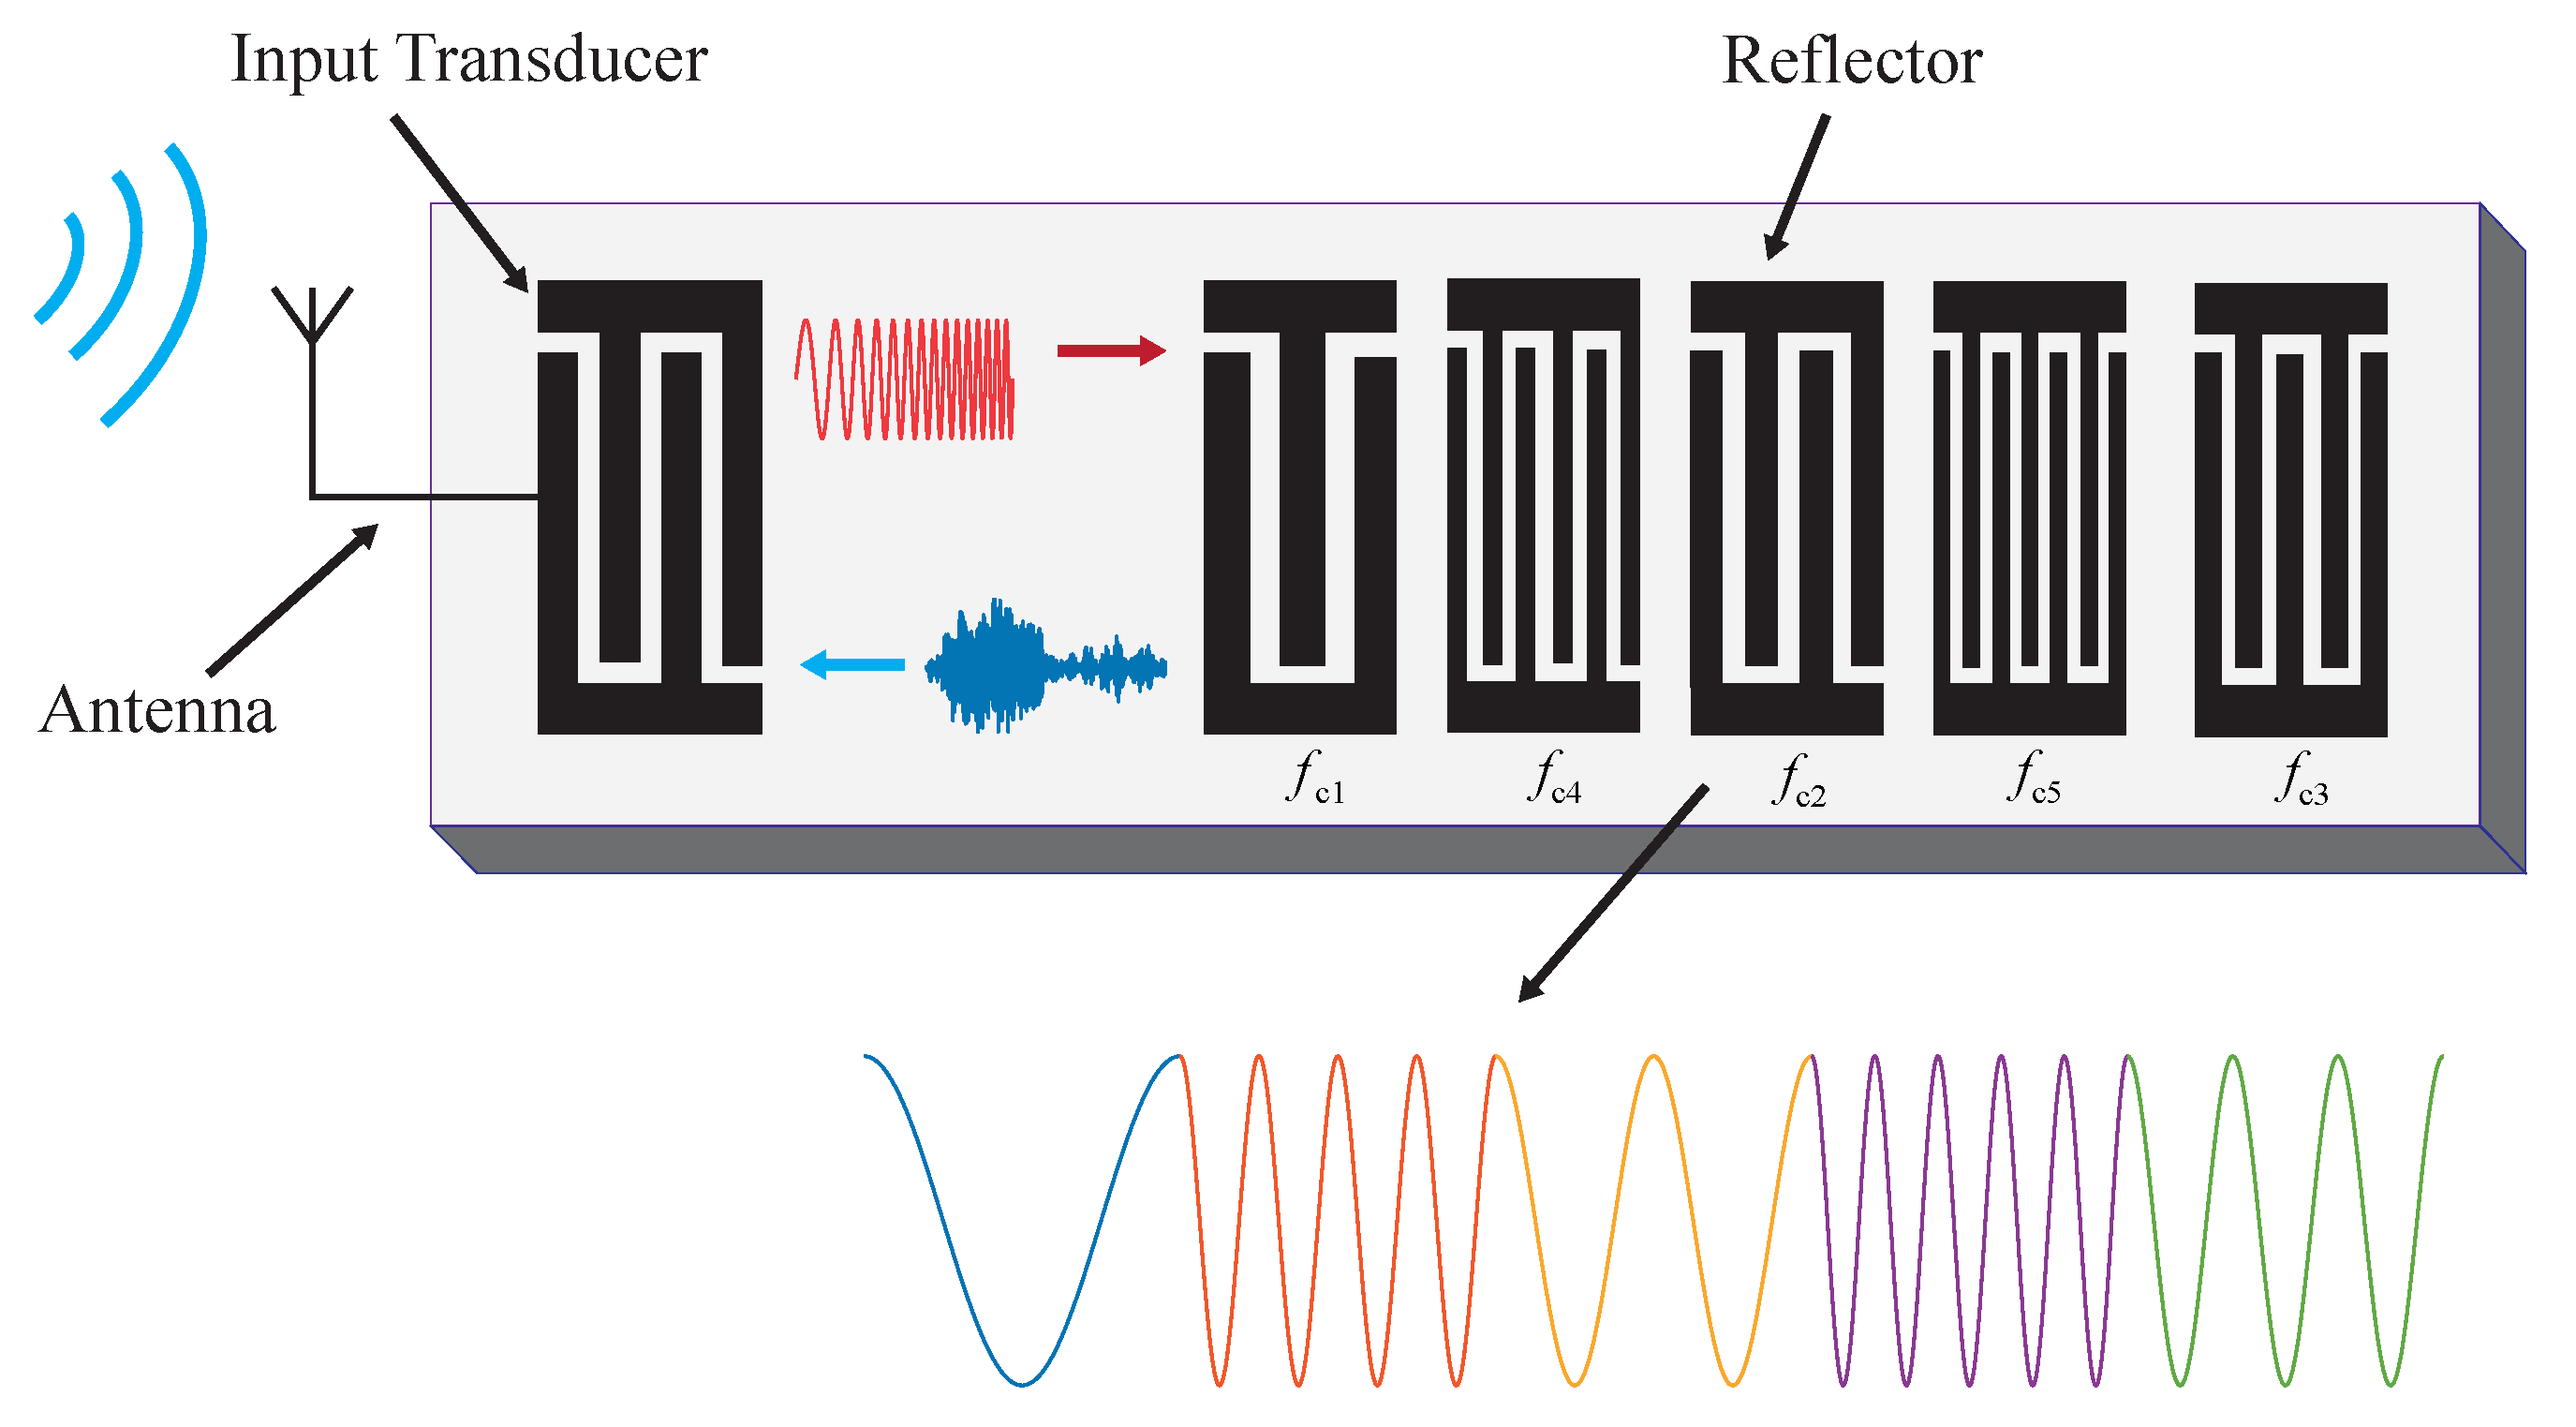
2.1. Principle of Orthogonal Frequency Coding
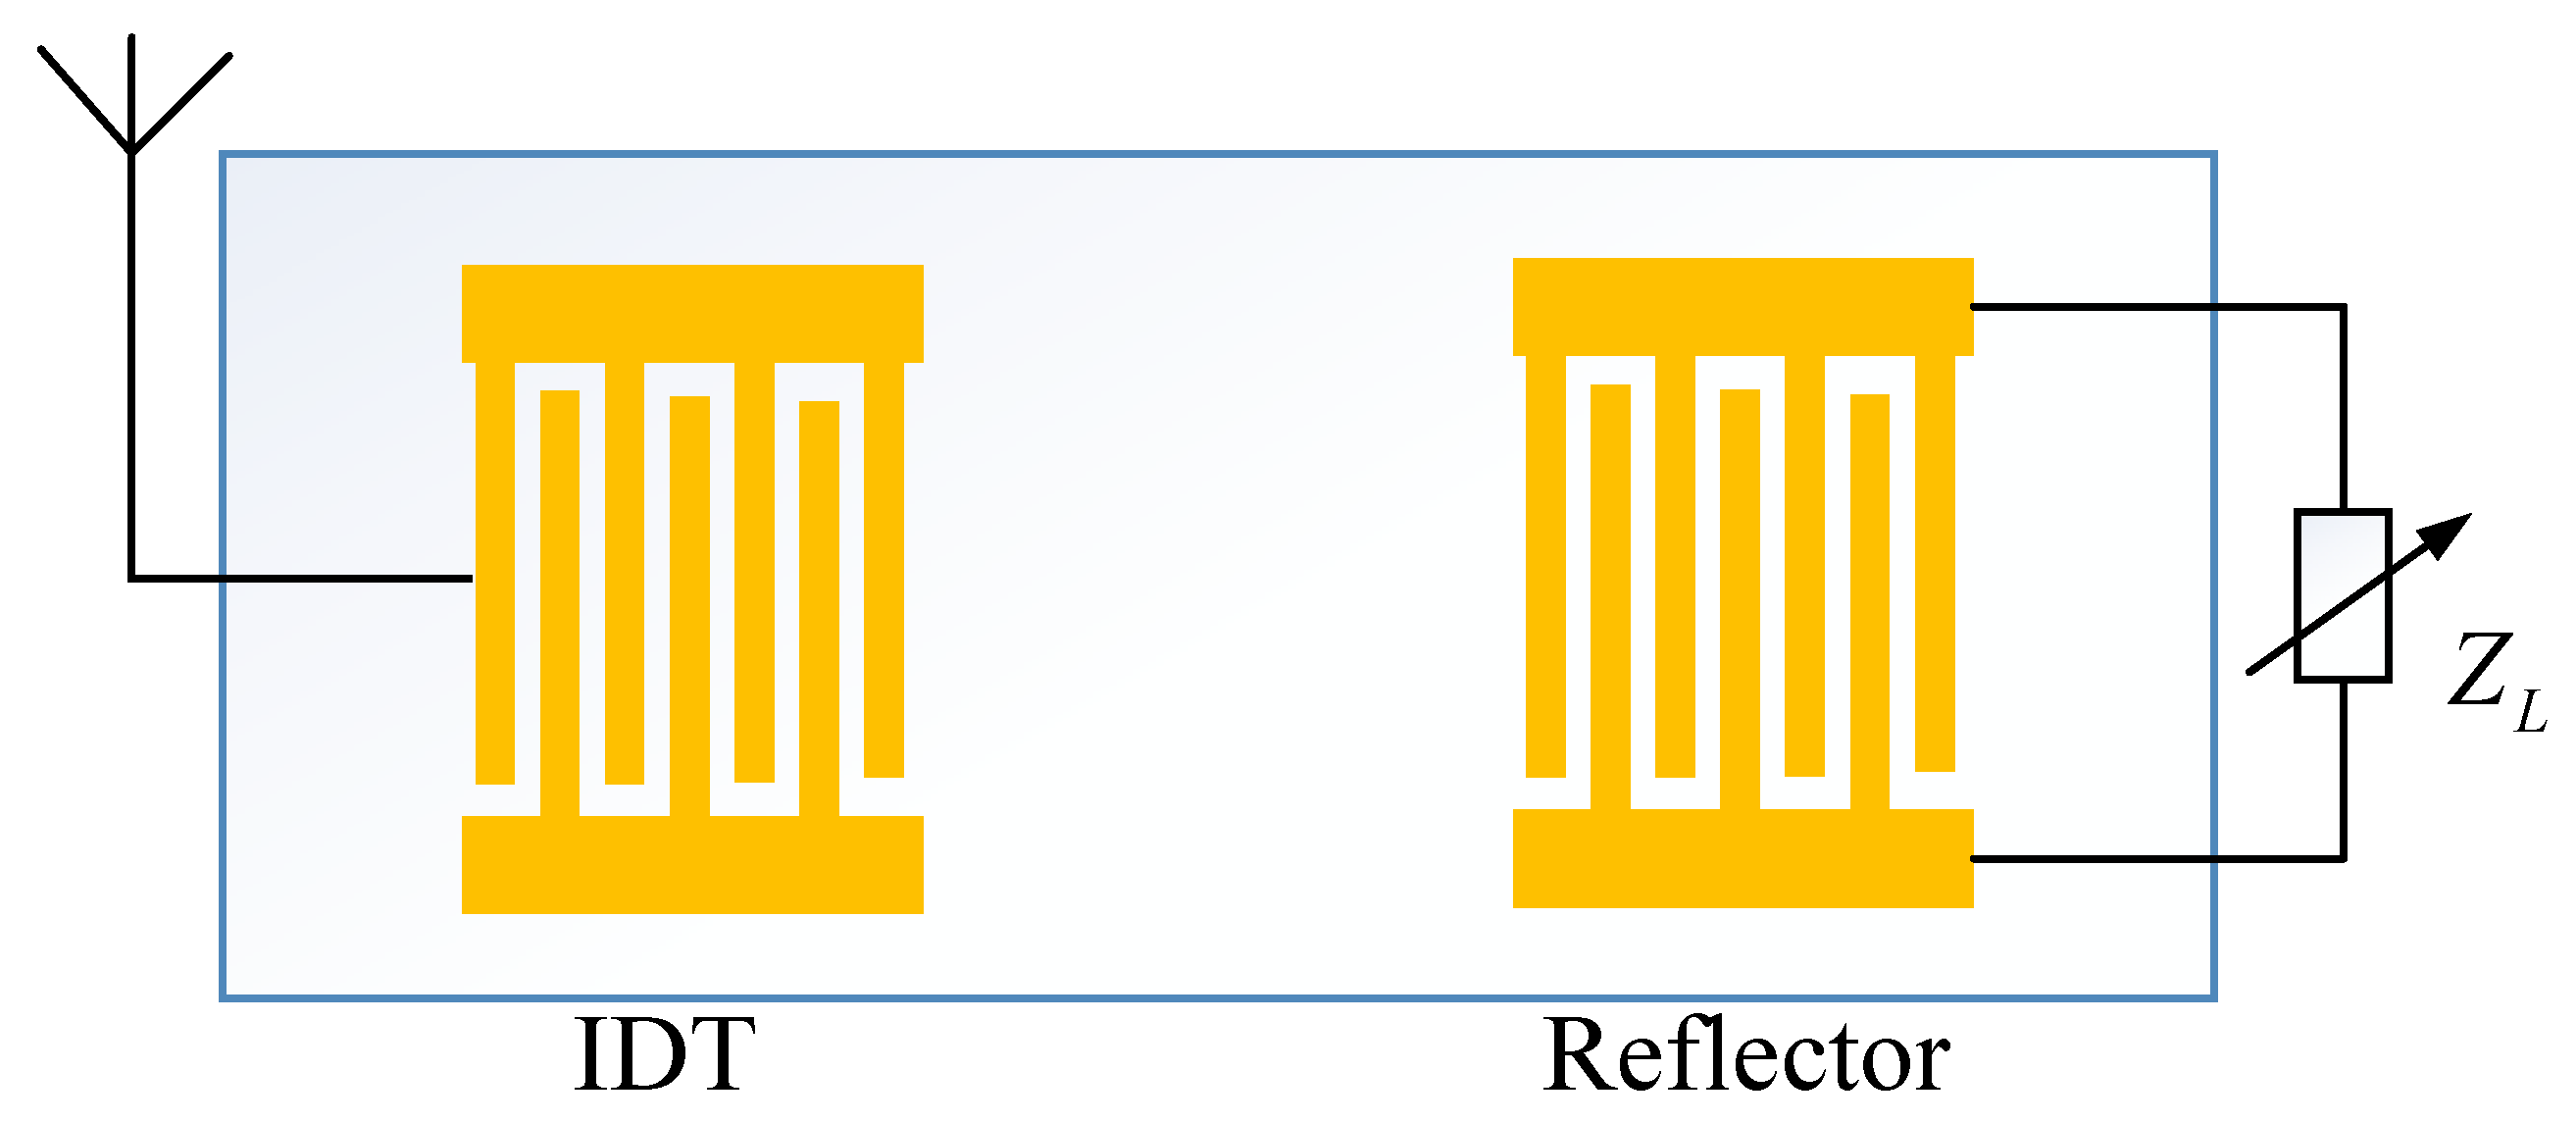
2.2. Principle of Impedance-Loaded SAW Devices
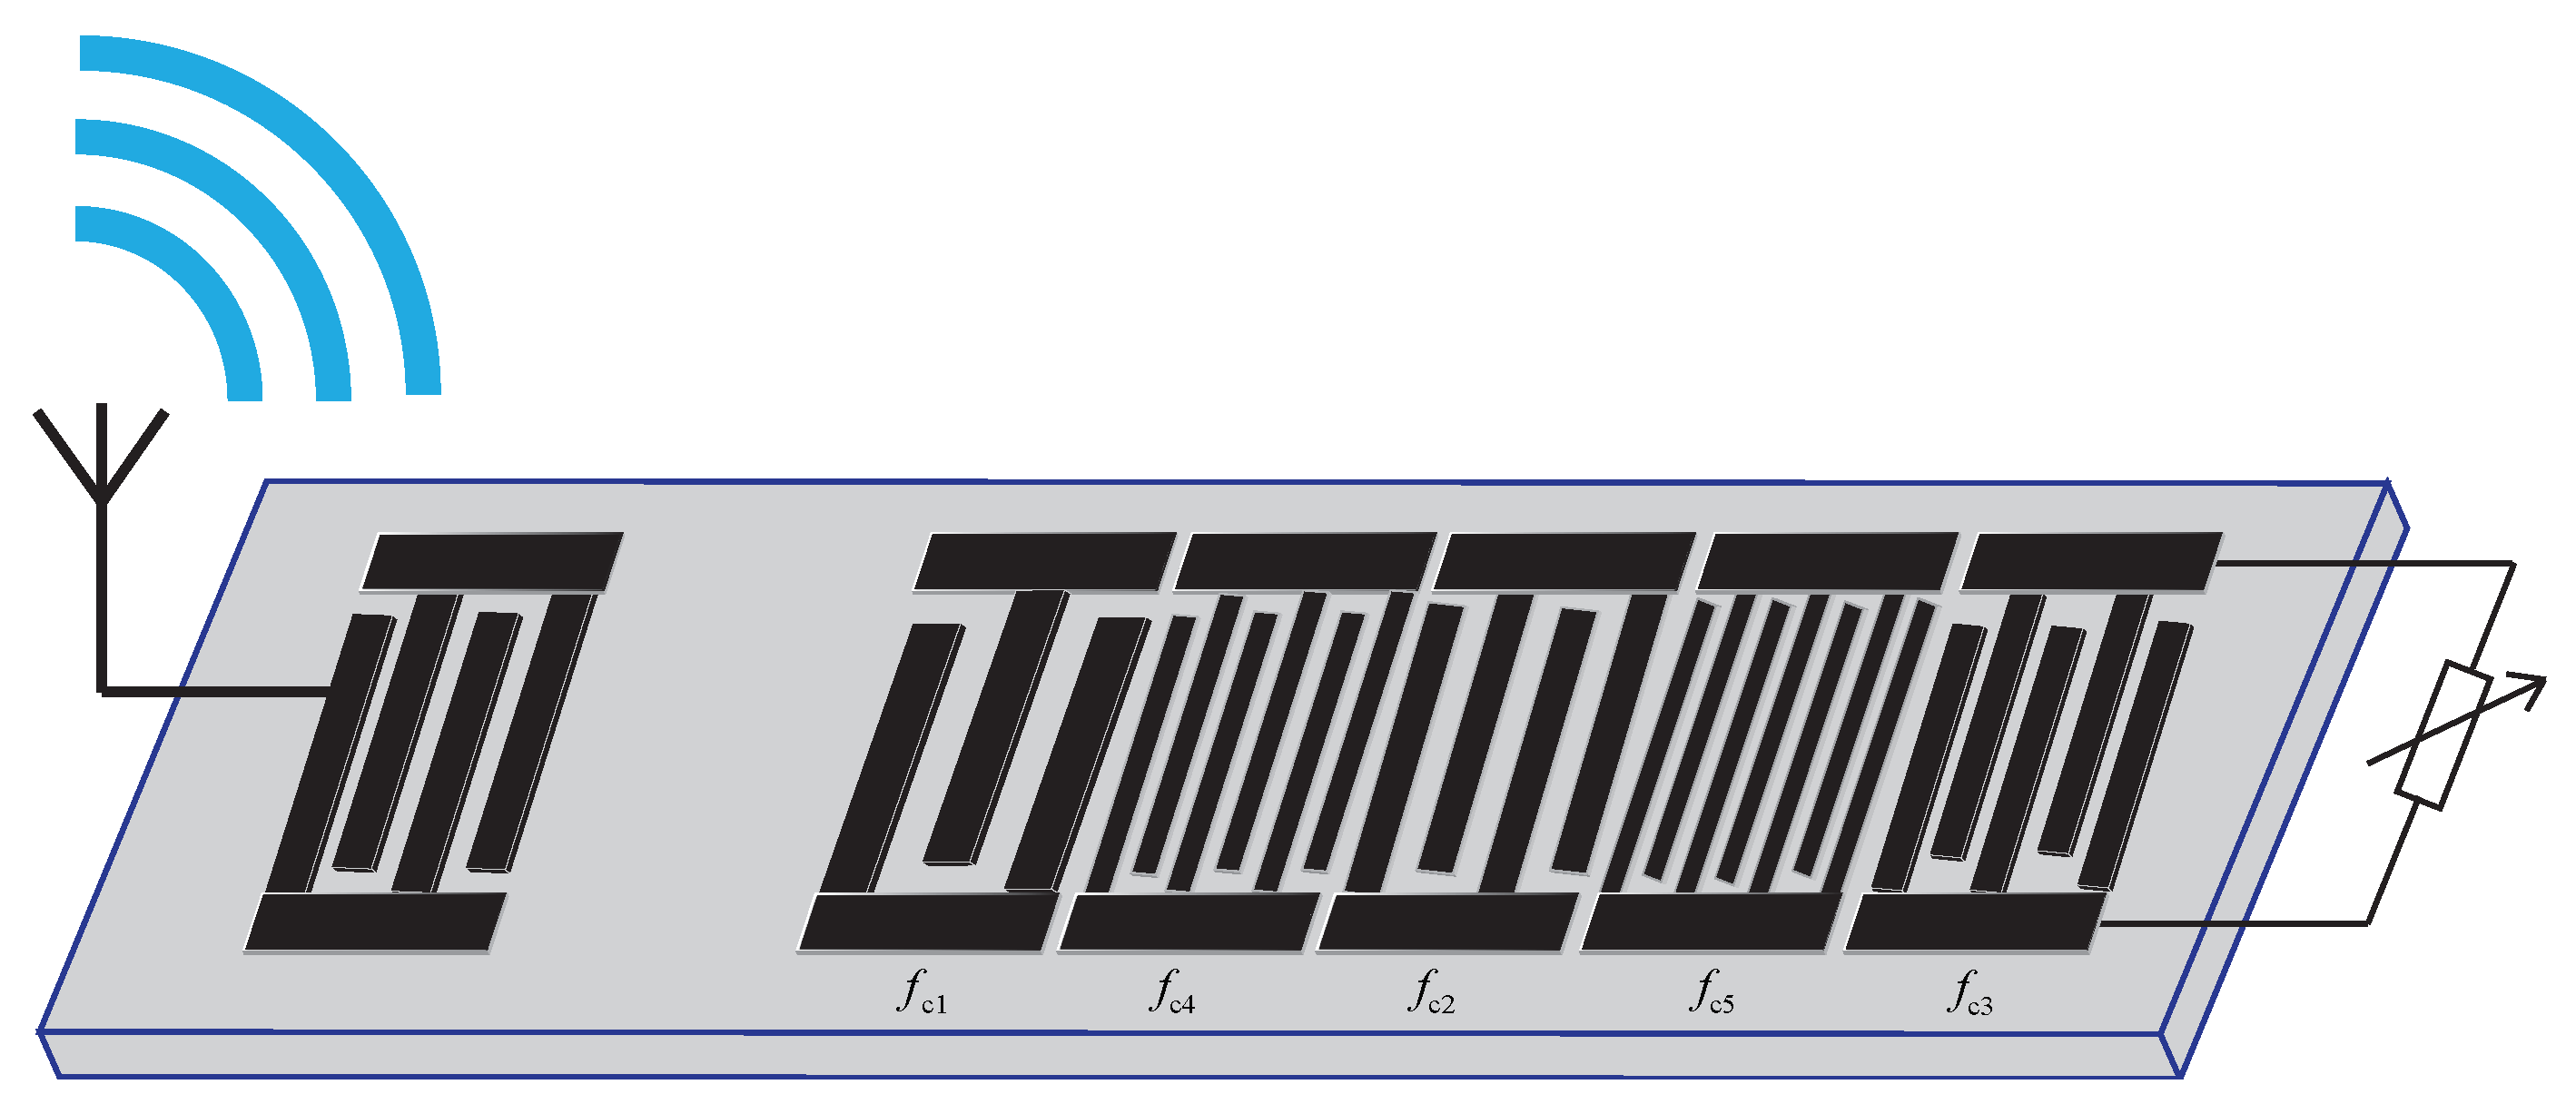
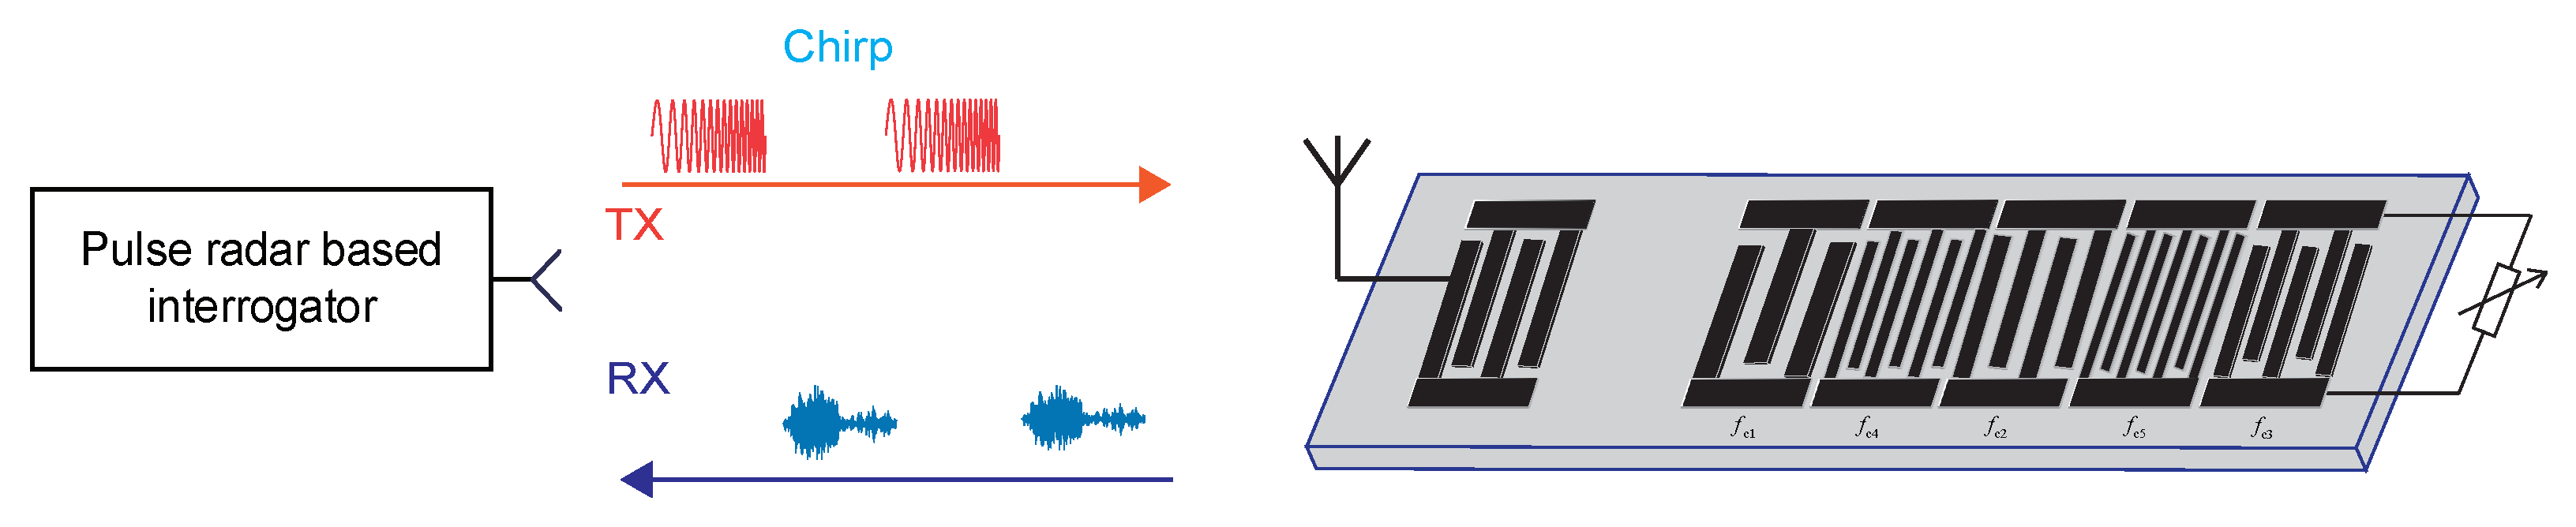
3. Wireless Passive Impedance-Loaded OFC SAW Sensors
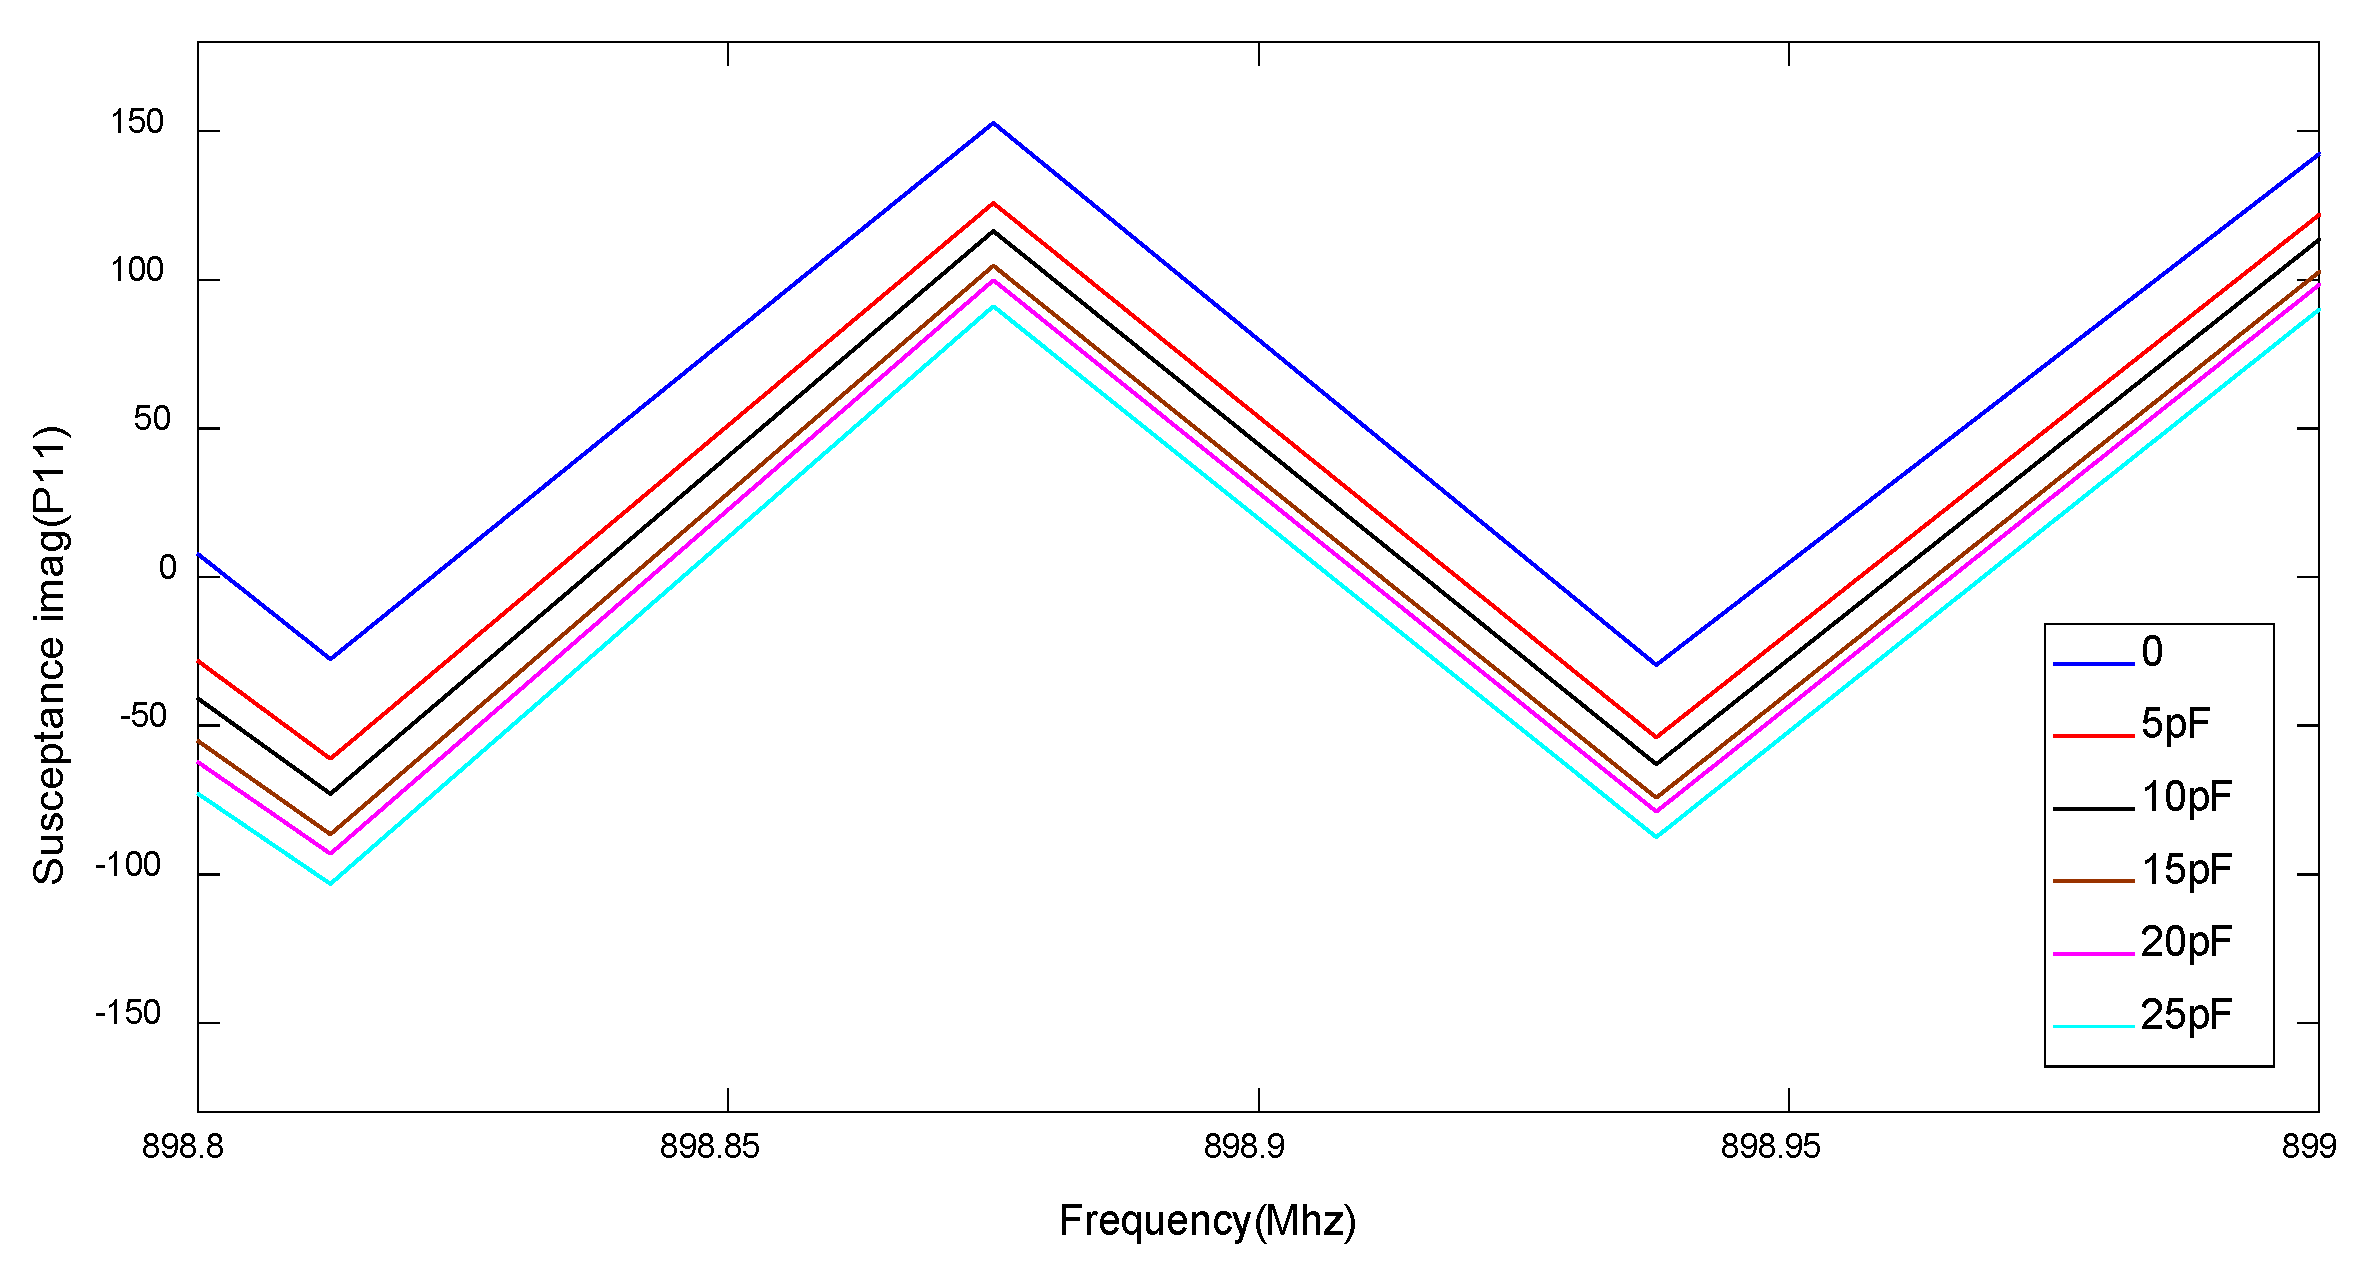
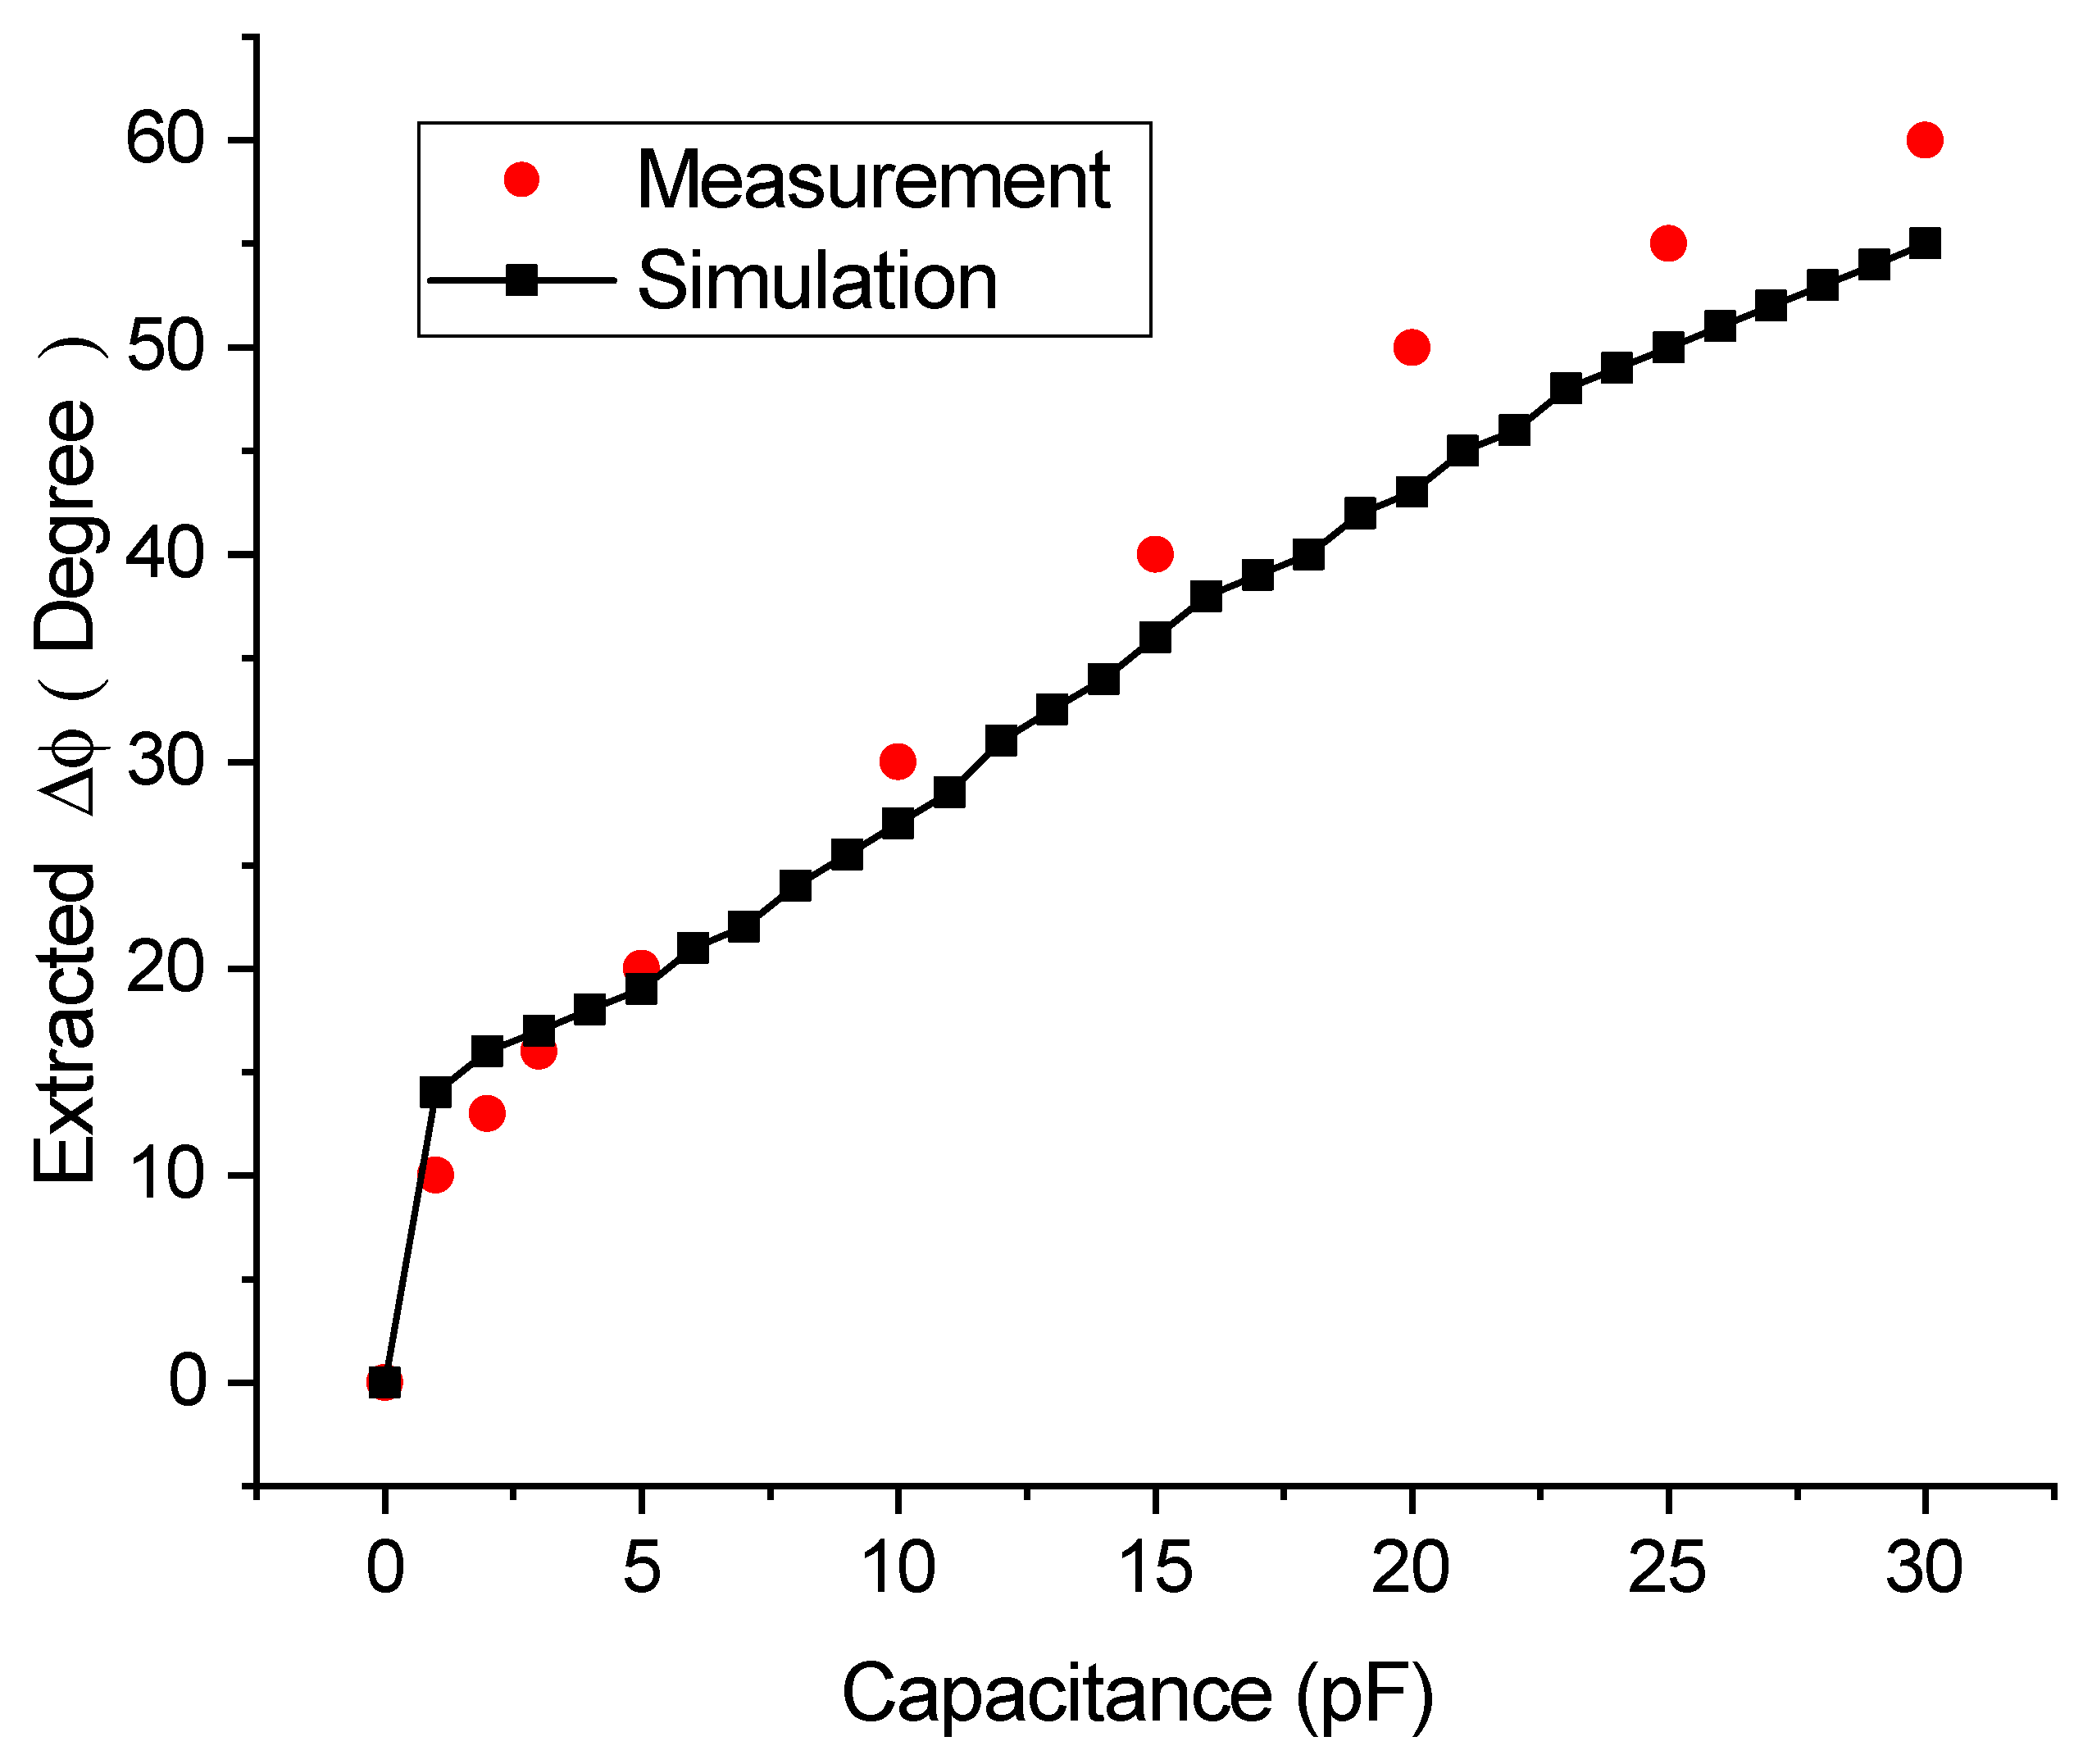
3.1. Relationship Between and the External Impedance
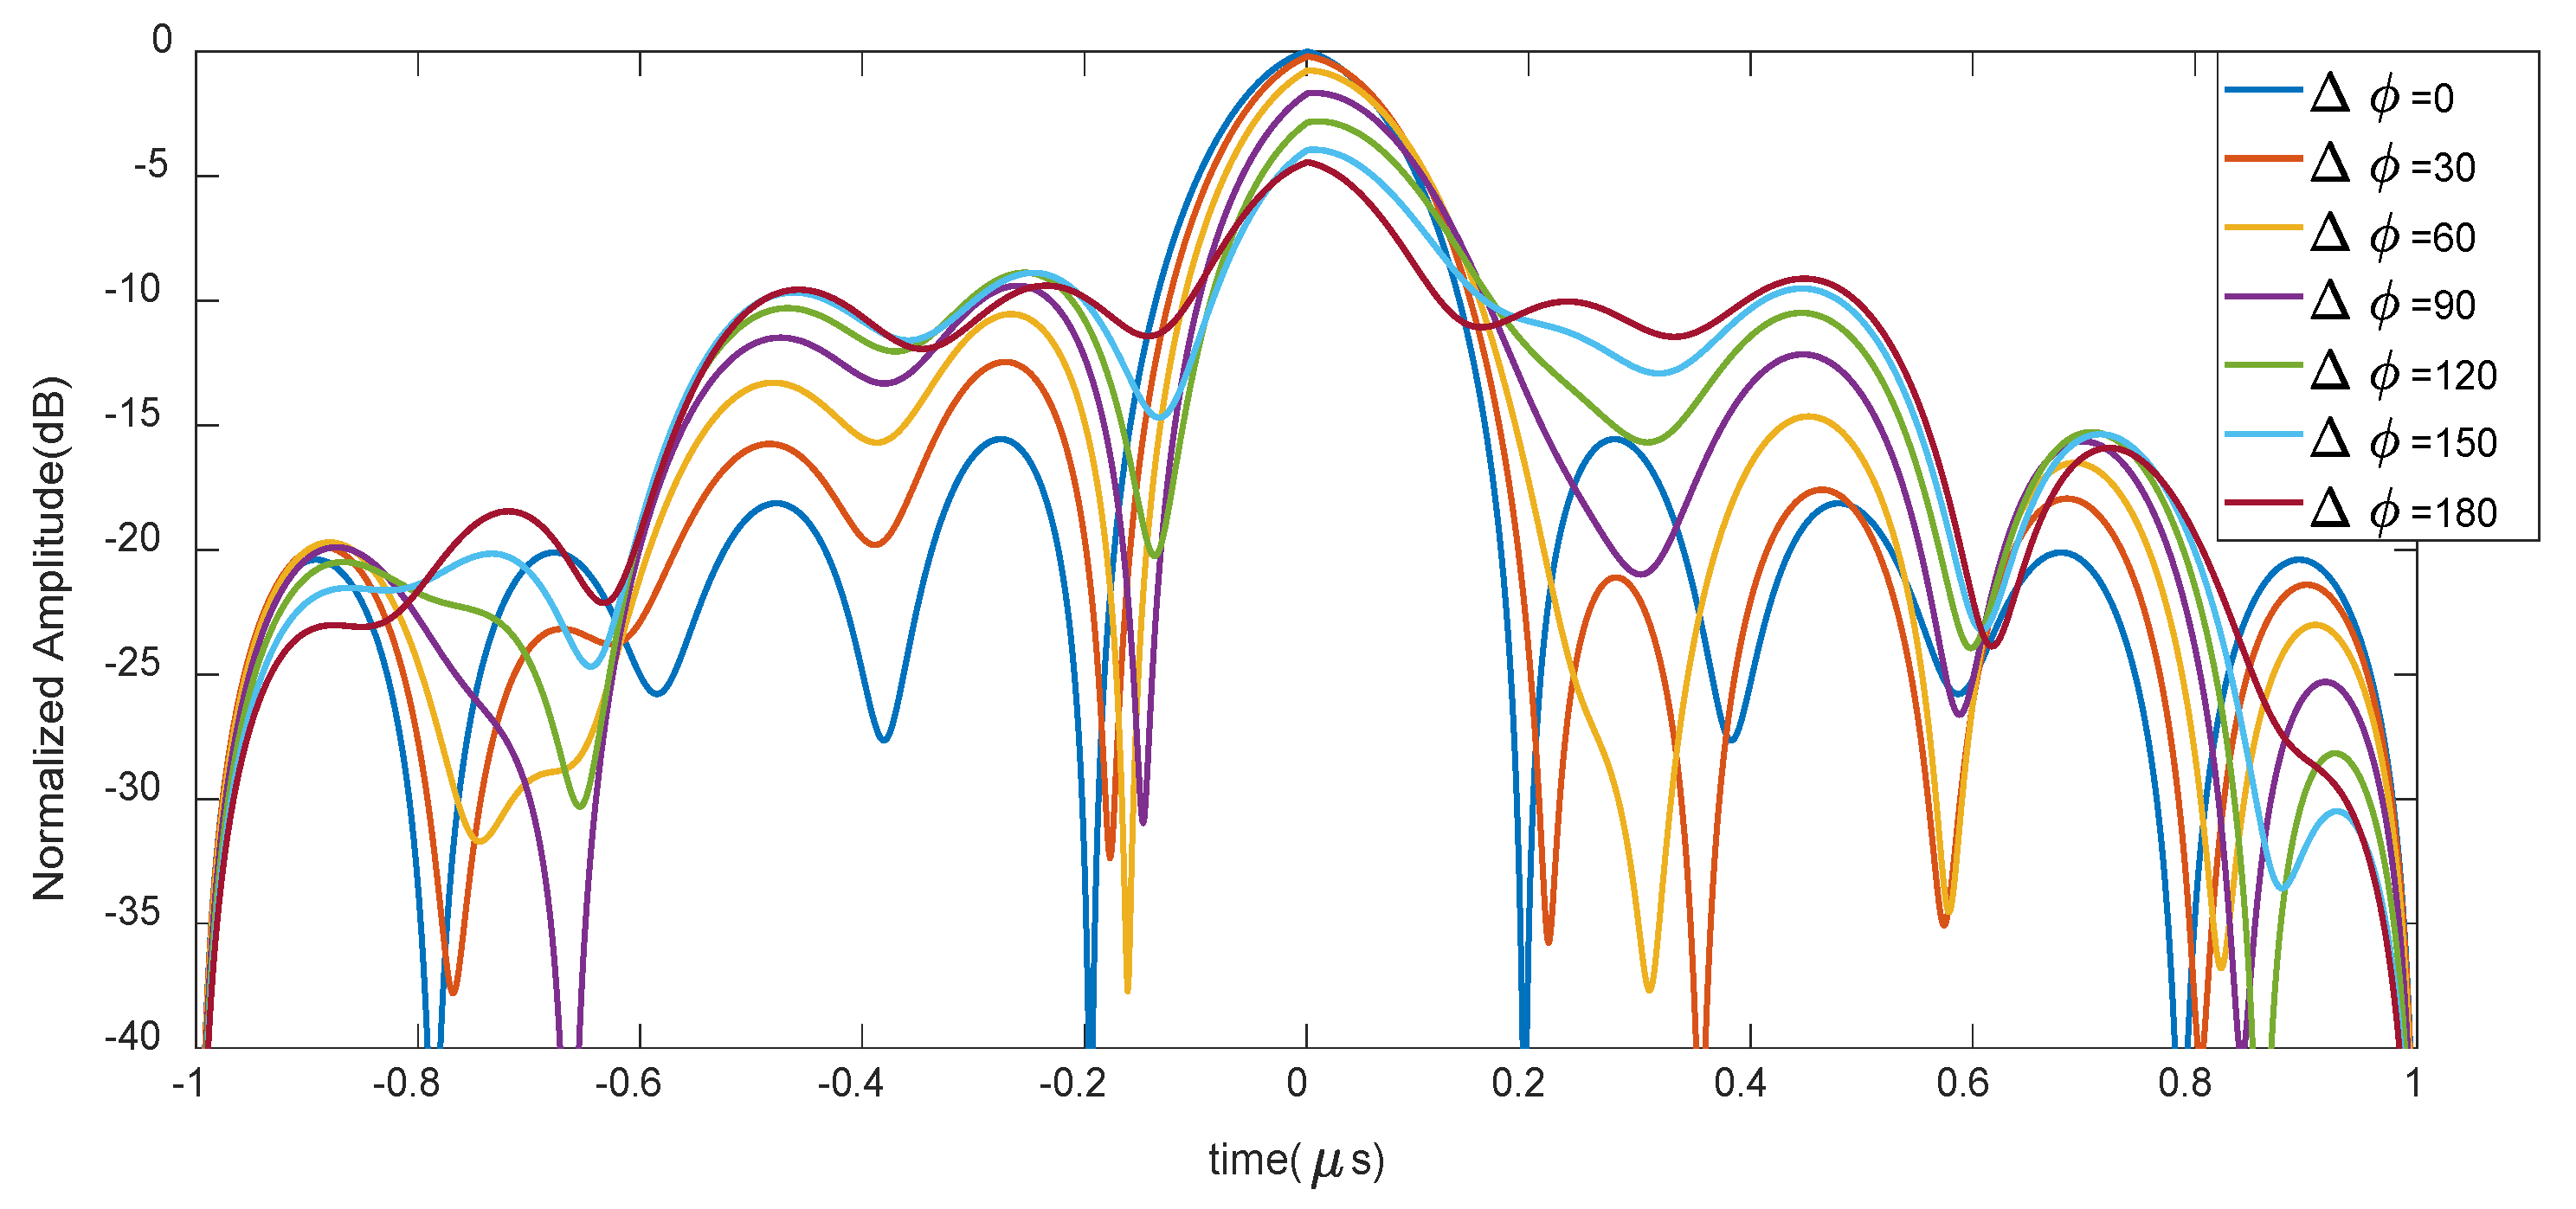
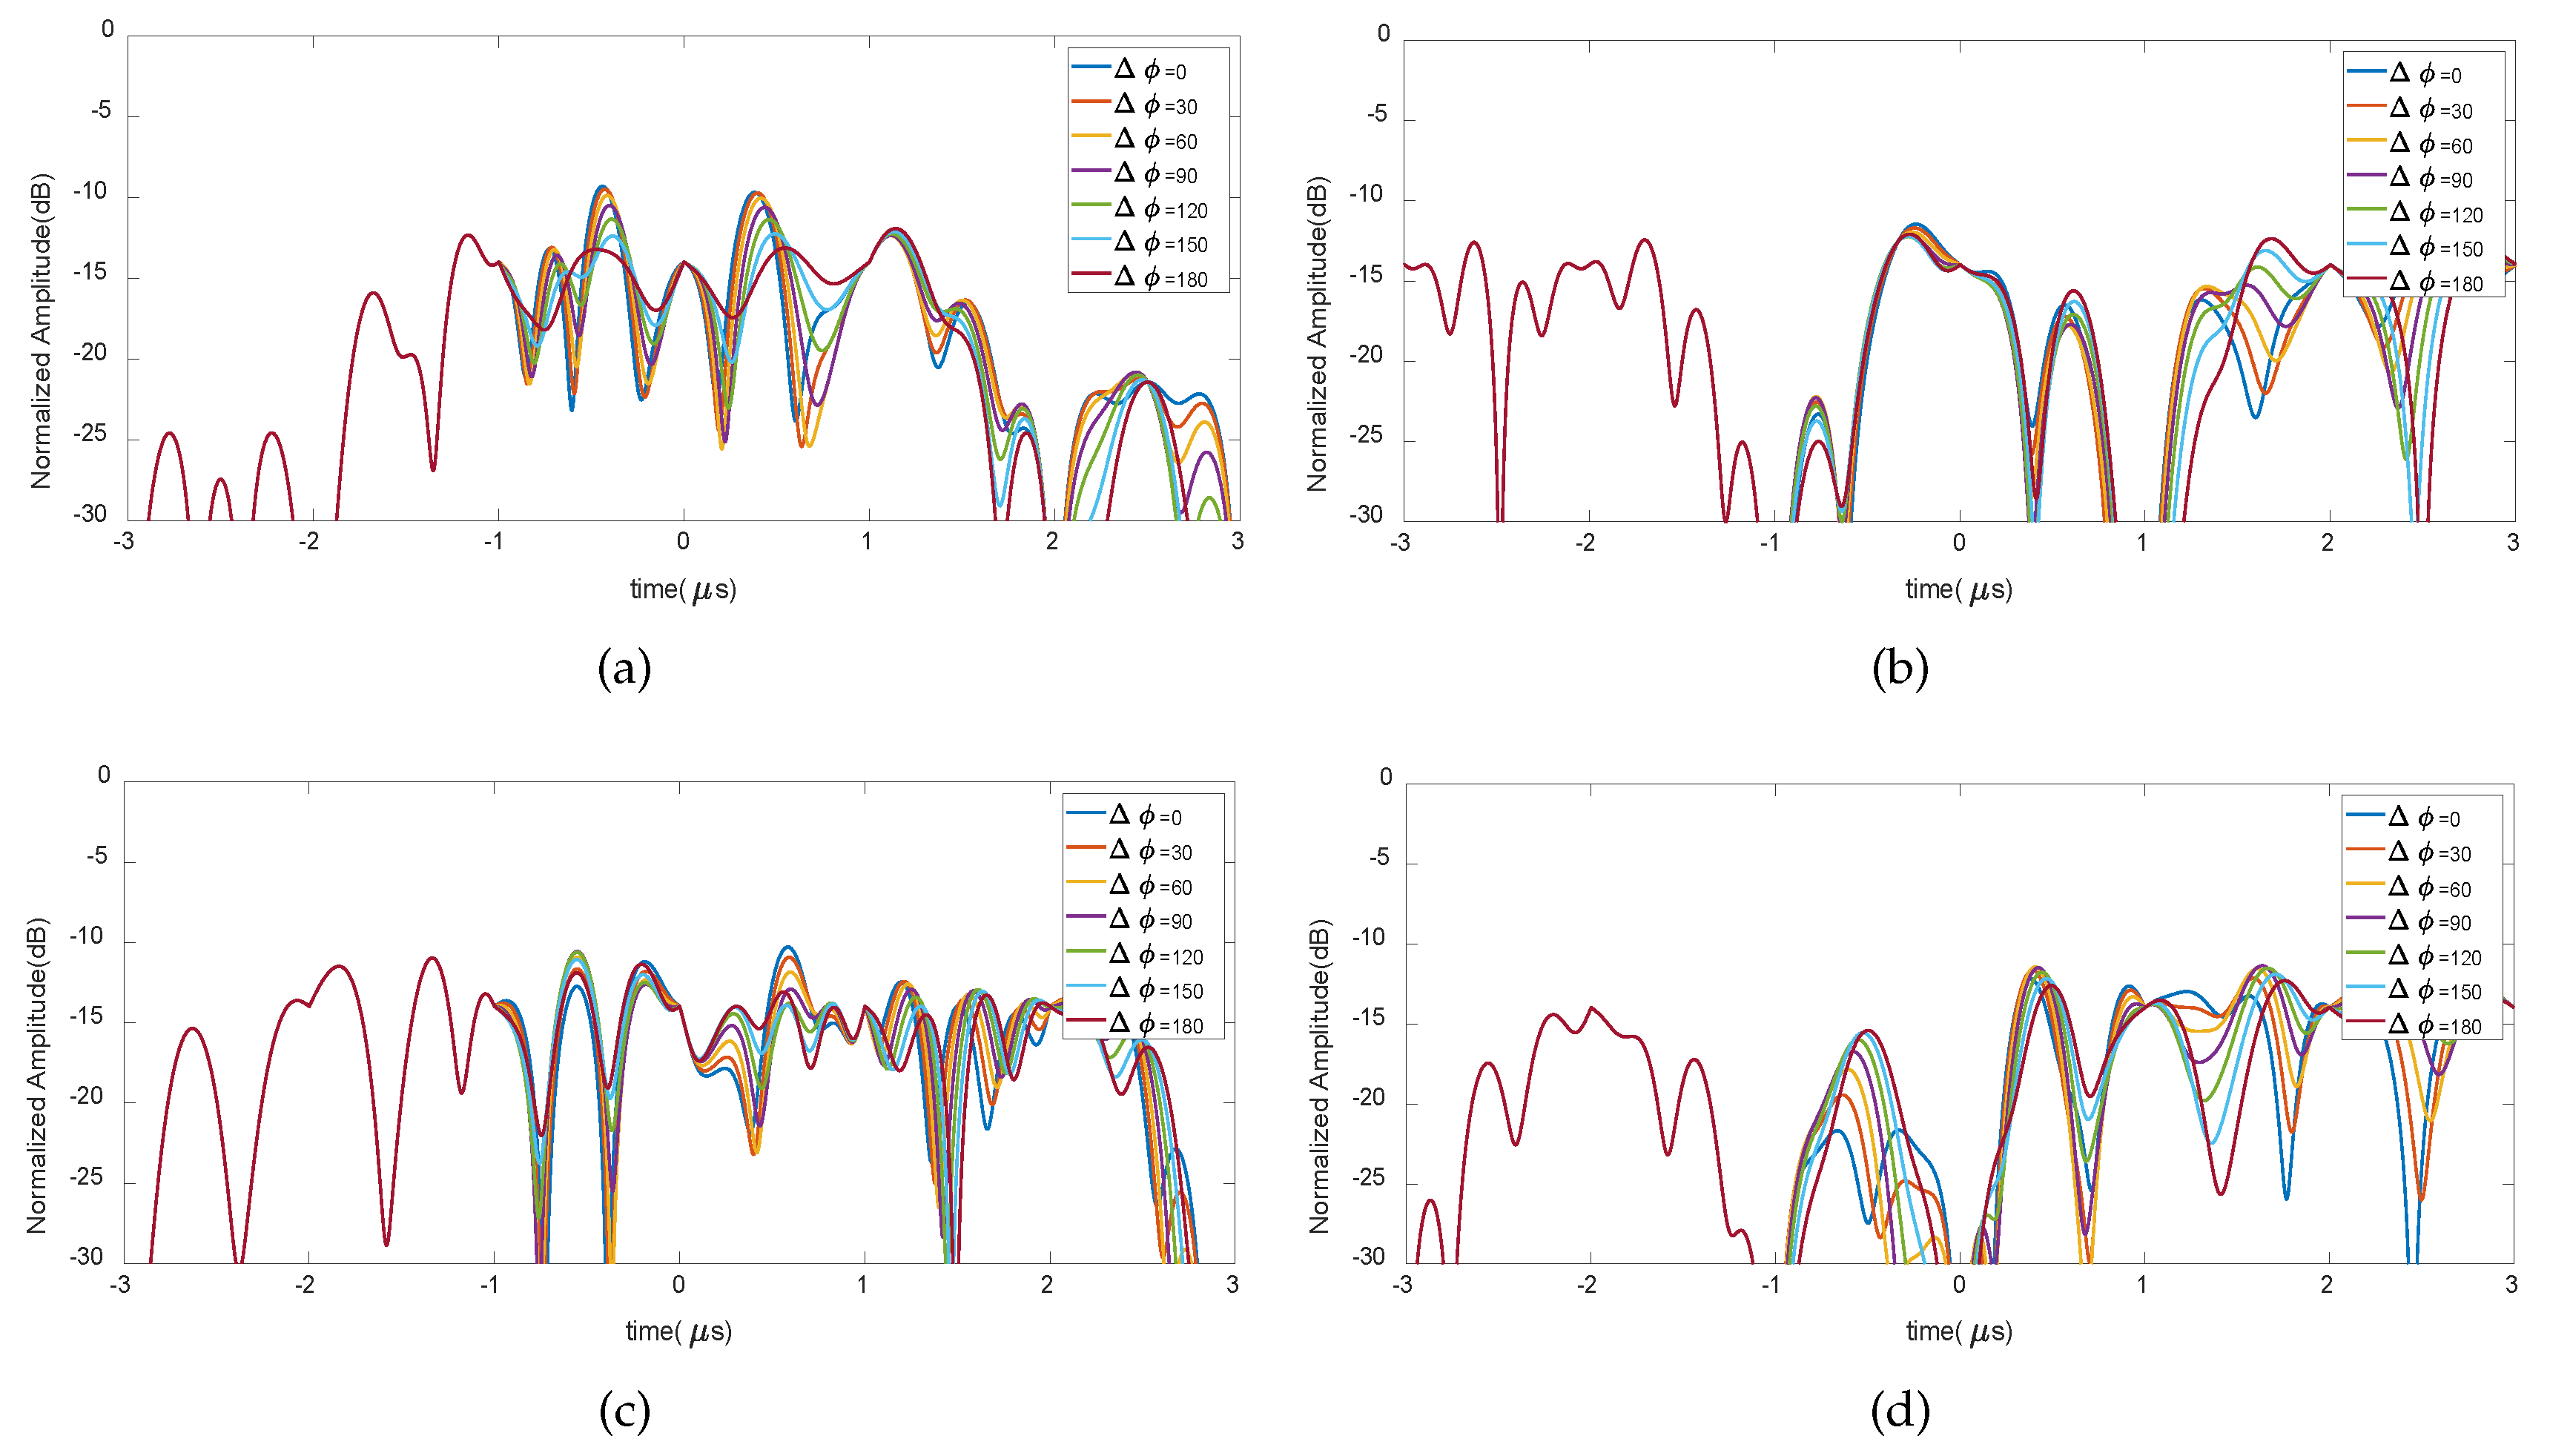
3.2. Effect of on Orthogonality
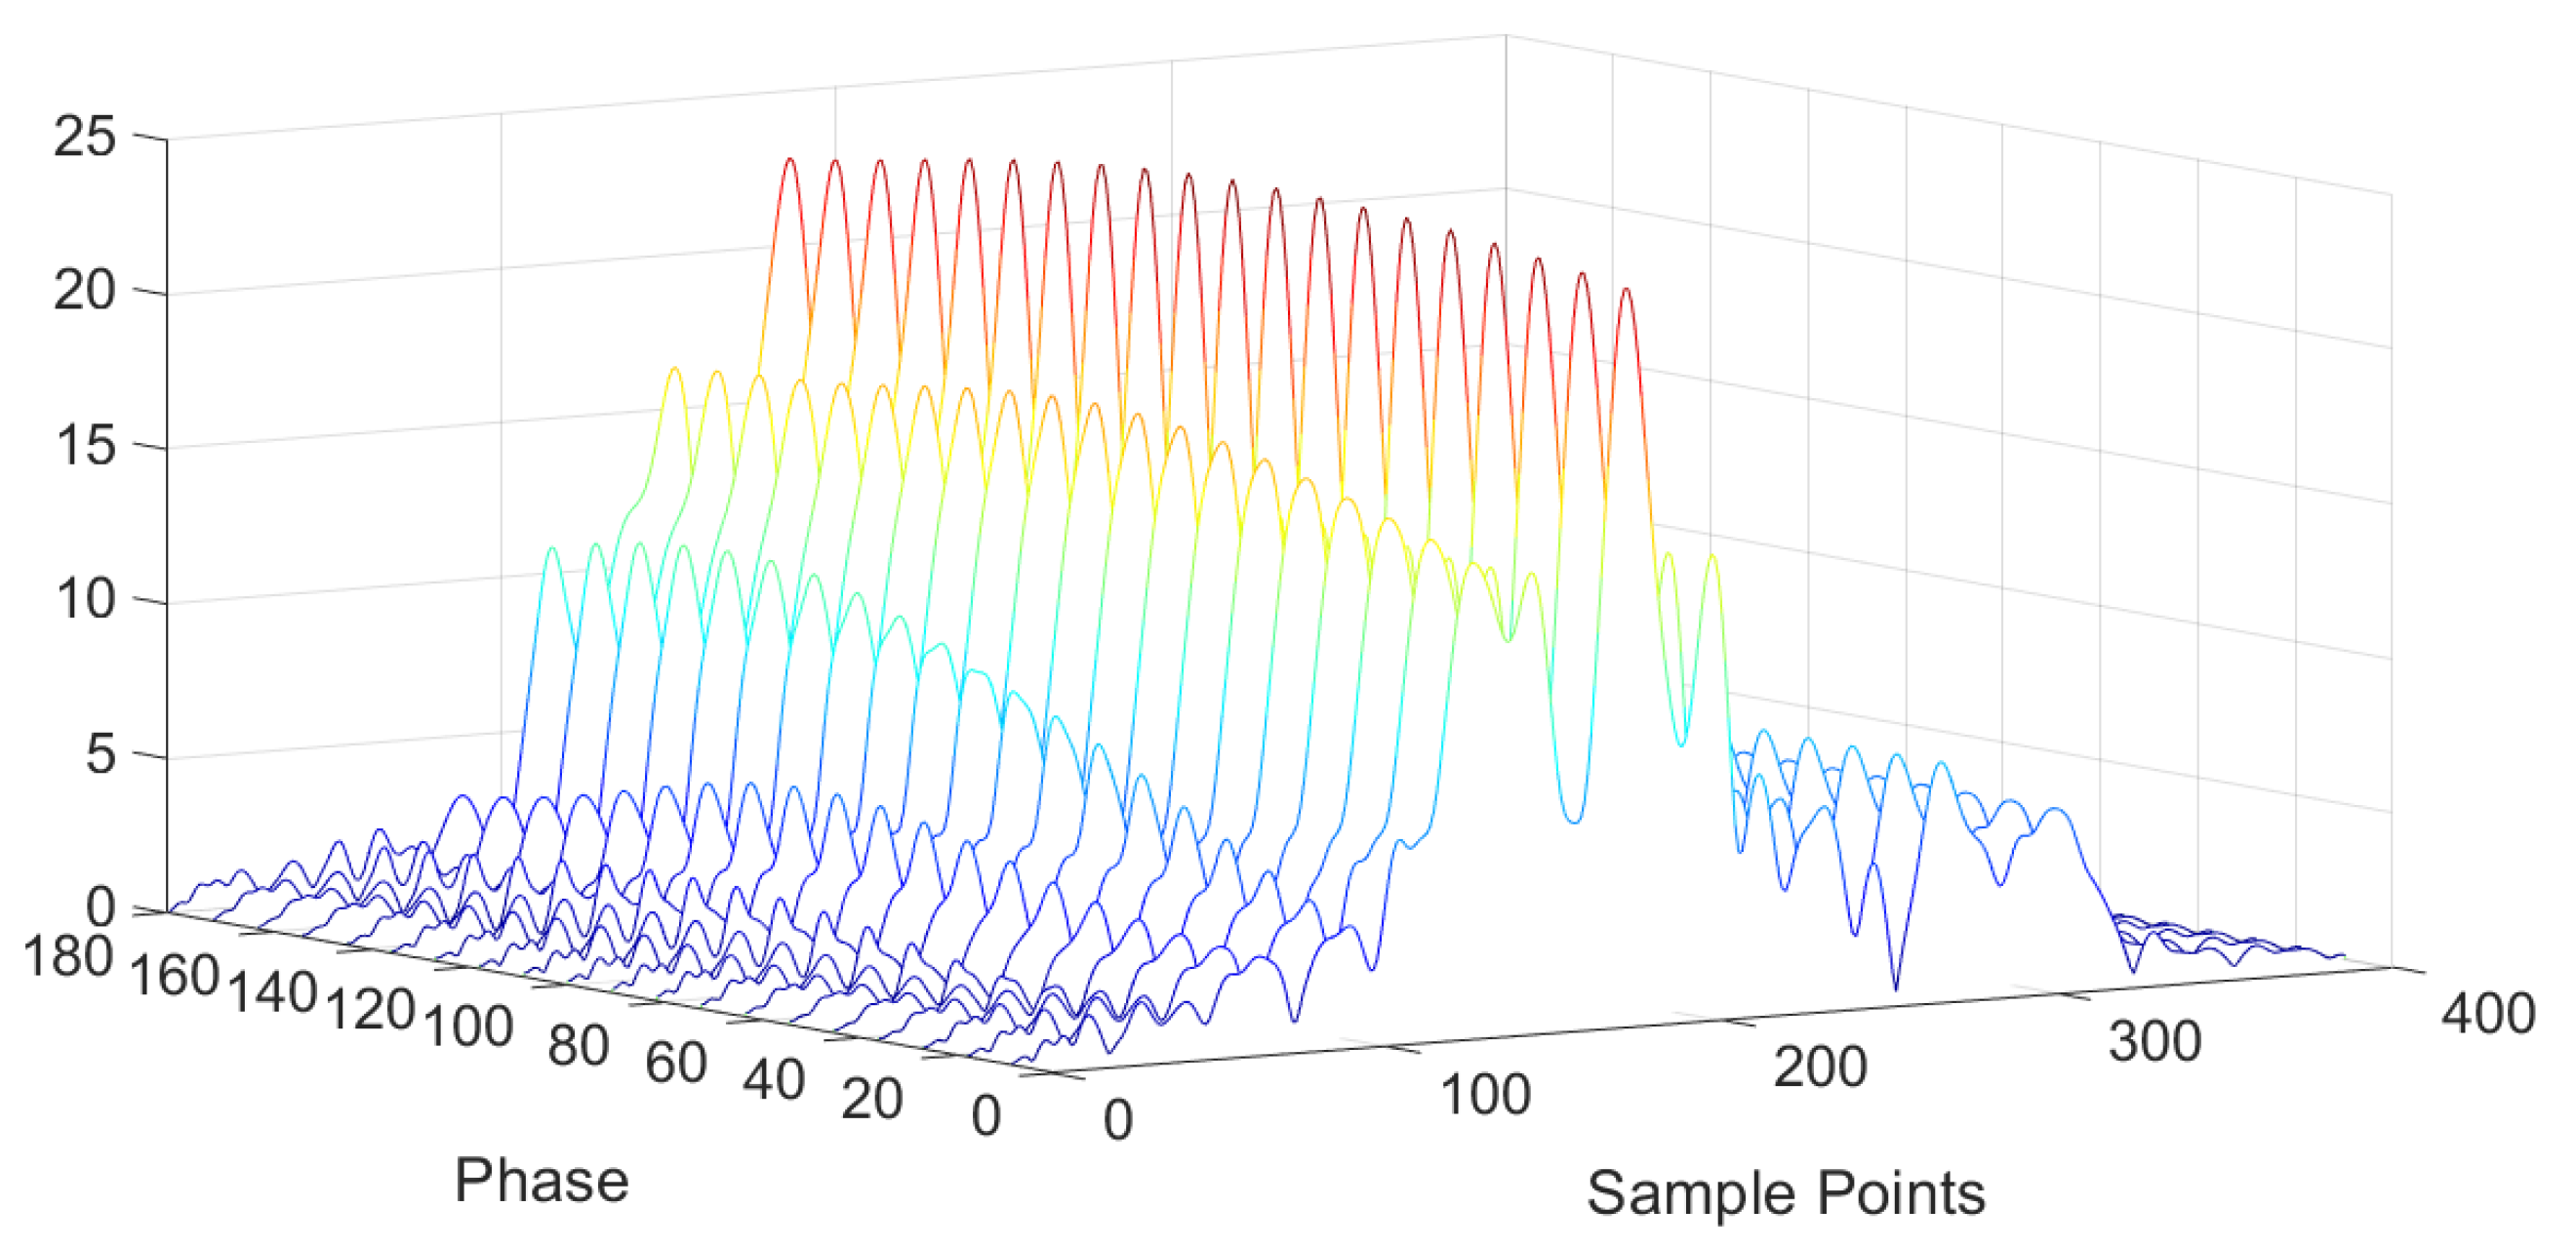
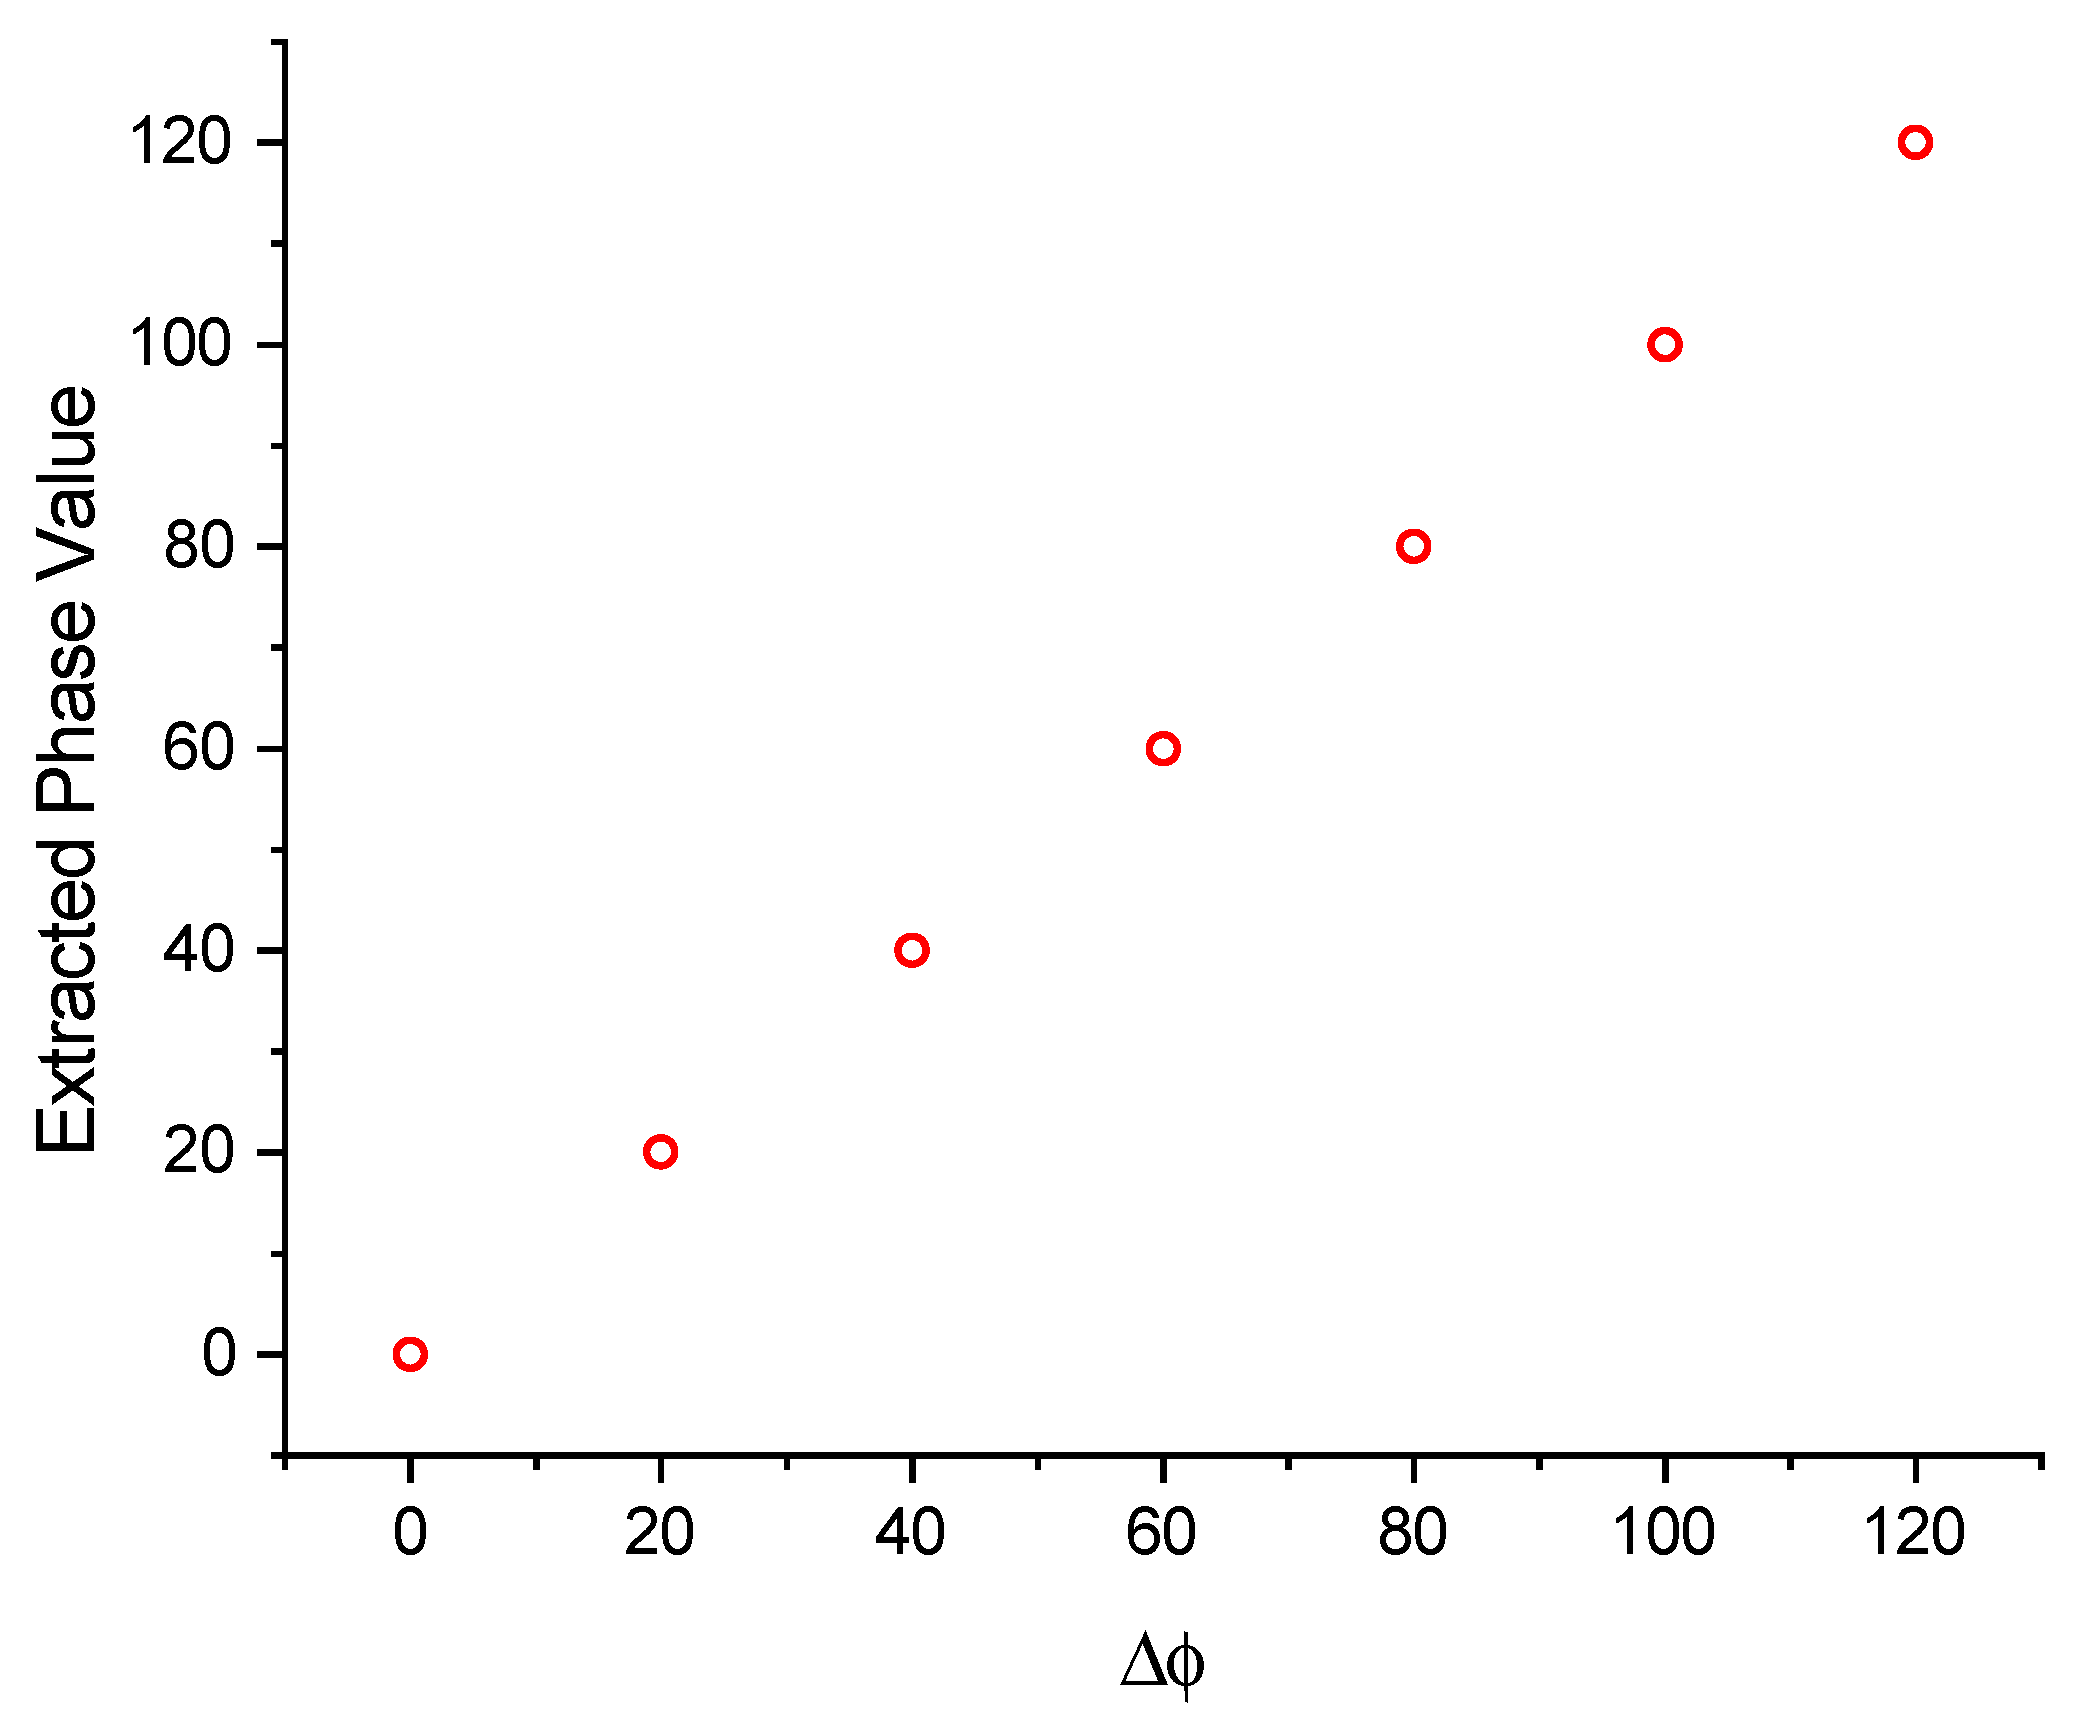
3.3. Extended Matched Filter Algorithm for Extraction
4. Results and Discussion
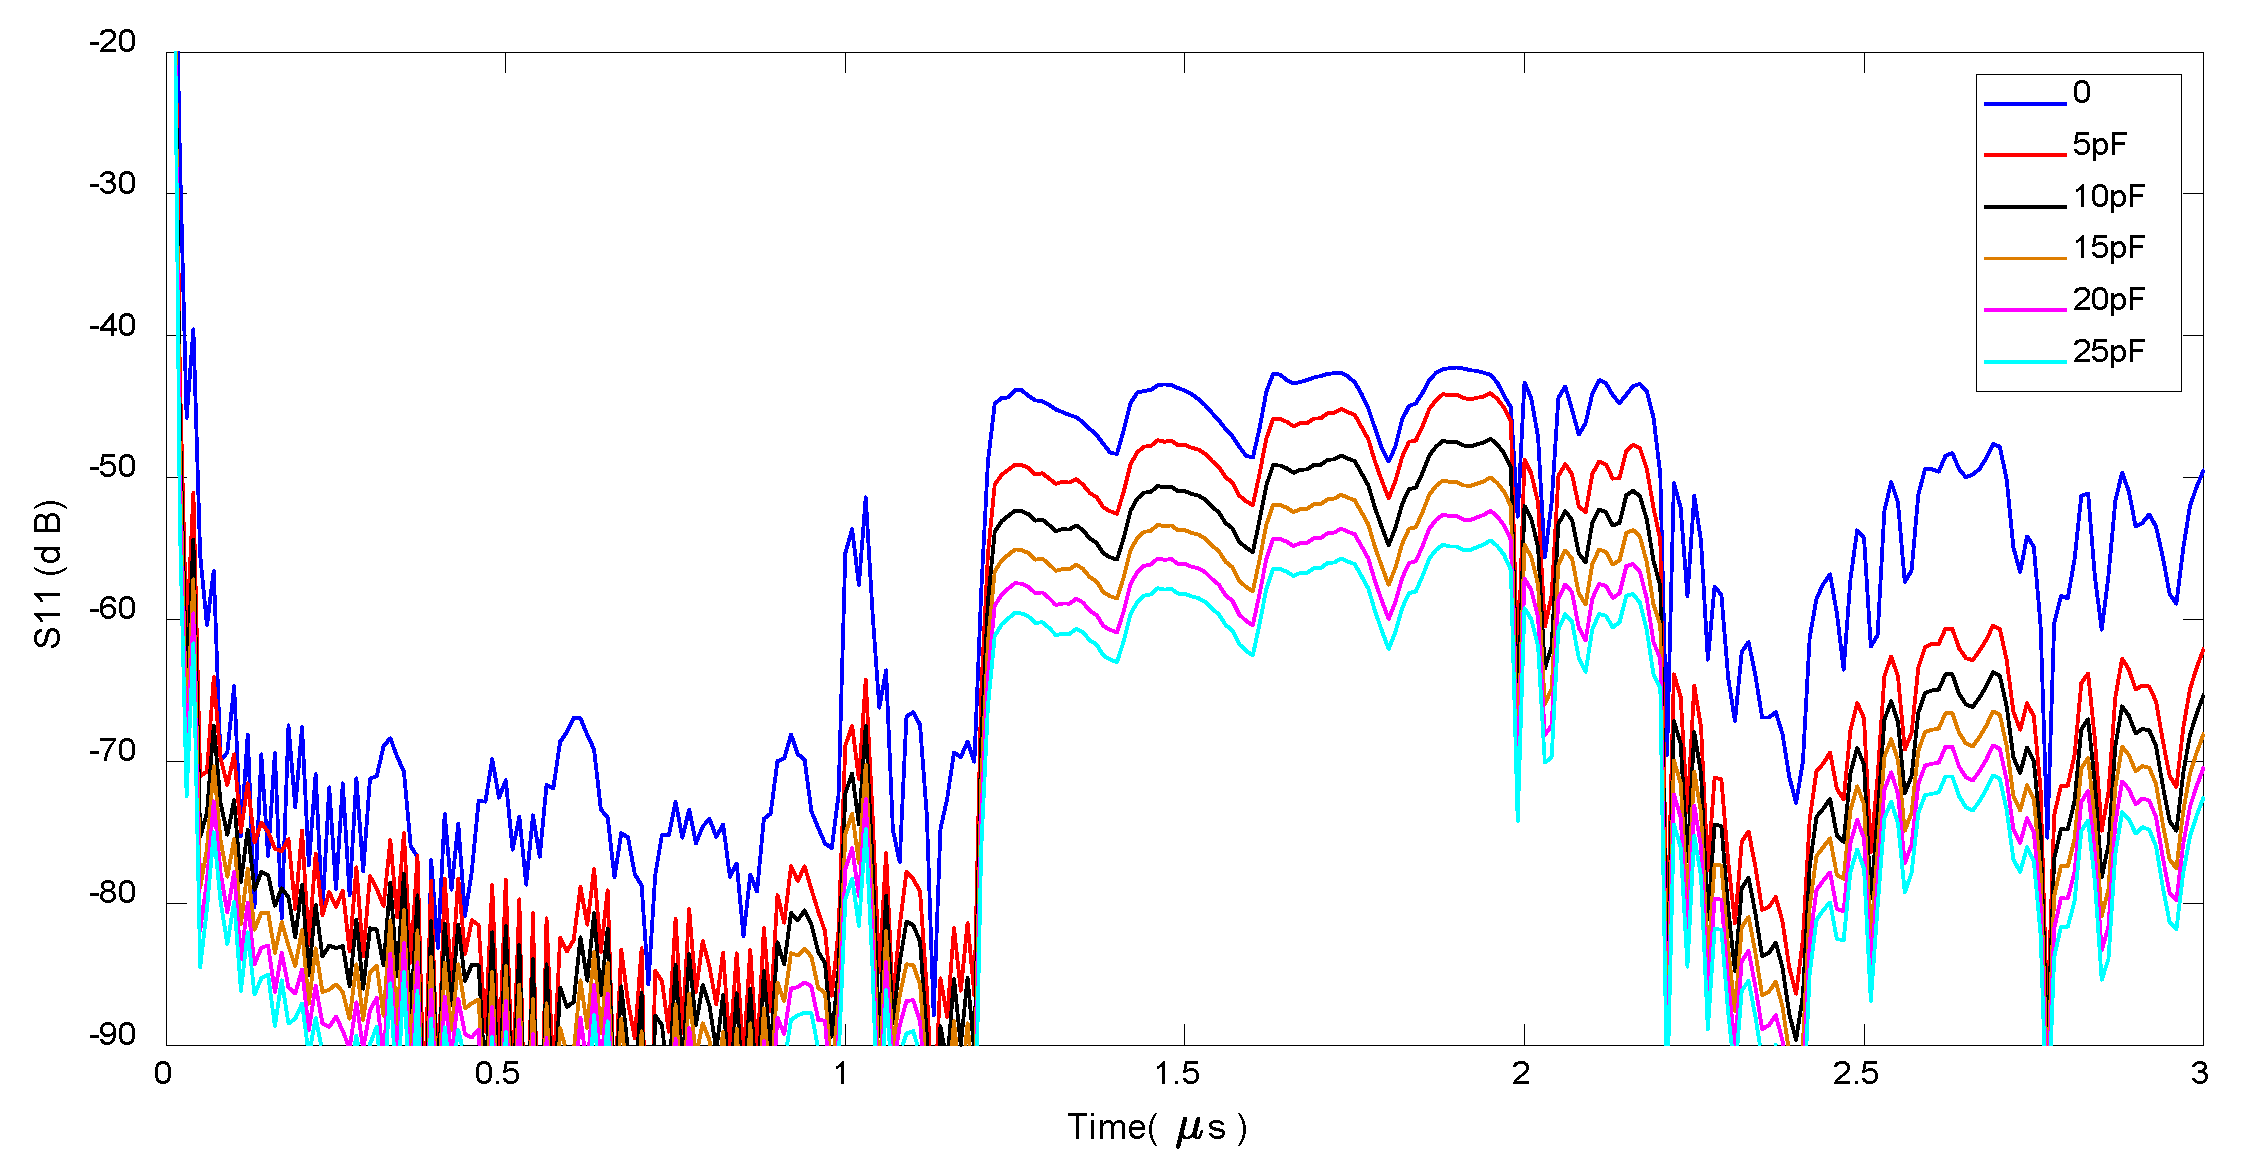
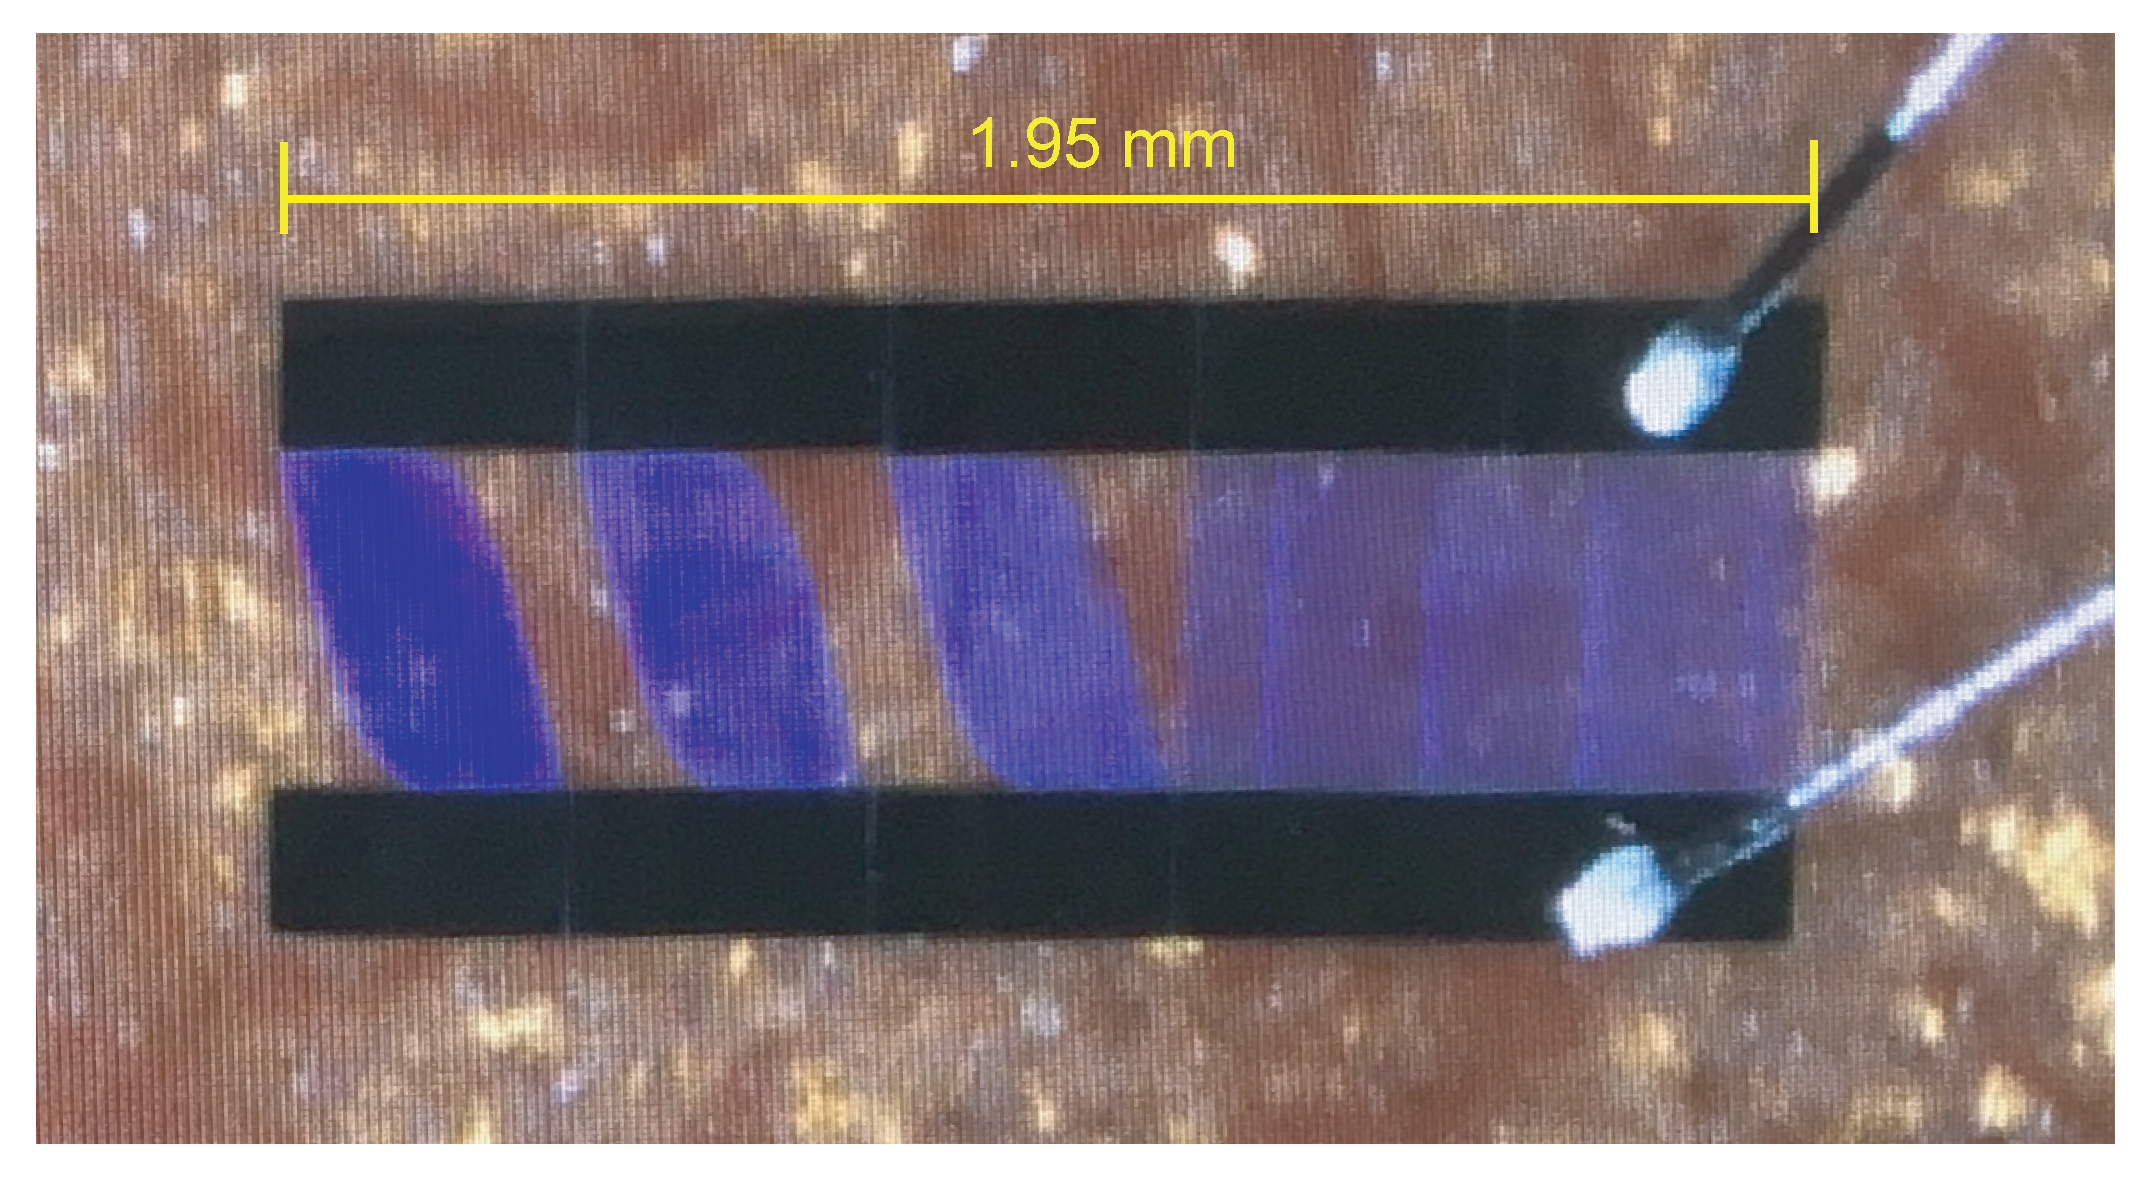
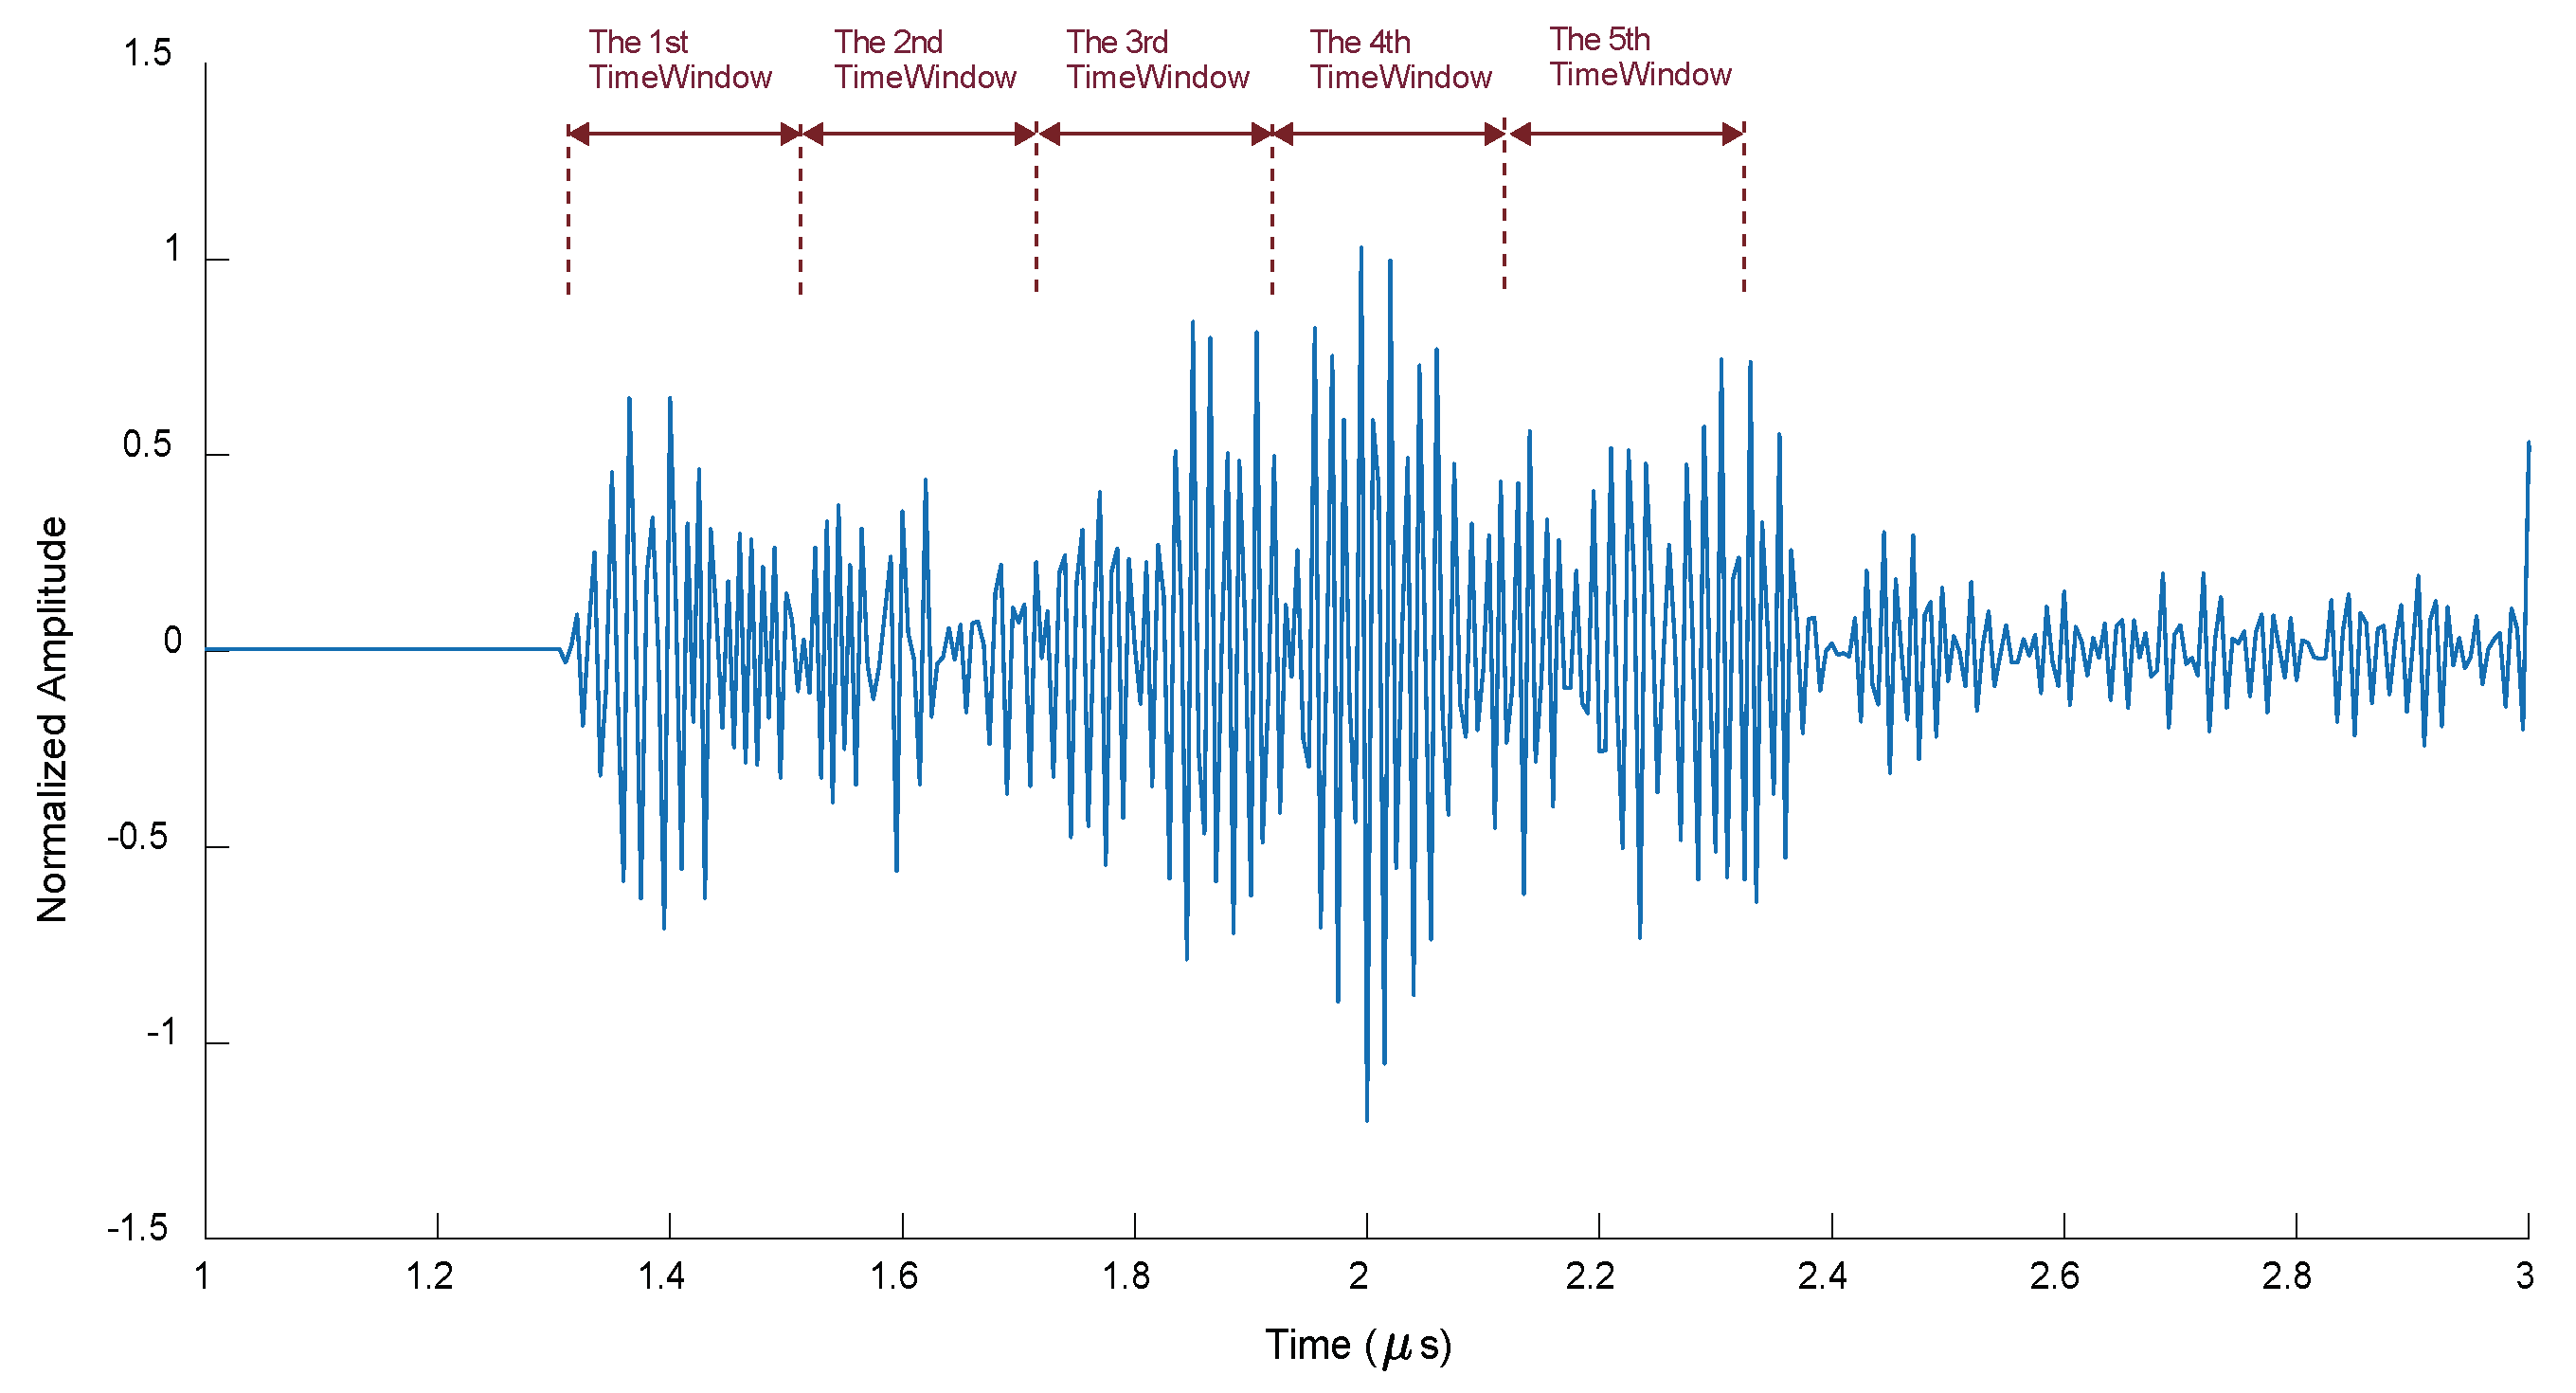
4.1. Impulse Response of the Impedance-Loaded OFC SAW Sensor
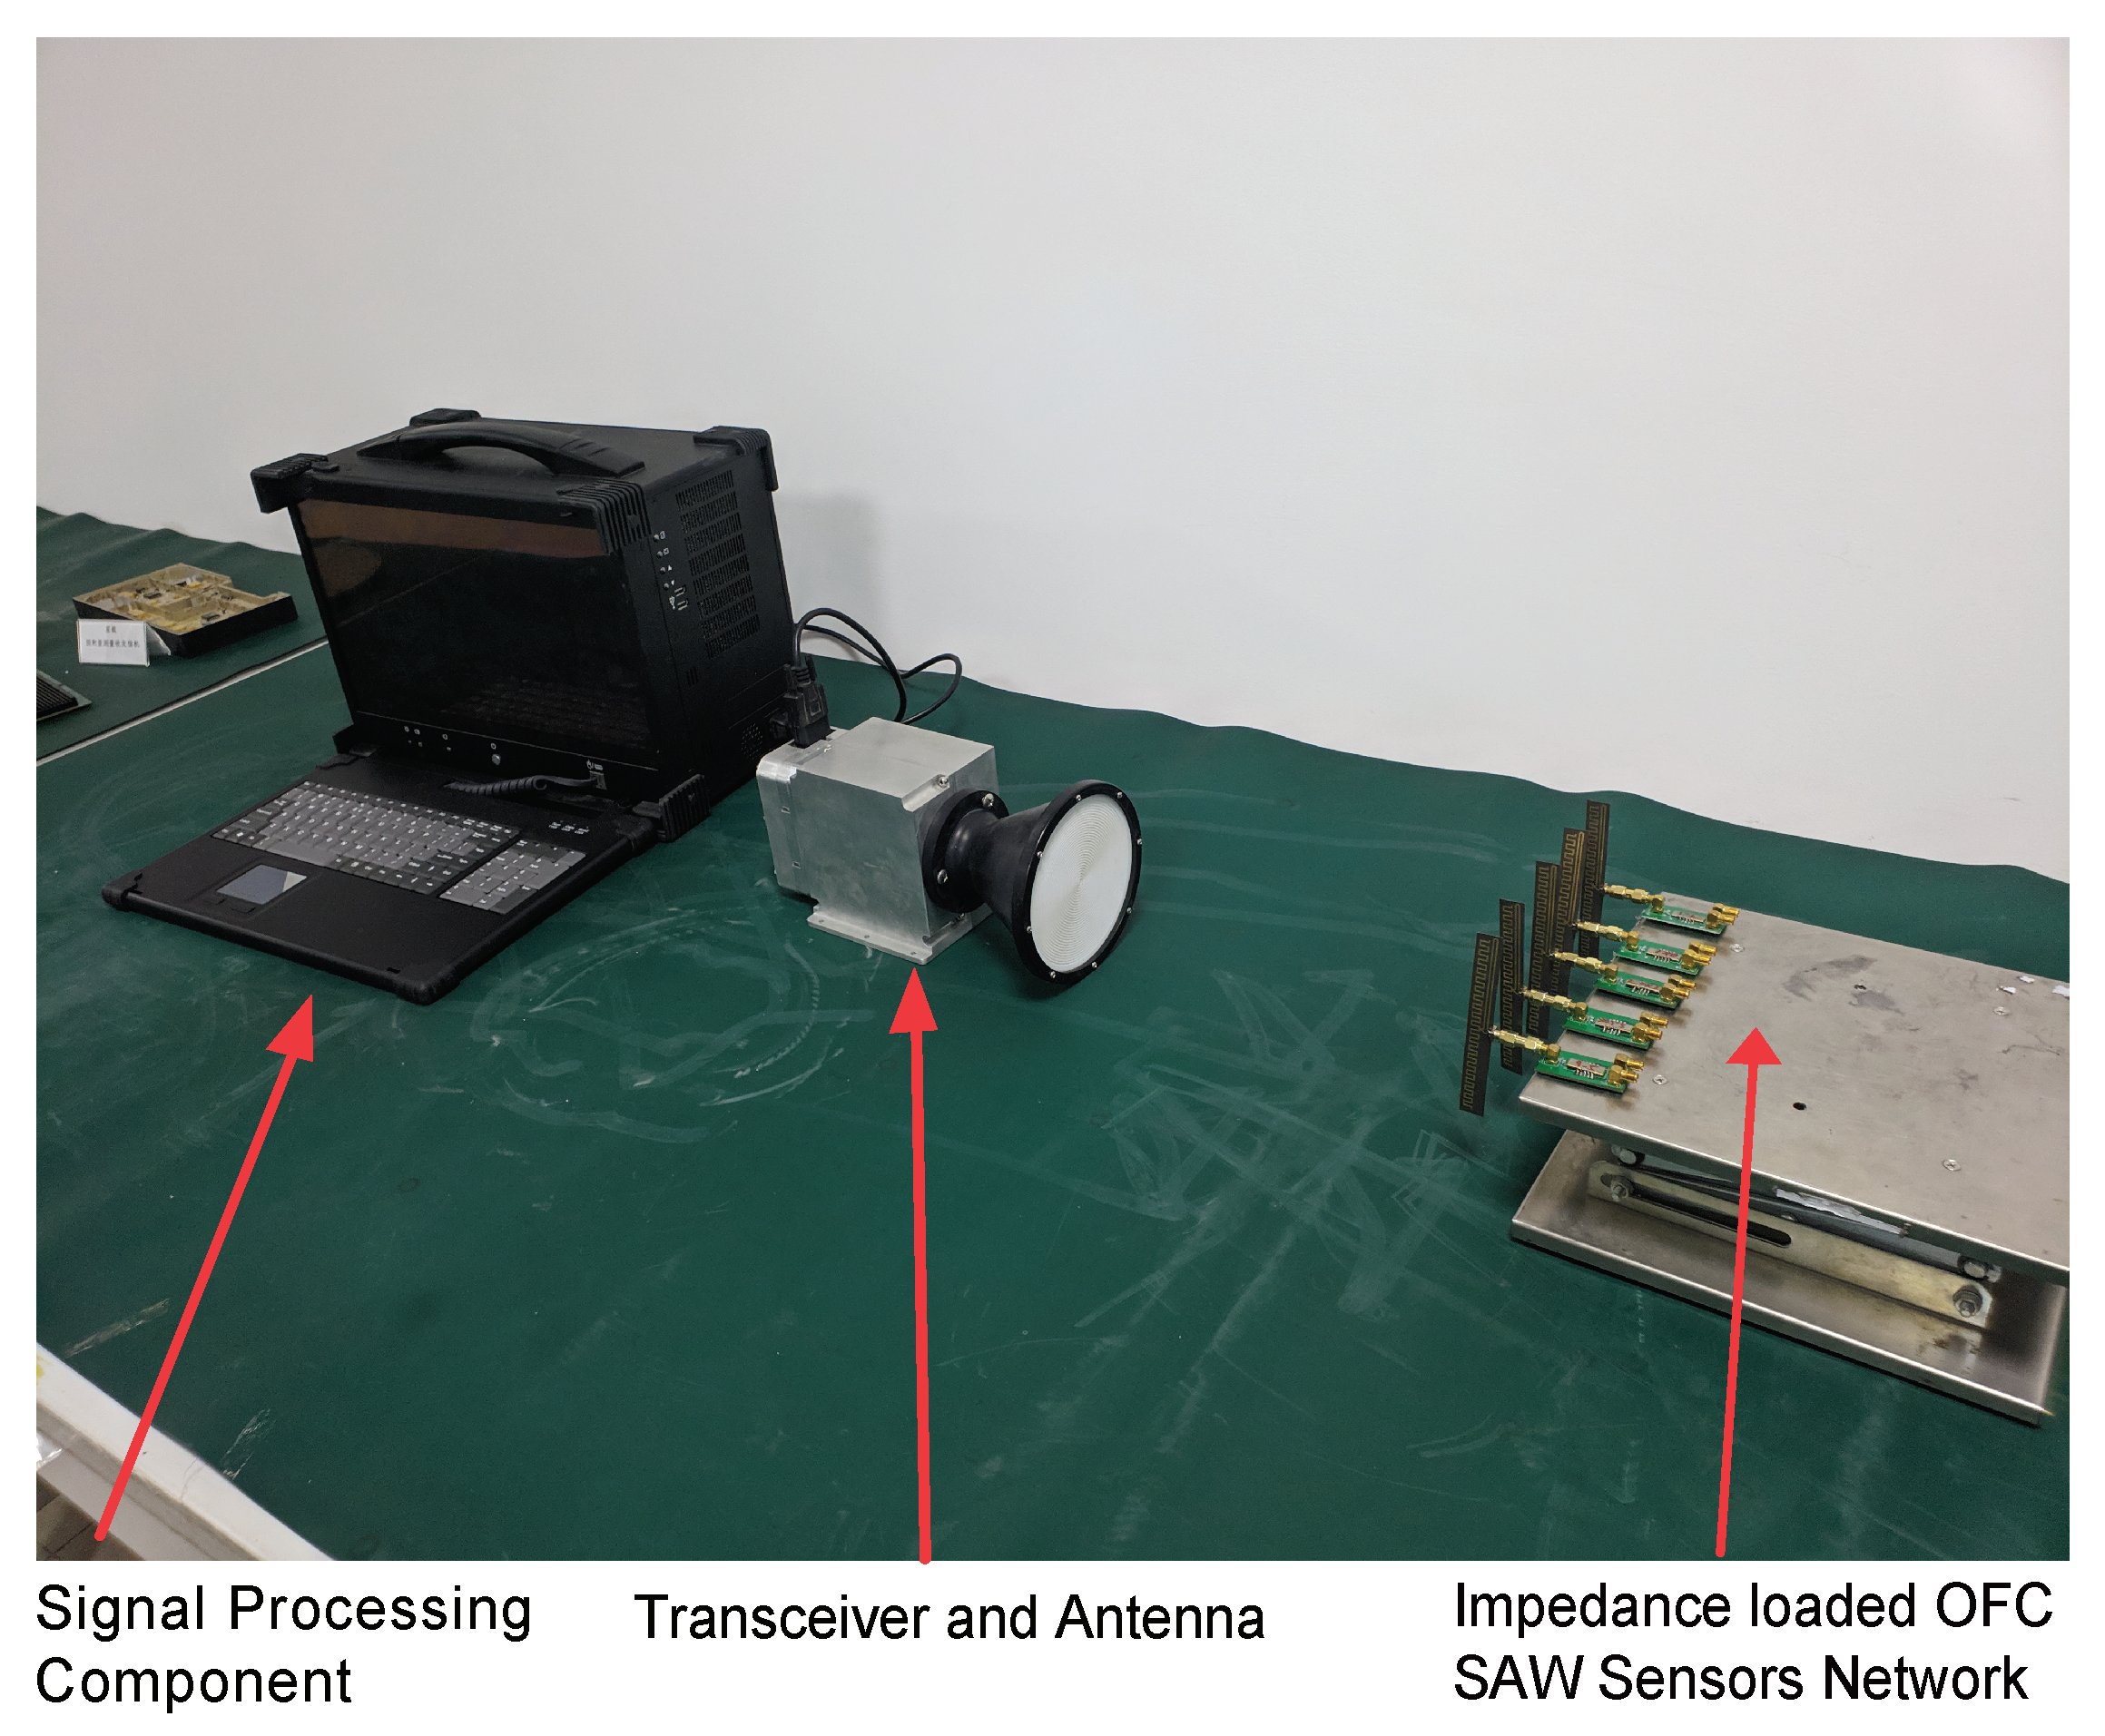
4.2. Instrumentation and Experimental Setup
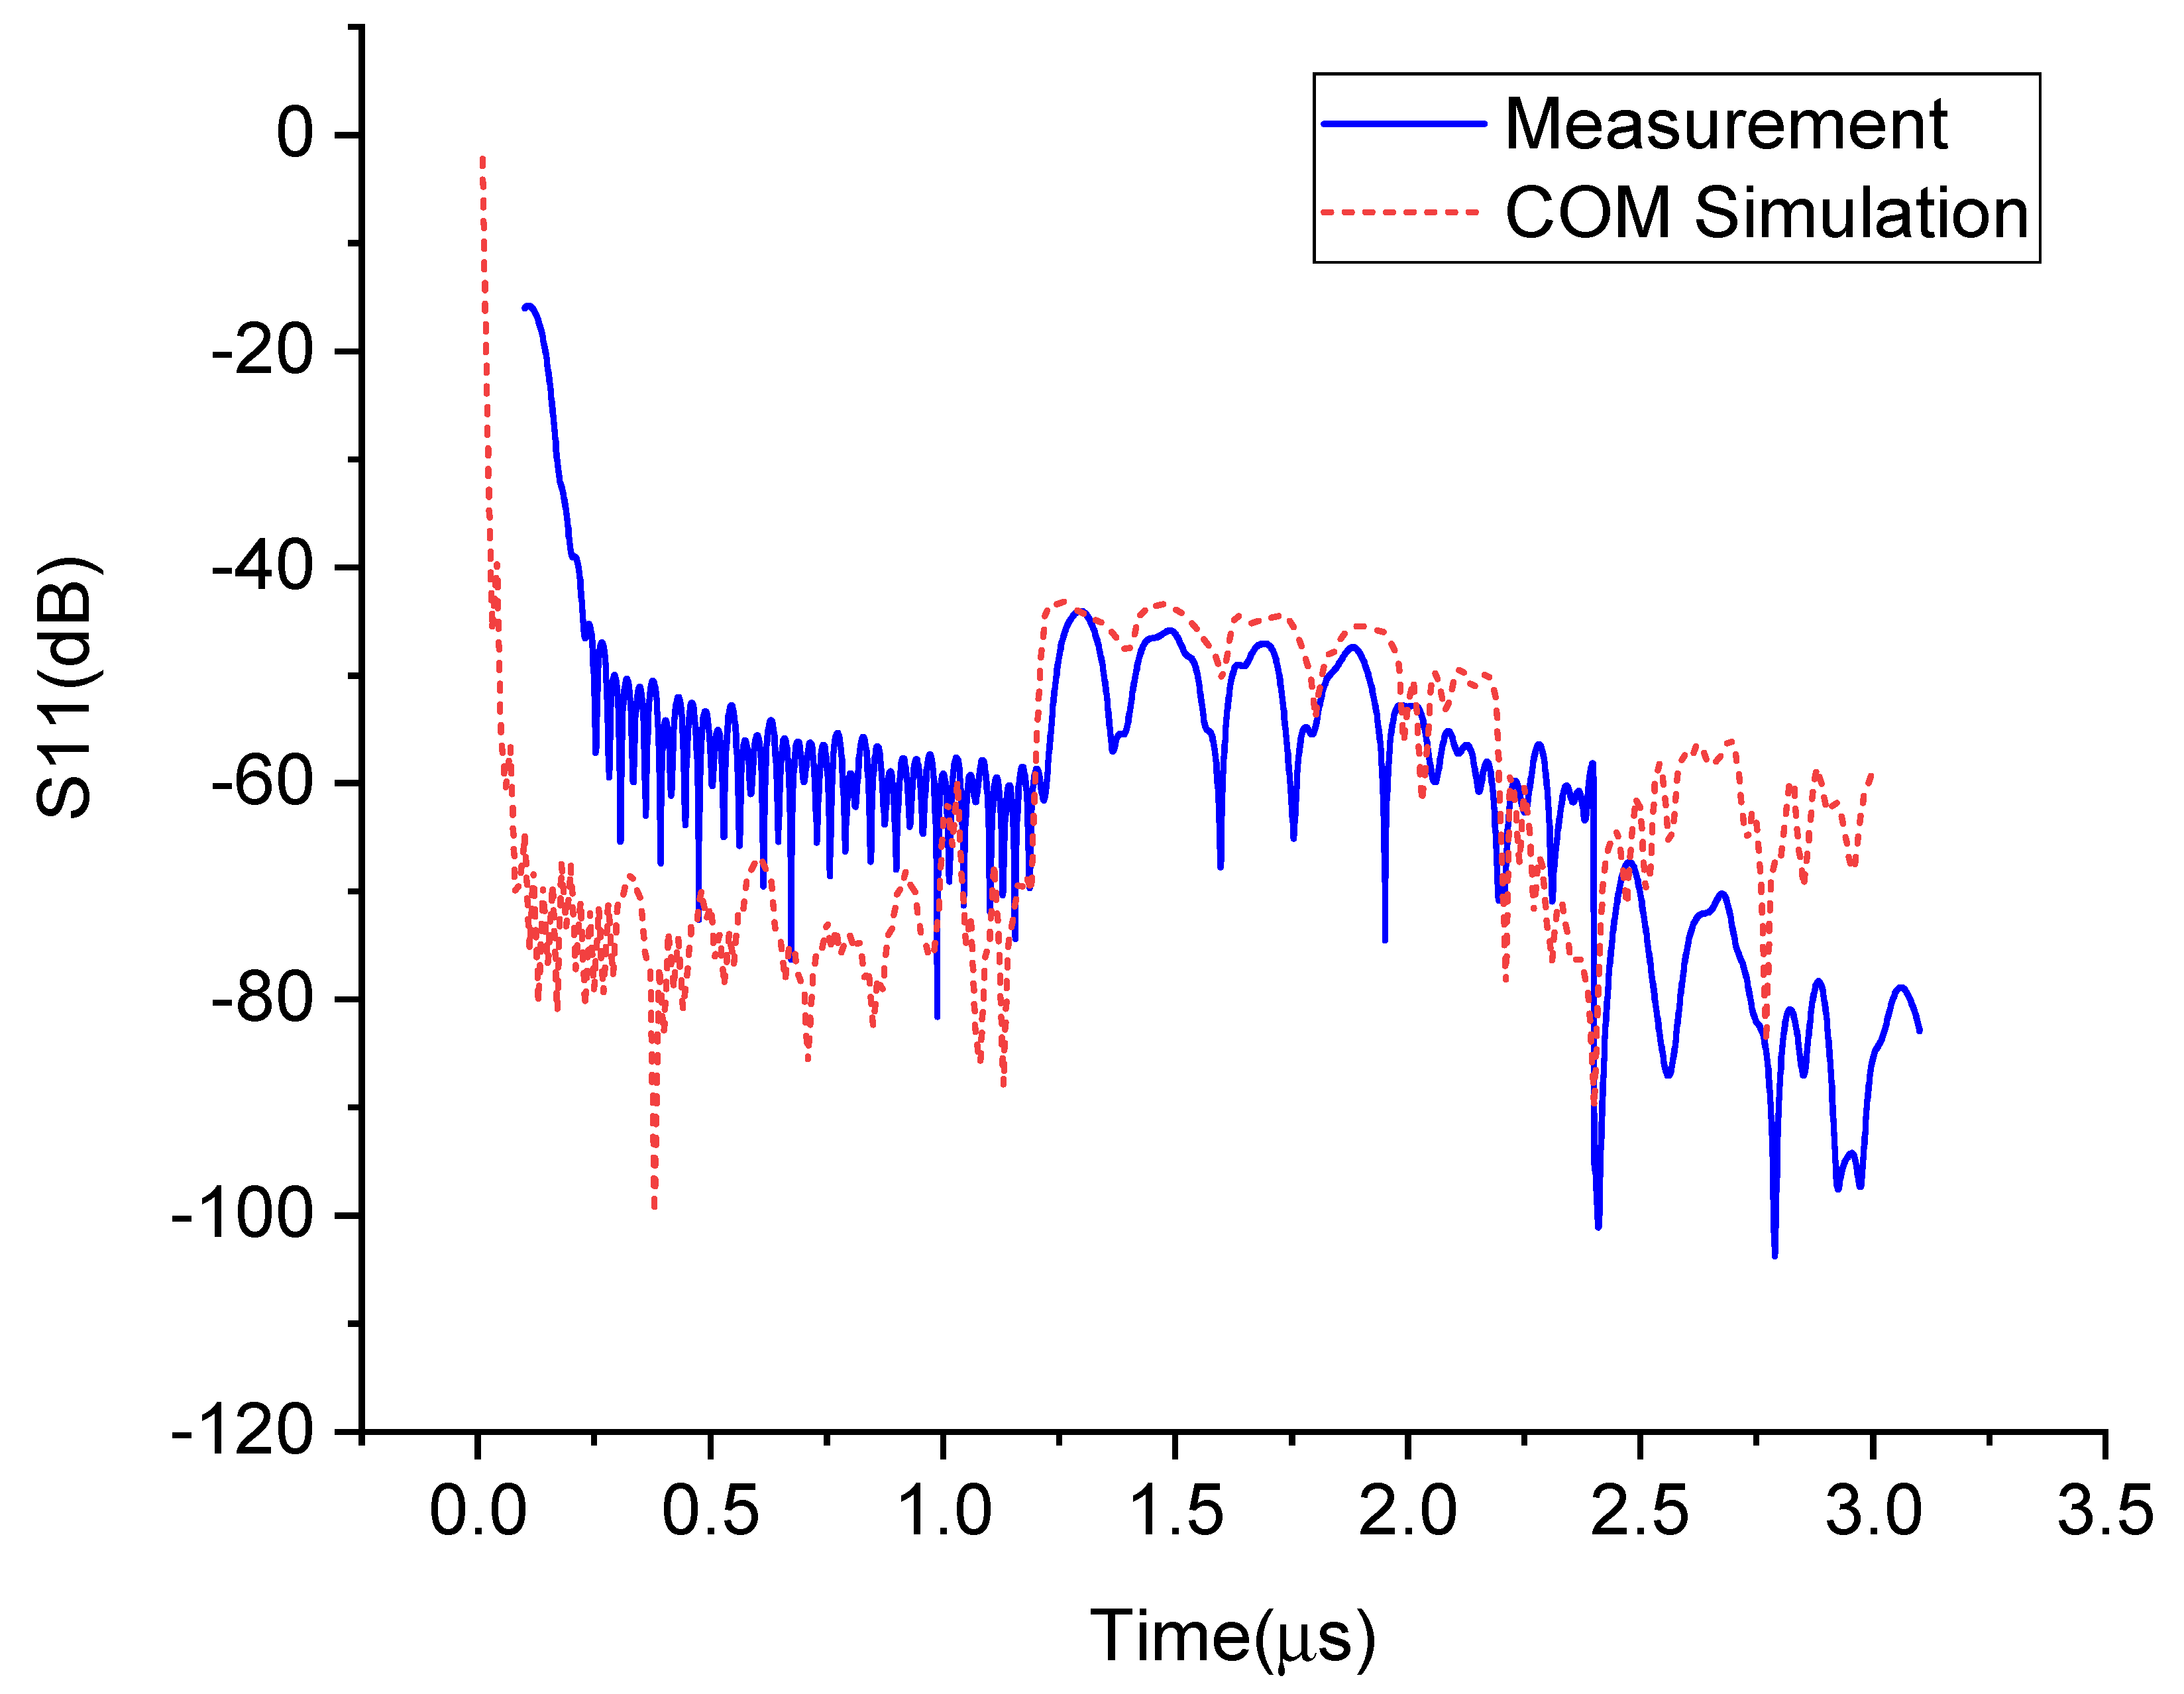
4.3. Analysis
5. Conclusions
Author Contributions
Funding
Conflicts of Interest
References
- Mohammed, A.; Khairulmizam, S.; Fakhrul, R.; Mohd, R. Wireless sensor network for structural health monitoring: A contemporary review of technologies, challenges, and future direction. Struct. Health Monit. 2019, 1–43. [Google Scholar]
- Di Sante, R. Fibre Optic Sensors for Structural Health Monitoring of Aircraft Composite Structures: Recent Advances and Applications. Sensors 2015, 15, 18666–18713. [Google Scholar] [CrossRef] [PubMed]
- Qiu, L.; Yuan, S.; Zhang, X.; Wang, Y. A time reversal focusing based impact imaging method and its evaluation on complex composite structures. Smart Mater. Struct. 2011, 20, 105014:1–105014:11. [Google Scholar] [CrossRef]
- Wang, S.; Xu, C.; Pan, X.; Wei, B. Design and Application of High Precision Differential SAW Sensor. In Proceedings of the International Conference on Computer Technology, Electronics and Communication, Dalian, China, 19–21 December 2017; pp. 890–893. [Google Scholar]
- Weigel, R.; Lurz, F.; Lindner, S.; Mann, S.; Linz, S.; Koelpin, A. A fast and precise Six-Port-based IFM technique for wireless resonant SAW sensing. In Proceedings of the IEEE International Ultrasonics Symposium, Tours, France, 18–21 September 2016. [Google Scholar]
- Stroganov, K.; Kronidov, T.; Luylin, B.; Kalinin, V.; Plessky, V. SAW temperature sensors for electric power transmission lines. In Proceedings of the 2014 European Frequency and Time Forum (EFTF), Neuchatel, Switzerland, 23–26 June 2014; pp. 157–159. [Google Scholar]
- Hagelauer, A.; Ussmueller, T.; Weigel, R. SAW and CMOS RFID transponder-based wireless systems and their applications. In Proceedings of the IEEE International Frequency Control Symposium Proceedings, Baltimore, MD, USA, 21–24 May 2012. [Google Scholar]
- Hines, J.H. Review of recent passive wireless SAW sensor and sensor-tag activity. In Proceedings of the 4th Annual Caneus Fly by Wireless Workshop, Montreal, QC, Canada, 14–17 June 2011. [Google Scholar]
- Pereira da Cunha, M.; Lad, R.J.; Davulis, P.; Canabal, A. Wireless acoustic wave sensors and systems for harsh environment applications. In Proceedings of the IEEE Topical Conference on Wireless Sensors and Sensor Networks, Phoenix, AZ, USA, 16–19 January 2011. [Google Scholar]
- Gallagher, M.W.; Santos, B.C.; Malocha, D.C. Integrated 915MHZ OFC SAW sensors. In Proceedings of the IEEE 11th Annual Wireless and Microwave Technology Conference, Melbourne, FL, USA, 12–13 April 2010. [Google Scholar]
- Plessky, V.P.; Reindl, L.M. Review on SAW RFID tags. IEEE Trans. Ultrason. Ferroelectr. Freq. Control 2010, 57, 654–668. [Google Scholar] [CrossRef]
- DiGiampaolo, E.; DiCarlofelice, A.; Gregori, A. An RFID-Enabled Wireless Strain Gauge Sensor for static and dynamic structural monitoring. IEEE Sens. J. 2017, 17, 286–294. [Google Scholar] [CrossRef]
- Amedeo, G.; Emidio, G.; Alessandro, D.; Chiara, C. Presenting a New Wireless Strain Method for Structural Monitoring: Experimental Validation. J. Sens. 2019, 2019, 5370838. [Google Scholar]
- D’Alessandro, A.; Scudero, S.; Vitale, G. A Review of the Capacitive MEMS for Seismology. Sensors 2019, 19, 3093. [Google Scholar] [CrossRef]
- Chen, Y.; Tee, B.; Chortos, L. Continuous wireless pressure monitoring and mapping with ultra-small passive sensors for health monitoring and critical care. Nat. Commun. 2014, 5, 5028. [Google Scholar] [CrossRef]
- Reindl, L.; Scholl, G.; Ostertag, T.; Scherr, H.; Wol, U.; Schmidt, F. Theory and application of passive SAW radio transponders as sensors. IEEE Trans. Ultrason. Ferroelectr. Freq. Control 1998, 45, 1281–1292. [Google Scholar] [CrossRef]
- Bulst, W.; Fischerauer, G.; Reindl, L. State of the art in wireless sensing with surface acoustic waves. IEEE Trans. Ind. Electron. 2001, 48, 265–271. [Google Scholar] [CrossRef]
- Wilson, W.C.; Douglas, M.; Fisher, B.H.; Malocha, D.C.; Atkinson, G.M. Fastener Failure Detection Using a Surface Acoustic Wave Strain Sensor. IEEE Sens. J. 2012, 12, 1993–2000. [Google Scholar] [CrossRef]
- Schimetta, G.; Dollinger, F.; Weigel, R. A wireless pressure-measurement system using a SAW hybrid sensor. IEEE Trans. Microw. Theory Tech. 2000, 48, 2730–2735. [Google Scholar] [CrossRef]
- Binder, A.; Bruckner, G.; Schobernig, N.; Schmitt, D. Wireless Surface Acoustic Wave Pressure and Temperature Sensor With Unique Identification Based on rmLiNbO3. IEEE Sens. J. 2013, 13, 1801–1805. [Google Scholar] [CrossRef]
- Donohoe, B.; Geraghty, D.; O’Donnell, G.E. Wireless Calibration of a Surface Acoustic Wave Resonator as a Strain Sensor. IEEE Sens. J. 2011, 11, 1026–1032. [Google Scholar] [CrossRef]
- Perry, M.; McKeeman, I.; Saafi, M.; Niewczas, P. Wireless surface acoustic wave sensors for displacement and crack monitoring in concrete structures. Smart Mater. Struct. 2016, 25, 035035:1–035035:9. [Google Scholar] [CrossRef]
- Pohl, A. A review of wireless SAW sensors. IEEE Trans. Ultrason. Ferroelectr. Freq. Control 2000, 47, 317–332. [Google Scholar] [CrossRef]
- Steindl, R.; Pohl, A.; Seifert, F. Impedance loaded SAW sensors offer a wide range of measurement opportunities. IEEE Trans. Microw. Theory Tech. 1999, 47, 2625–2629. [Google Scholar] [CrossRef]
- Luo, W.; Fu, Q.Y.; Wang, J.L.; Wang, Y.; Zhou, D.X. Theoretical Analysis of Wireless Passive Impedance-Loaded SAW Sensors. IEEE Sens. J. 2009, 9, 1778–1783. [Google Scholar] [CrossRef]
- Fu, Q.; Stab, H.; Fischer, W.J. Investigation of single-finger interdigital transducer as programmable reflector. IEEE Int. Ultrason. Symp. 2004, 3, 2000–2003. [Google Scholar]
- Chernenko, D.; Zhovnir, M.; Tsyganok, B.; Oliinyk, O. Wireless passive pressure sensor using frequency coded SAW structures. In Proceedings of the 35th International Spring Seminar on Electronics Technology, Bad Aussee, Austria, 9–13 May 2012; pp. 424–428. [Google Scholar]
- Humphries, J.R.; Malocha, D.C. Wireless SAW Strain Sensor Using Orthogonal Frequency Coding. IEEE Sens. J. 2015, 15, 5527–5534. [Google Scholar] [CrossRef]
- Malocha, D.C.; Gallagher, M.; Fisher, B.; Humphries, J.; Gallagher, D.; Kozlovski, N. A Passive Wireless Multi-Sensor SAW Technology Device and System Perspectives. Sensors 2013, 13, 5897–5922. [Google Scholar] [CrossRef] [PubMed]
- Gallagher, M.; Malocha, D.C. Mixed orthogonal frequency coded SAW RFID tags. IEEE Trans. Ultrason. Ferroelectr. Freq. Control 2013, 60, 596–602. [Google Scholar] [CrossRef] [PubMed]
- Puccio, D.; Malocha, D.C.; Gallagher, D.; Hines, J. SAW sensors using orthogonal frequency coding. In Proceedings of the IEEE International Frequency Control Symposium and Exposition, Montreal, QC, Canada, 23–27 August 2004; pp. 307–310. [Google Scholar]
- Plessky, V.; Koskela, J. Coupling-of-modes analysis of saw devices. Int. J. High Speed Electron. Syst. 2000, 10, 867–947. [Google Scholar] [CrossRef]
- Reindl, L.; Ruile, W. Programmable Reflectors for SAW-ID-Tags. In Proceedings of the IEEE Ultrasonics Symposium, Baltimore, MD, USA, 31 October–3 November 1993. [Google Scholar]


| Tradition OFC SAW | Impedance-Loaded OFC SAW | |
|---|---|---|
| Type of sensor operations | limited to one application | system and application dependent only practical limit |
| Simultaneous identification capability | practical measured results reduce the number within 16 | identifiable tags is equivalent to factorial of chip number |
© 2020 by the authors. Licensee MDPI, Basel, Switzerland. This article is an open access article distributed under the terms and conditions of the Creative Commons Attribution (CC BY) license (http://creativecommons.org/licenses/by/4.0/).
Share and Cite
Dai, X.; Fang, L.; Zhang, C.; Sun, H. An Impedance-Loaded Orthogonal Frequency-Coded SAW Sensor for Passive Wireless Sensor Networks. Sensors 2020, 20, 1876. https://doi.org/10.3390/s20071876
Dai X, Fang L, Zhang C, Sun H. An Impedance-Loaded Orthogonal Frequency-Coded SAW Sensor for Passive Wireless Sensor Networks. Sensors. 2020; 20(7):1876. https://doi.org/10.3390/s20071876
Chicago/Turabian StyleDai, Xuan, Lili Fang, Chuanfang Zhang, and Houjun Sun. 2020. "An Impedance-Loaded Orthogonal Frequency-Coded SAW Sensor for Passive Wireless Sensor Networks" Sensors 20, no. 7: 1876. https://doi.org/10.3390/s20071876
APA StyleDai, X., Fang, L., Zhang, C., & Sun, H. (2020). An Impedance-Loaded Orthogonal Frequency-Coded SAW Sensor for Passive Wireless Sensor Networks. Sensors, 20(7), 1876. https://doi.org/10.3390/s20071876