Comparison between Linear and Branched Polyethylenimine and Reduced Graphene Oxide Coatings as a Capture Layer for Micro Resonant CO2 Gas Concentration Sensors


Abstract
1. Introduction
2. Materials and Methods
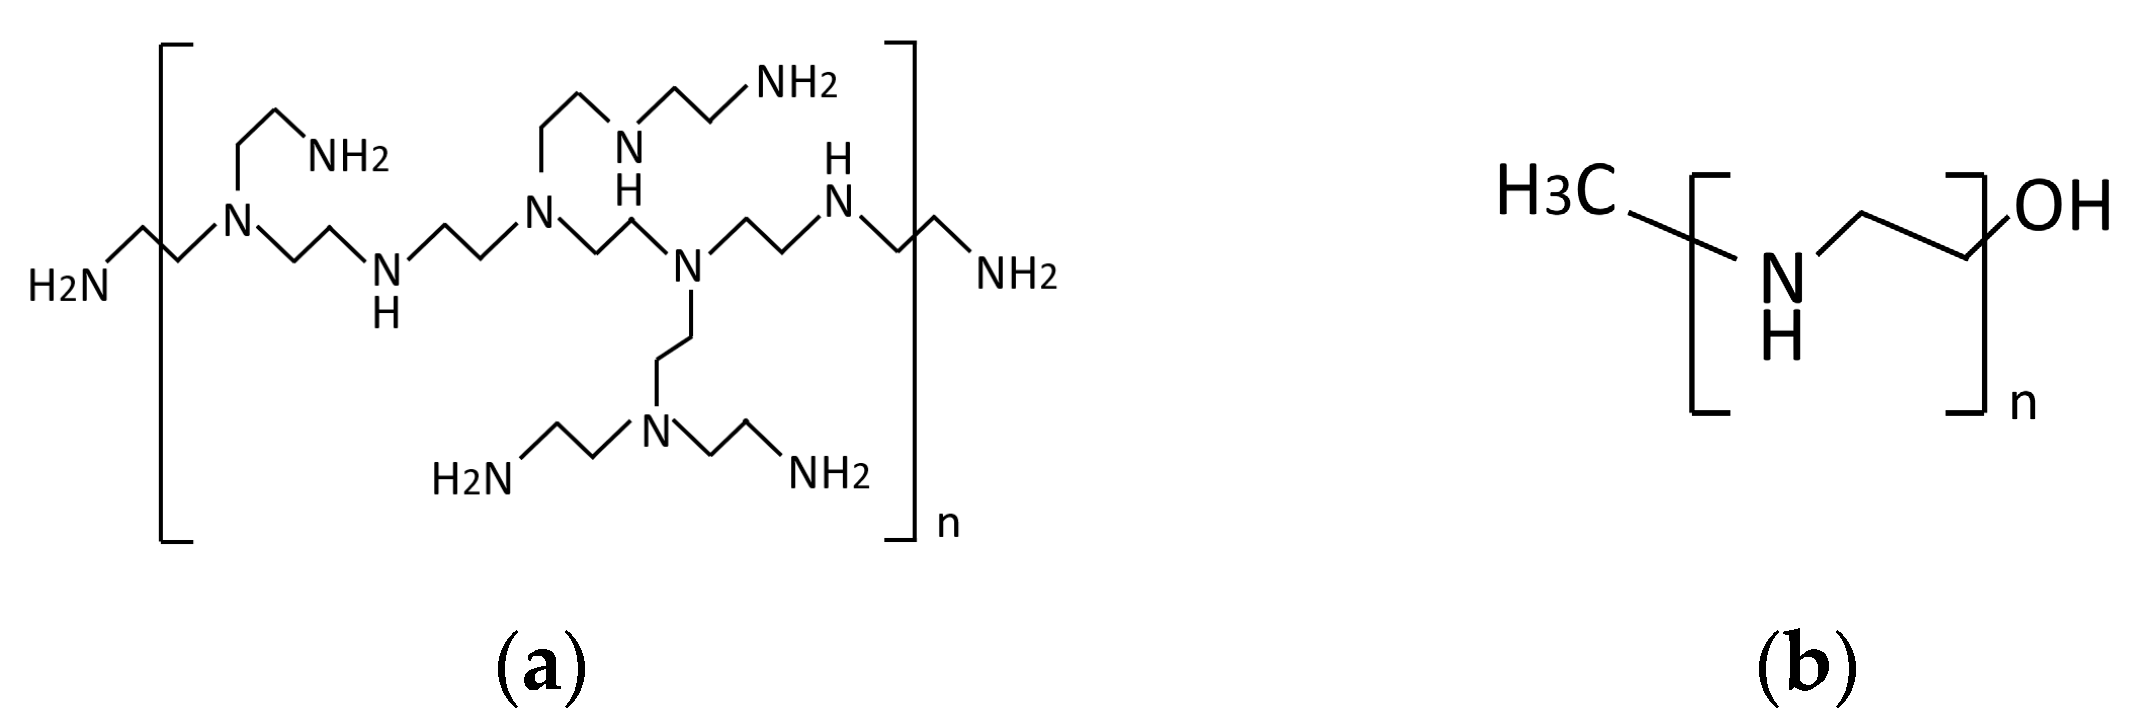
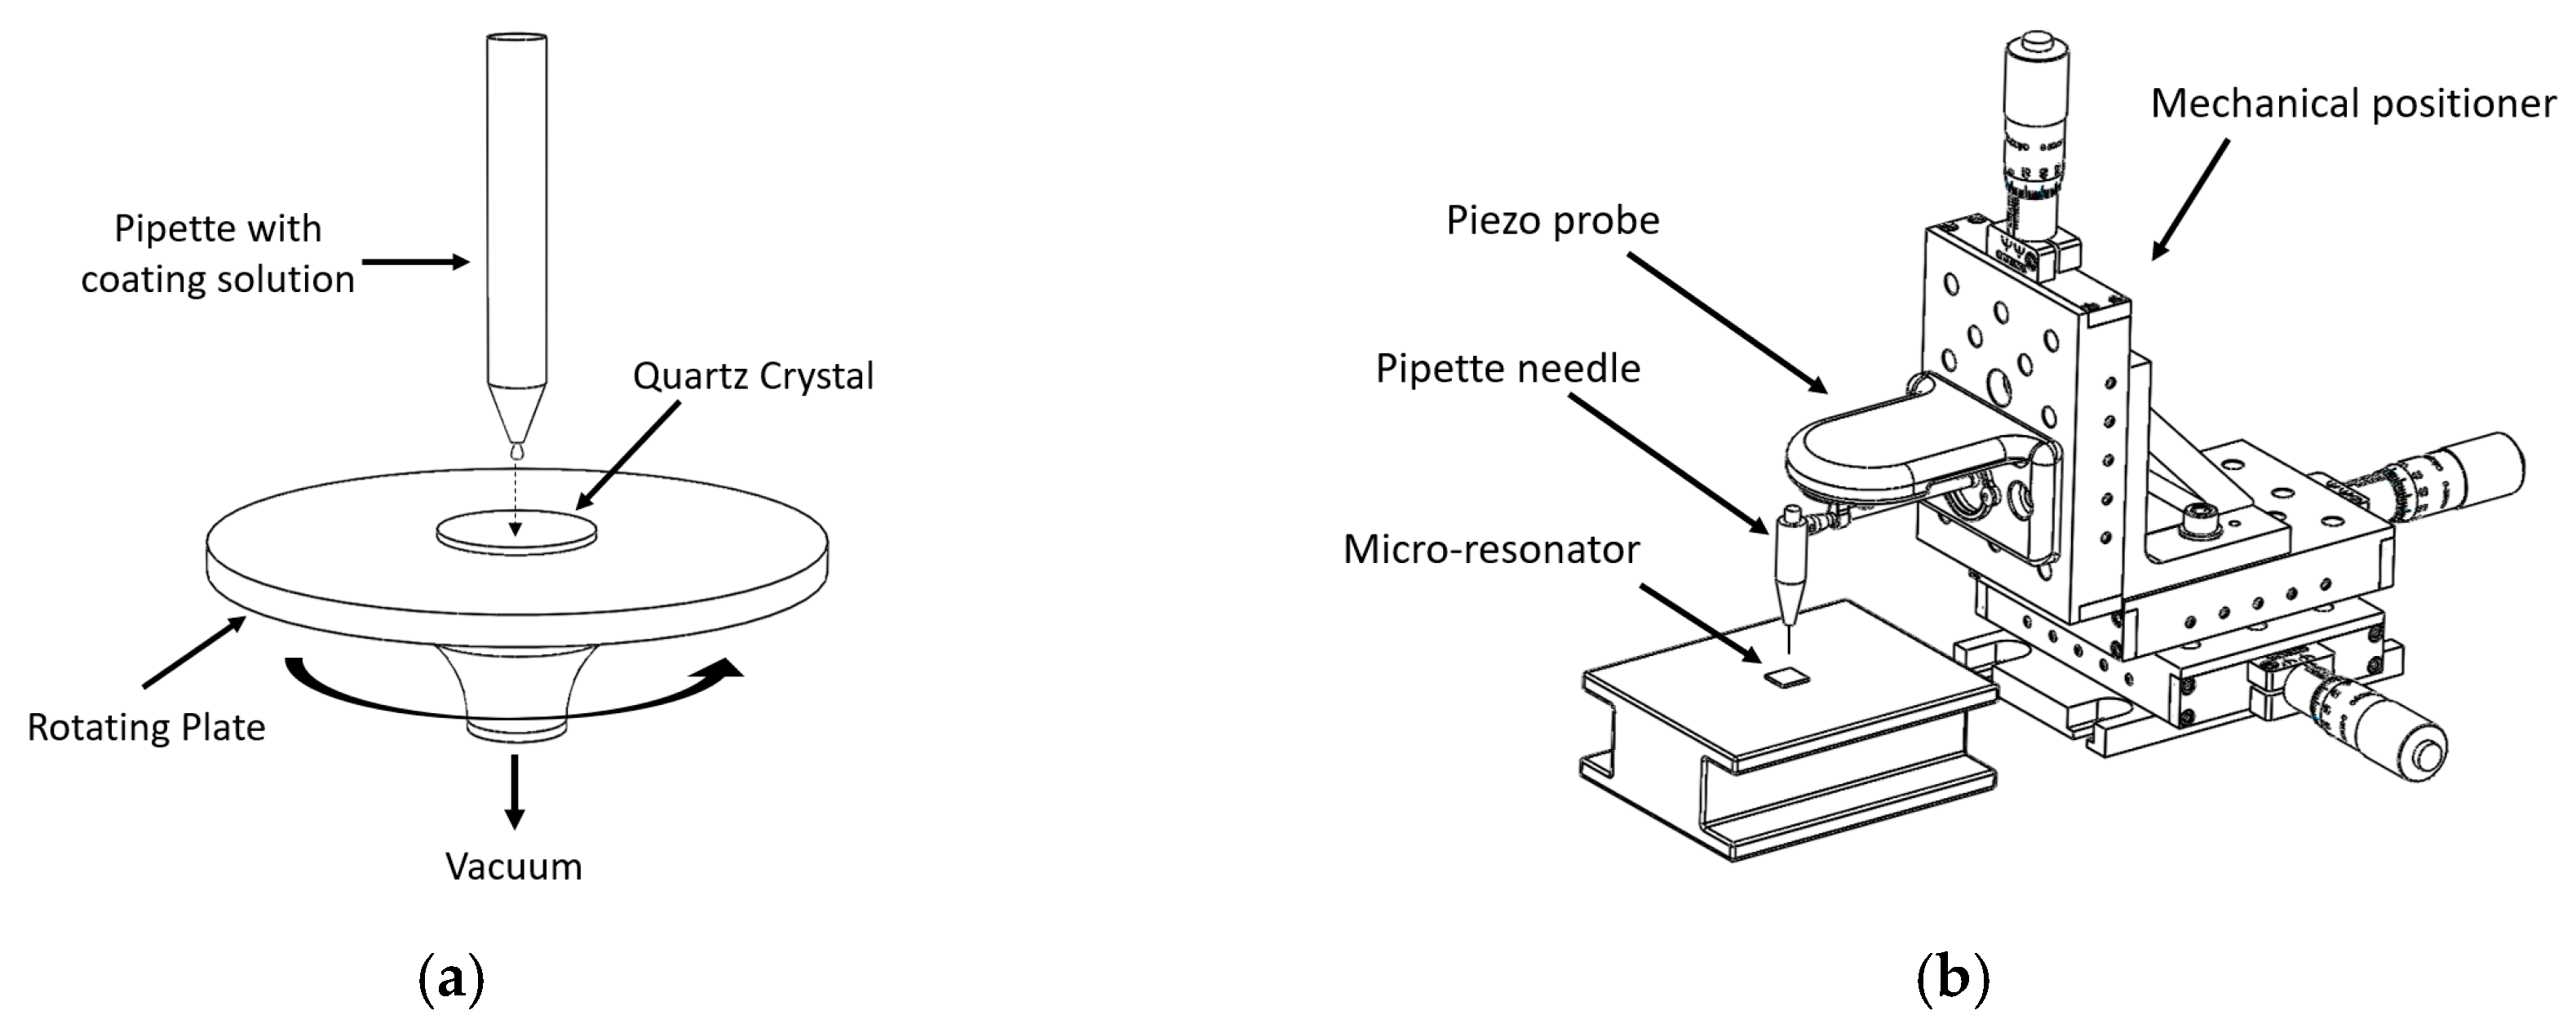
2.1. Coating Preparation
- Dissolution of 10 ml of branched PEI in 10 ml of distilled water at 40 °C.
- Sonification of the mixture for 2 hours at 40 °C.
- Maintain the solution in a water bath at >40 °C (before deposition onto the quart crystal).
- 500 rpm for 5 seconds while a drop of branched PEI solution is deposited.
- 2500 rpm for 15 seconds to remove the solution in excess.
- 5000 rpm for 30 s.
- The deposited crystal with the branched PEI was maintained for 24 hours in controlled ambient conditions and a maximum of 500 ppm of CO2.
- Dissolution of 0.25 gr of Lineal PEI in 10 ml of water at 55 °C.
- Sonification of the mixture for 1 hour at 55 °C, verifying the level of water periodically.
- Leave the solution at room temperature (25 °C ± 1 °C) for 24 h, at this temperature the solution will turn into a white hard paste.
- Heat the crystal with a Peltier cell with the hot side in contact with the crystal to increase the temperature to ~50 °C, and then remove the Peltier cell and turn on the spin coater as rapidly as possible.
- 1800 rpm for 10 seconds while a drop of linear PEI solution at 55 °C is deposited.
- 2500 rpm for 45 s.
- The deposited crystal with the linear PEI was maintained for 24 hours in controlled ambient conditions at a maximum of 500 ppm of CO2.
- Sonification of 0.5 ml of linear PEI solution with 20 ml of distilled water for 10 minutes at 50 °C verifying the level of water periodically.
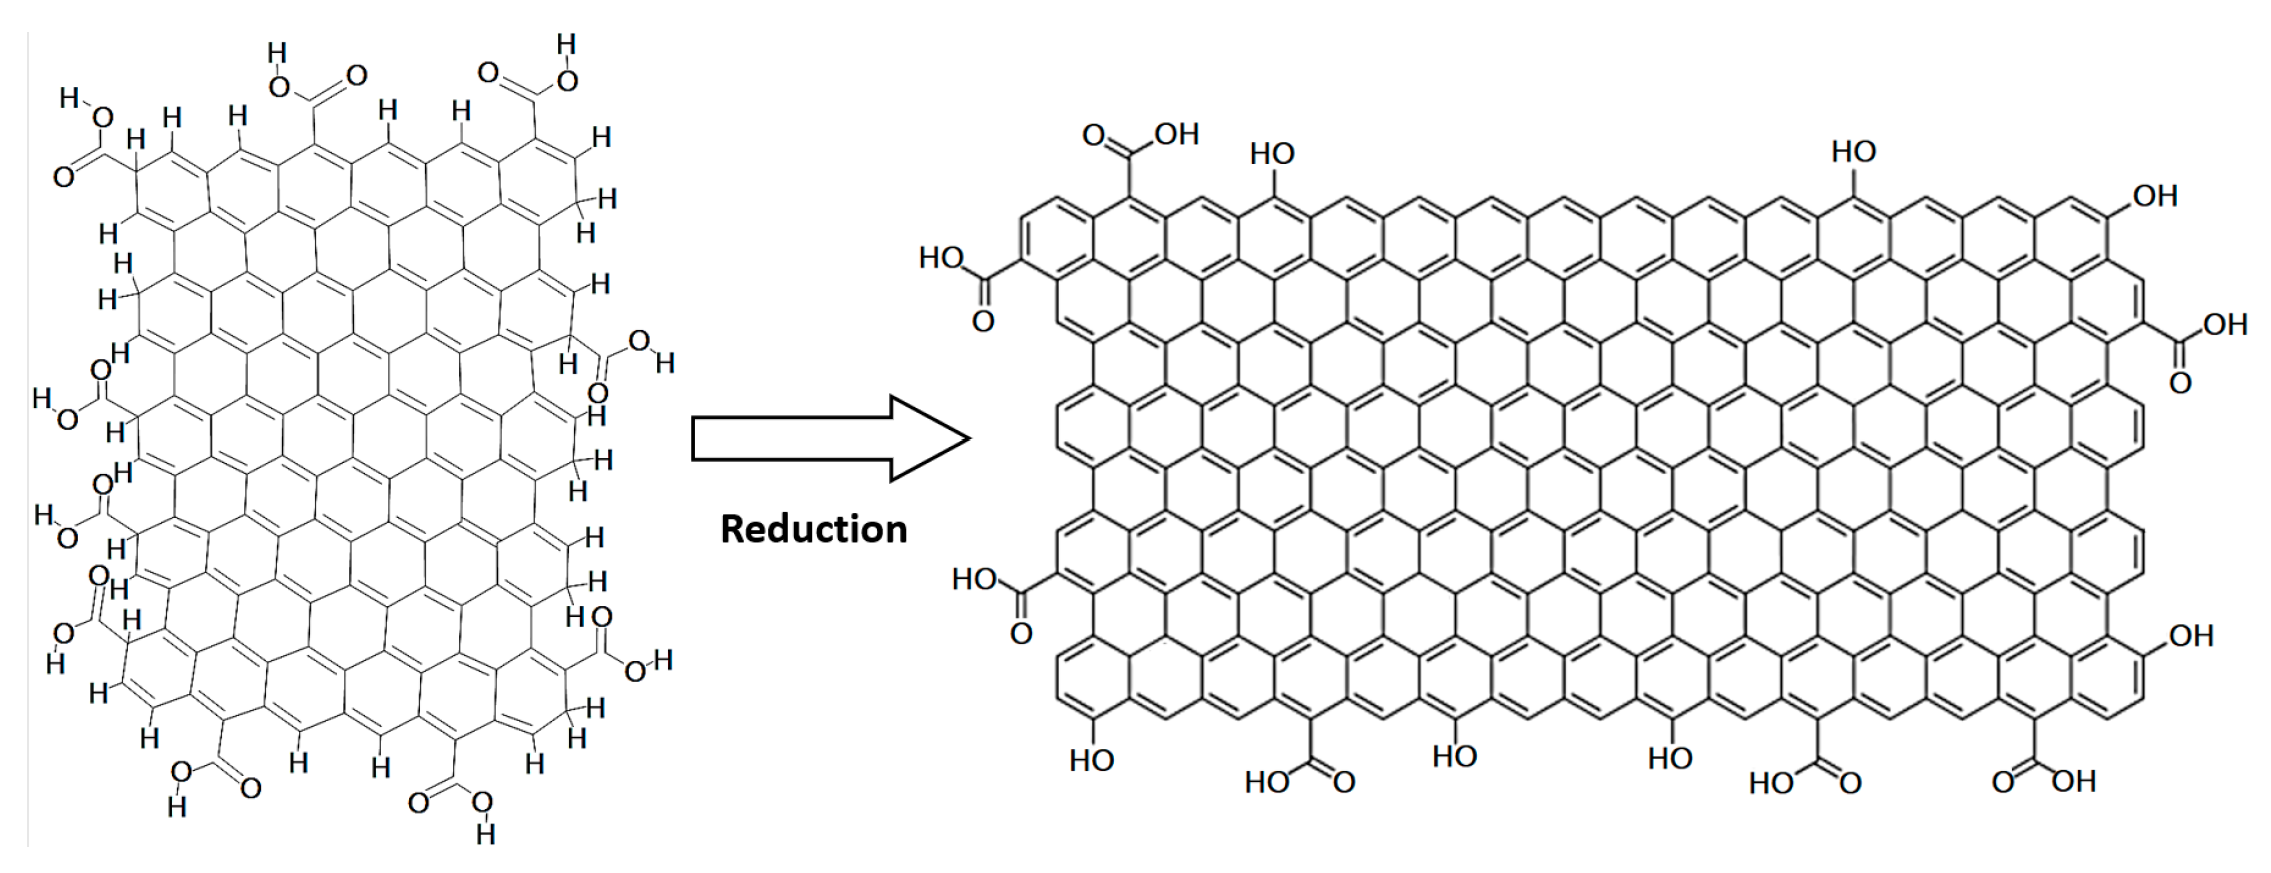
- Sonification of 0.5 g of graphene oxide within the solution for 1 hour at 50 °C verifying the level of water periodically.
- Filter the solution with graphene.
- 3 microwave reduction cycles of 7 seconds each at a 600 W power with 20 seconds between each cycle.
- Sonification of the reduced graphene oxide with the original linear PEI solution in a volumetric proportion of 1:1 for 3 hours at 55 °C verifying the level of water periodically.
- Leave the solution at room temperature (25 °C ± 1 °C) for 24 h, at this temperature the solution will turn into a dark gray paste.
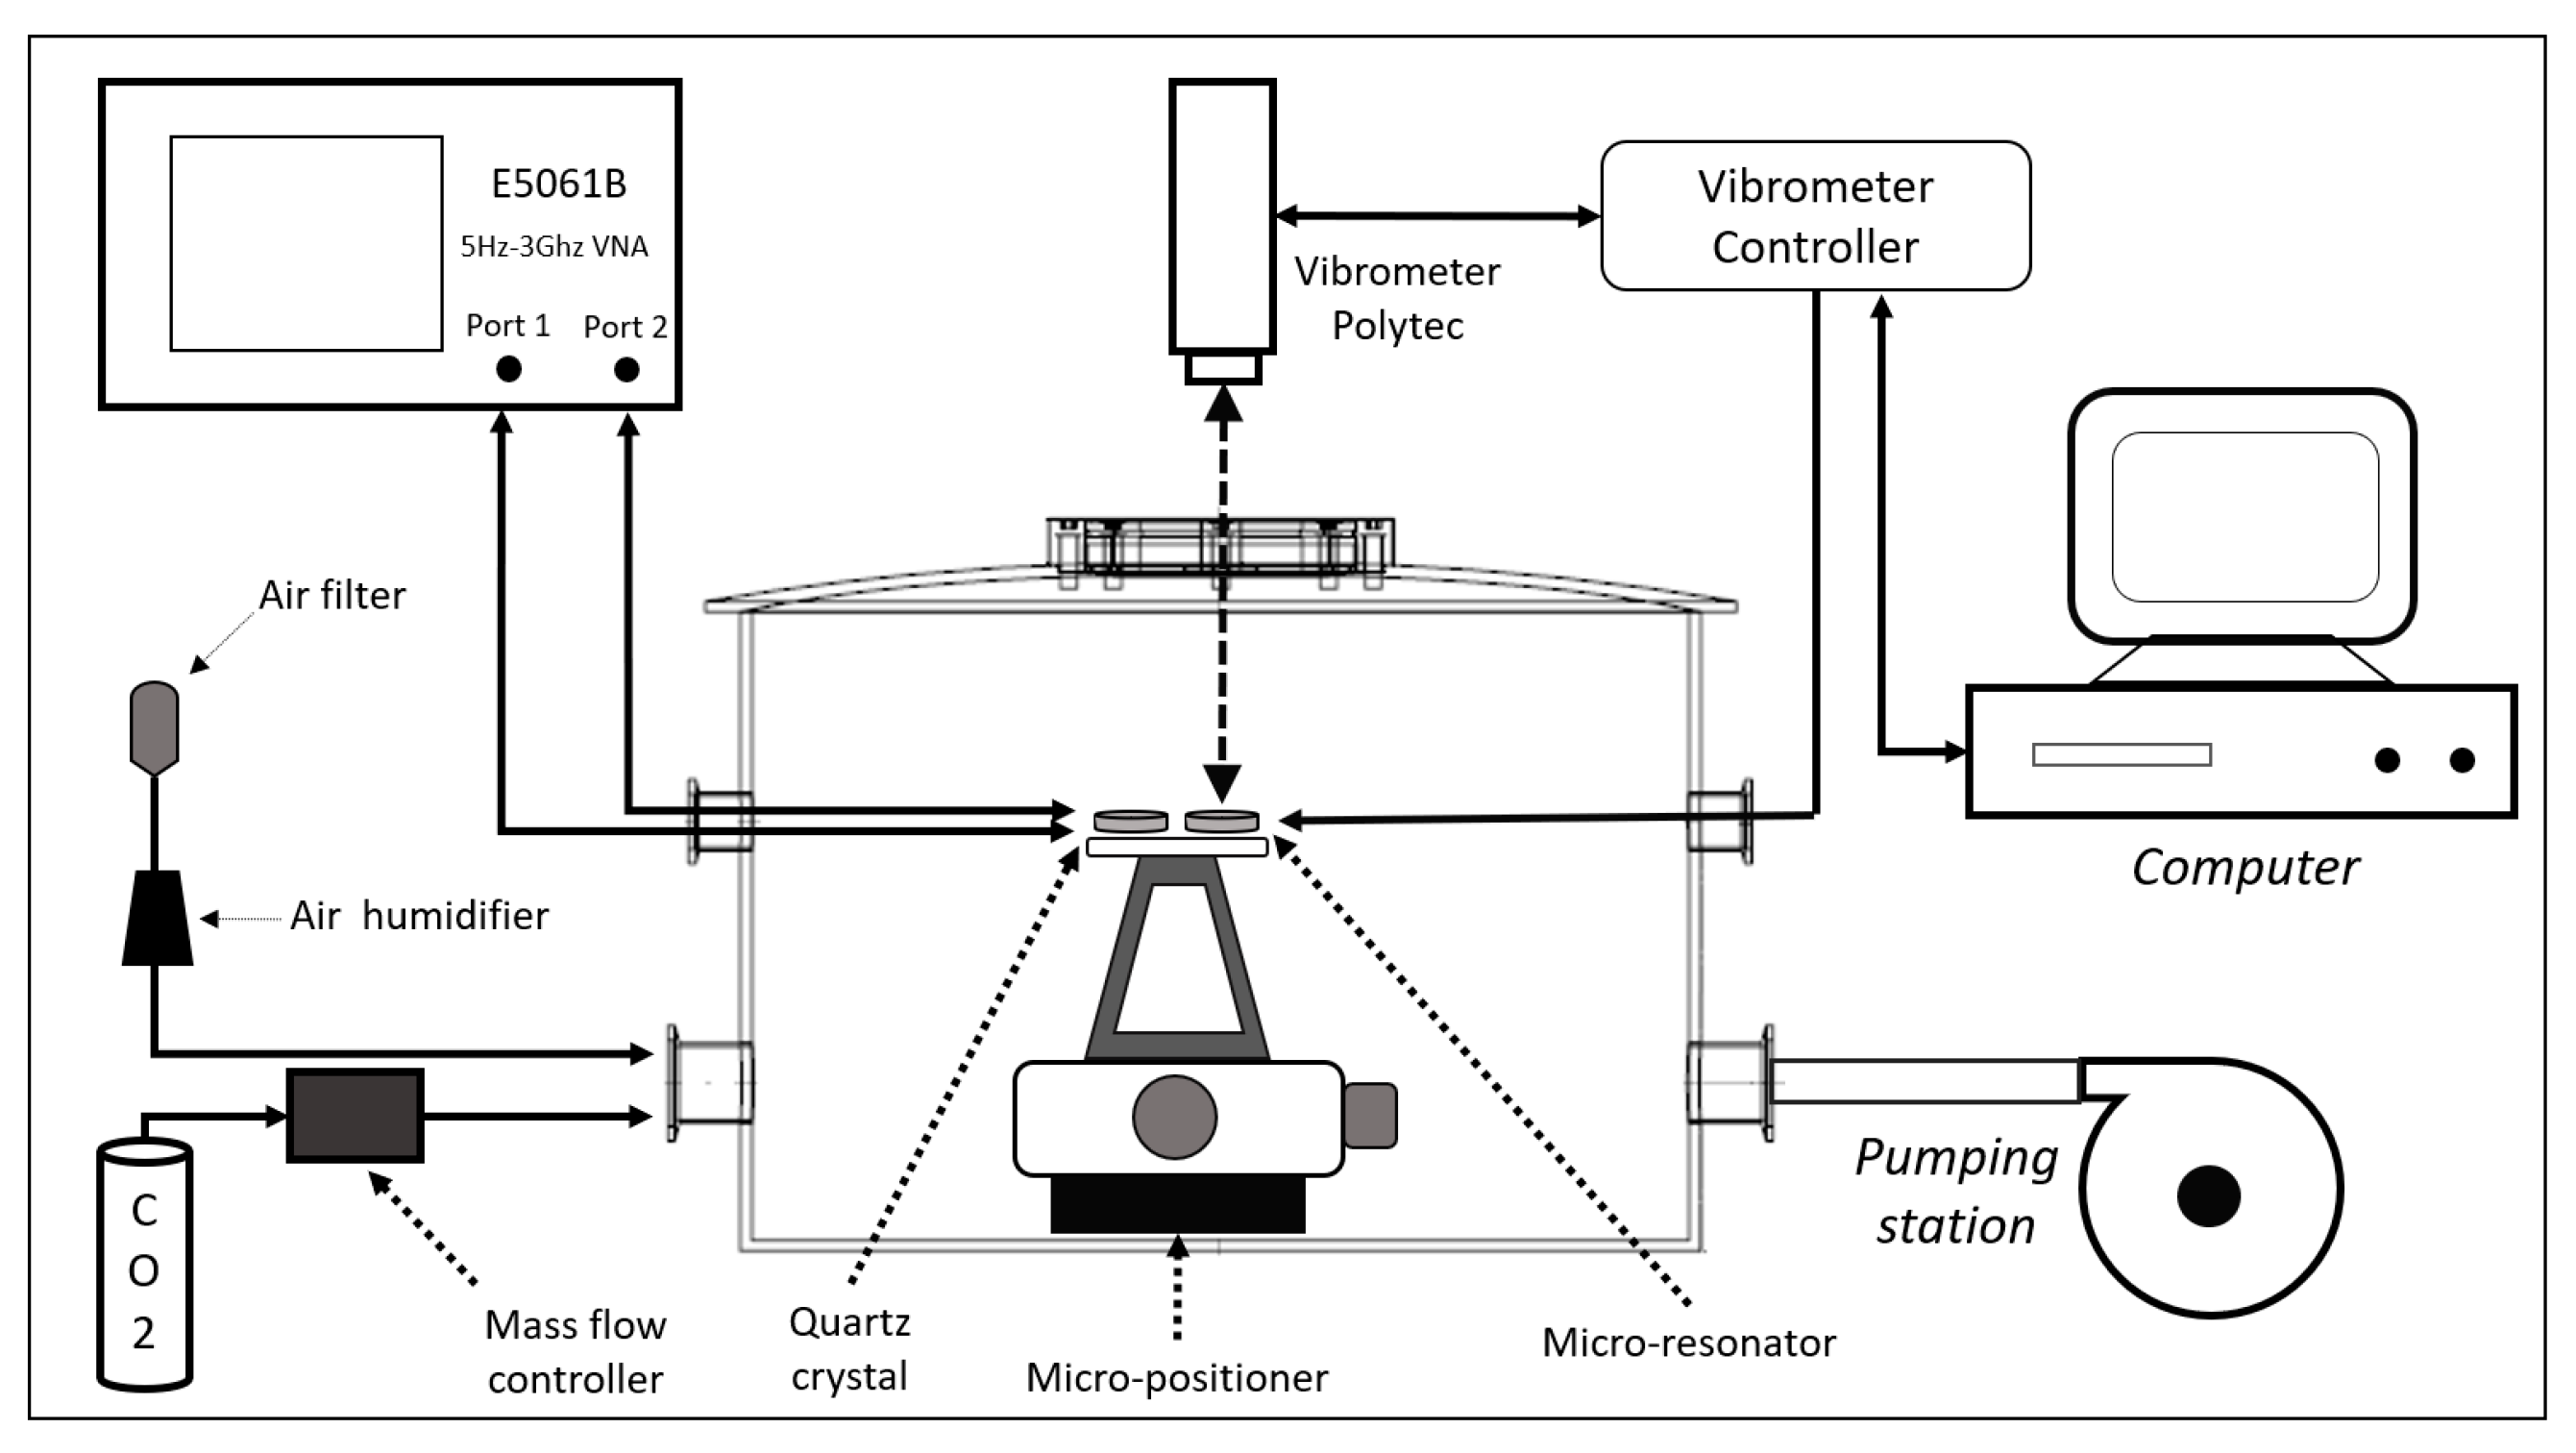
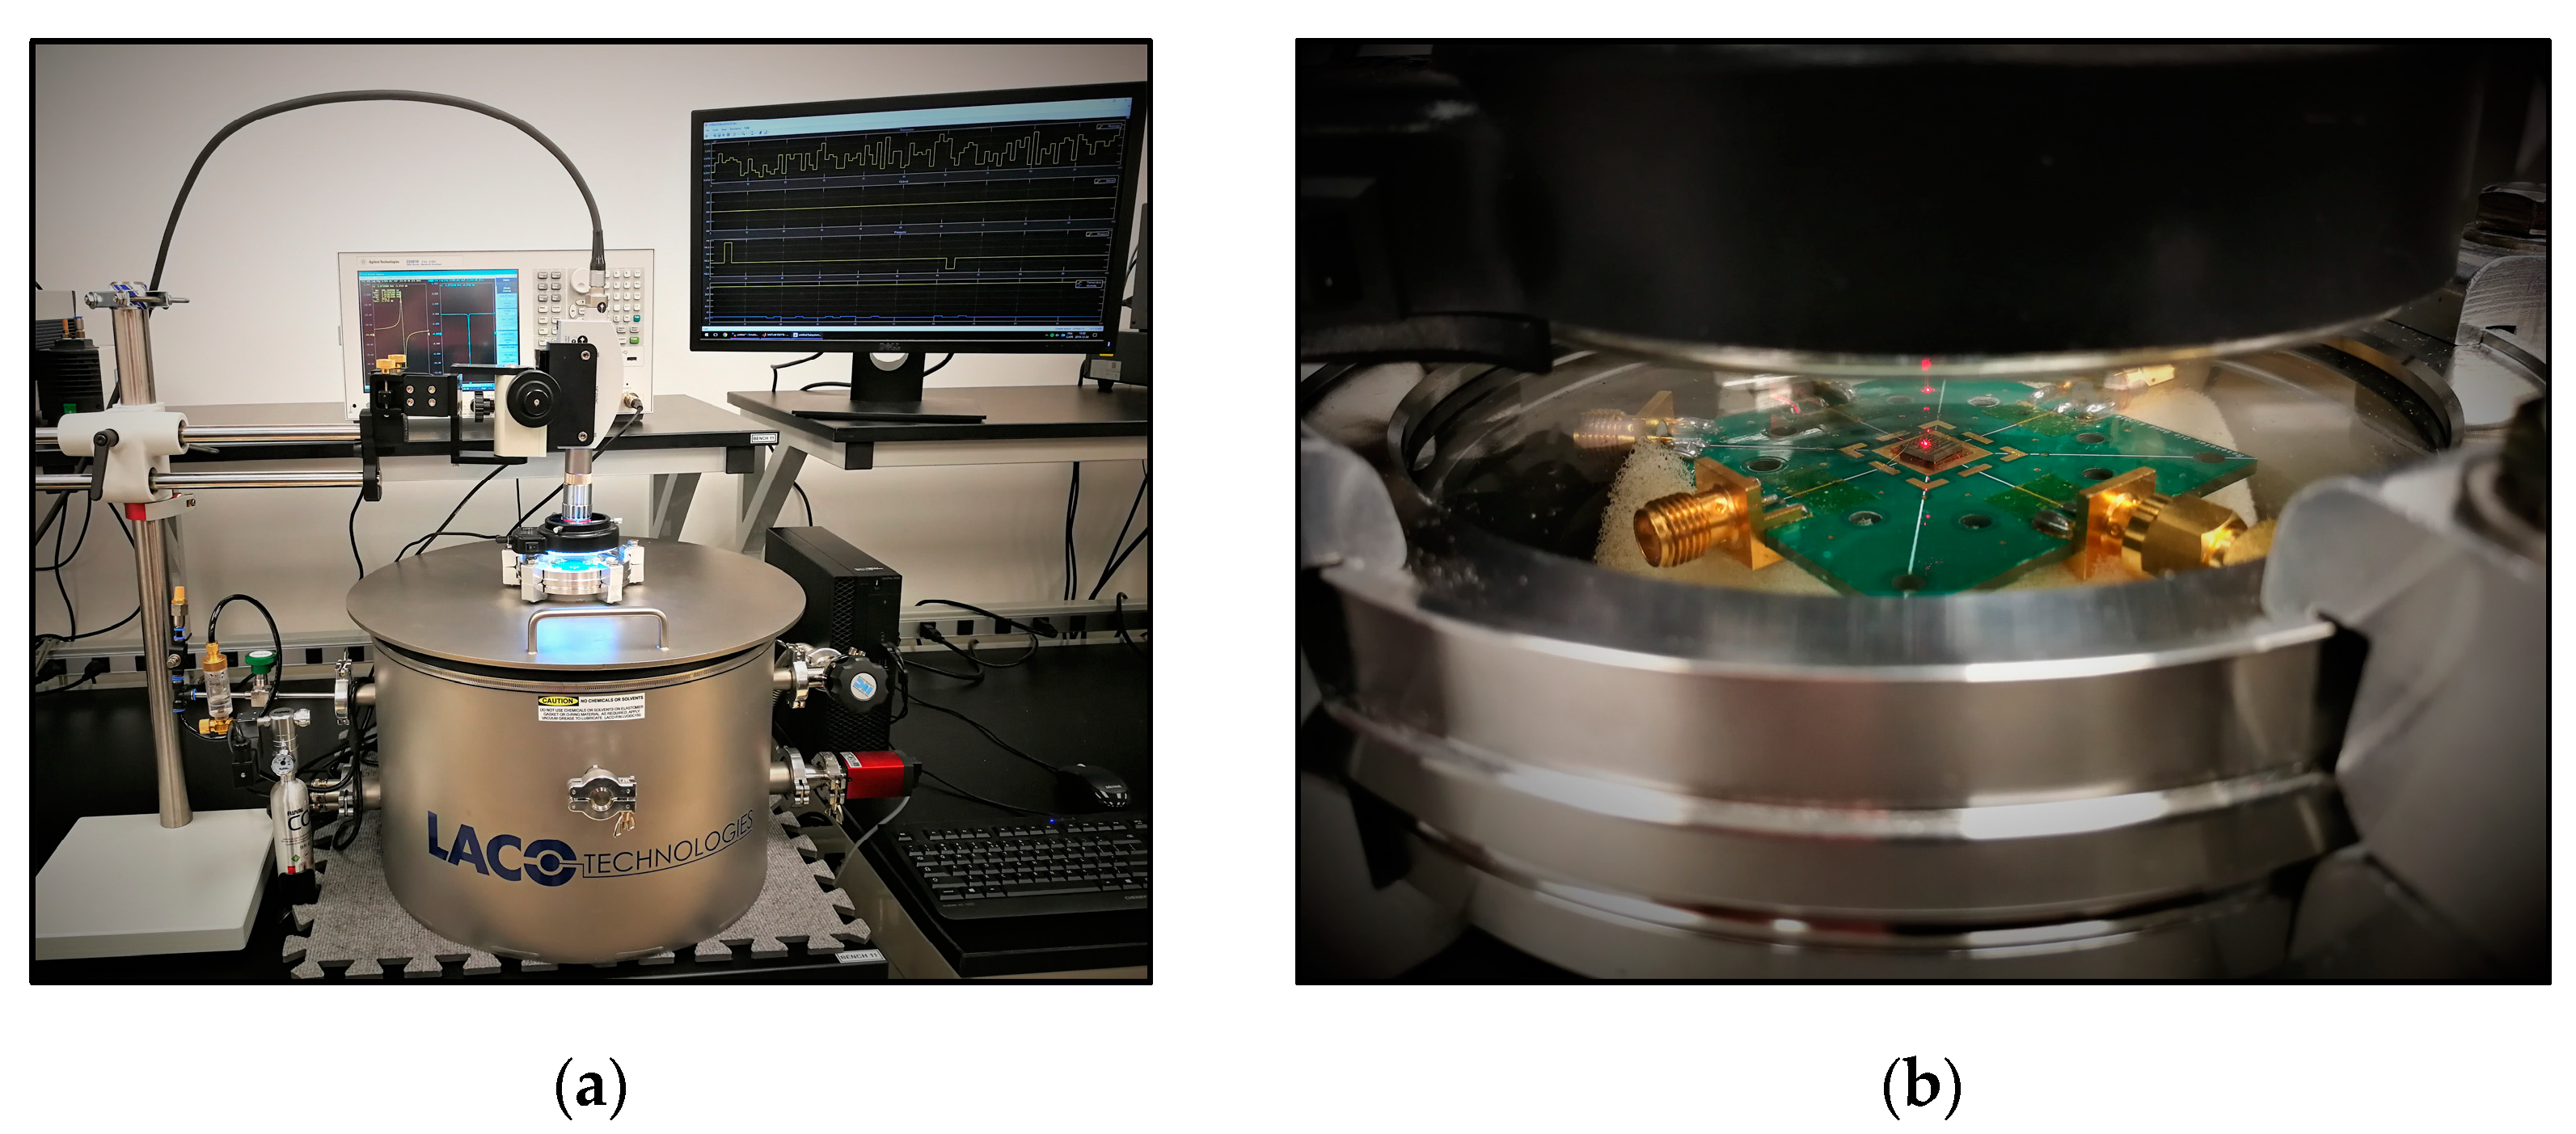
2.2. Test Setup
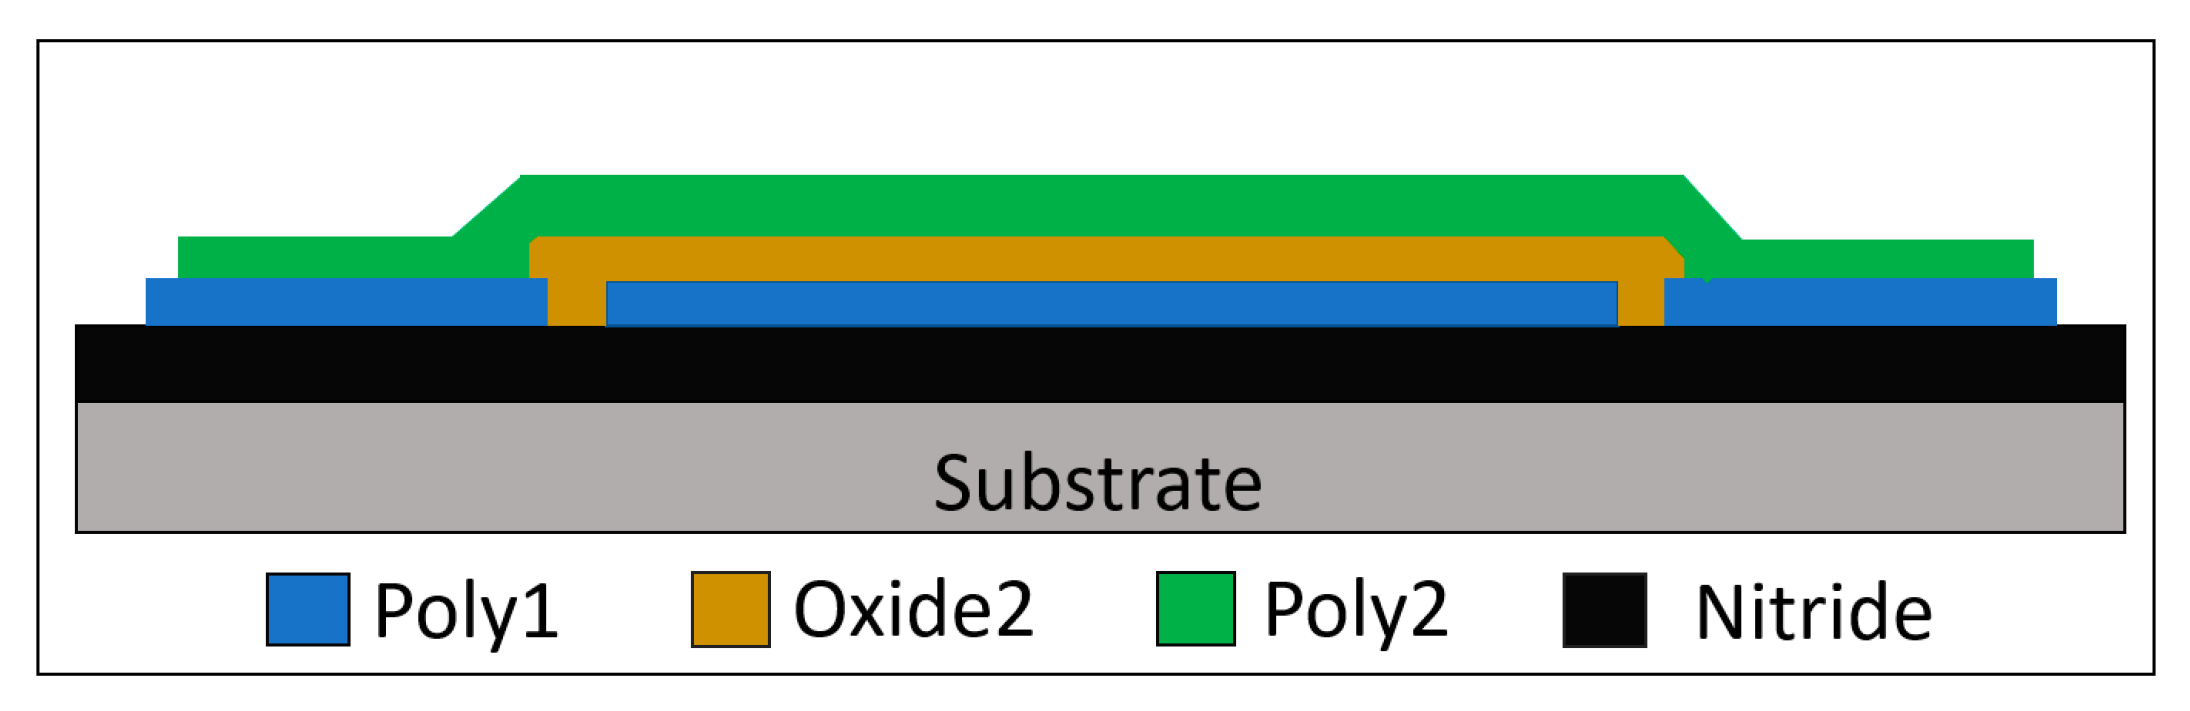
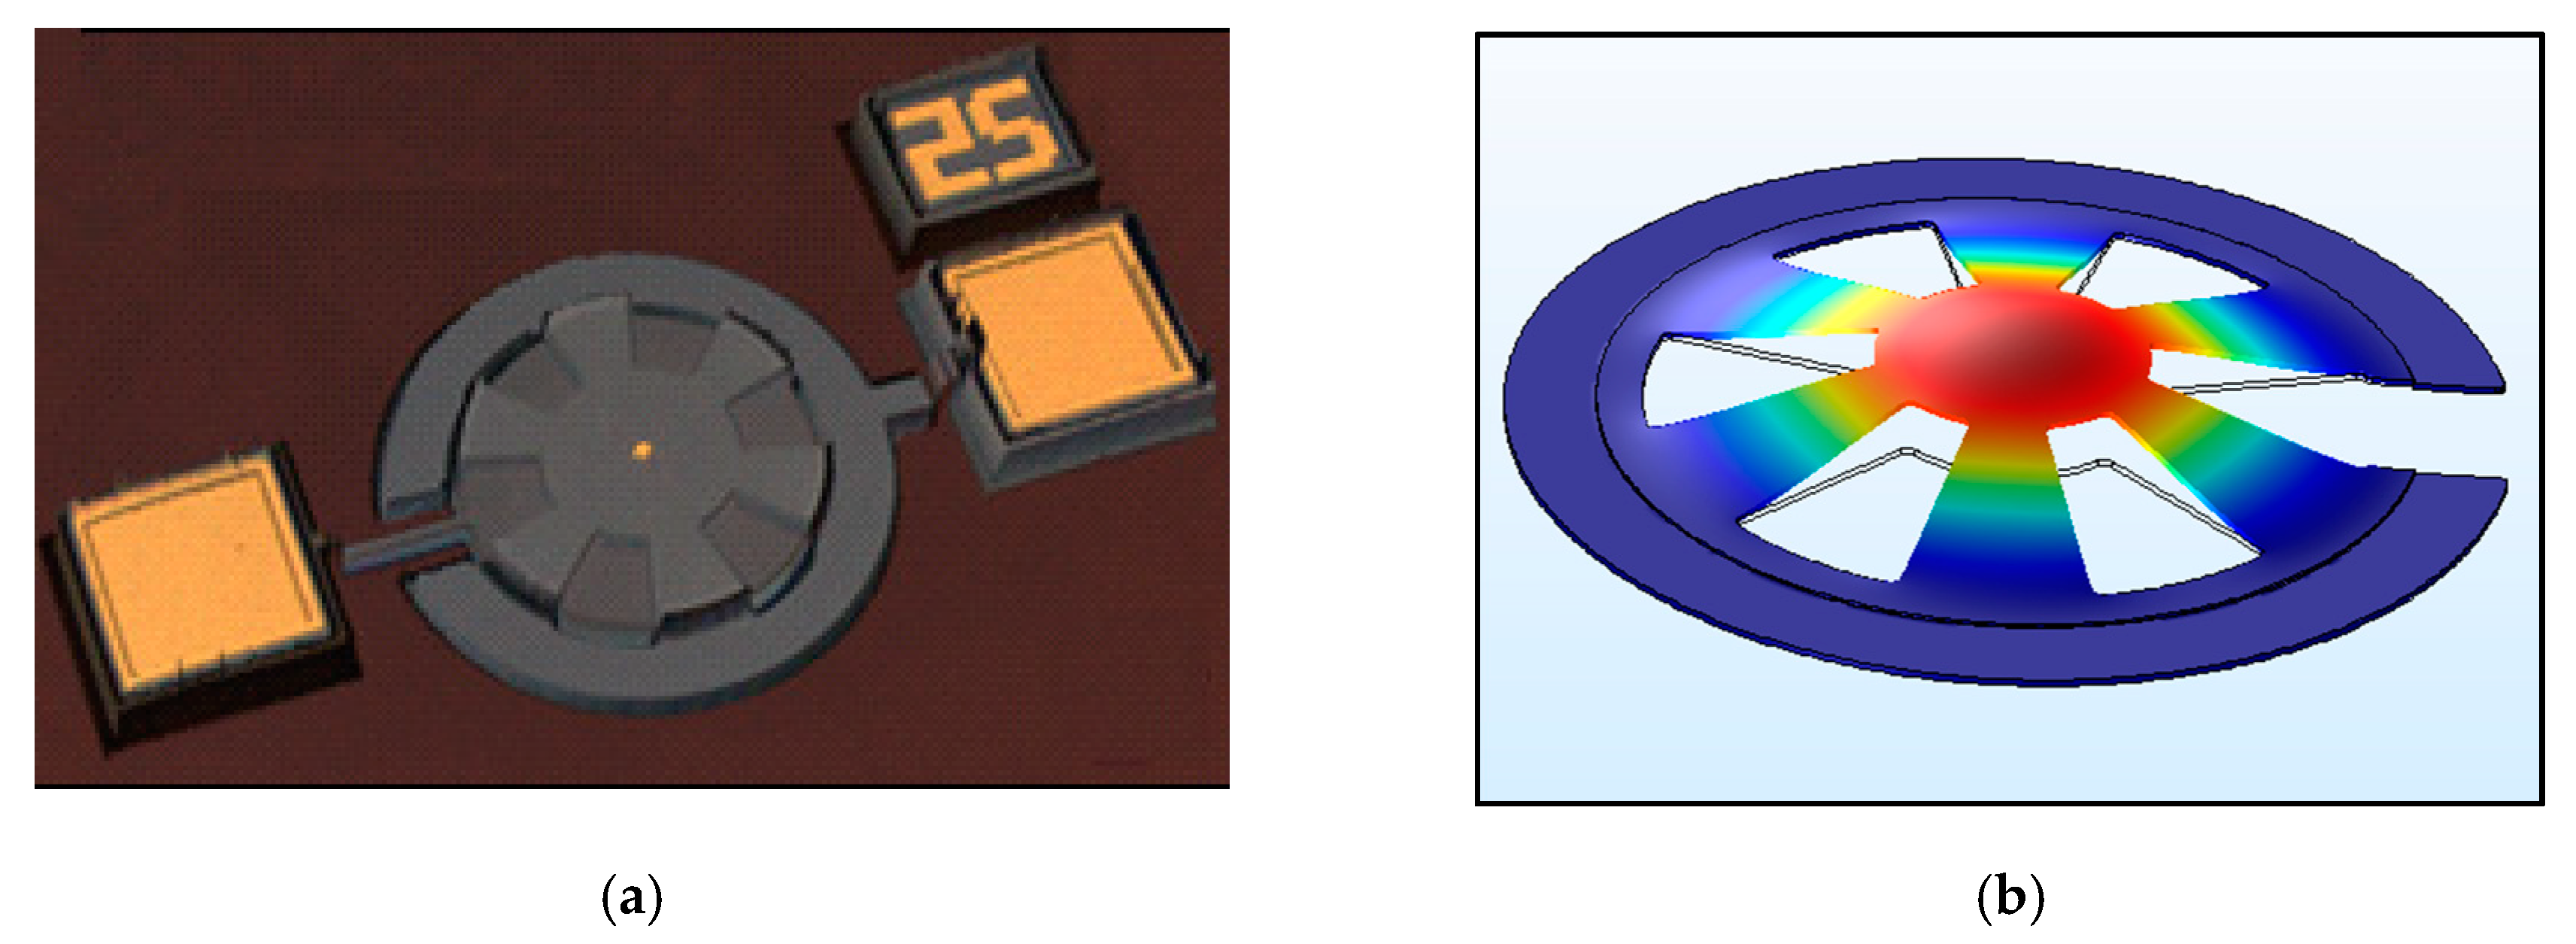
2.3. Micro-resonator Characteristics
3. Results
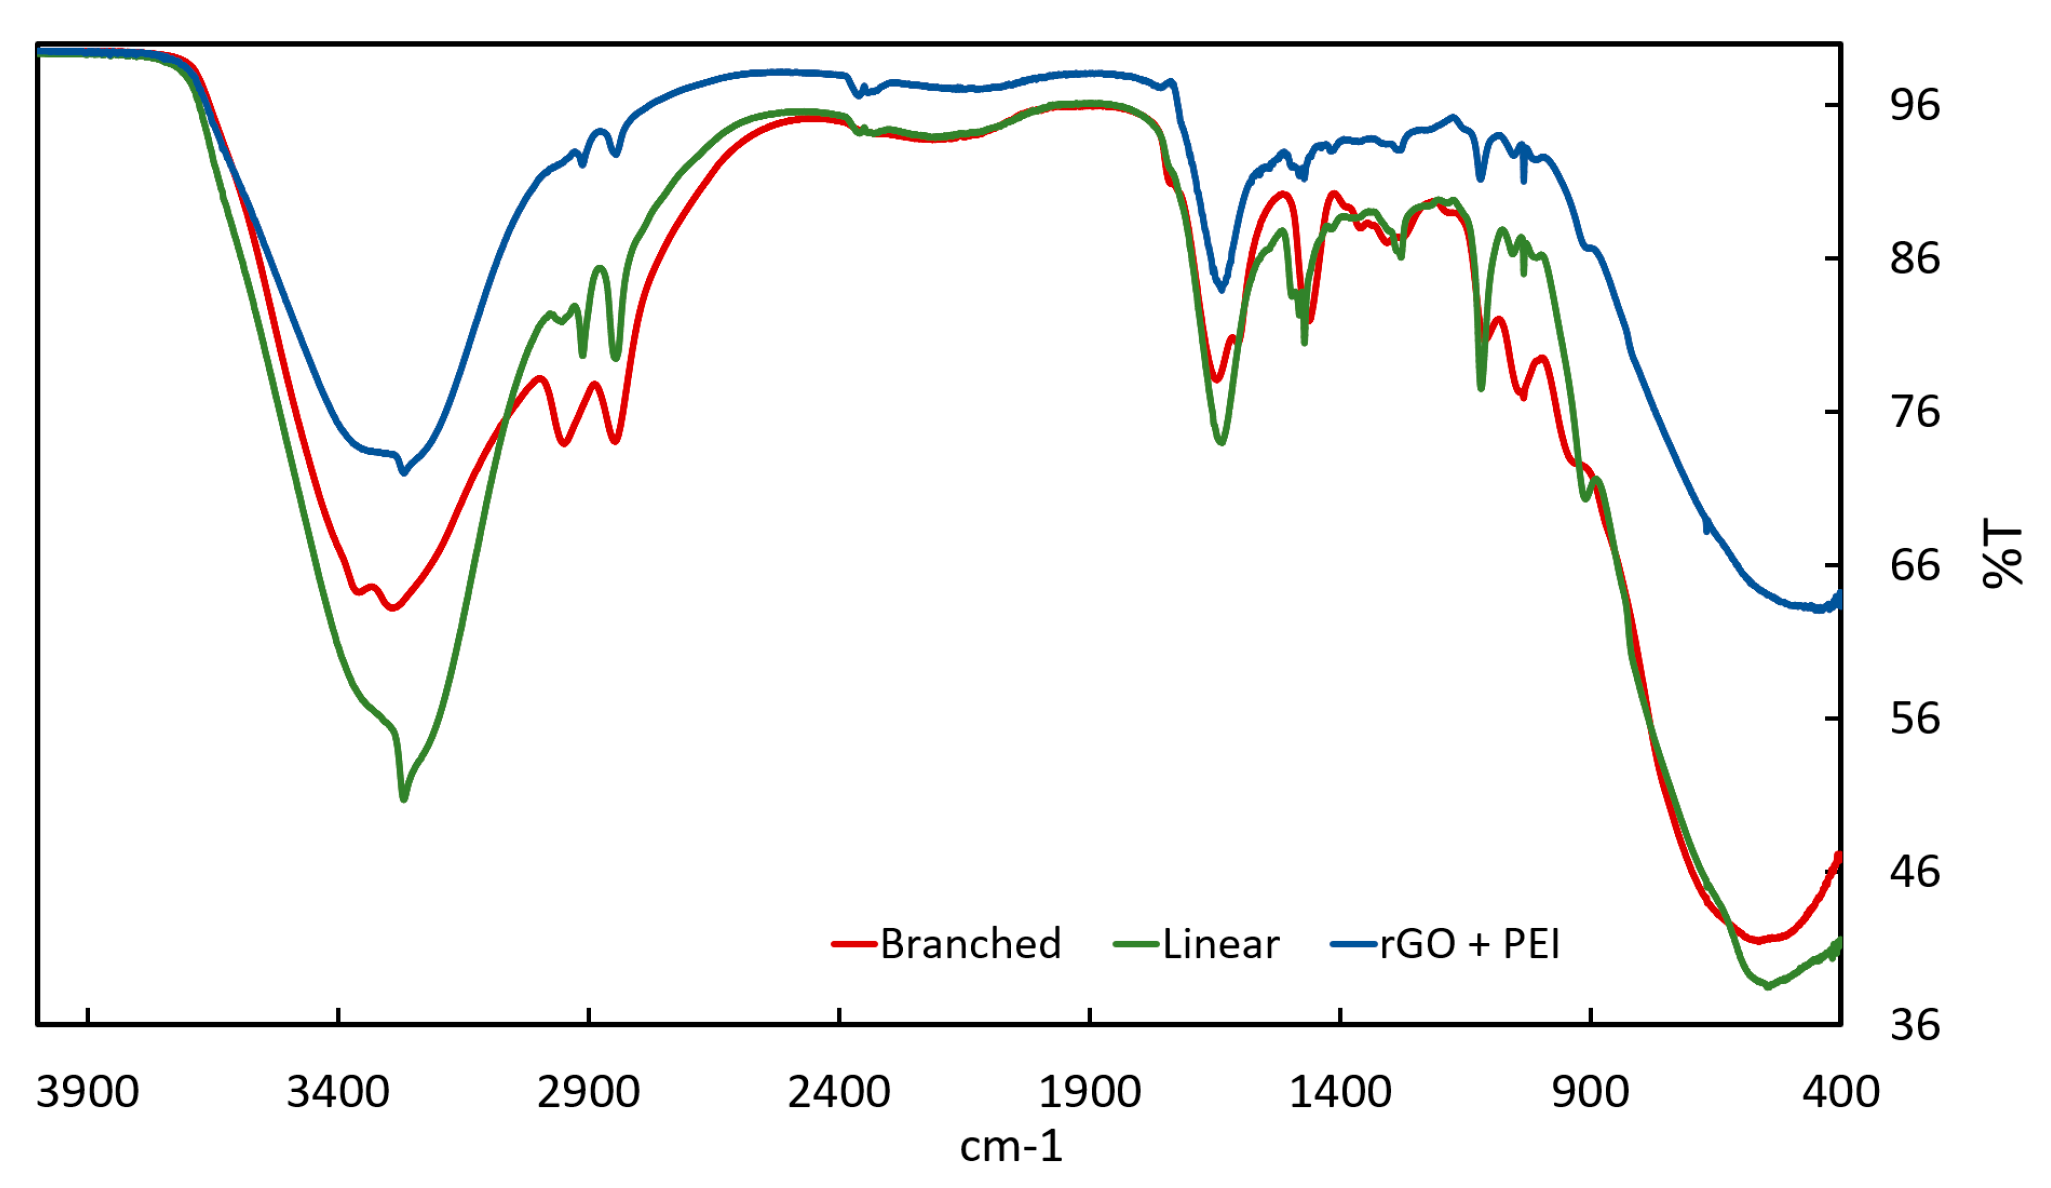
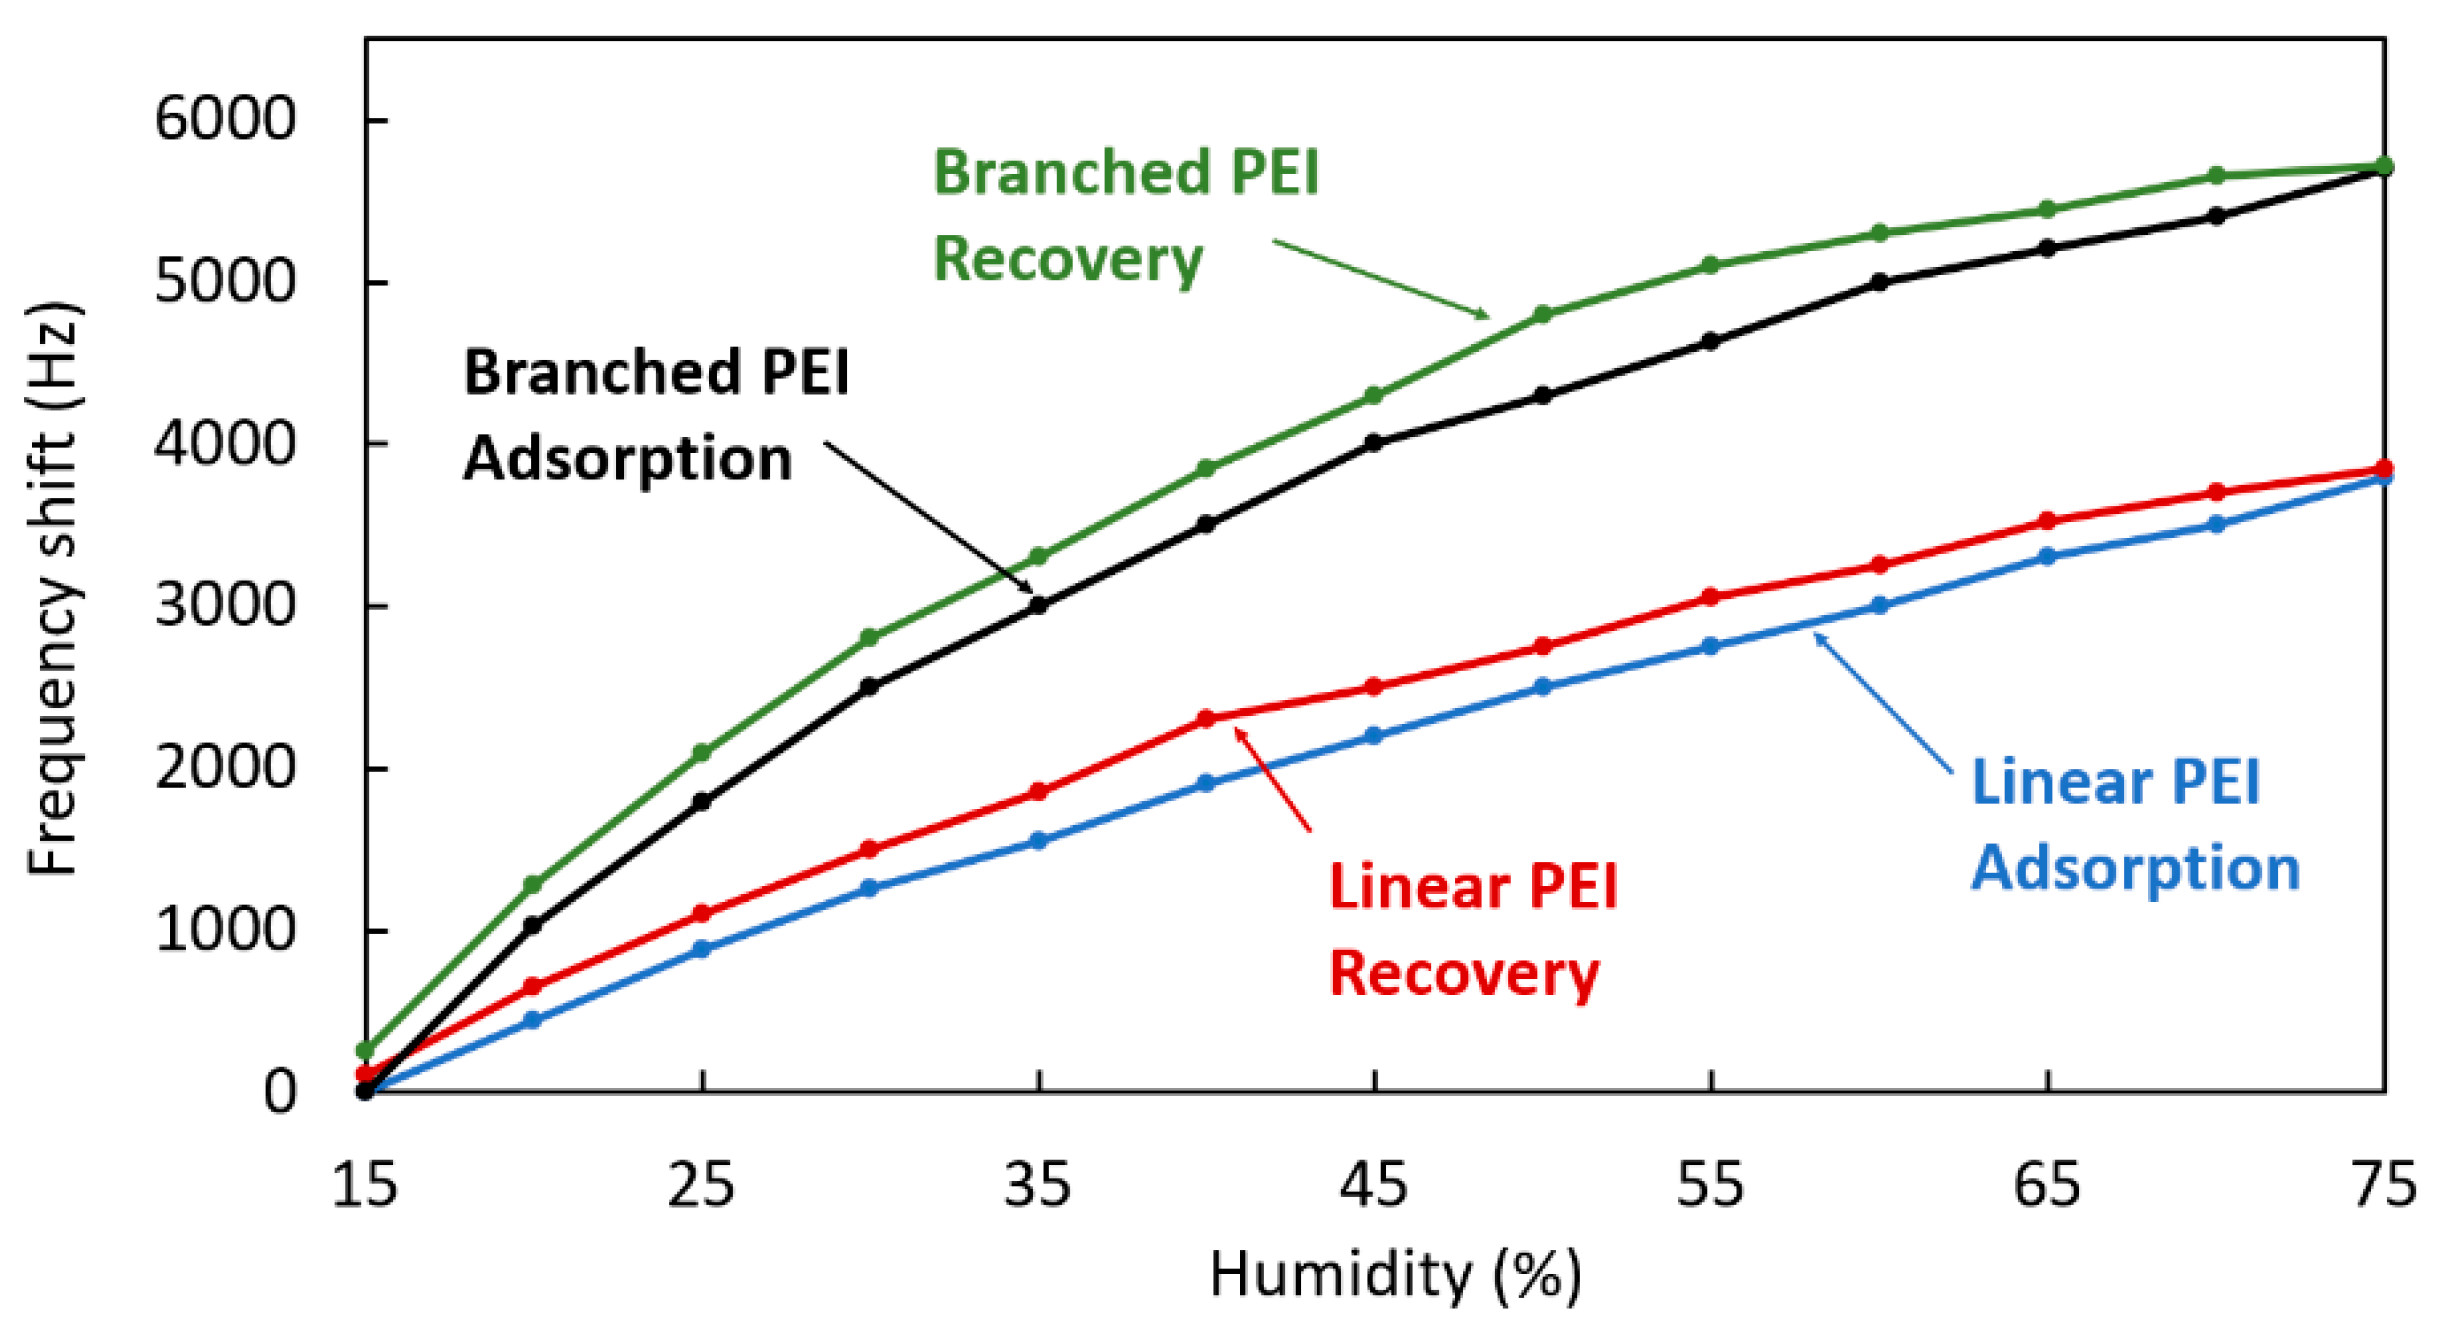
3.1. Linear and Branched Polyethylenimine Coatings Characterization
3.2. Linear Polyethylenimine with Reduced Graphene Oxide Coating Characterization
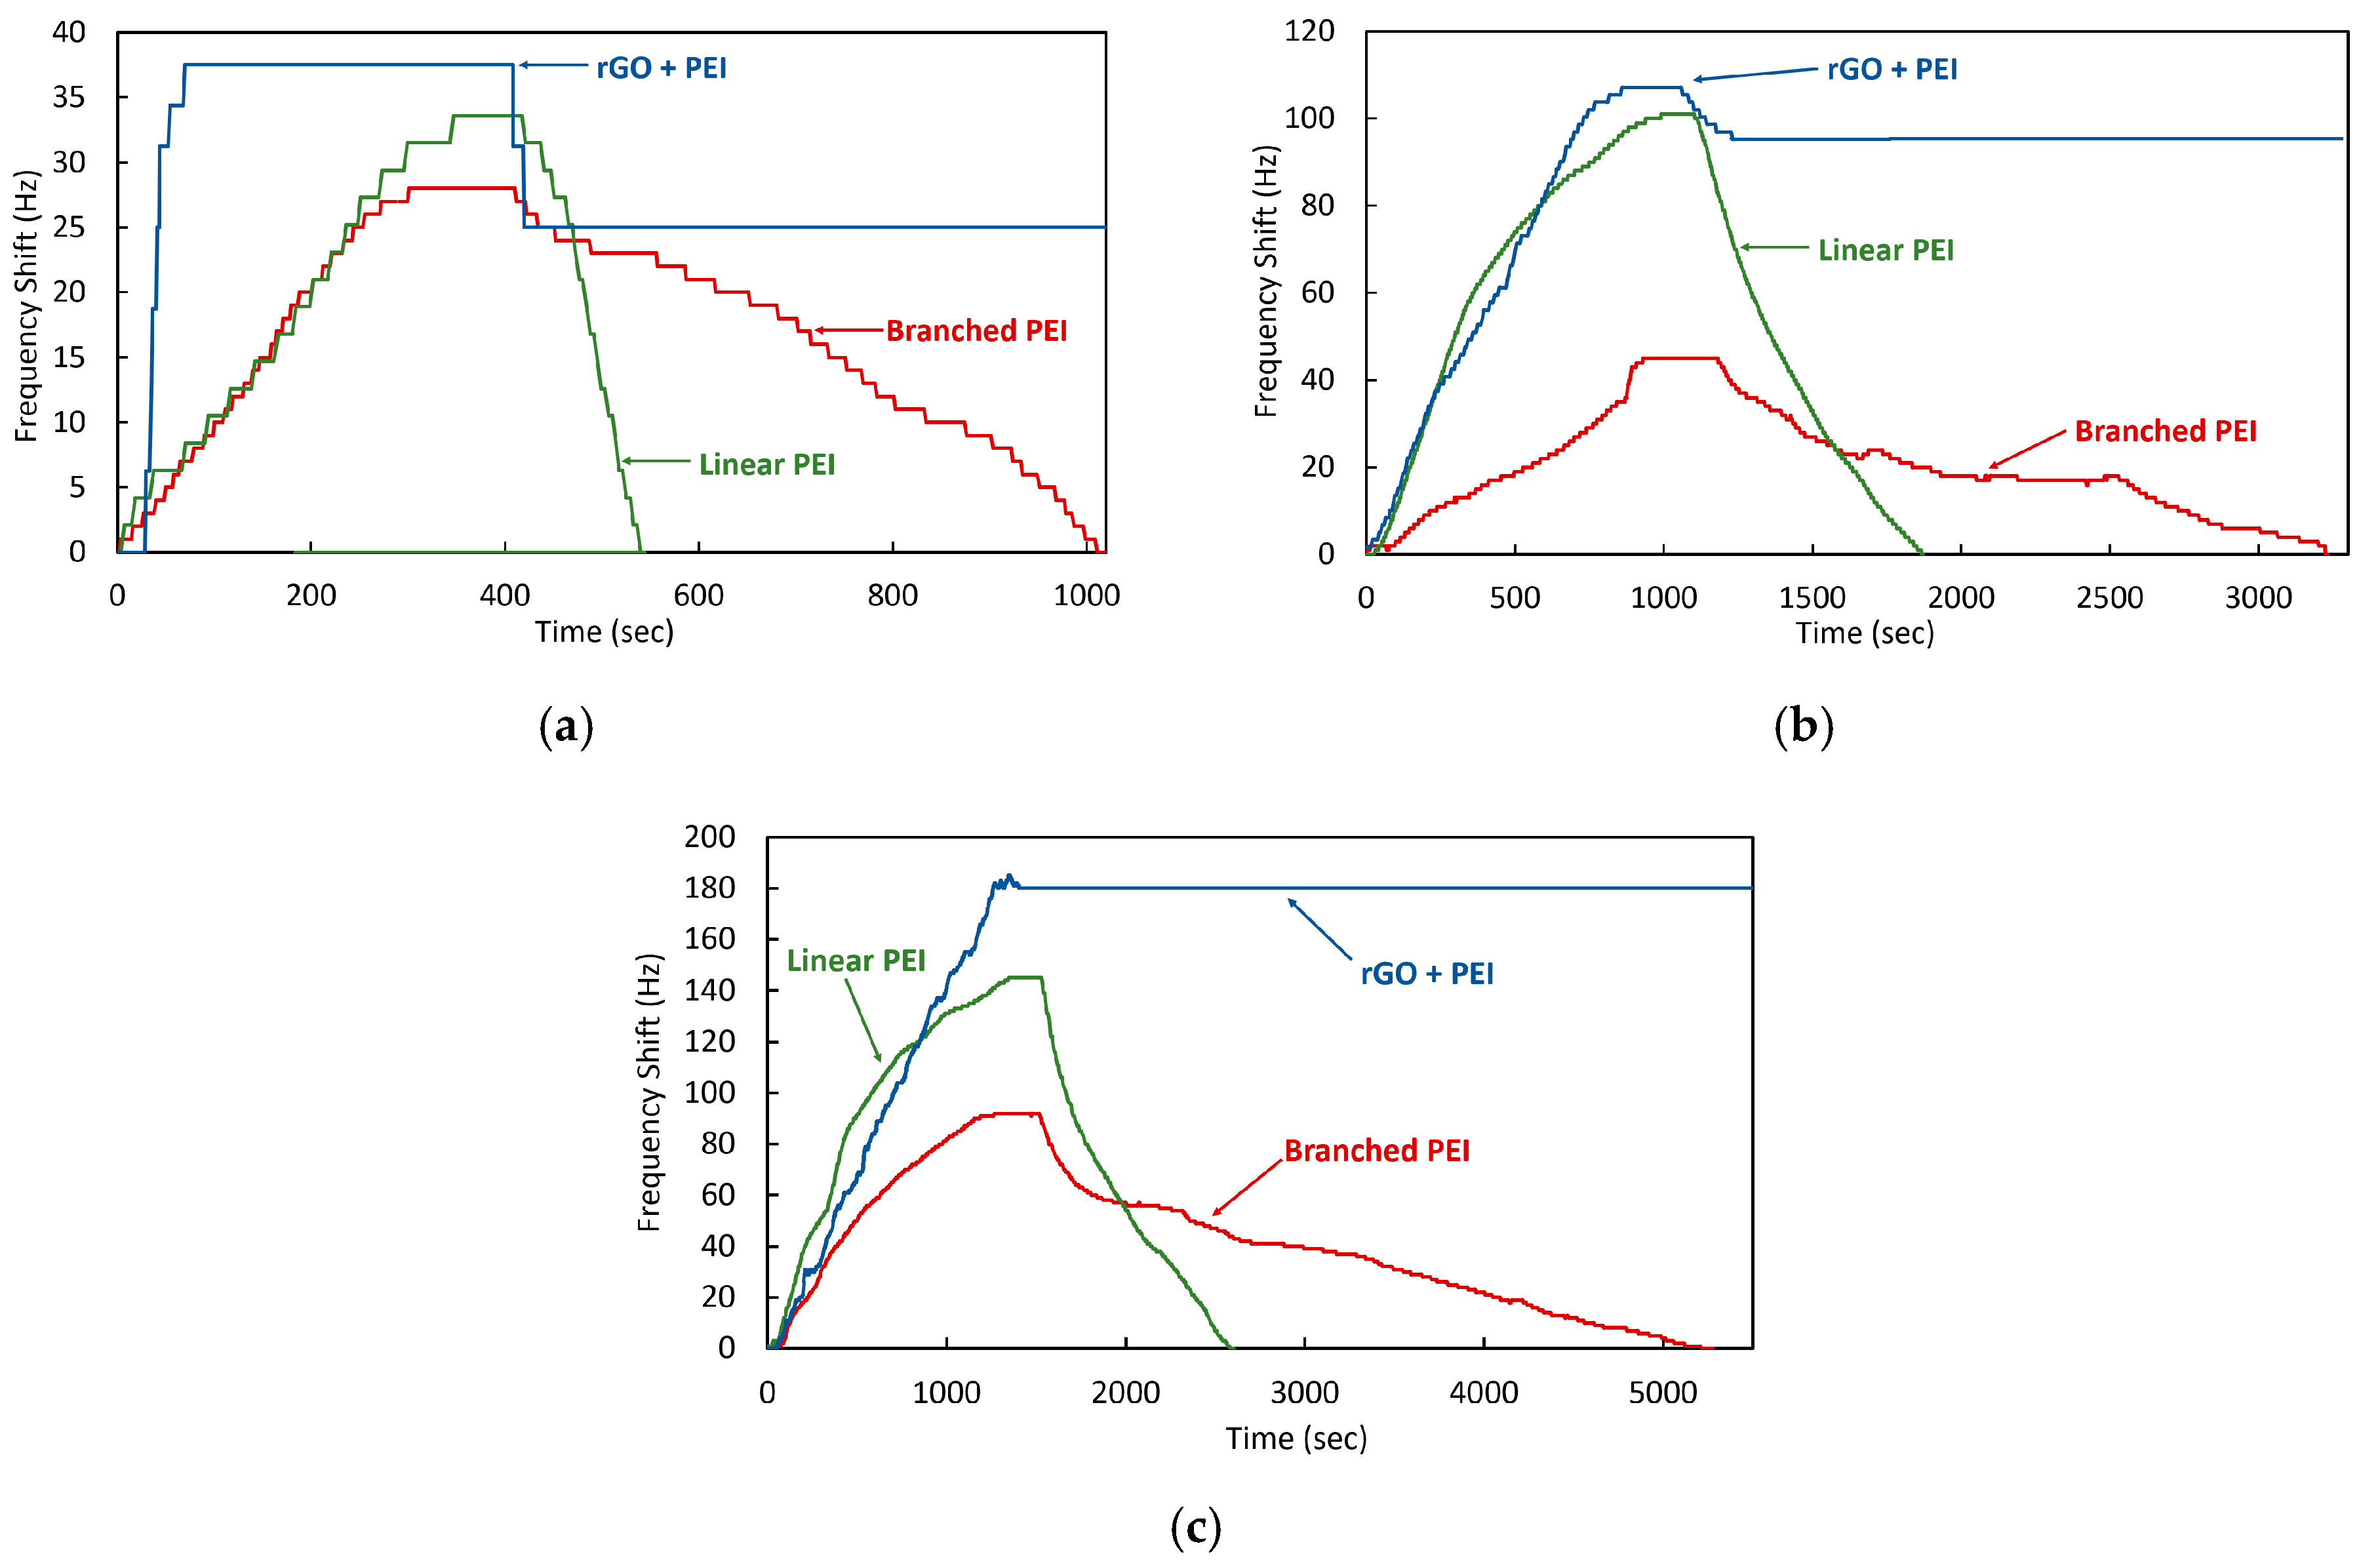
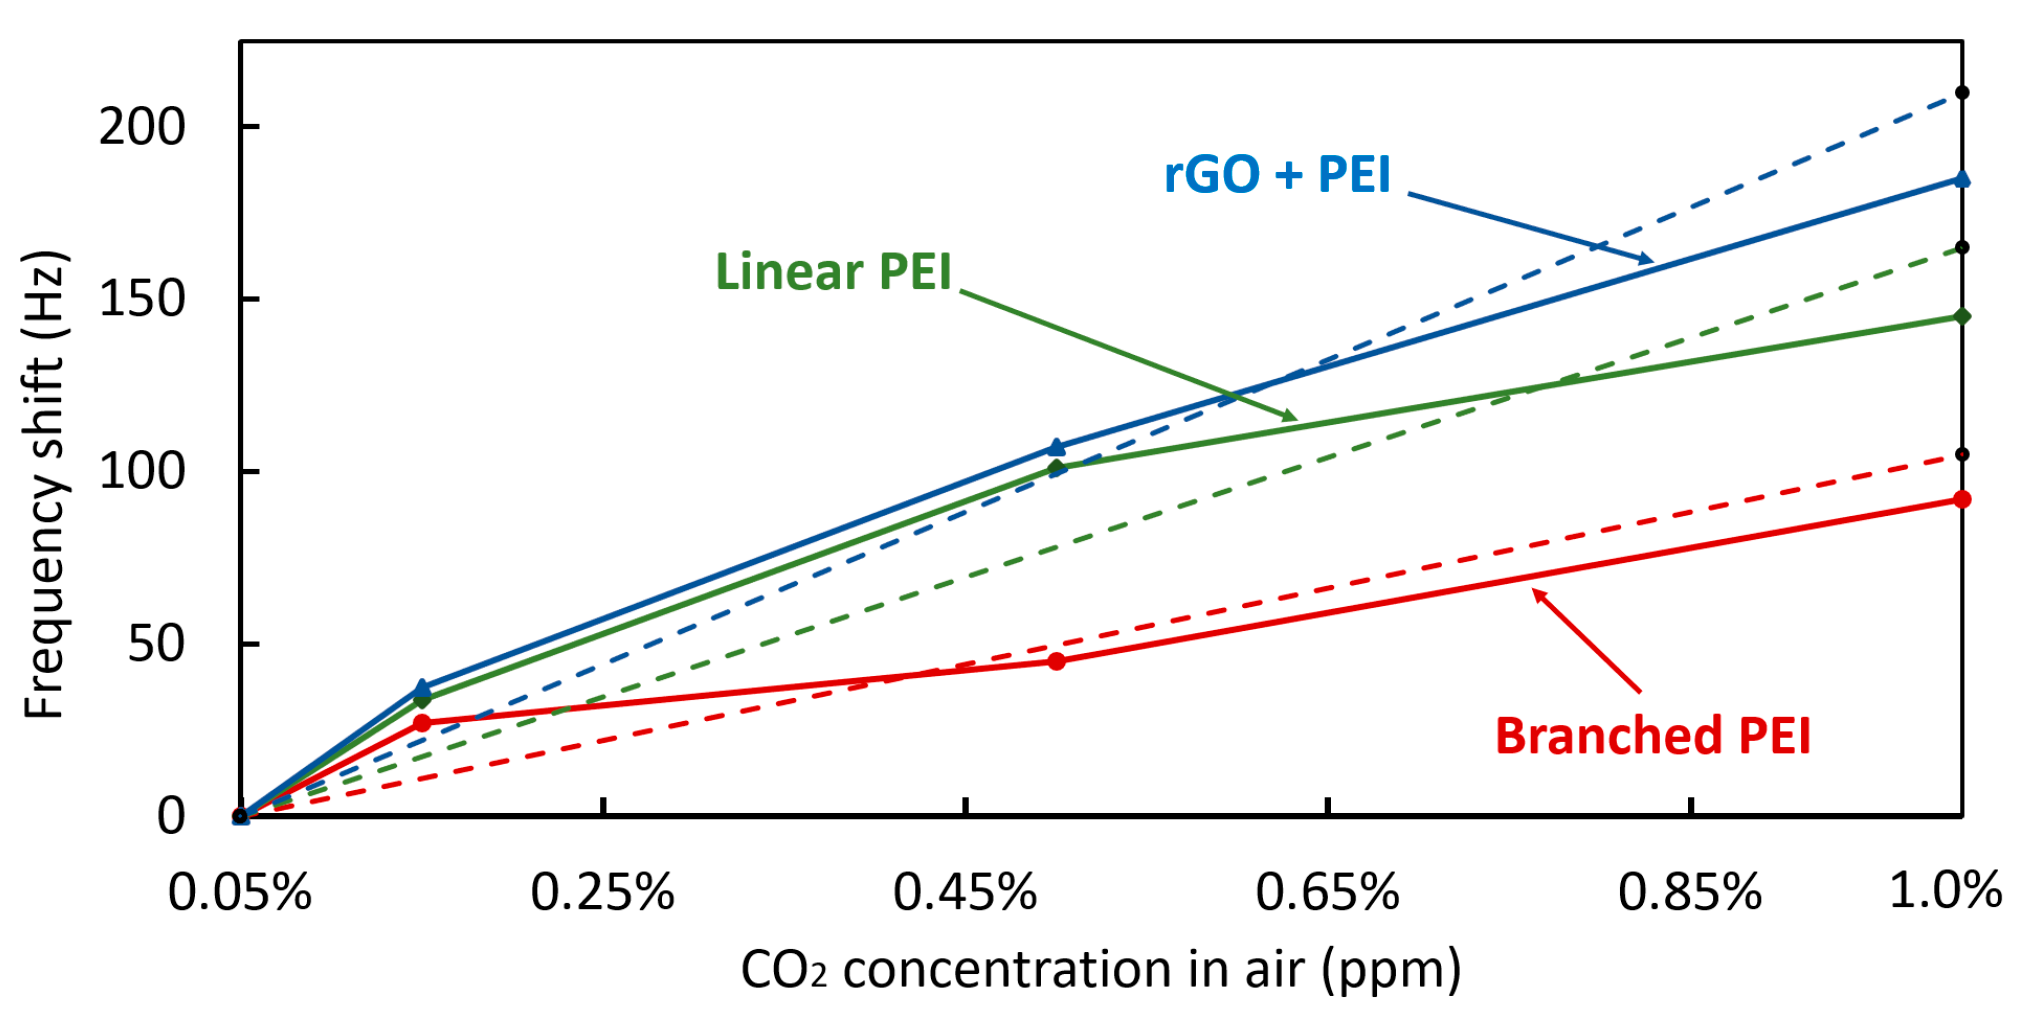
3.3. Performance Comparison between the Coatings
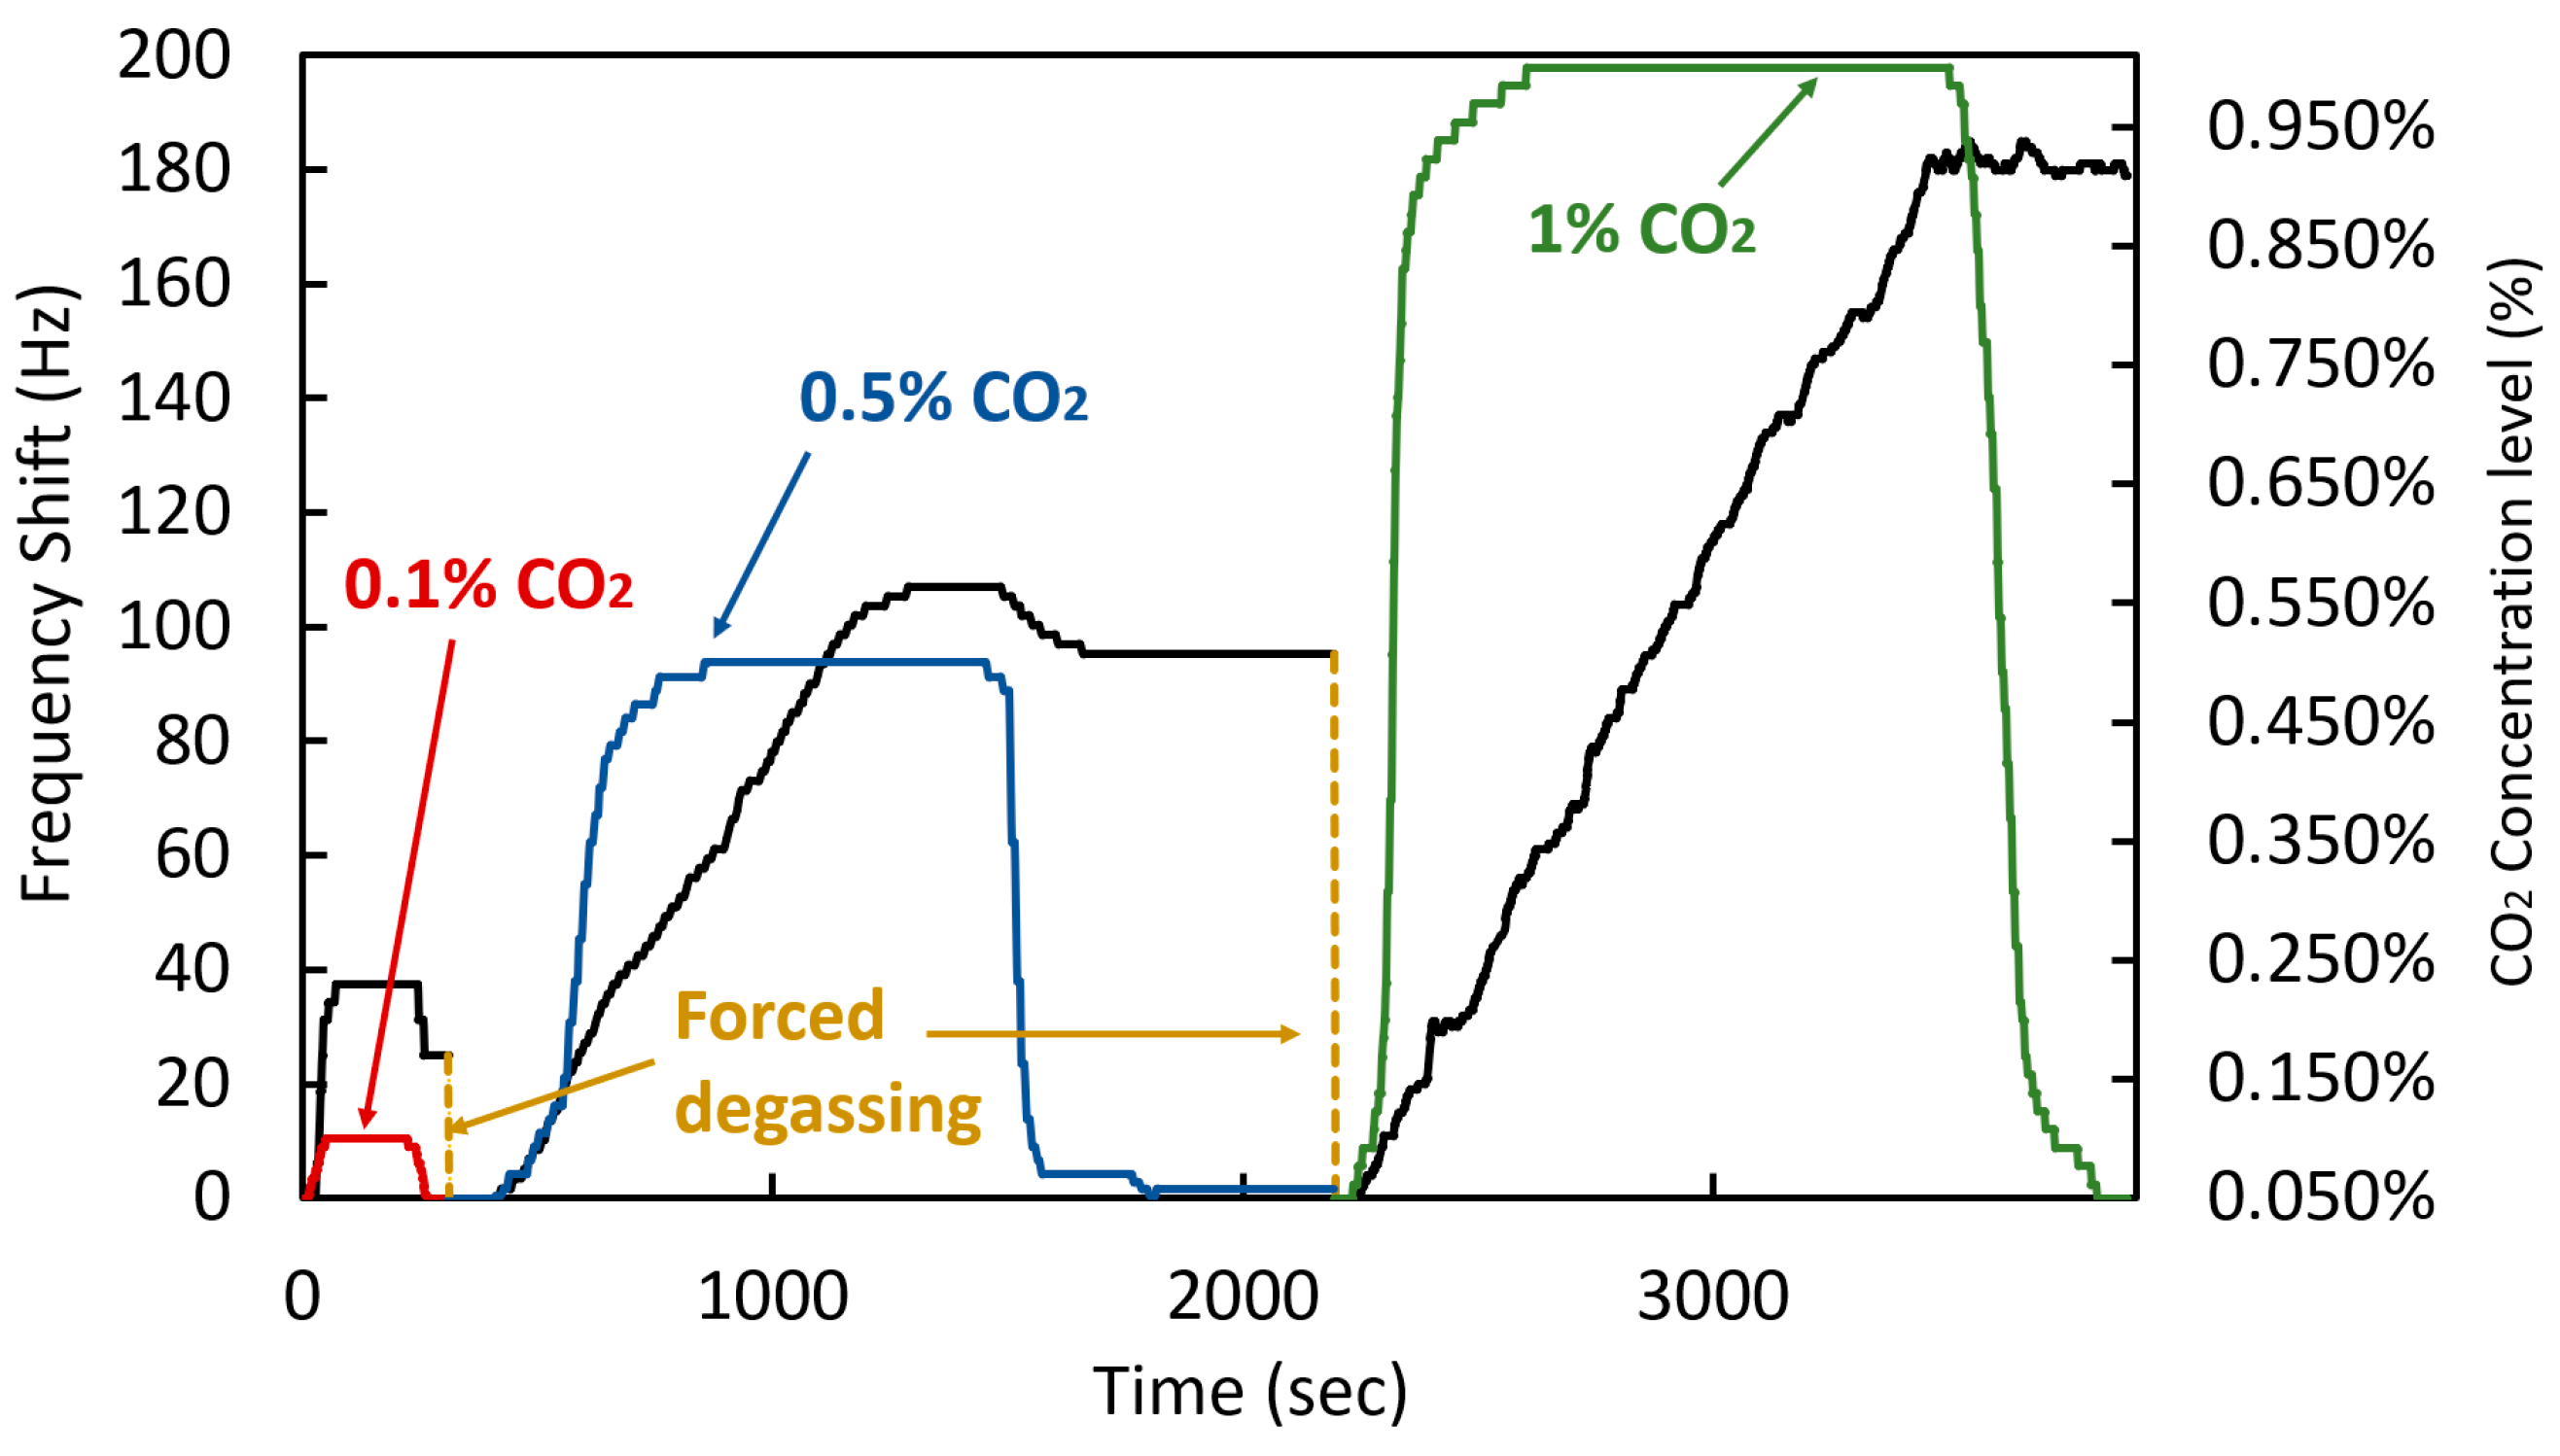
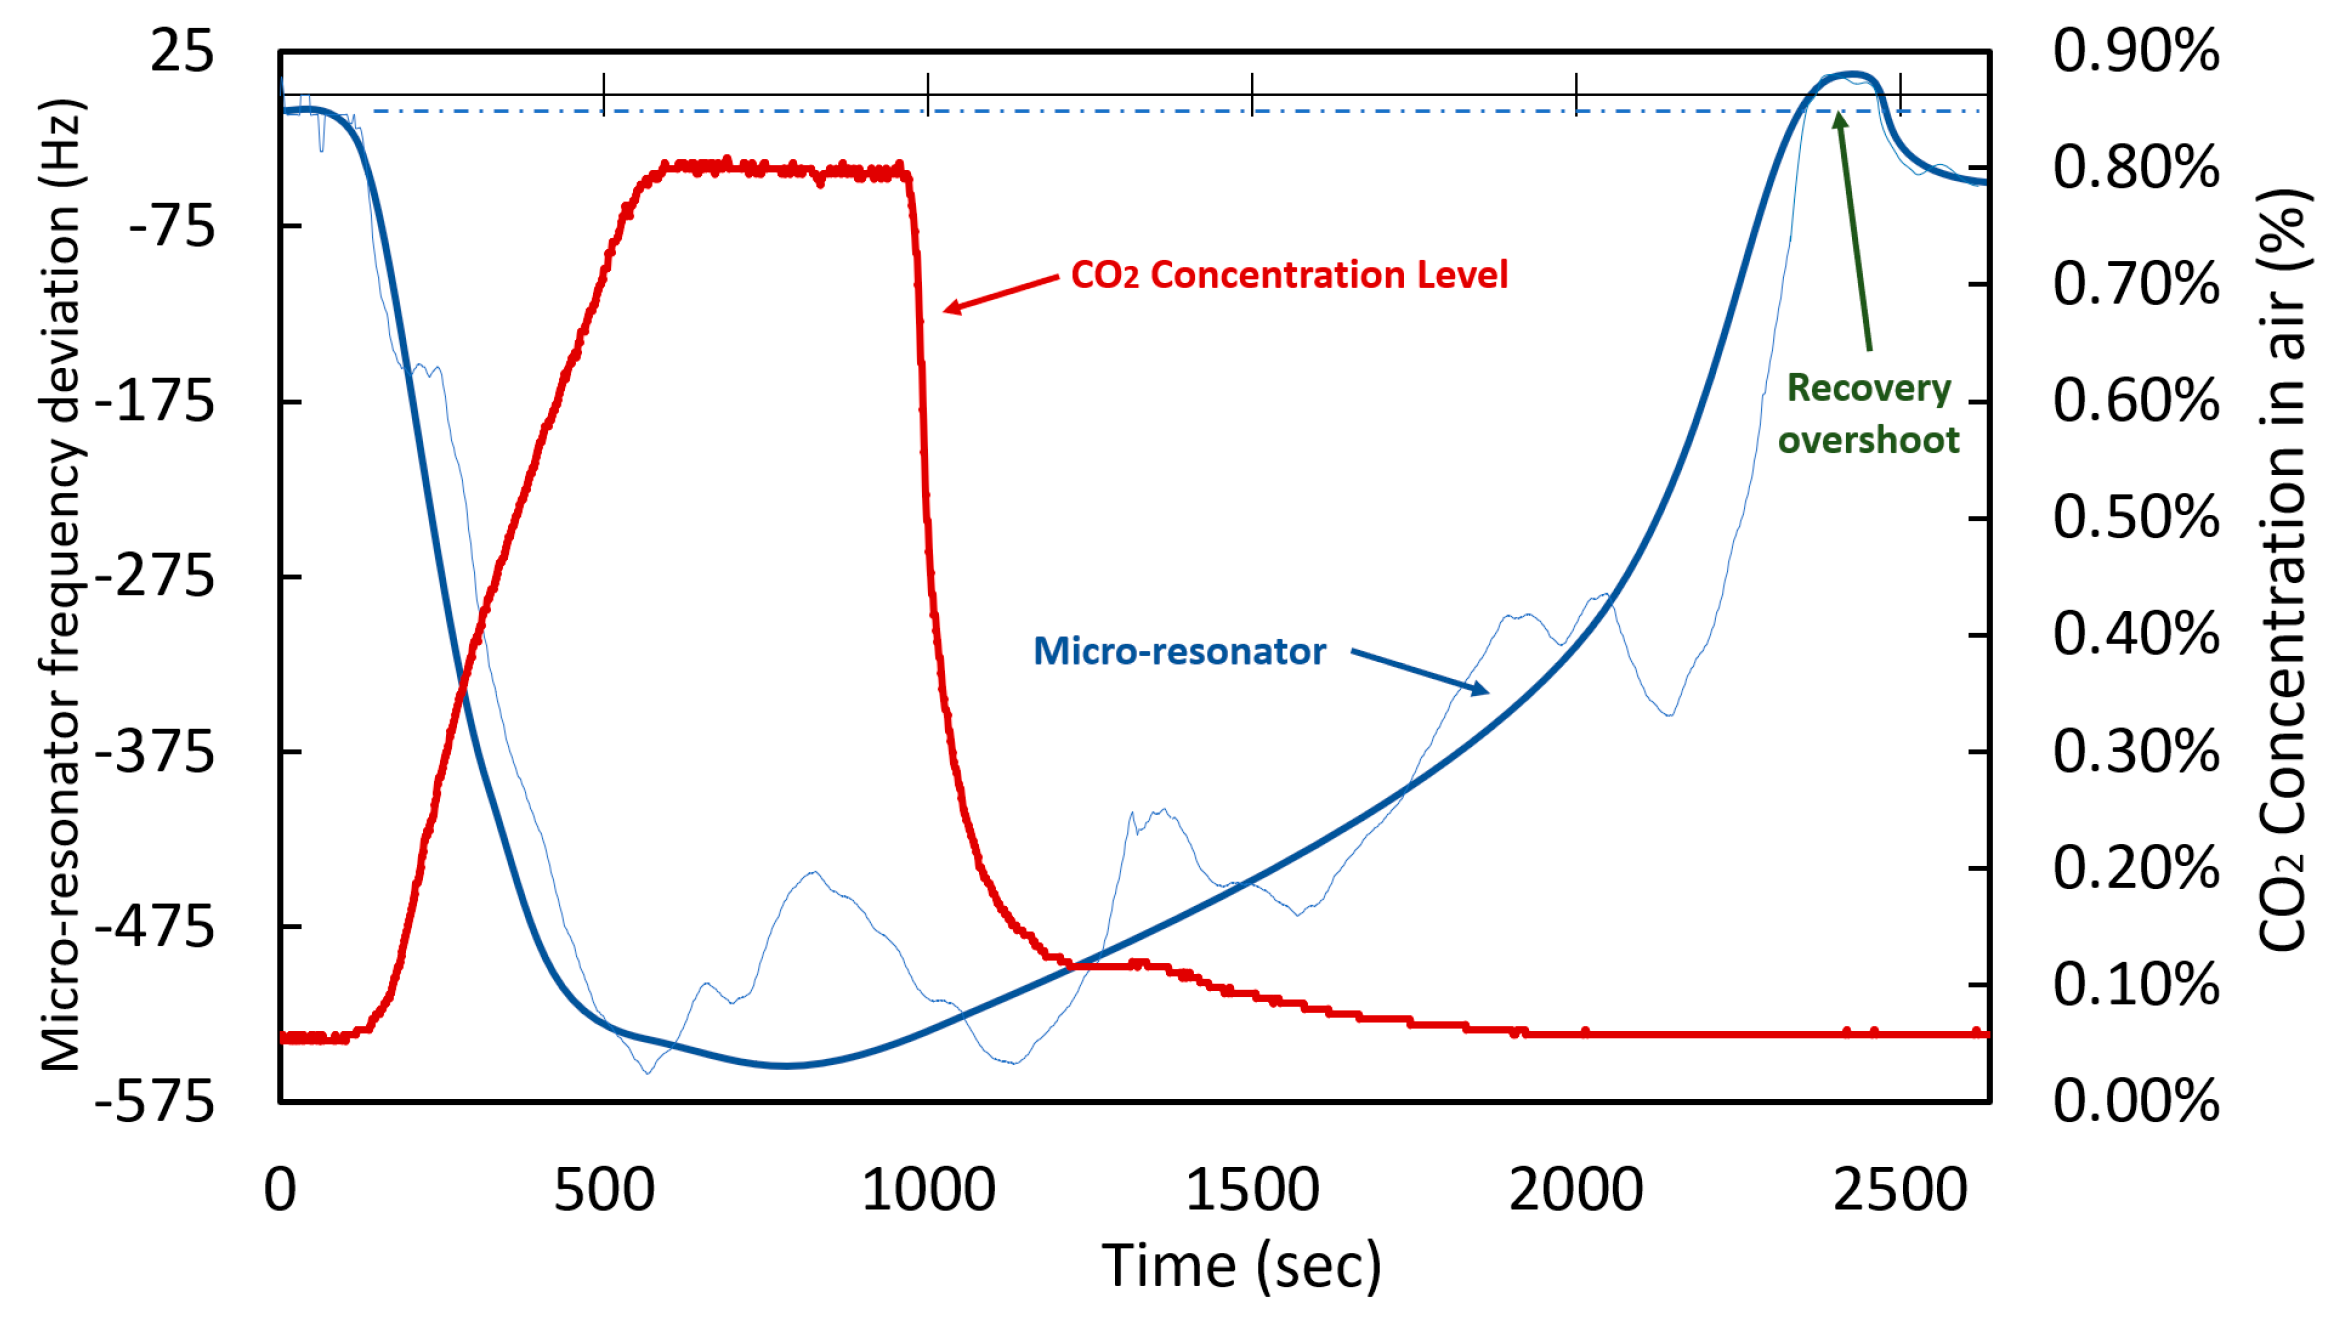
3.4. Micro-resonator CO2 Sensor Proof-of-concept
4. Discussion
5. Conclusions
Author Contributions
Funding
Acknowledgments
Conflicts of Interest
References
- Espinal, L.; Poster, D.L.; Wong-Ng, W.; Allen, A.J.; Green, M.L. Measurement, Standards, and Data Needs for CO2 Capture Materials: A Critical Review. Environ. Sci. Technol. 2013, 47, 11960–11975. [Google Scholar] [CrossRef] [PubMed]
- Mahyuddin, N.; Awbi, H. A Review of CO2 Measurement Procedures in Ventilation Research. Int. J. Vent. 2012, 10, 353–370. [Google Scholar] [CrossRef]
- Gas Sensor Market Size, Share & Trends Analysis Report By Product (CO2, NOx, CO, O2 Sensors), by Technology (Semiconductor, Infrared), by End Use (Building Automation & Domestic Appliance, Industrial), and Segment Forecasts, 2019–2025. Available online: https://www.grandviewresearch.com/industry-analysis/gas-sensors-market (accessed on 13 February 2020).
- Fernández-Ramos, M.D.; Moreno-Puche, F.; Escobedo, P.; García-López, P.A.; Capitán-Vallvey, L.F.; Martínez-Olmos, A. Optical portable instrument for the determination of CO2 in indoor environments. Talanta 2020, 208. [Google Scholar] [CrossRef] [PubMed]
- Ghosh, A.; Zhang, C.; Shi, S.; Zhang, H. High temperature CO2 sensing and its cross-sensitivity towards H2 and CO gas using calcium doped ZnO thin film coated langasite SAW sensor. Sensors Actuators B Chem. 2019, 301. [Google Scholar] [CrossRef]
- Hsu, K.C.; Fang, T.H.; Hsiao, Y.J.; Chan, C.A. Highly response CO2 gas sensor based on Au-La2O3 doped SnO2 nanofibers. Mater. Lett. 2020, 261. [Google Scholar] [CrossRef]
- Lin, Y.; Fan, Z. Compositing strategies to enhance the performance of chemiresistive CO2 gas sensors. Mater. Sci. Semicond Process 2020, 107. [Google Scholar] [CrossRef]
- Serban, B.; Kumar, A.S.; Costea, S.; Mihaila, M.; Buiu, O.; Brezeanu, M.; Varachiu, N.; Cobianu, C. Polymer-amino carbon nanotube nanocomposites for surface acoustic wave CO2 detection. Rom. J. Inf. Sci. Technol. 2009, 12, 376–384. [Google Scholar]
- Wang, R.; Zhang, M.; Guan, Y.; Chen, M.; Zhang, Y. A CO2-responsive hydrogel film for optical sensing of dissolved CO2. Soft Matter 2019, 15, 6107–6115. [Google Scholar] [CrossRef]
- Nazemi, H.; Joseph, A.; Park, J.; Emadi, A. Advanced Micro- and Nano-Gas Sensor Technology: A Review. Sensors 2019, 19, 1285. [Google Scholar] [CrossRef]
- Mo, Y.; Okawa, Y.; Tajima, M.; Nakai, T.; Yoshiike, N.; Natukawa, K. Micro-machined gas sensor array based on metal film micro-heater. Sensors Actuators B Chem. 2001, 79, 175–181. [Google Scholar] [CrossRef]
- Fang, Q.; Chetwynd, D.G.; Covington, J.A.; Toh, C.S.; Gardner, J.W. Micro-gas-sensor with conducting polymers. Sensors Actuators B Chem. 2002, 84, 66–71. [Google Scholar] [CrossRef]
- Aving. TCC ELT, 19 New CO₂ Sensors which Last up to 10 Years. 2013. Available online: http://us.aving.net/news/view.php?articleId=718053 (accessed on 20 February 2020).
- Fu, X.; Xu, L. A Micro-Resonant Gas Sensor with Nanometer Clearance between the Pole Plates. Sensors 2018, 18, 362. [Google Scholar] [CrossRef] [PubMed]
- Hajjaj, A.Z.; Jaber, N.; Alcheikh, N.; Younis, M.I. A Sensitive Resonant Gas Sensor Based on Multimode Excitation of a Buckled Beam. In Proceedings of the 2019 20th International Conference on Solid-State Sensors, Actuators and Microsystems & Eurosensors XXXIII (TRANSDUCERS & EUROSENSORS XXXIII), Berlin, Germany, 23–27 June 2019; pp. 769–772. [Google Scholar]
- Nguyen, C.C.; Ngo, V.K.T.; Le, H.Q.; Li, W.L. Influences of relative humidity on the quality factors of MEMS cantilever resonators in gas rarefaction. Microsyst. Technol. 2019, 25, 2767–2782. [Google Scholar] [CrossRef]
- Jaber, N.; Ilyas, S.; Shekhah, O.; Eddaoudi, M.; Younis, M.I. Multimode MEMS Resonator for Simultaneous Sensing of Vapor Concentration and Temperature. IEEE Sensors J. 2018, 18, 10145–10153. [Google Scholar] [CrossRef]
- Penza, M.; Aversa, P.; Cassano, G.; Wlodarski, W.; Kalantar-Zadeh, K. Layered SAW gas sensor with single-walled carbon nanotube-based nanocomposite coating. Sensors Actuators B Chem. 2007, 127, 168–178. [Google Scholar] [CrossRef]
- Fanget, S.; Hentz, S.; Puget, P.; Arcamone, J.; Matheron, M.; Colinet, E.; Andreucci, P.; Duraffourg, L.; Myers, E.; Roukes, M.L. Gas sensors based on gravimetric detection—A review. Sensors Actuators B Chem. 2011, 160, 804–821. [Google Scholar] [CrossRef]
- Smulko Janusz, M. New approaches for improving selectivity and sensitivity of resistive gas sensors: A review. Sensor Rev. 2015, 35, 340–347. [Google Scholar] [CrossRef]
- Sun, L.-B.; Kang, Y.-H.; Shi, Y.-Q.; Jiang, Y.; Liu, X.-Q. Highly Selective Capture of the Greenhouse Gas CO2 in Polymers. ACS Sustain. Chem. Eng. 2015, 3, 3077–3085. [Google Scholar] [CrossRef]
- Bouchaala, A.; Nayfeh, A.H.; Younis, M.I. Analytical study of the frequency shifts of micro and nano clamped–clamped beam resonators due to an added mass. Meccanica 2017, 52, 333–348. [Google Scholar] [CrossRef]
- Liu, F.; Fu, W.; Chen, S. Synthesis, characterization and CO2 adsorption performance of a thermosensitive solid amine adsorbent. J. CO2 Util. 2019, 31, 98–105. [Google Scholar] [CrossRef]
- Ünveren, E.E.; Monkul, B.Ö.; Sarıoğlan, Ş.; Karademir, N.; Alper, E. Solid amine sorbents for CO2 capture by chemical adsorption: A review. Petroleum 2017, 3, 37–50. [Google Scholar] [CrossRef]
- Irani, M.; Jacobson, A.T.; Gasem, K.A.M.; Fan, M. Facilely synthesized porous polymer as support of poly(ethyleneimine) for effective CO2 capture. Energy 2018, 157, 1–9. [Google Scholar] [CrossRef]
- Sehaqui, H.; Gálvez, M.E.; Becatinni, V.; Cheng Ng, Y.; Steinfeld, A.; Zimmermann, T.; Tingaut, P. Fast and Reversible Direct CO2 Capture from Air onto All-Polymer Nanofibrillated Cellulose—Polyethylenimine Foams. Environ. Sci. Technol. 2015, 49, 3167–3174. [Google Scholar] [CrossRef] [PubMed]
- Ben Hamouda, S.; Roudesli, S. Transport properties of PVA/PEI/PEG composite membranes: Sorption and permeation characterizations. Cent. Eur. J. Chem. 2008, 6, 634–640. [Google Scholar] [CrossRef]
- Xian, S.; Wu, Y.; Wu, J.; Wang, X.; Xiao, J. Enhanced Dynamic CO2 Adsorption Capacity and CO2/CH4 Selectivity on Polyethylenimine-Impregnated UiO-66. Ind. Eng. Chem. Res. 2015, 54, 11151–11158. [Google Scholar] [CrossRef]
- Sun, B.; Xie, G.; Jiang, Y.; Li, X. Comparative CO2-Sensing Characteristic Studies of PEI and PEI/Starch Thin Film Sensors. Energy Procedia 2011, 12, 726–732. [Google Scholar] [CrossRef]
- Bhanja, P.; Das, S.K.; Patra, A.K.; Bhaumik, A. Functionalized graphene oxide as an efficient adsorbent for CO2 capture and support for heterogeneous catalysis. RSC Adv. 2016, 6, 72055–72068. [Google Scholar] [CrossRef]
- Kim, N.; Xin, G.; Cho, S.M.; Pang, C.; Chae, H. Microwave-reduced graphene oxide for efficient and stable hole extraction layers of polymer solar cells. Curr. Appl. Phys. 2015, 15, 953–957. [Google Scholar] [CrossRef]
- Kato, F.; Noguchi, H.; Kodaka, Y.; Chiku, N.; Shibata, H.; Abe, F.; Ogi, H. Multi-channel wireless quartz crystal microbalance biosensor fabricated with poly(dimethylsiloxane). In Proceedings of the 2017 19th International Conference on Solid-State Sensors, Actuators and Microsystems (TRANSDUCERS), Kaohsiung, Taiwan, 18–22 June 2017; pp. 1664–1667. [Google Scholar]
- Branched Polyethylenimine by Sigma-Aldrich. Available online: https://www.sigmaaldrich.com/catalog/product/aldrich/408727?lang=en®ion=CA (accessed on 20 December 2019).
- Lineal Polyethylenimine by Sigma-Aldrich. Available online: https://www.sigmaaldrich.com/catalog/product/aldrich/765090?lang=en®ion=CA (accessed on 20 December 2019).
- Vieira, R.B.; Pastore, H.O. Polyethylenimine-Magadiite Layered Silicate Sorbent for CO2 Capture. Environ. Sci. Technol. 2014, 48, 2472–2480. [Google Scholar] [CrossRef]
- Yoon, H.J.; Jun, D.H.; Yang, J.H.; Zhou, Z.; Yang, S.S.; Cheng, M.M.-C. Carbon dioxide gas sensor using a graphene sheet. Sensors Actuators B Chem. 2011, 157, 310–313. [Google Scholar] [CrossRef]
- Basu, S.; Bhattacharyya, P. Recent developments on graphene and graphene oxide based solid state gas sensors. Sensors Actuators B Chem. 2012, 173, 1–21. [Google Scholar] [CrossRef]
- Chen, W.; Yan, L.; Bangal, P.R. Preparation of graphene by the rapid and mild thermal reduction of graphene oxide induced by microwaves. Carbon 2010, 48, 1146–1152. [Google Scholar] [CrossRef]
- Pei, S.; Cheng, H.-M. The reduction of graphene oxide. Carbon 2012, 50, 3210–3228. [Google Scholar] [CrossRef]
- Liu, L.; Zou, G.; Yang, B.; Luo, X.; Xu, S. Amine-Functionalized Mesoporous Silica @ Reduced Graphene Sandwichlike Structure Composites for CO2 Adsorption. ACS Appl. Nano Mater. 2018, 1, 4695–4702. [Google Scholar] [CrossRef]
- Zhang, Y.; Yu, K.; Xu, R.; Jiang, D.; Luo, L.; Zhu, Z. Quartz crystal microbalance coated with carbon nanotube films used as humidity sensor. Sensors Actuators A Phys. 2005, 120, 142–146. [Google Scholar] [CrossRef]
- Zhao, R.; Li, X.; Sun, B.; Li, Y.; Li, Y.; Yang, R.; Wang, C. Branched polyethylenimine grafted electrospun polyacrylonitrile fiber membrane: A novel and effective adsorbent for Cr(vi) remediation in wastewater. J. Mater. Chem. A 2017, 5, 1133–1144. [Google Scholar] [CrossRef]
- Lott, G.A.; King, M.D.; Hill, M.W.; Scatena, L.F. Effects of Relative Humidity on the Surface and Bulk Structures of Linear Polyethylenimine Thin Films. J. Phys. Chem. C 2014, 118, 17686–17698. [Google Scholar] [CrossRef]
- Wang, X.; Schwartz, V.; Clark, J.C.; Ma, X.; Overbury, S.H.; Xu, X.; Song, C. Infrared Study of CO2 Sorption over “Molecular Basket” Sorbent Consisting of Polyethylenimine-Modified Mesoporous Molecular Sieve. J. Phys. Chem. C 2009, 113, 7260–7268. [Google Scholar] [CrossRef]
- Zhao, Y.; Ding, H.; Zhong, Q. Preparation and characterization of aminated graphite oxide for CO2 capture. Appl. Surf. Sci. 2012, 258, 4301–4307. [Google Scholar] [CrossRef]
- Song, Y.; Cao, L.; Yu, J.; Zhang, S.; Chen, S.; Jiang, Y. Amino-functionalized graphene oxide blend with monoethanolamine for efficient carbon dioxide capture. J. Alloys Compd. 2017, 704, 245–253. [Google Scholar] [CrossRef]
- Niu, M.; Yang, H.; Zhang, X.; Wang, Y.; Tang, A. Amine-Impregnated Mesoporous Silica Nanotube as an Emerging Nanocomposite for CO2 Capture. ACS Appl. Mater. Interfaces 2016, 8, 17312–17320. [Google Scholar] [CrossRef] [PubMed]
- Cai, H.; Bao, F.; Gao, J.; Chen, T.; Wang, S.; Ma, R. Preparation and characterization of novel carbon dioxide adsorbents based on polyethylenimine-modified Halloysite nanotubes. Environ. Technol. 2015, 36, 1273–1280. [Google Scholar] [CrossRef] [PubMed]
- Zhang, H.; Goeppert, A.; Prakash, G.K.S.; Olah, G. Applicability of linear polyethylenimine supported on nano-silica for the adsorption of CO2 from various sources including dry air. RSC Adv. 2015, 5, 52550–52562. [Google Scholar] [CrossRef]
- Doan, T.C.D.; Baggerman, J.; Ramaneti, R.; Tong, H.D.; Marcelis, A.T.M.; van Rijn, C.J.M. Carbon dioxide detection with polyethylenimine blended with polyelectrolytes. Sensors Actuators B Chem. 2014, 201, 452–459. [Google Scholar] [CrossRef]
- Al-Marri, M.J.; Kuti, Y.O.; Khraisheh, M.; Kumar, A.; Khader, M.M. Kinetics of CO2 Adsorption/Desorption of Polyethyleneimine-Mesoporous Silica. Chem. Eng. Technol. 2017, 40, 1802–1809. [Google Scholar] [CrossRef]
- Aghehrochaboki, R.; Aghdoud Chaboki, Y.; Maleknia, S.A.; Irani, V. Polyethyleneimine functionalized graphene oxide/methyldiethanolamine nanofluid: Preparation, characterization, and investigation of CO2 absorption. J. Environ. Chem. Eng. 2019, 7, 103285. [Google Scholar] [CrossRef]
- Andreoli, E.; Cullum, L.; Barron, A.R. Carbon Dioxide Absorption by Polyethylenimine-Functionalized Nanocarbons: A Kinetic Study. Ind. Eng. Chem. Res. 2015, 54, 878–889. [Google Scholar] [CrossRef]
- Muraoka, S.; Kiyohara, Y.; Oue, H.; Higashimoto, S. A CO2 Sensor Using a Quartz Crystal Microbalance Coated with a Sensitive Membrane. Electron. Commun. Japan 2014, 97, 60–66. [Google Scholar] [CrossRef]
- Gomes, M.T.; Duarte, A.C.; Oliveira, J.P. Detection of CO2 using a qaurtz crystal microbalance. Sensors Actuators B Chem. 1995, 26, 191–194. [Google Scholar] [CrossRef]
- Ong, K.G.; Grimes, C.A. A Carbon Nanotube-based Sensor for CO2 Monitoring. Sensors 2001, 1, 193–205. [Google Scholar] [CrossRef]
- Andò, B.; Baglio, S.; Di Pasquale, G.; Pollicino, A.; D’Agata, S.; Gugliuzzo, C.; Lombardo, C.; Re, G. An Inkjet Printed CO2 Gas Sensor. Procedia Eng. 2015, 120, 628–631. [Google Scholar] [CrossRef]
- Boudaden, J.; Klumpp, A.; Endres, H.-E.; Eisele, I. Towards Low Cost and Low Temperature Capacitive CO2 Sensors Based on Amine Functionalized Silica Nanoparticles. Nanomaterials 2019, 9, 1097. [Google Scholar] [CrossRef] [PubMed]
- Ma, W.; Wang, R.; Rong, Q.; Shao, Z.; Zhang, W.; Guo, T.; Wang, J.; Qiao, X. CO2 Gas Sensing Using Optical Fiber Fabry–Perot Interferometer Based on Polyethyleneimine/Poly(Vinyl Alcohol) Coating. IEEE Photonics J. 2017, 9, 1–8. [Google Scholar] [CrossRef]
- Clifford, J.; Mulrooney, J.; Dooly, G.; Fitzpatrick, C.; Lewis, E.; Merlone-Borla, E.; Flavia, G. On board measurement of carbon dioxide exhaust car emissions using a mid-infrared optical based fibre. In Proceedings of the SENSORS, 2008 IEEE, Lecce, Italy, 26–29 October 2008; pp. 914–918. [Google Scholar]
- Sutela, C.; Collings, N.; Hands, T. Fast Response CO2 Sensor for Automotive Exhaust Gas Analysis; SAE International: Warrendale, PA, USA, 1999. [Google Scholar] [CrossRef]
- Singh, O.P.; Howe, T.A.; Malarvili, M.B. Real-time human respiration carbon dioxide measurement device for cardiorespiratory assessment. J. Breath Res. 2018, 12, 026003. [Google Scholar] [CrossRef]


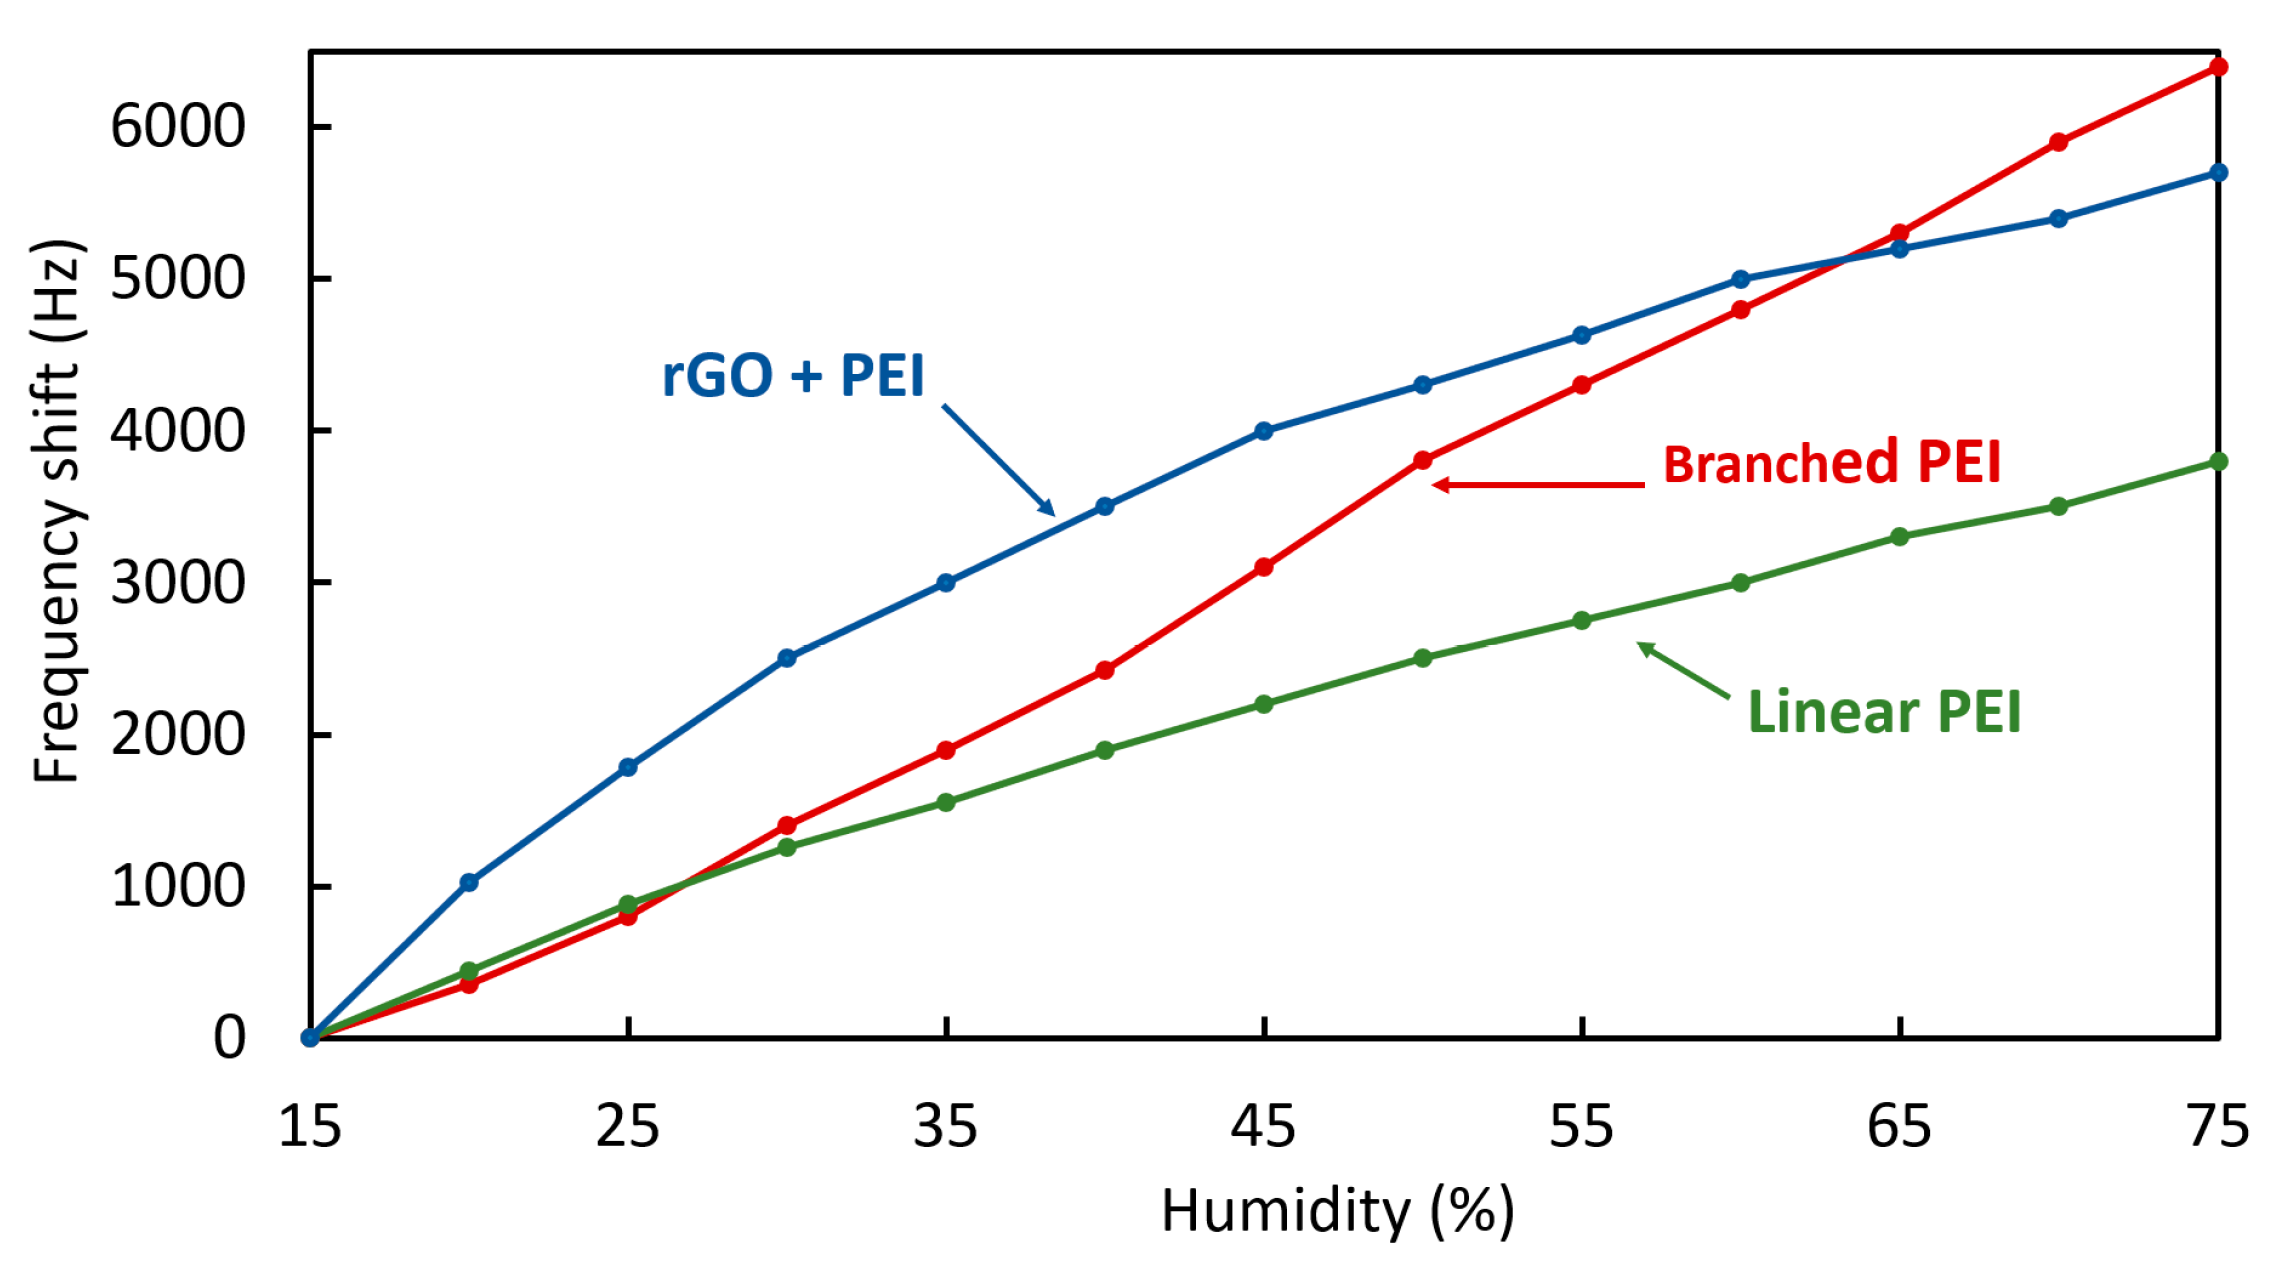
| Branched PEI | Linear PEI | Linear PEI + rGO | |
|---|---|---|---|
| 0.1% CO2 | 27 | 33.6 | 37.5 |
| 0.5% CO2 | 45 | 101 | 107 |
| 1% CO2 | 92 | 145 | 185 |
| Branched PEI | Linear PEI | Linear PEI + rGO |
|---|---|---|
| 0.011 Hz/ppm | 0.016 Hz/ppm | 0.020 Hz/ppm |
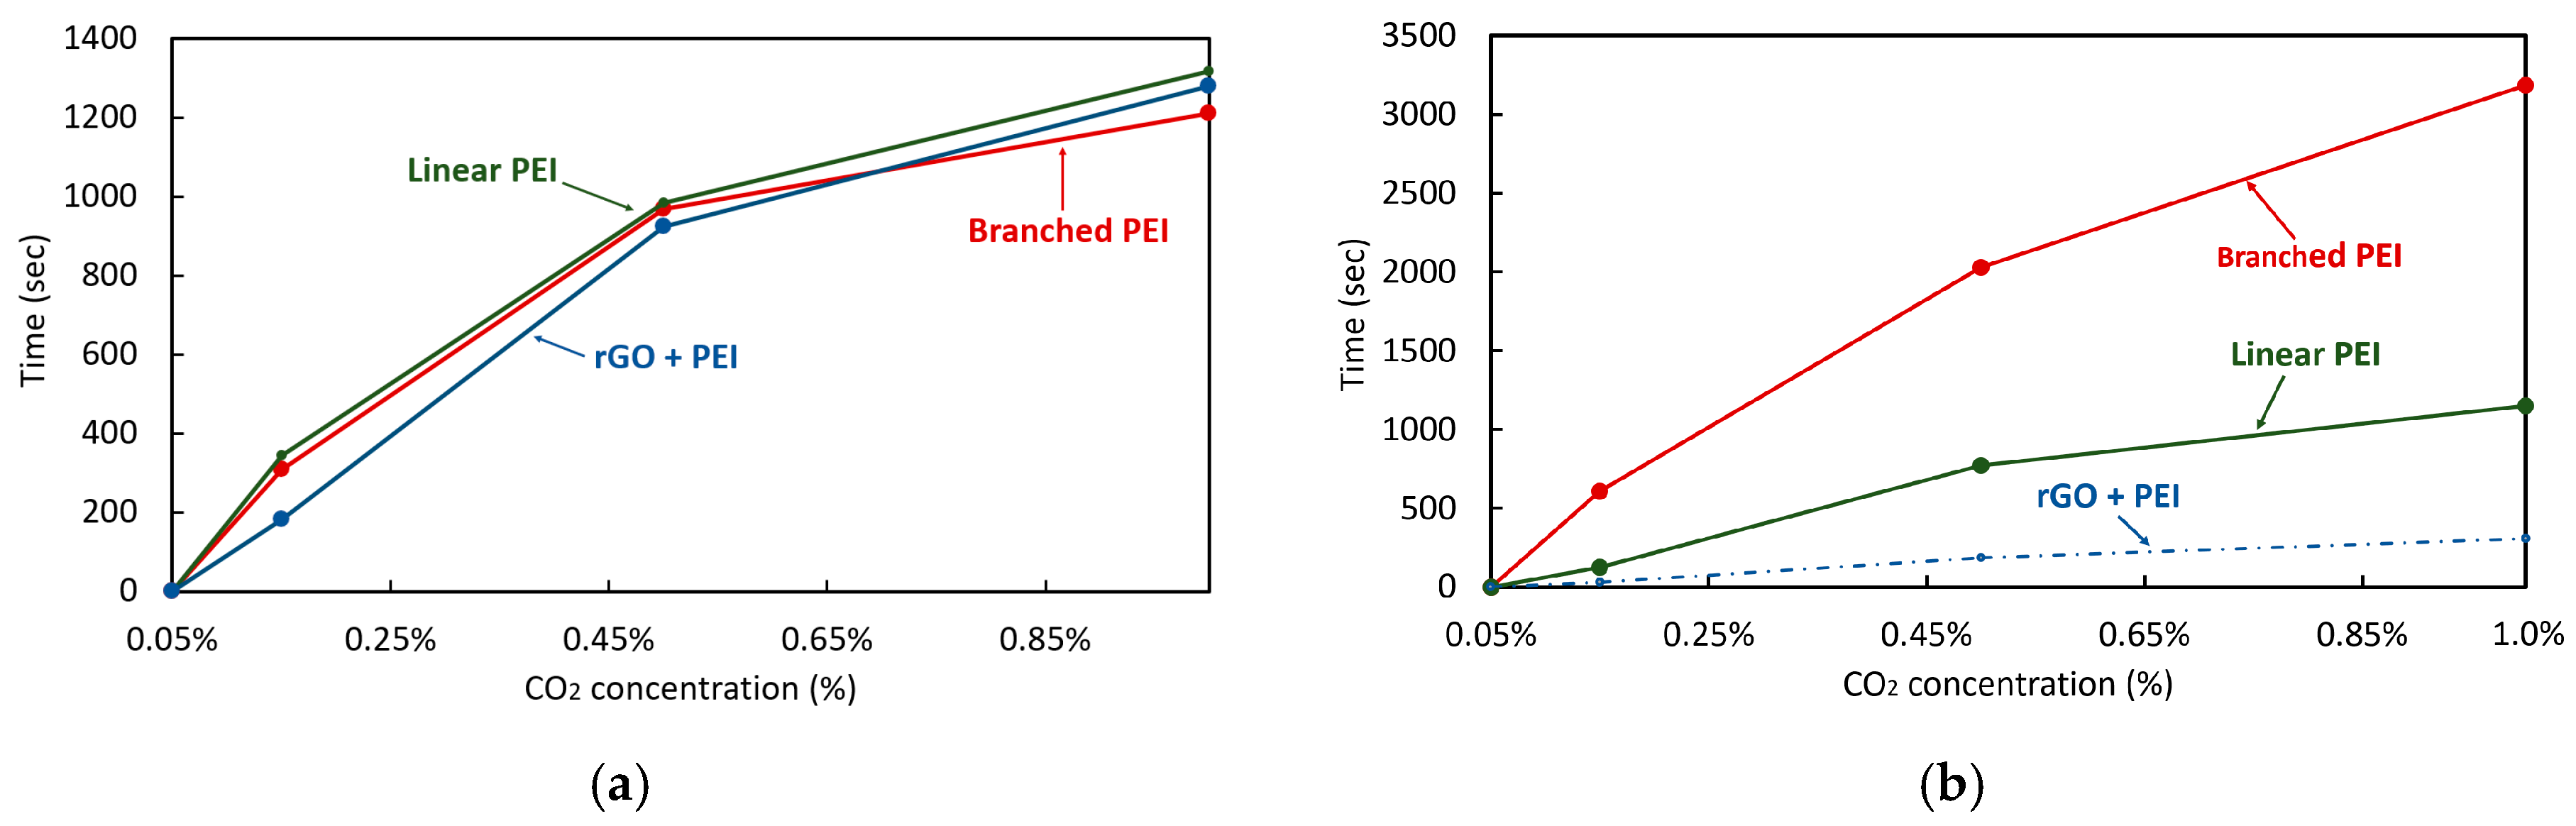
| Branched PEI | Linear PEI | rGO + PEI | |
|---|---|---|---|
| 0.1% CO2 | 309 sec | 345 sec | 150 sec |
| 0.5% CO2 | 969 sec | 984 sec | 924 sec |
| 1.0% CO2 | 1210 sec | 1317 sec | 1281 sec |
| Branched PEI | Linear PEI | Linear PEI with rGO | |
|---|---|---|---|
| 0.1% CO2 | 609 sec | 126 sec | n/a |
| 0.5% CO2 | 2031 sec | 771 sec | n/a |
| 1.0% CO2 | 3187 sec | 1152 sec | n/a |
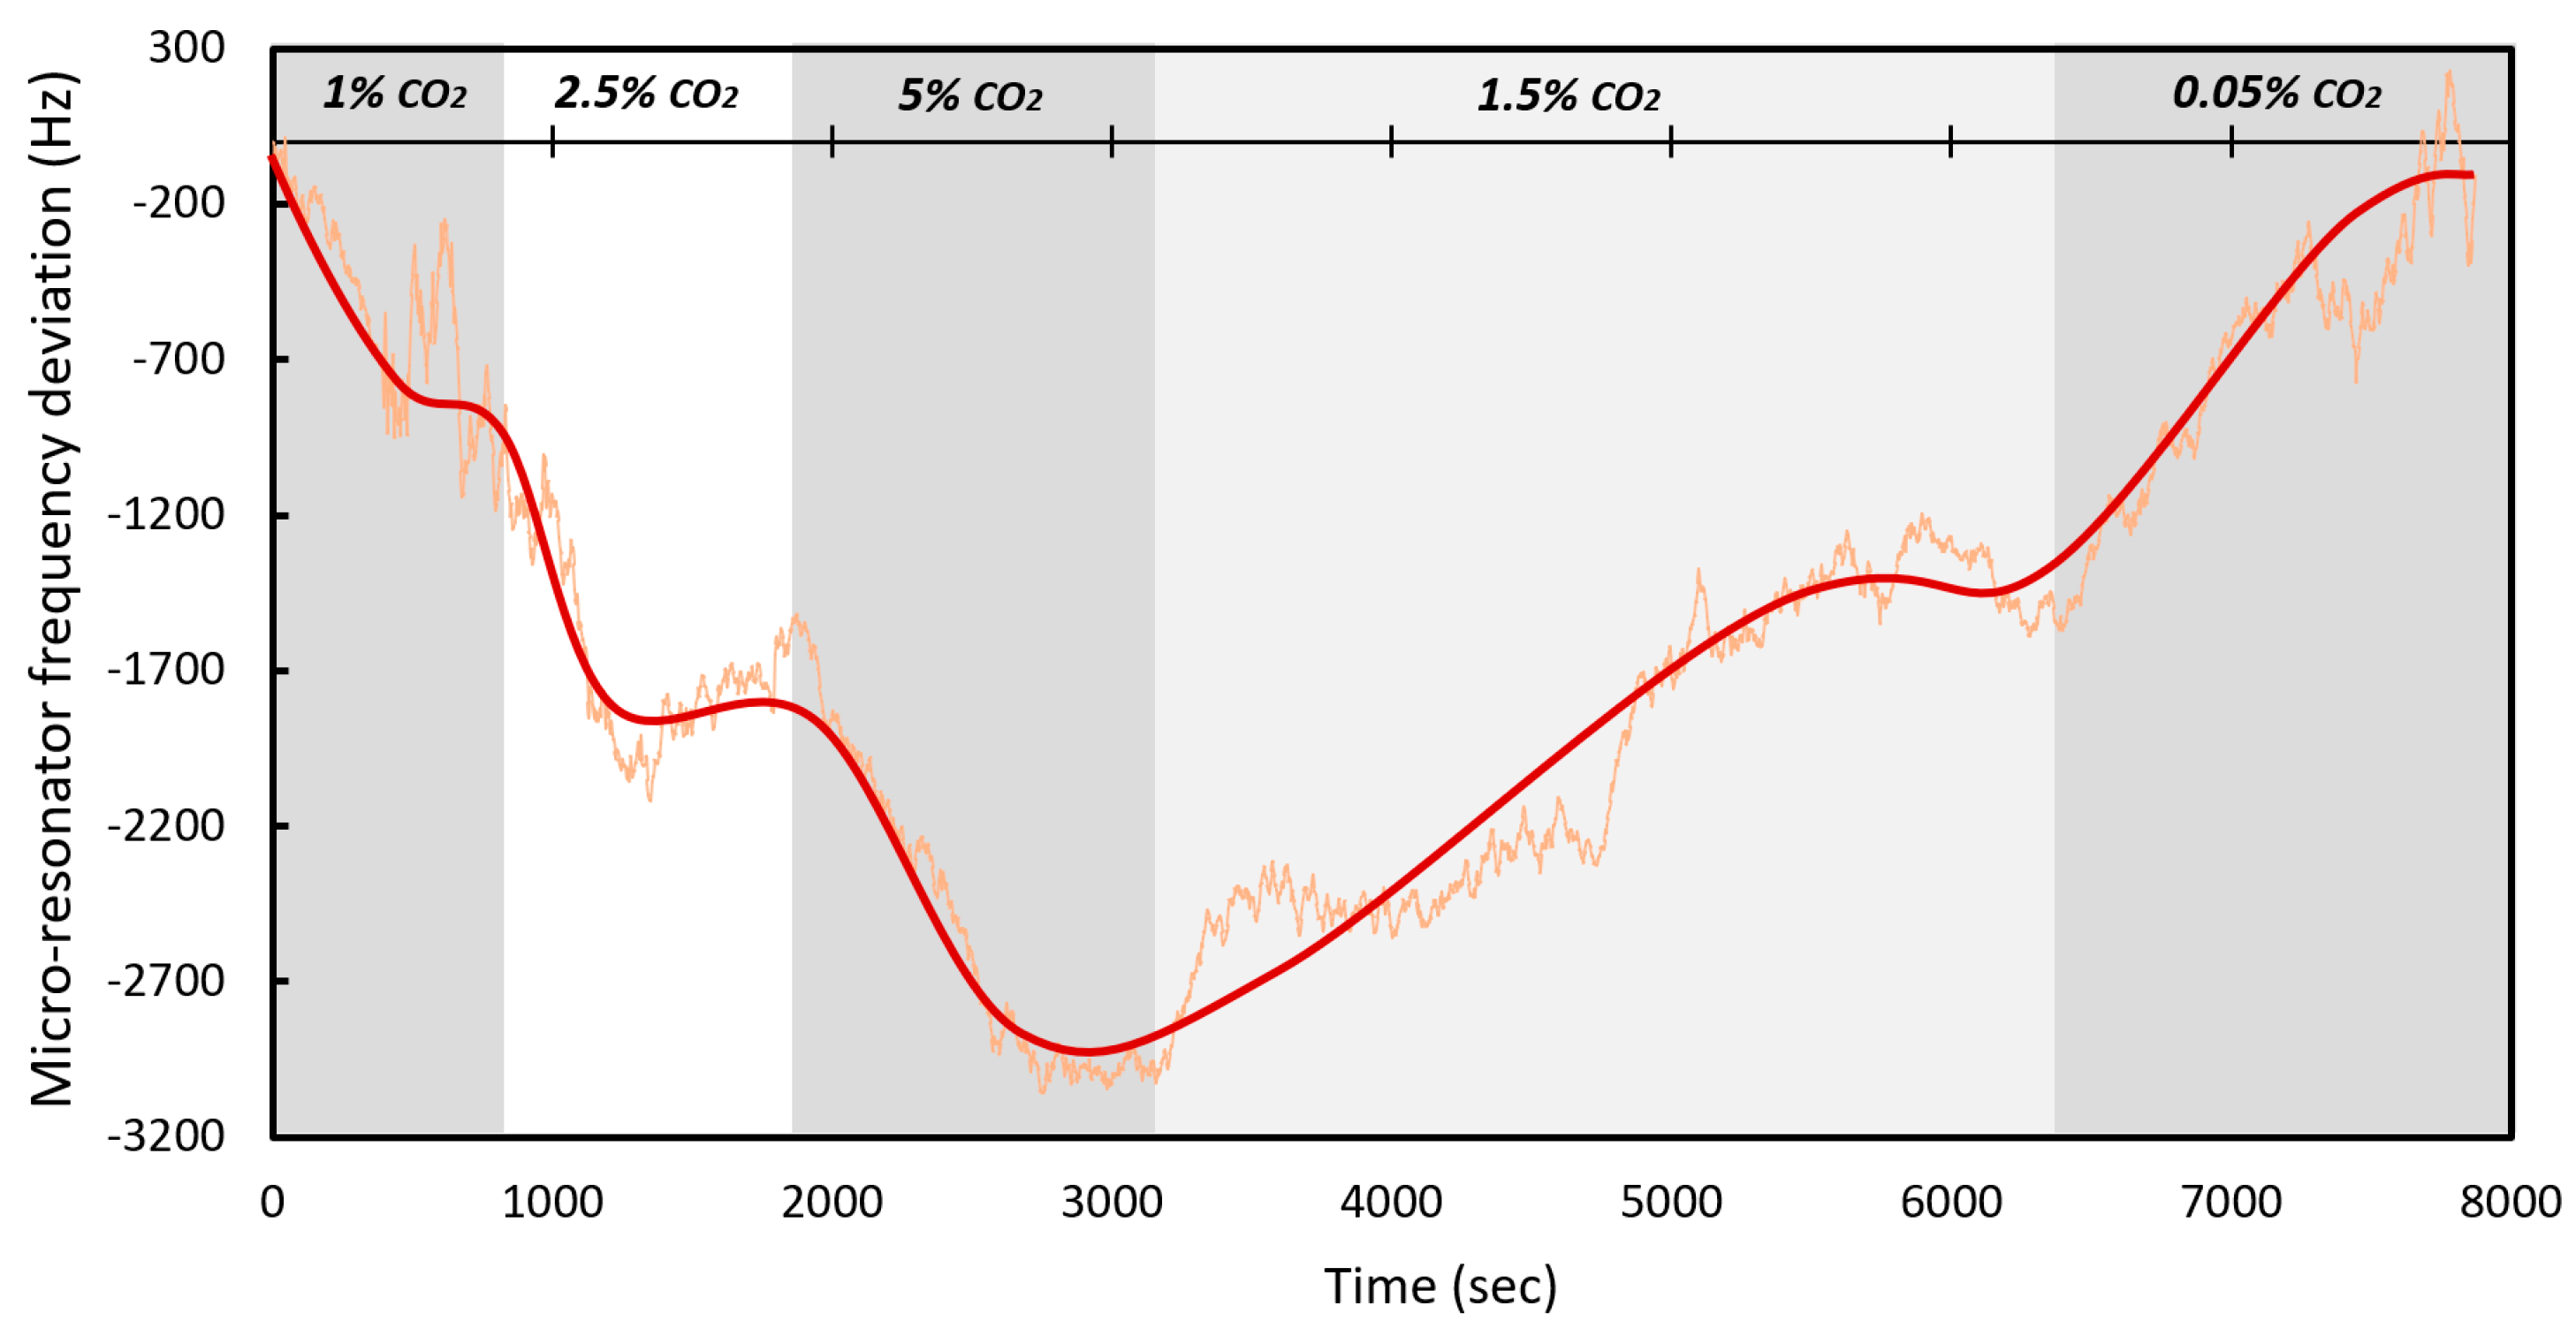
| Concentration Period | Frequency Shift (Hz) from the Last Level | Hz/ppm |
|---|---|---|
| 1% | 750 | 0.075 |
| 2.5% | 1050 | 0.07 |
| 5% | 1200 | 0.048 |
| 1.5% | −1600 | −0.045 |
| 0.05% | −1350 | −0.085 |
| Average (Hz/ppm) | 0.0646 |
| Sensing Material | CO2 Level | Sensor Output | Sensor Response (ppm) | Test Device | Adsorption Time (min) | Recovery Time (min) | |
|---|---|---|---|---|---|---|---|
| This work | Linear PEI | 0.5% | Frequency | −16.8 | 6 MHz gold quartz crystal | 16.4 | 12.85 |
| Branched PEI | 0.5% | Frequency | −7.5 | 6 MHz gold quartz crystal | 16.15 | 33.85 | |
| rGO + Linear PEI | 0.5% | Frequency | −17.8 | 6 MHz gold quartz crystal | 15.4 | n/a | |
| Linear PEI | 0.8% | Frequency | −474 | 1.13 MHz diaphragmmicro-resonator | 13.5 | 20.4 | |
| Sun et al. [29] | PEI ** | 0.5% | Frequency | −3.33 | 7 MHz AT-cut quartz crystal | 11.7 | 20.7 |
| Sun et al. [29] | PEI ** + Starch | 0.5% | Frequency | −11.66 | 7 MHz AT-cut quartz crystal | 18.9 | 21.6 |
| Muraoka et al. [54] | acrylonitrile–styrene copolymer (AS2) | 20% | Frequency | −7.5 | 10 MHz AT-cut quartz crystal | 6 | 11 |
| Muraoka et al. [54] | acrylonitrile–styrene copolymer (AS3) | 20% | Frequency | −20 | 10 MHz AT-cut quartz crystal | 7 | 11 |
| Gomes et al. [55] | 1,2-diaminoethane | 5 ml | Frequency | −25 | 9 MHz AT-cut quartz crystal | N/A | N/A |
| Doan et al. [50] | Linear PEI with polyelectrolytes | 1.0% | Impedance | 3e6 | Coated silicon chip | 16.5 | 41.6 |
| Ing et al. [56] | Carbon nanotubes (MWNTs) | 20% | Permittivity | −1800 | Coated plates | 1.1 | 1.3 |
| Ando et al. [57] | Graphene with PEDOT/PSS | 0.2% | Impedance | 2050 | Coated plates | 2 | N/A |
| Boudaden et al. [58] | Branched PEI with Silica | 0.1% | Capacitance | −105e3 | Coated plates | 5 | 8 |
| Ma et al. [59] | PEI with Vinyl Alcohol | 15.4% | Wavelength | 4000 | Optic fiber coated | 0.5 | 0.2 |
© 2020 by the authors. Licensee MDPI, Basel, Switzerland. This article is an open access article distributed under the terms and conditions of the Creative Commons Attribution (CC BY) license (http://creativecommons.org/licenses/by/4.0/).
Share and Cite
Prud’homme, A.; Nabki, F. Comparison between Linear and Branched Polyethylenimine and Reduced Graphene Oxide Coatings as a Capture Layer for Micro Resonant CO2 Gas Concentration Sensors. Sensors 2020, 20, 1824. https://doi.org/10.3390/s20071824
Prud’homme A, Nabki F. Comparison between Linear and Branched Polyethylenimine and Reduced Graphene Oxide Coatings as a Capture Layer for Micro Resonant CO2 Gas Concentration Sensors. Sensors. 2020; 20(7):1824. https://doi.org/10.3390/s20071824
Chicago/Turabian StylePrud’homme, Alberto, and Frederic Nabki. 2020. "Comparison between Linear and Branched Polyethylenimine and Reduced Graphene Oxide Coatings as a Capture Layer for Micro Resonant CO2 Gas Concentration Sensors" Sensors 20, no. 7: 1824. https://doi.org/10.3390/s20071824
APA StylePrud’homme, A., & Nabki, F. (2020). Comparison between Linear and Branched Polyethylenimine and Reduced Graphene Oxide Coatings as a Capture Layer for Micro Resonant CO2 Gas Concentration Sensors. Sensors, 20(7), 1824. https://doi.org/10.3390/s20071824