A Model Test for the Influence of Lateral Pressure on Vertical Bearing Characteristics in Pile Jacking Process Based on Optical Sensors


Abstract
1. Introduction
2. Test Plan
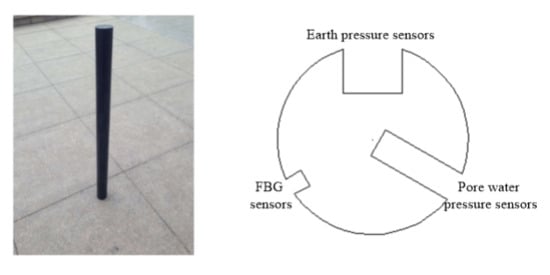
2.1. Model Pile
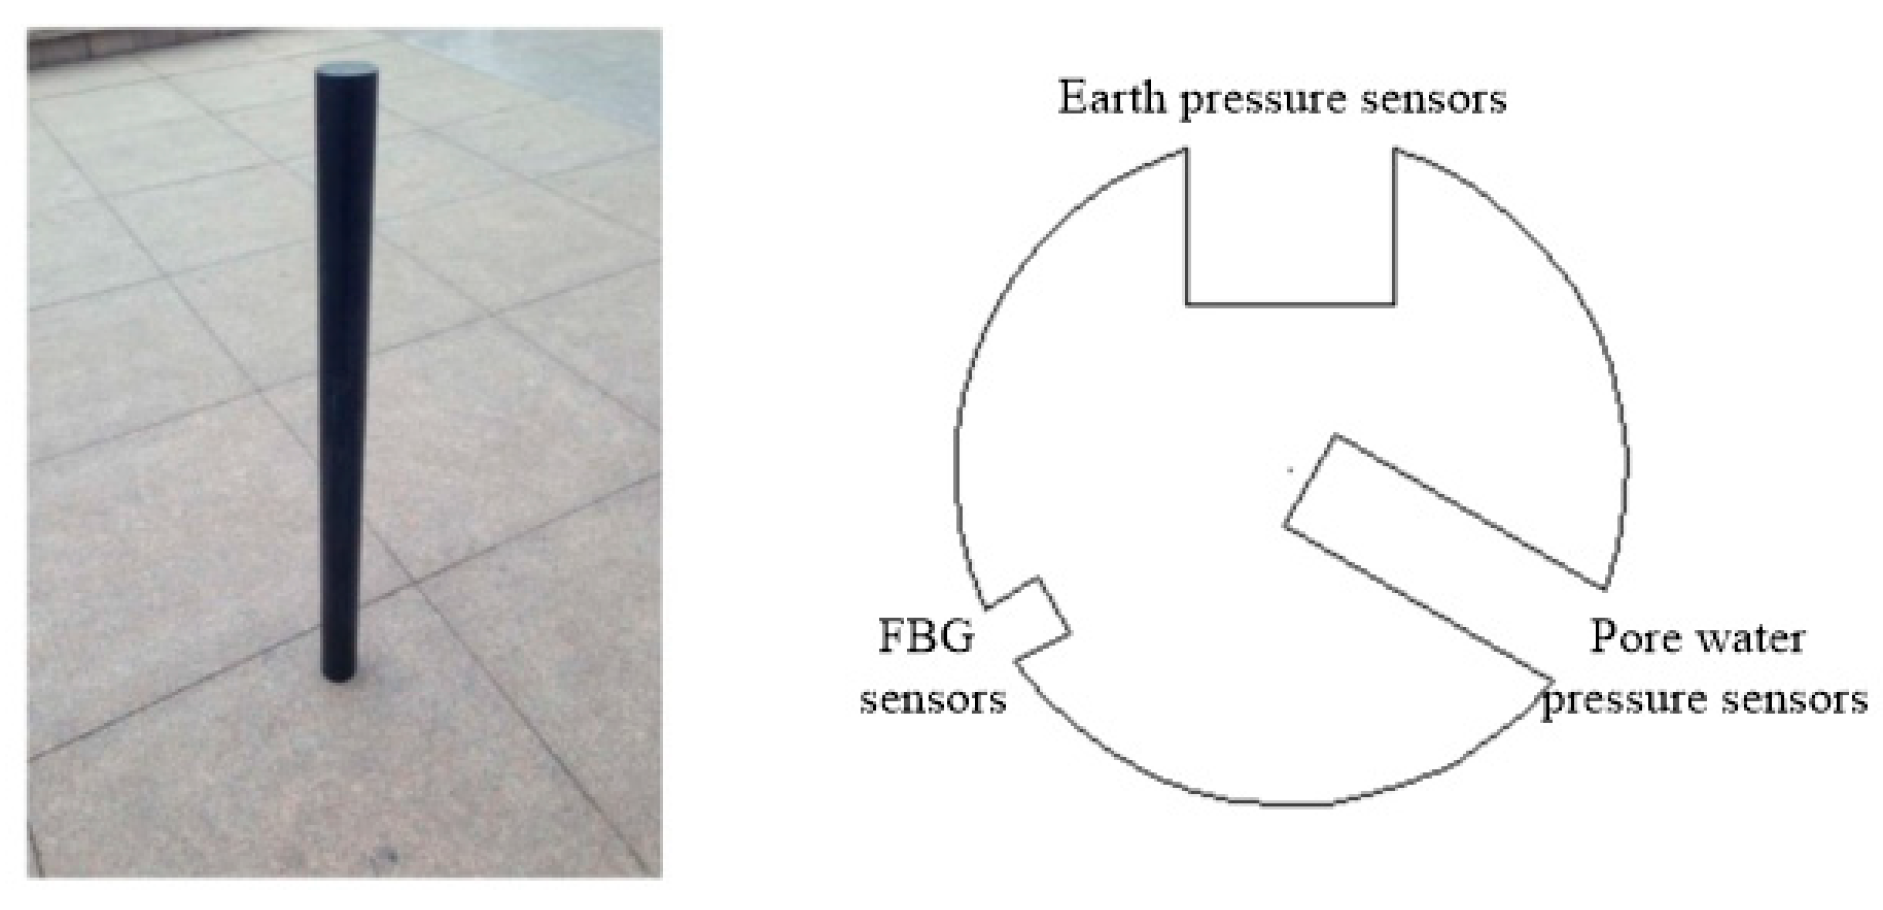
2.2. Model Bucket and Loading Device
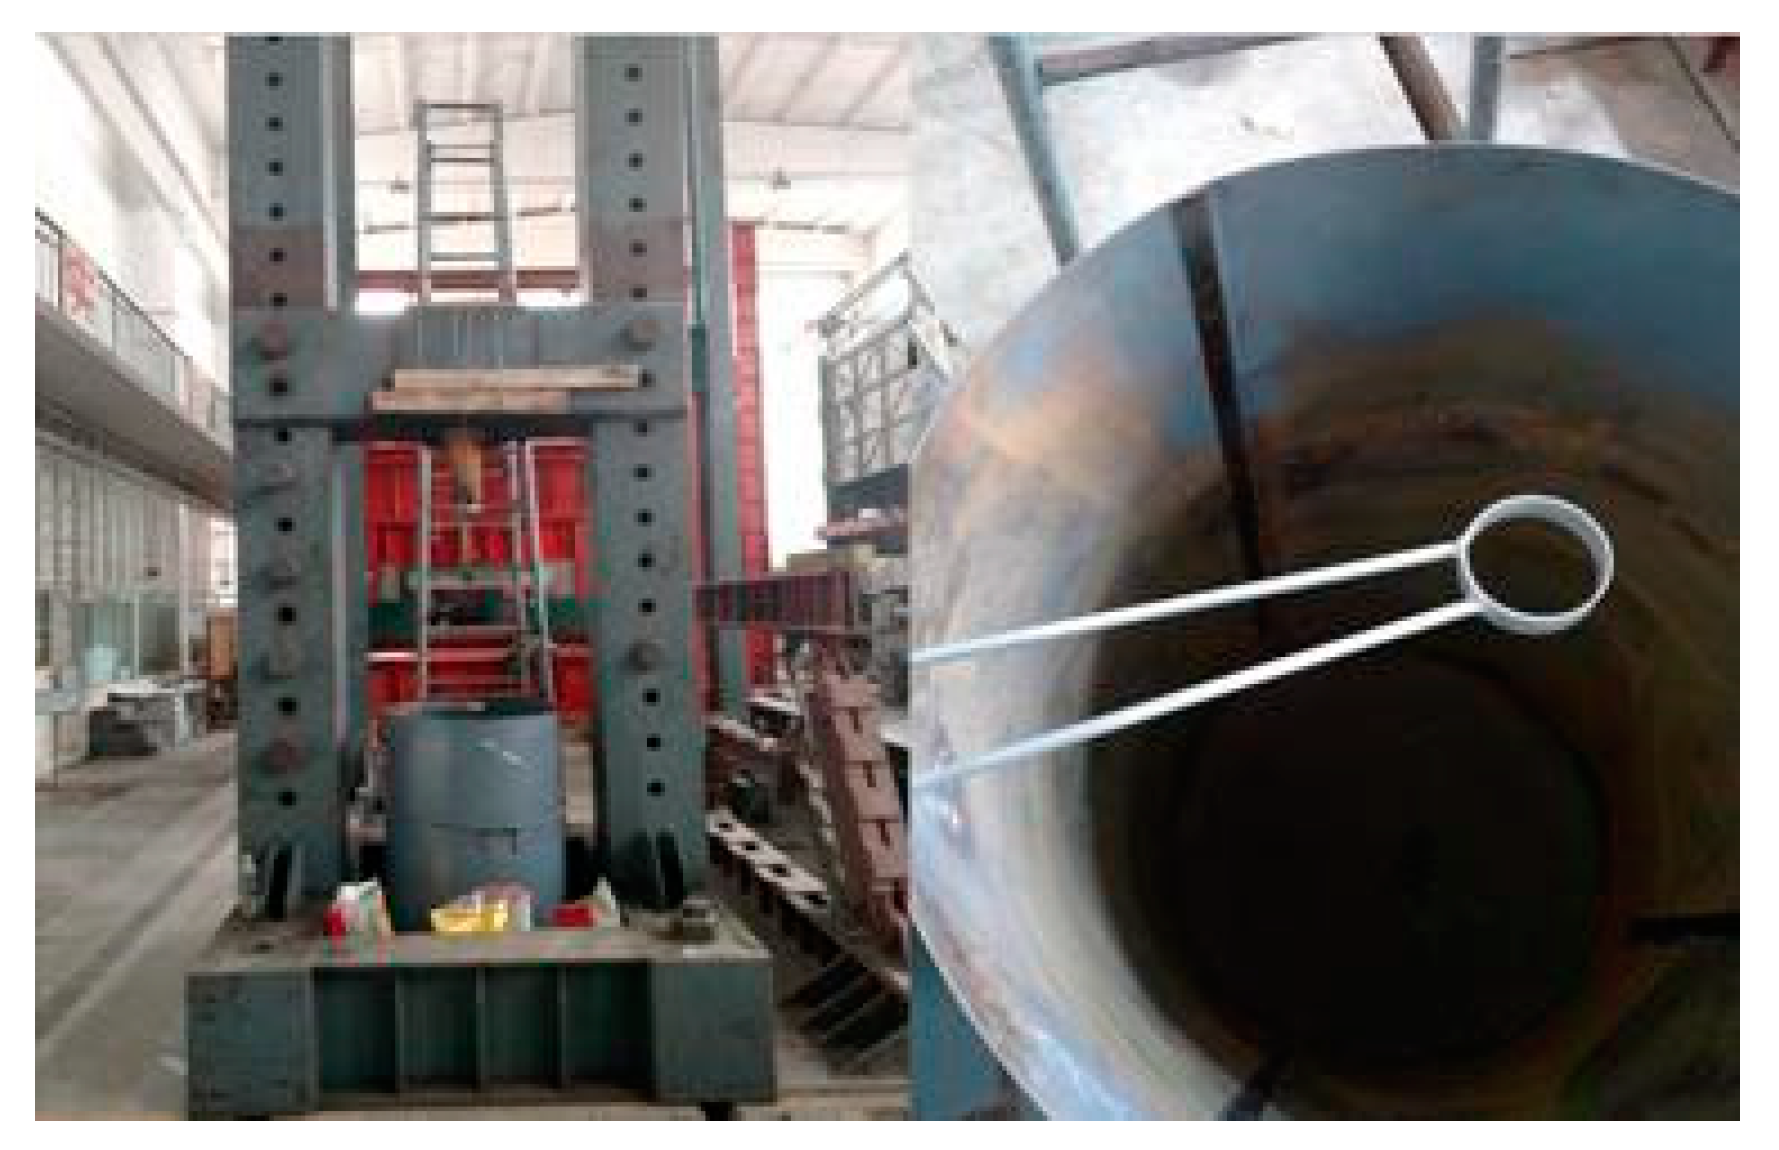
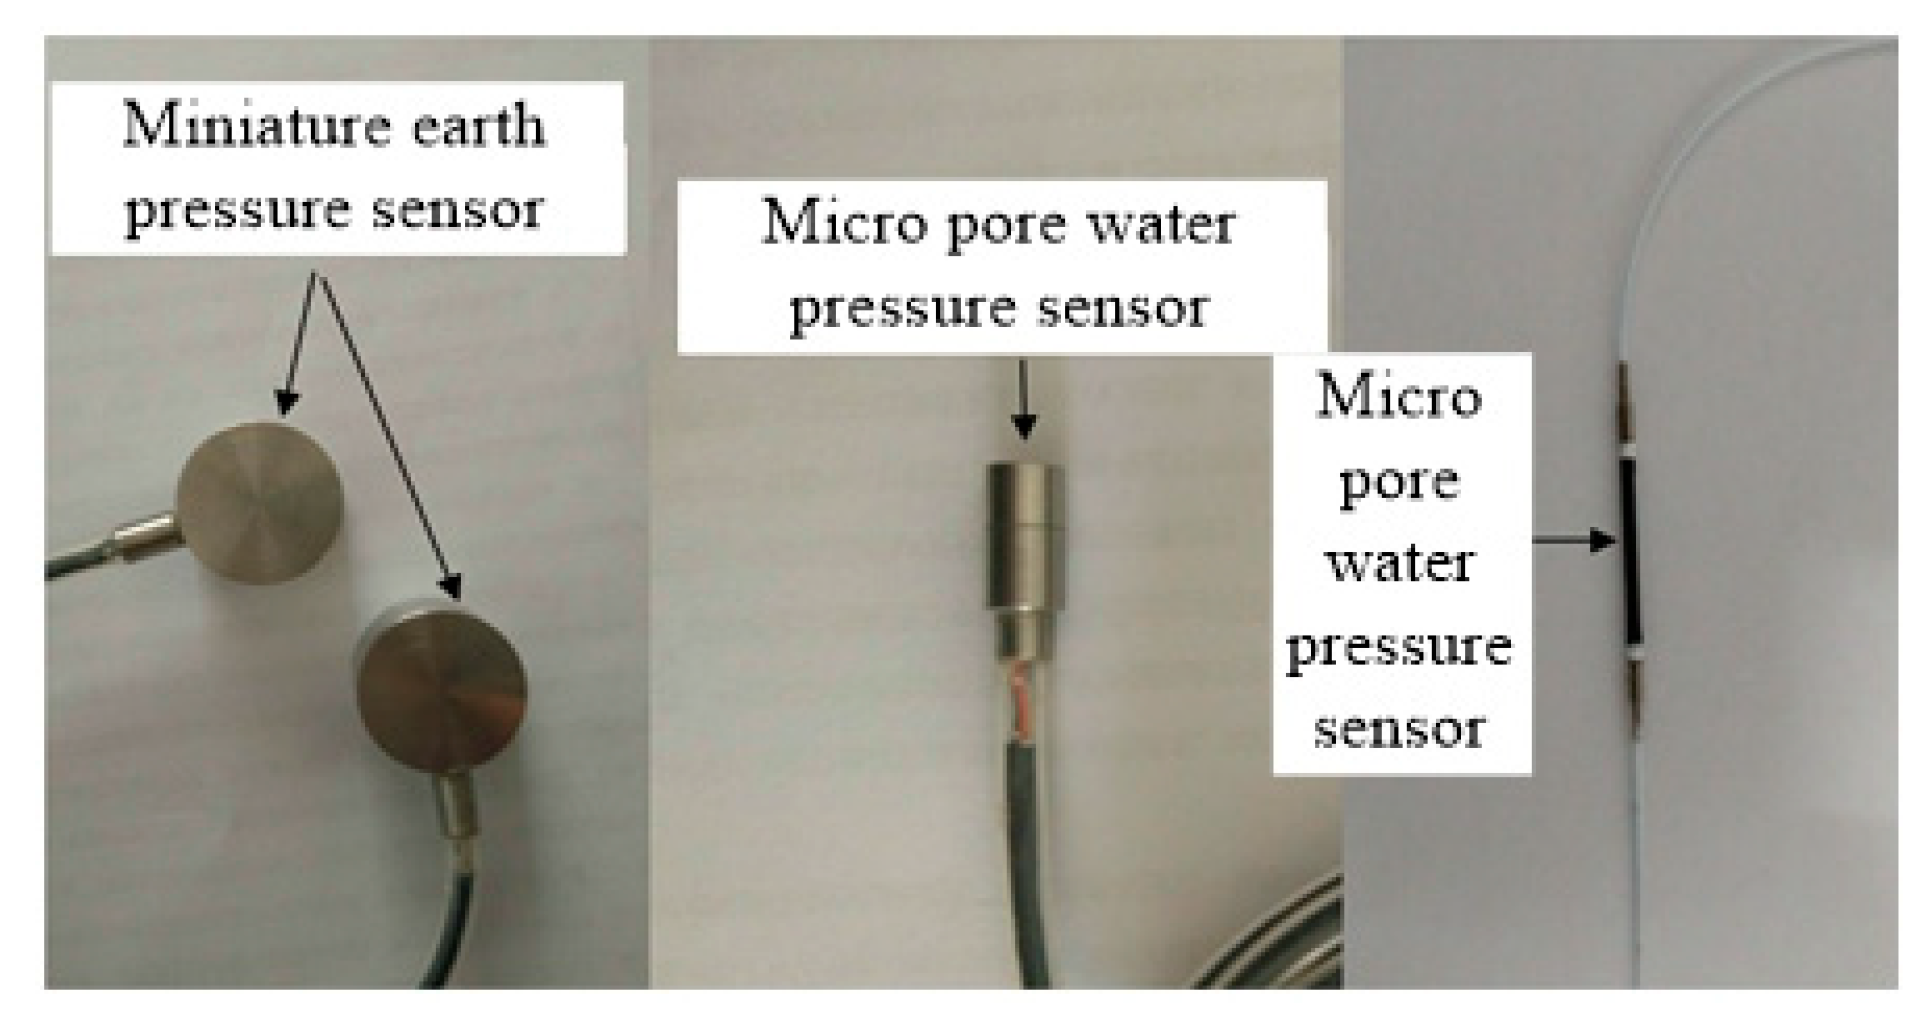
2.3. Sensor and Package
2.3.1. Basic Principle of Sensor
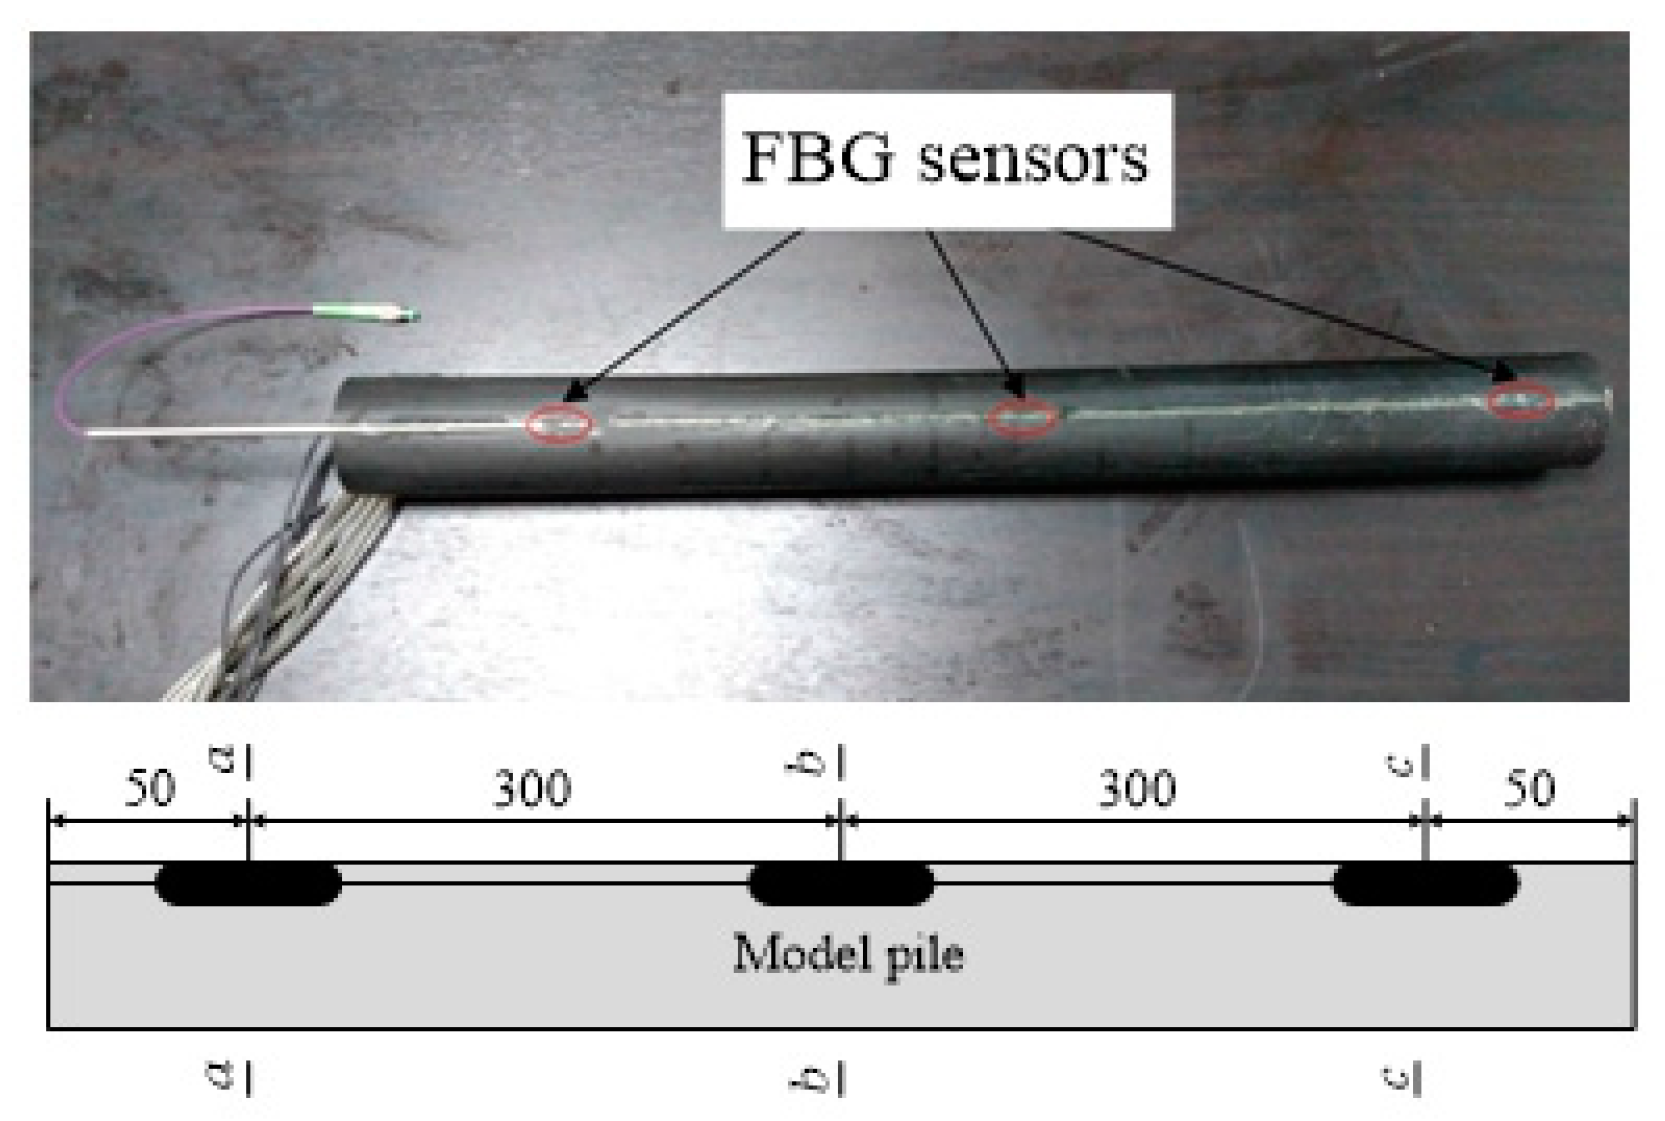
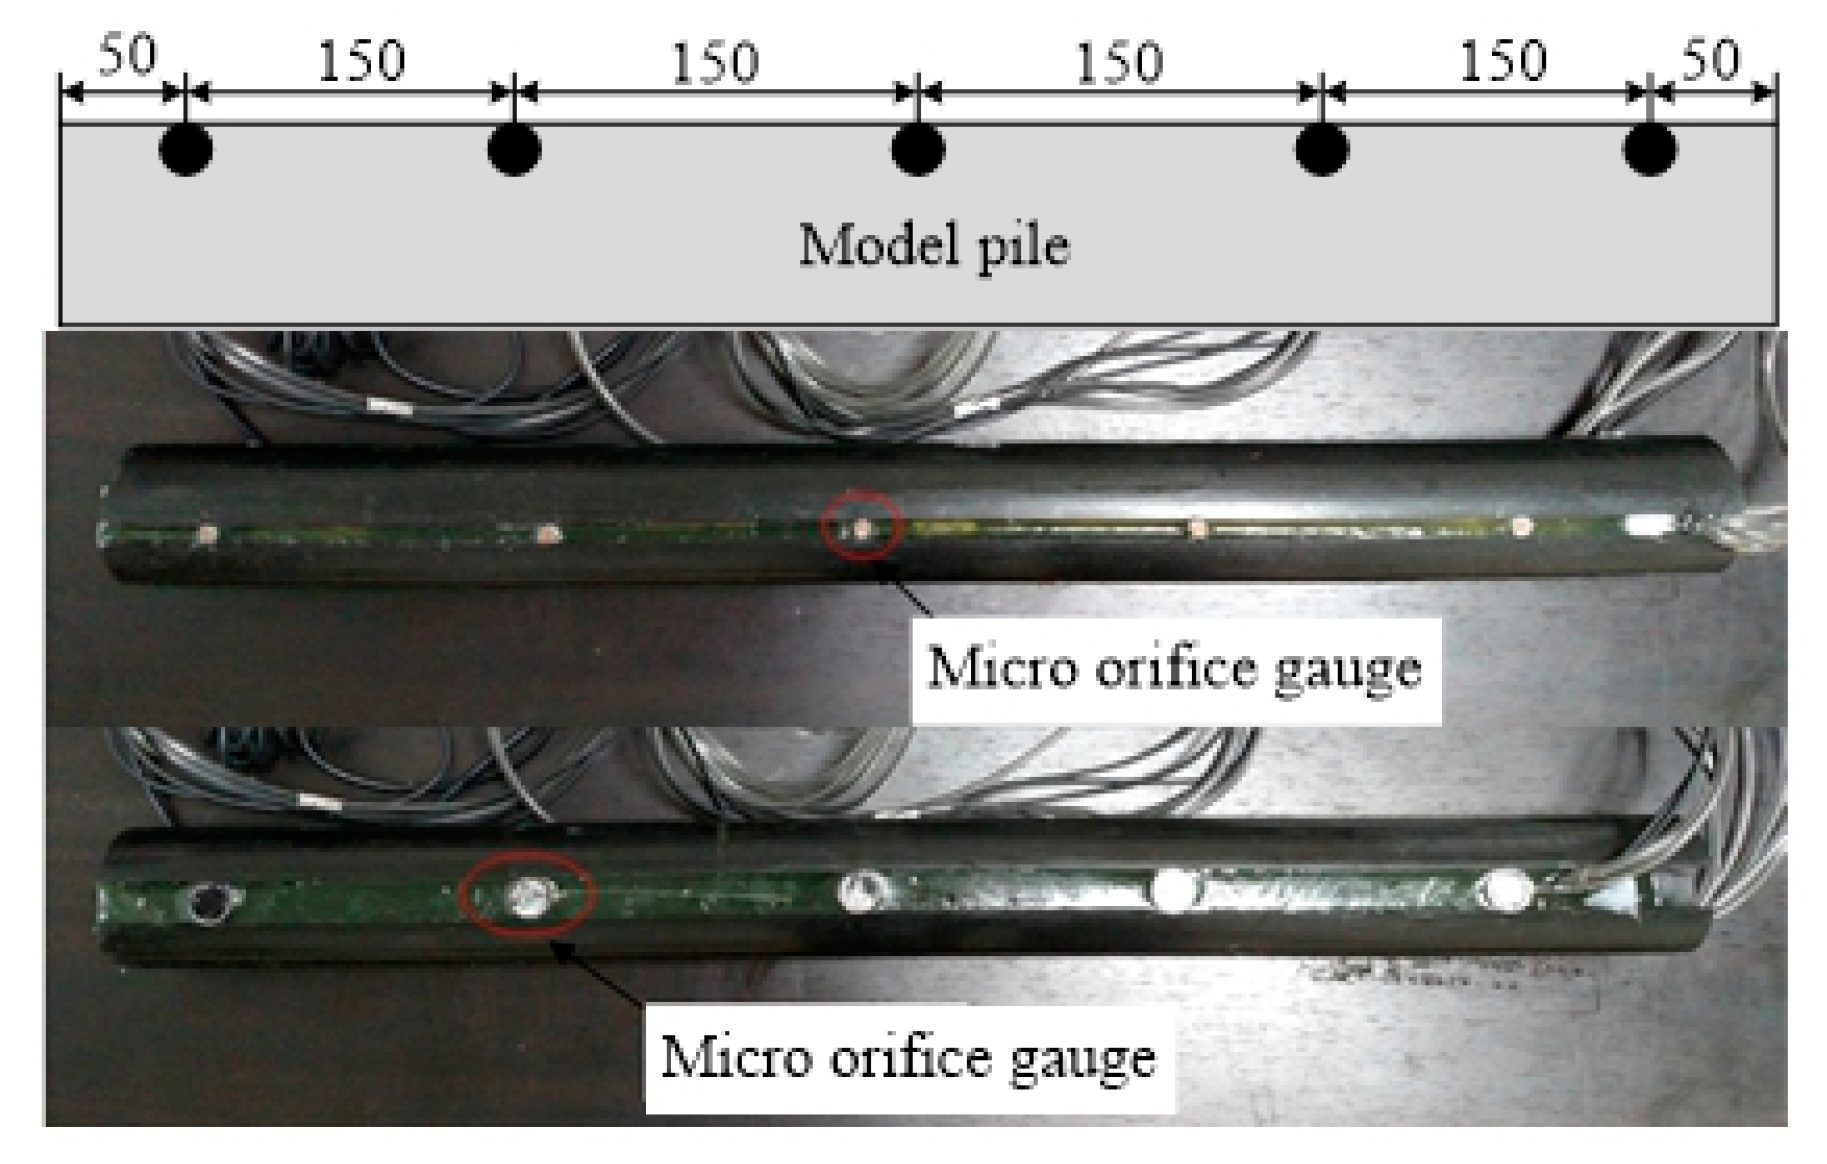
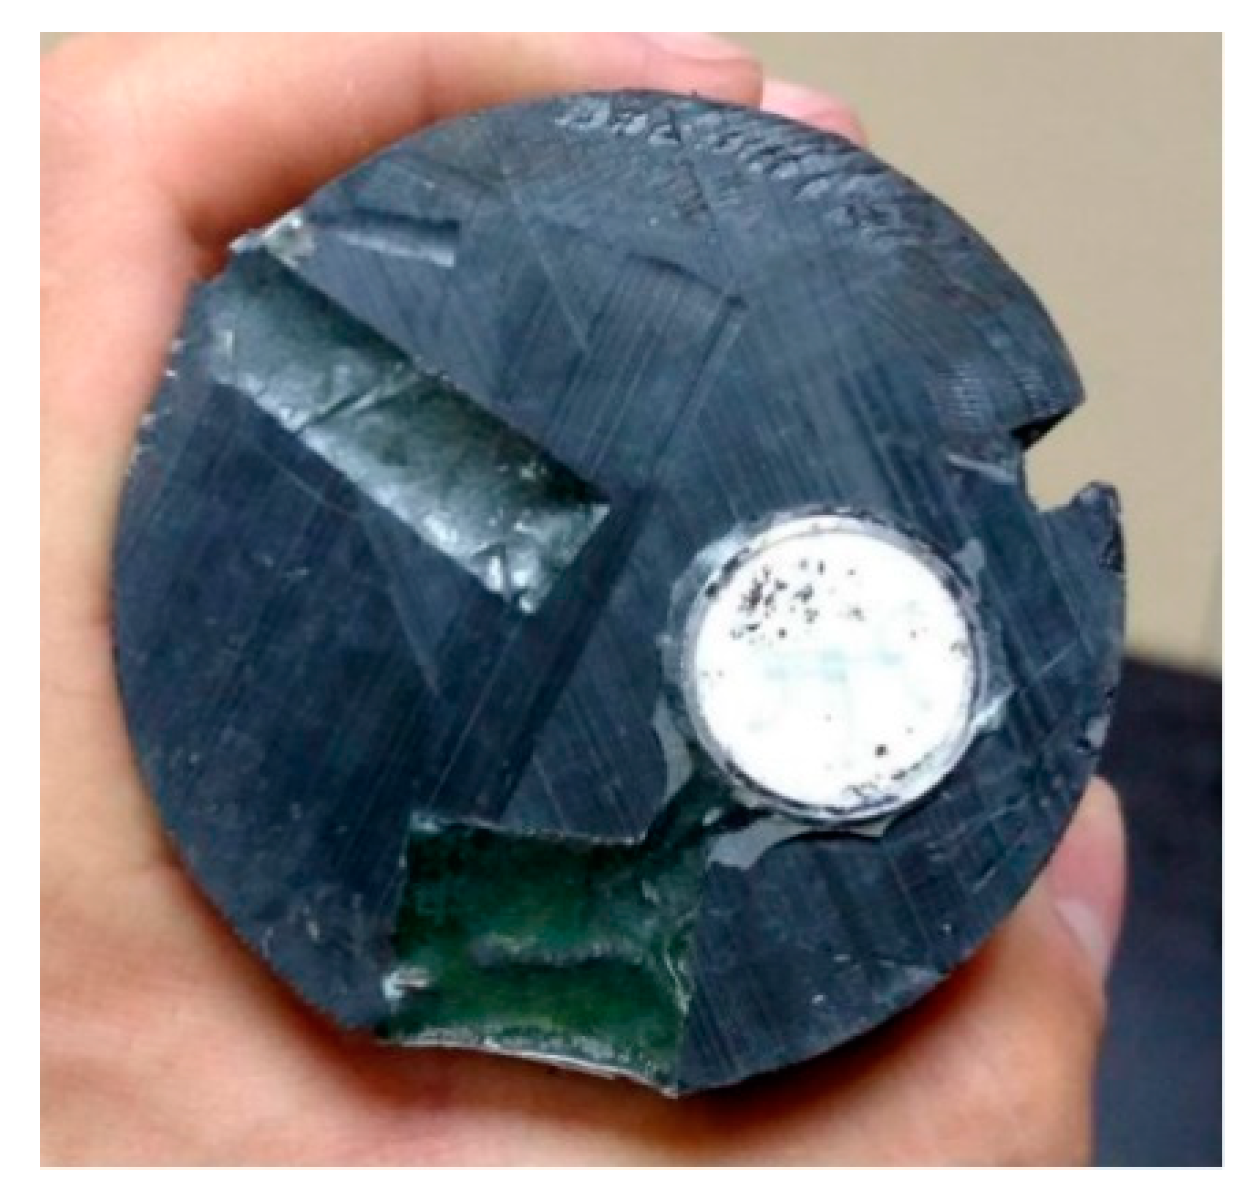
2.3.2. Installation of Sensors
2.4. Model Foundation
- (1)
- First, apply sealant to the weld in the model barrel to prevent water from overflowing from the weld.
- (2)
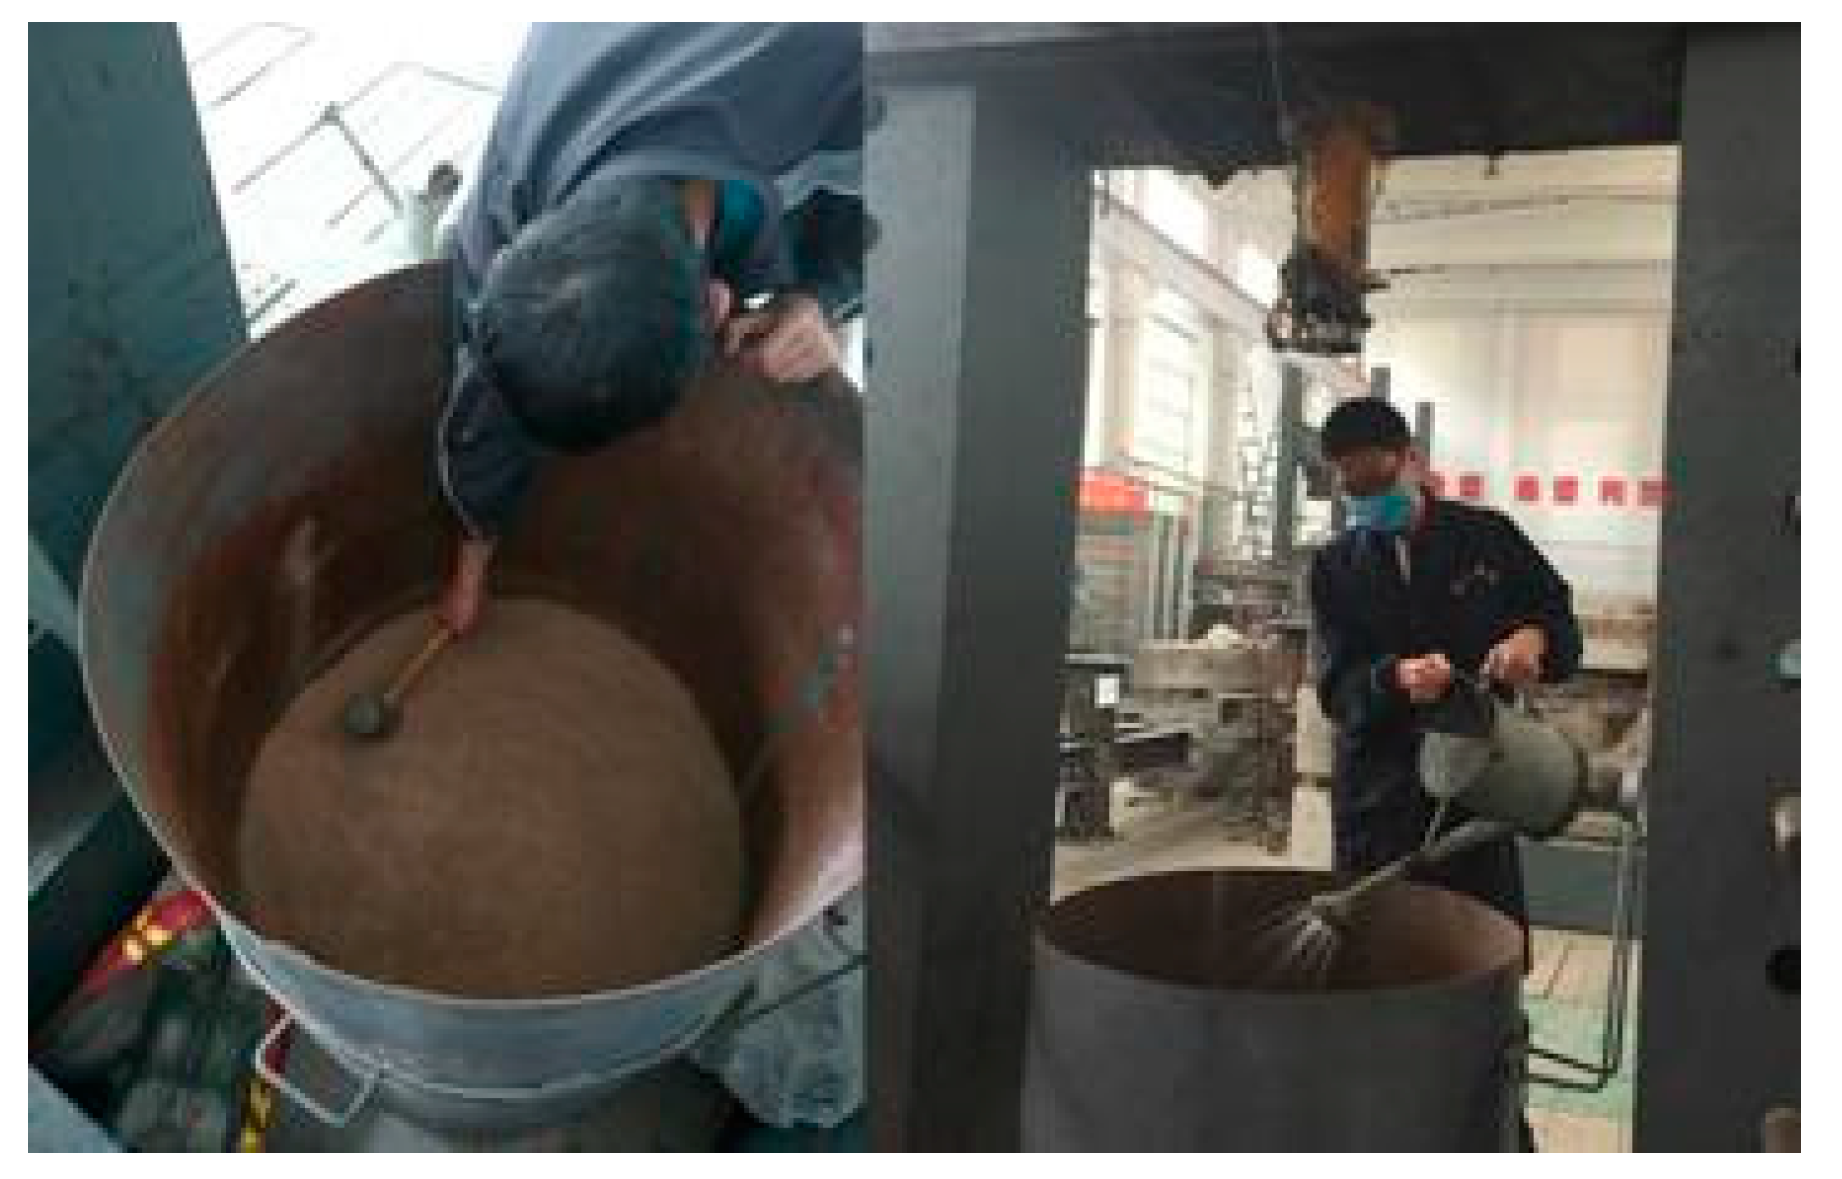
- Make the model foundation in 10 layers with a 10 cm thickness for each layer, and calculate the mass of dry soil and water required for each layer of the foundation based on the dry density of the soil, the volume of the model bucket, and the moisture content of the model foundation.
- (3)
- Evenly spread the weighed dry soil into the model bucket using the pasted scale, and use the indoor light tamper to pack the soil the design height with a smooth surface. Spray the weighed water evenly into the soil with the sprinkling kettle. After sprinkling, seal the mouth of the bucket with a plastic sheet and let it stand for 24 hours to allow the water to fully soak into the soil.
- (4)
- Repeat the above steps until the foundation of the model is complete. Seal the model barrel mouth with a plastic sheet for 7 days to ensure all the soil layers are uniform. The process to make the model foundation is shown in Figure 7.
2.5. Test Process
- (1)
- Before the test, make marks every 5 cm on the model pile, and number the miniature earth and pore water pressure sensors from the bottom to the top to record the test data.
- (2)
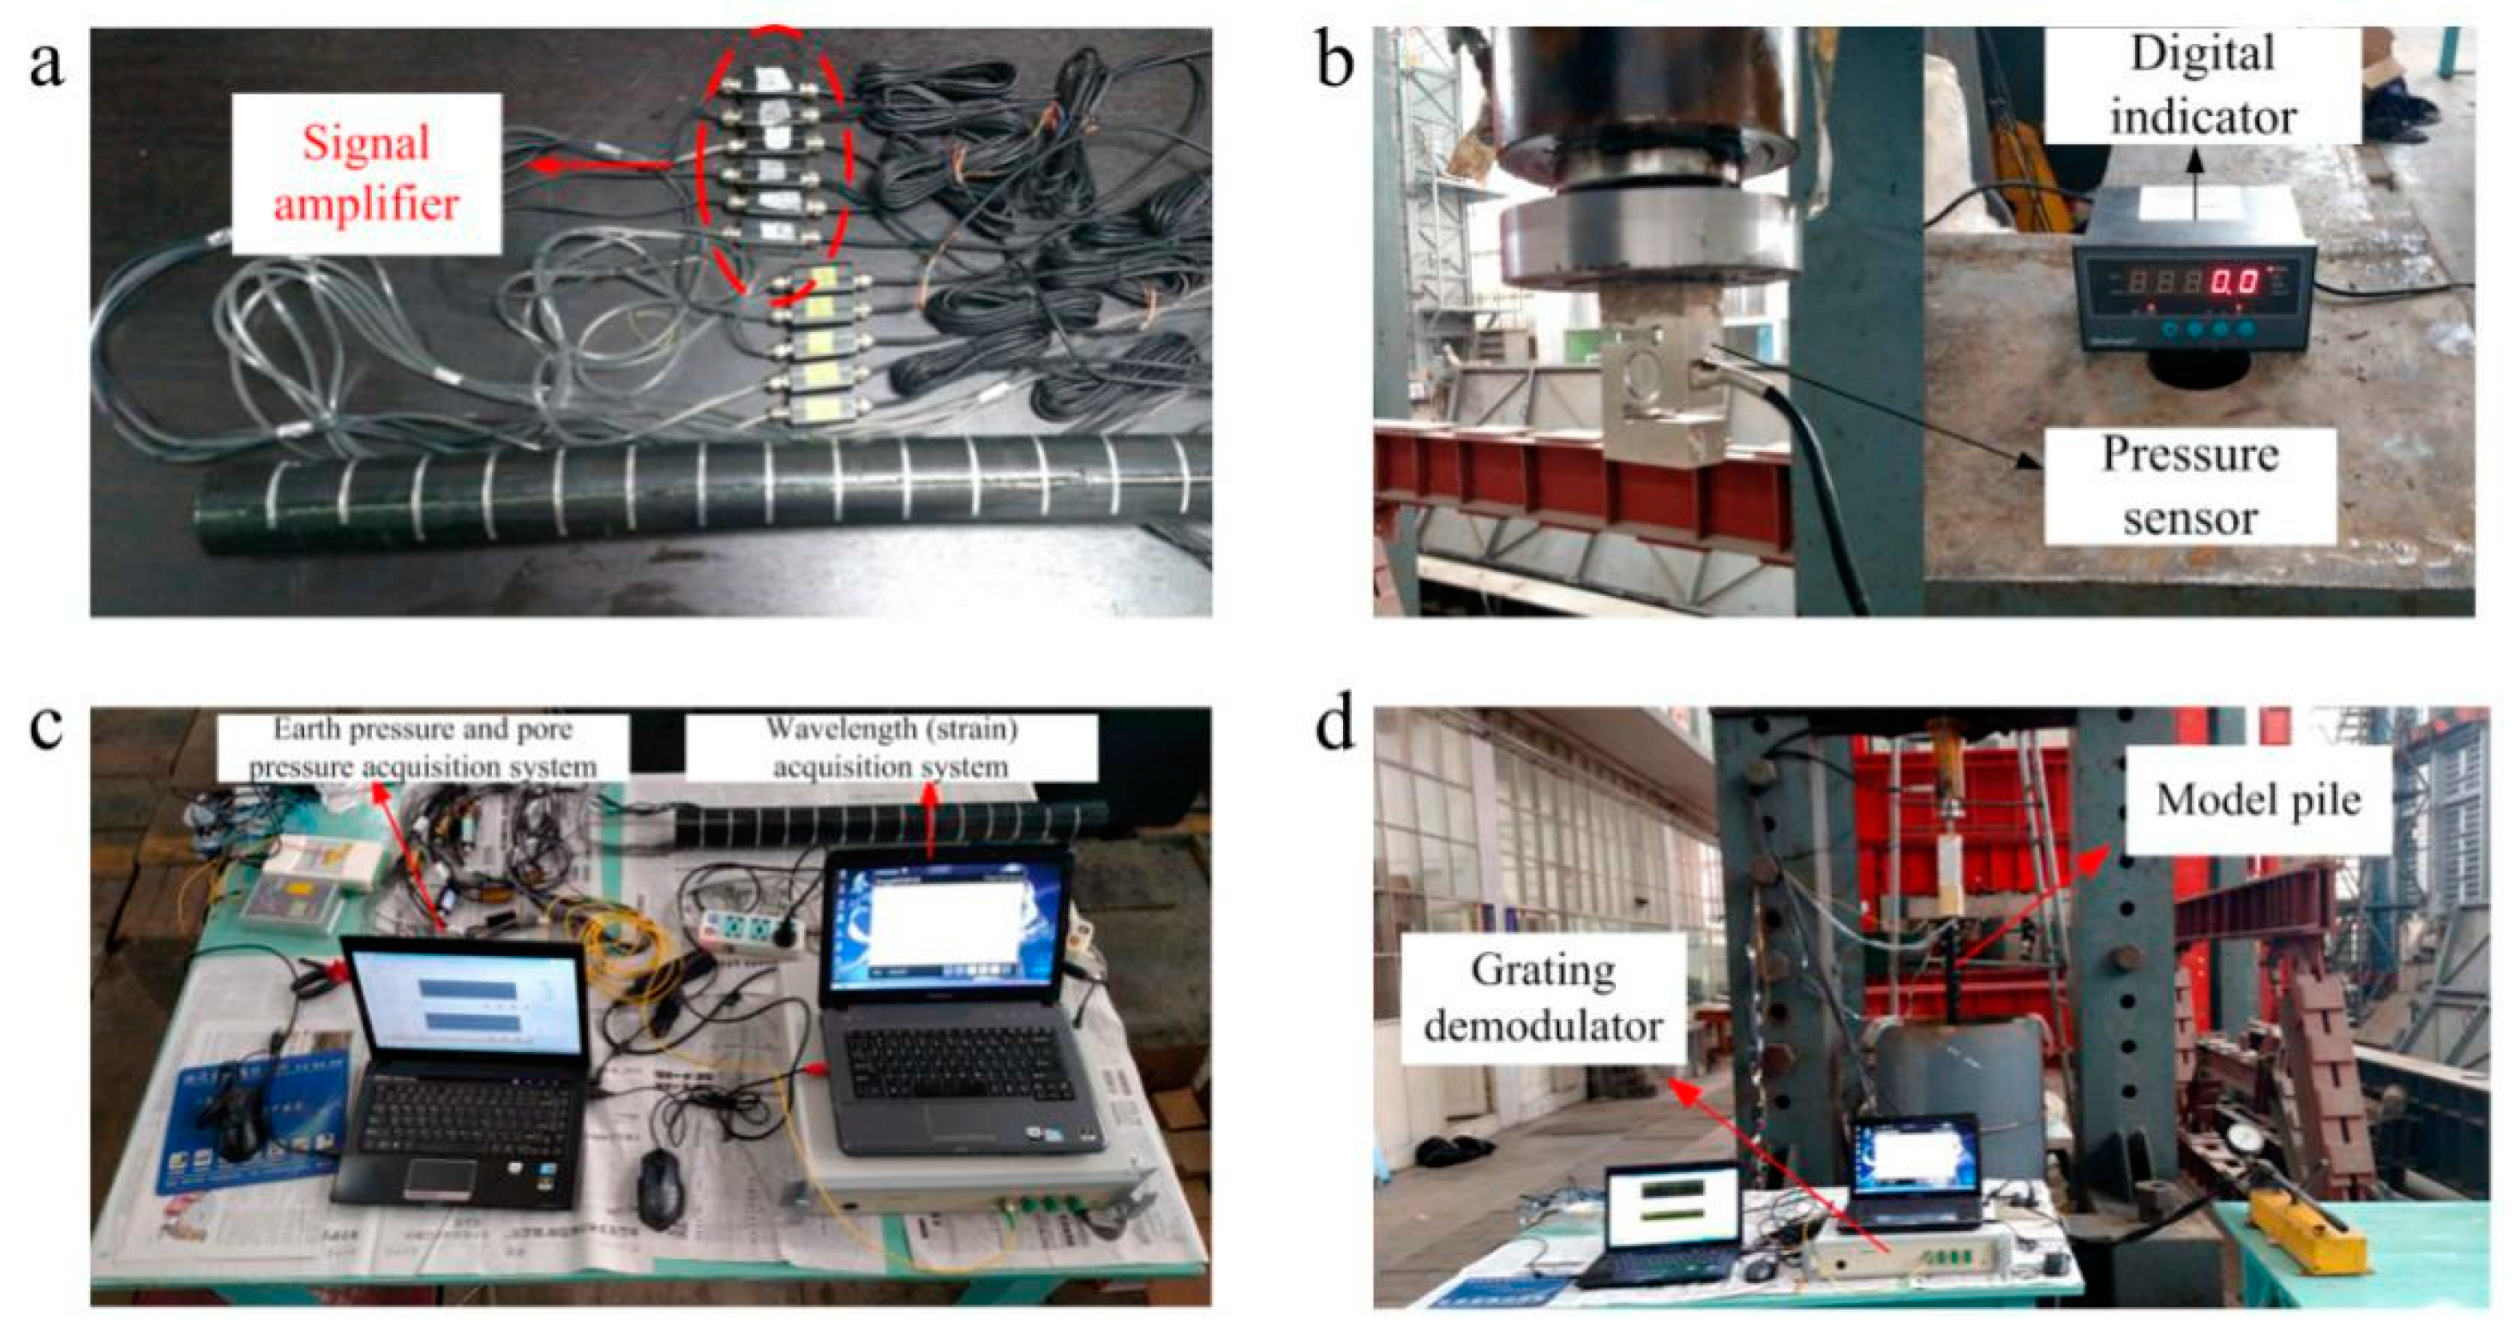
- Bring the equipment required for the test to the structural laboratory, paste the pressure sensor to the center of the end face of the hydraulic jack using structural adhesive, and connect the data display.
- (3)
- Connect the low-temperature sensitive, miniature, FBG, strain sensor to the fiber Bragg demodulator through the fiber extension cord, which is connected to the computer through the data cable. Connect the connector of the miniature earth and pore water pressure sensors to the data acquisition card and external switching power supply, which is connected to another computer.
- (4)
- Connect the hydraulic jack to the oil pump with the oil pipe, place the model pile at the center of the model foundation, and adjust the position of the jack so that its center and the center of the model pile are on the same line.
- (5)
- Adjust the time of the two computers in advance and set the relevant parameters of the testing software to ensure synchronized data collection from the two sensors. Start pressurizing with the oil pump and turn on the data acquisition software to start recording data. Record the pile force from the data display every 5 cm of pressing. When the jack is full, add a pad to continue driving the pile until the end of the test. The entire test device is shown in Figure 8.
3. Test Results and Analysis
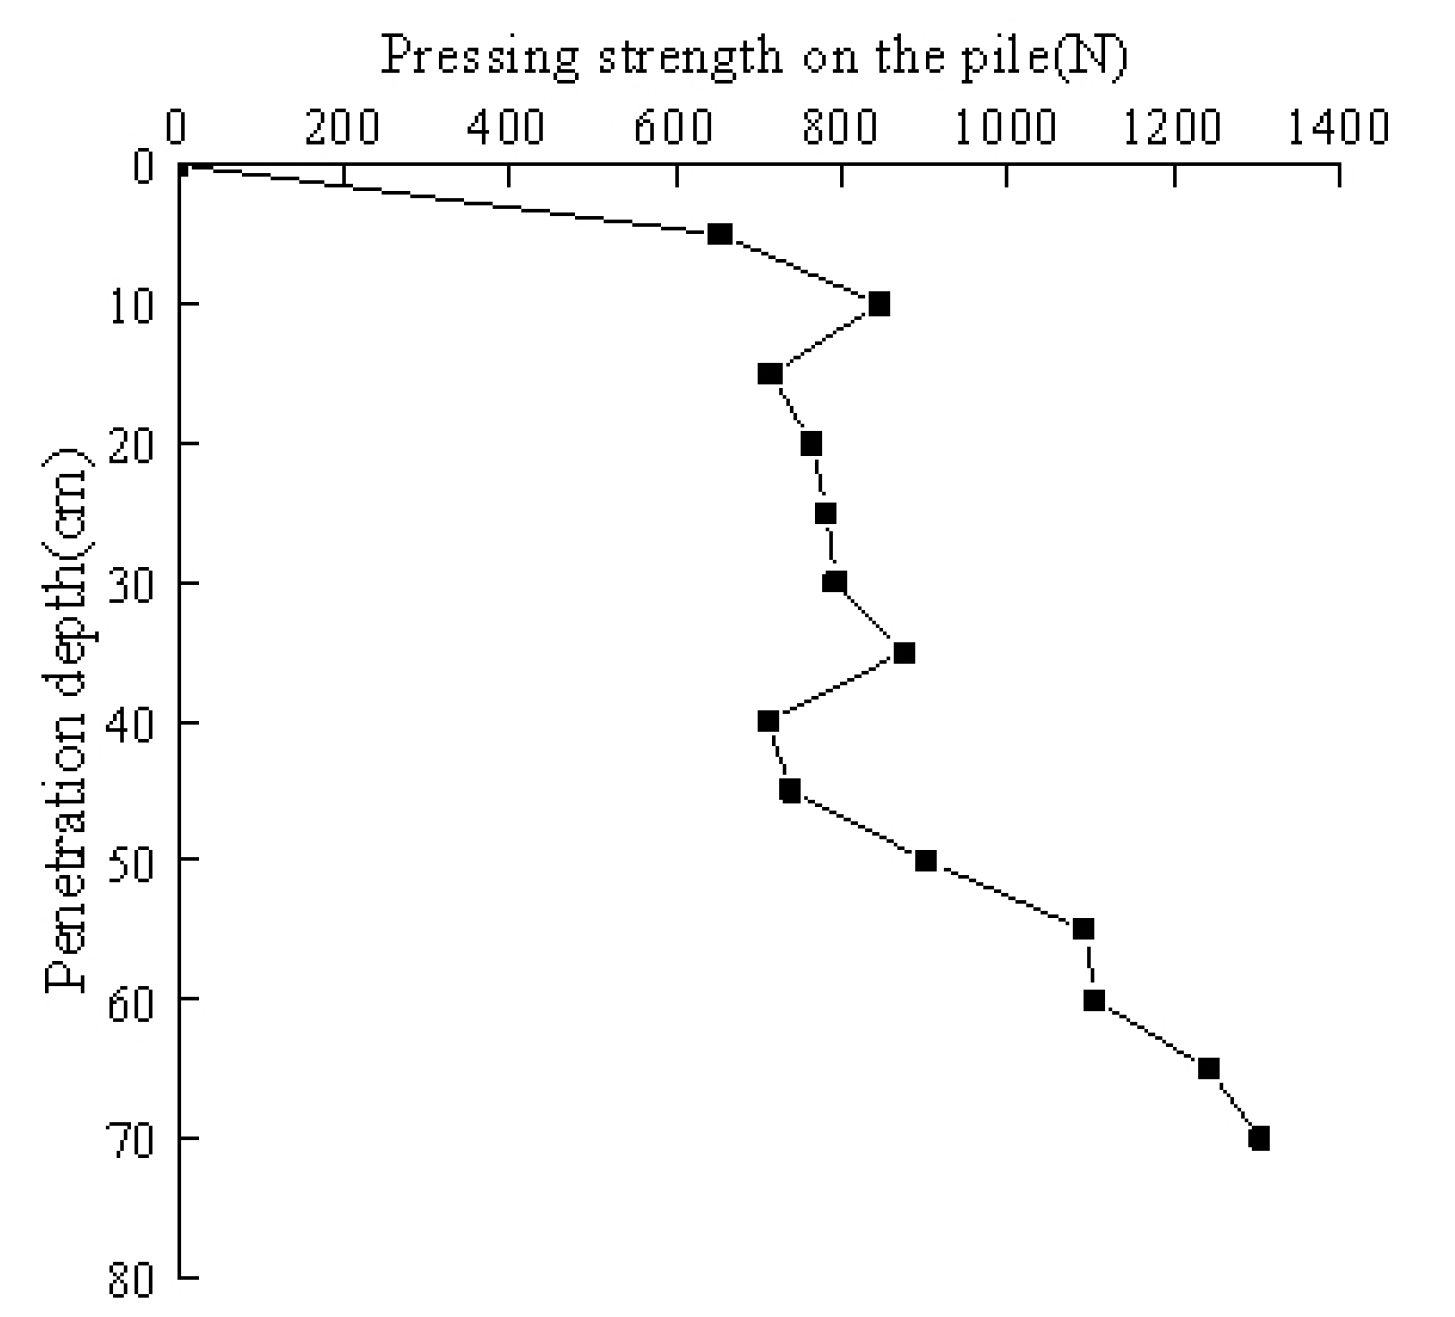
3.1. Variation Law of Pile Pressure with Penetration Depth
3.2. Distribution of Pore Water Pressure
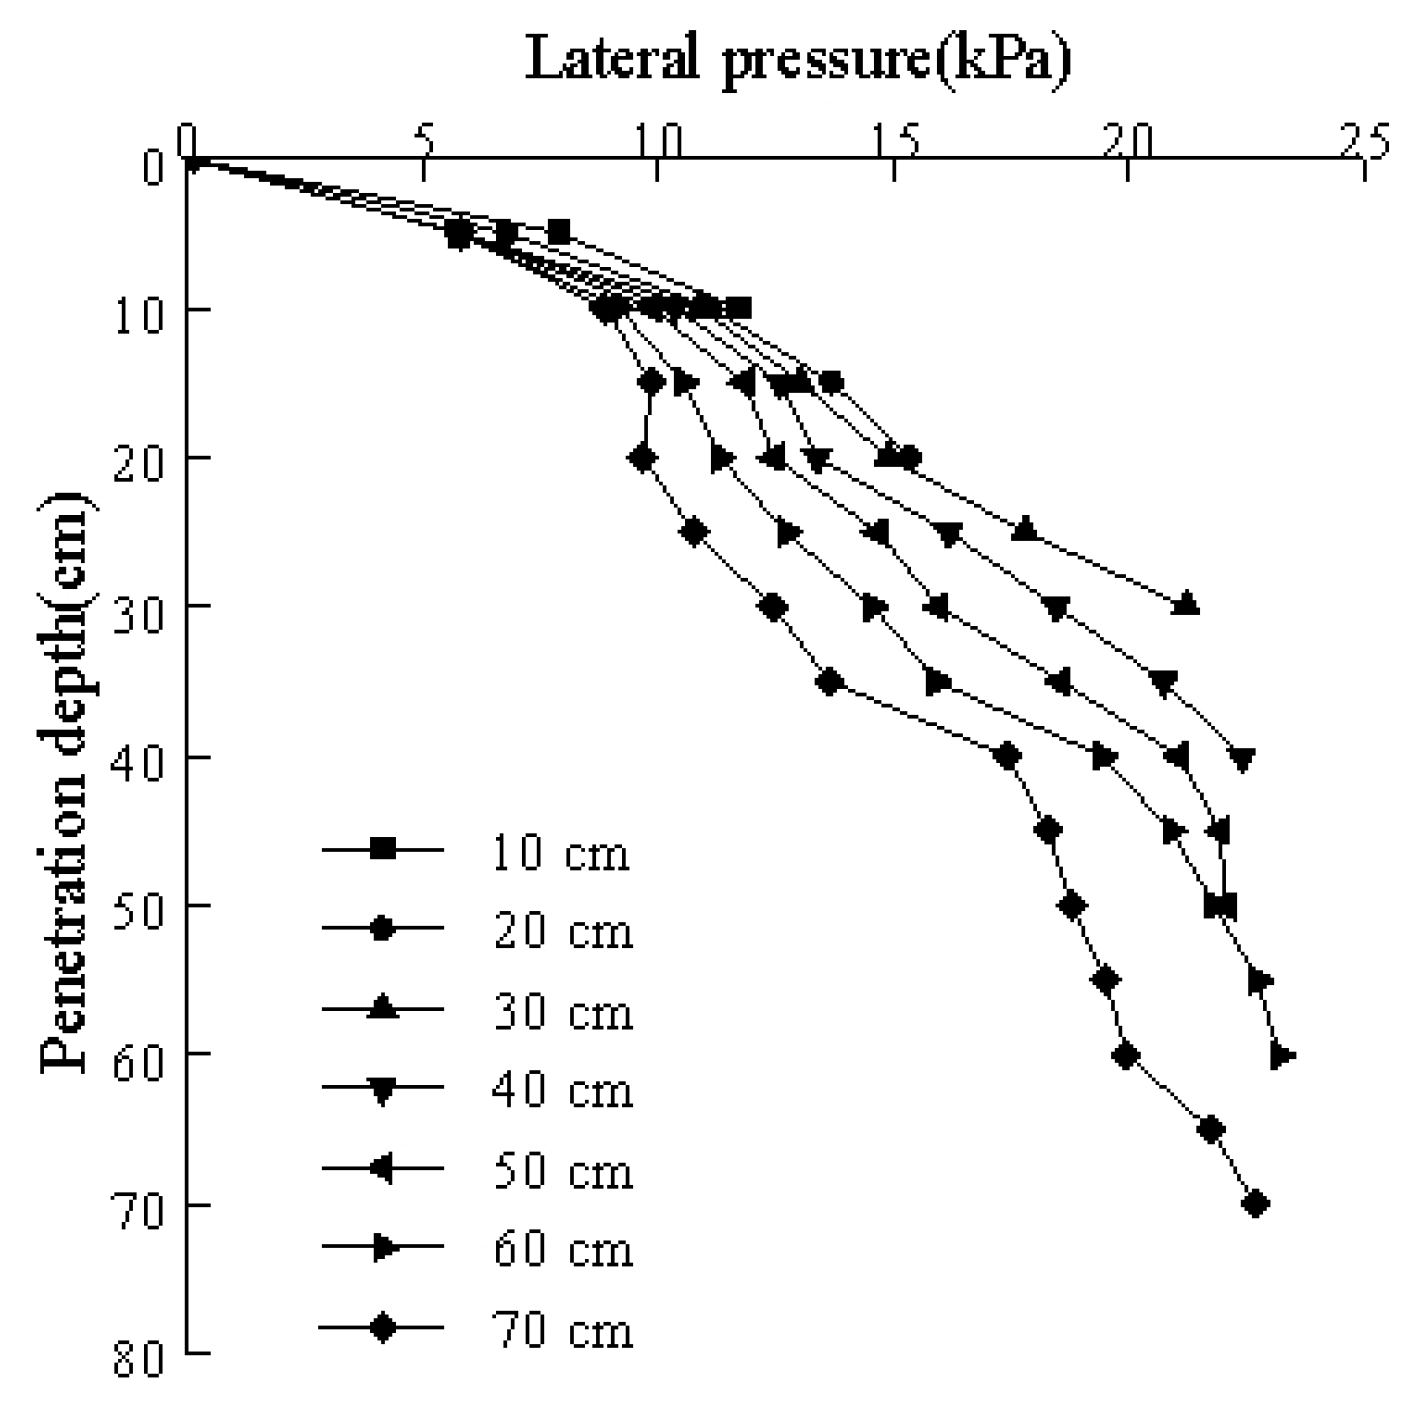
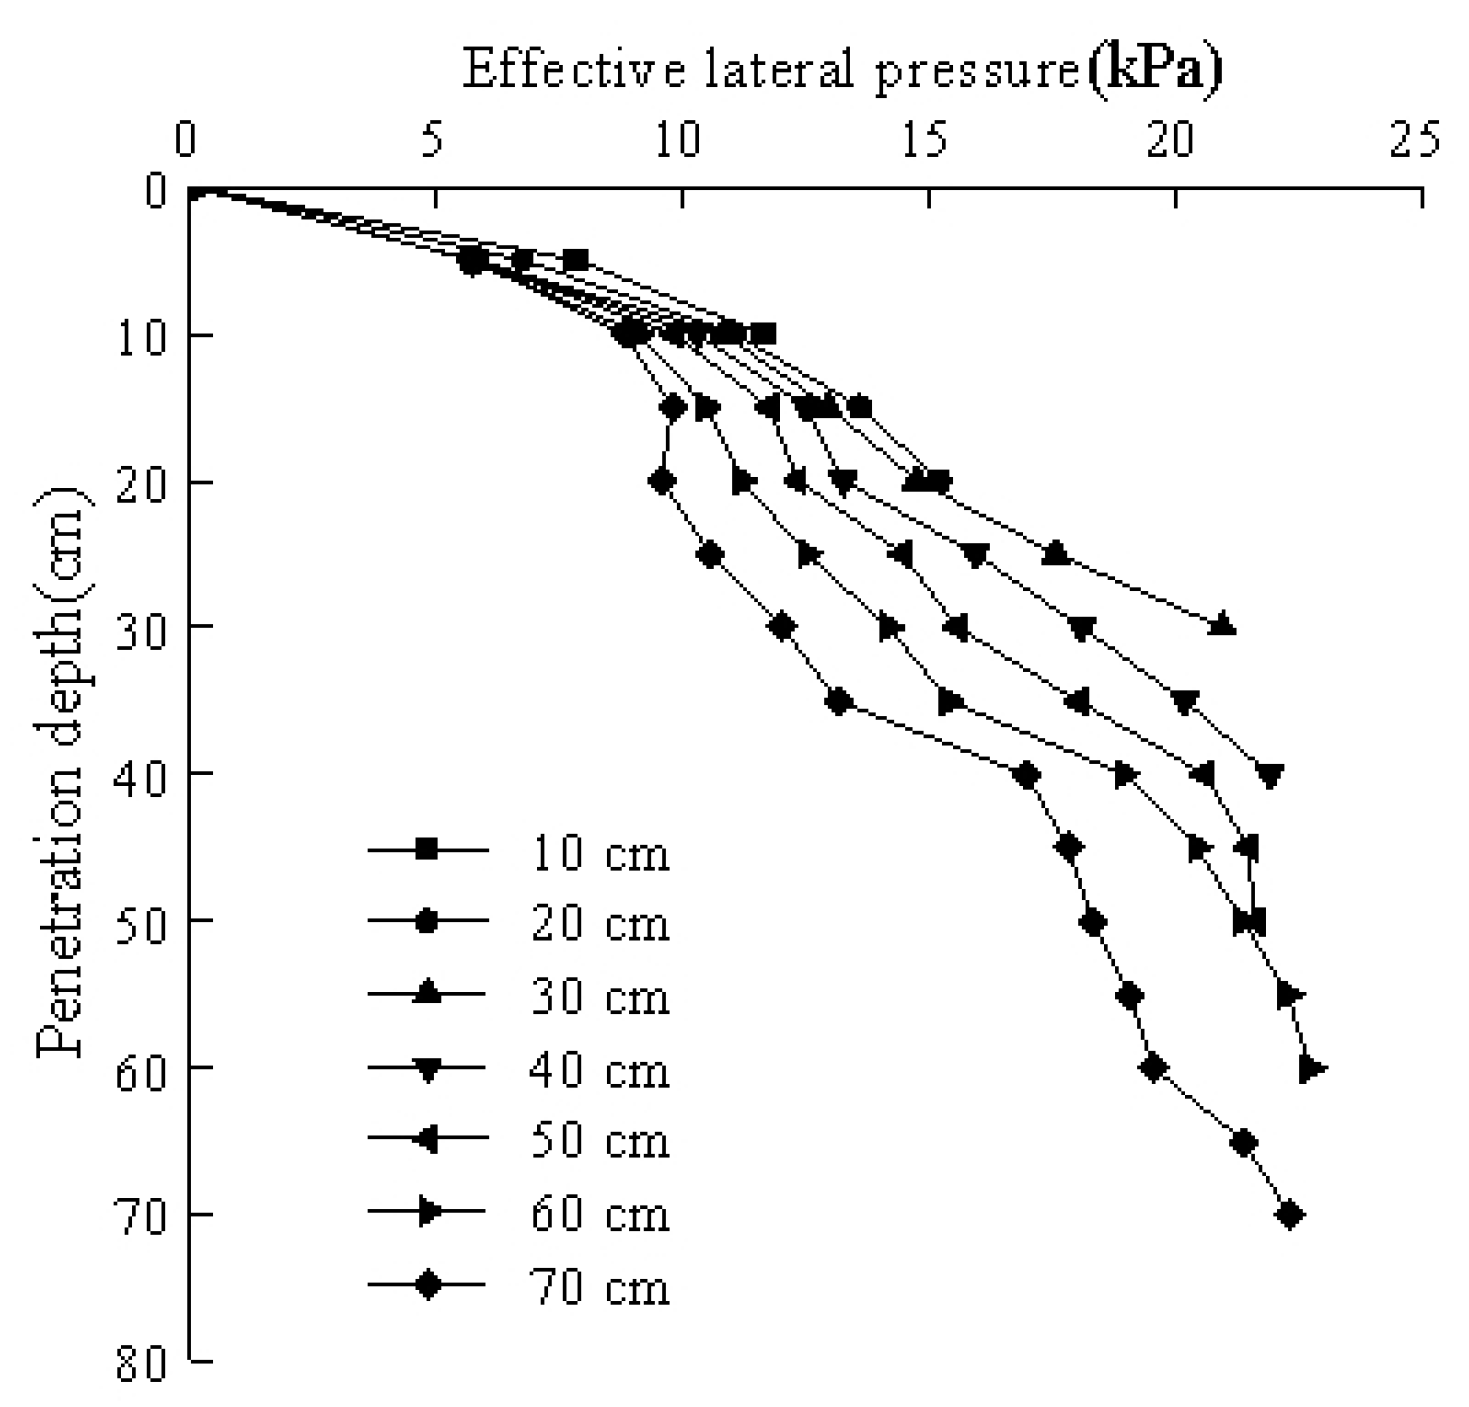
3.3. Lateral Pressure Distribution
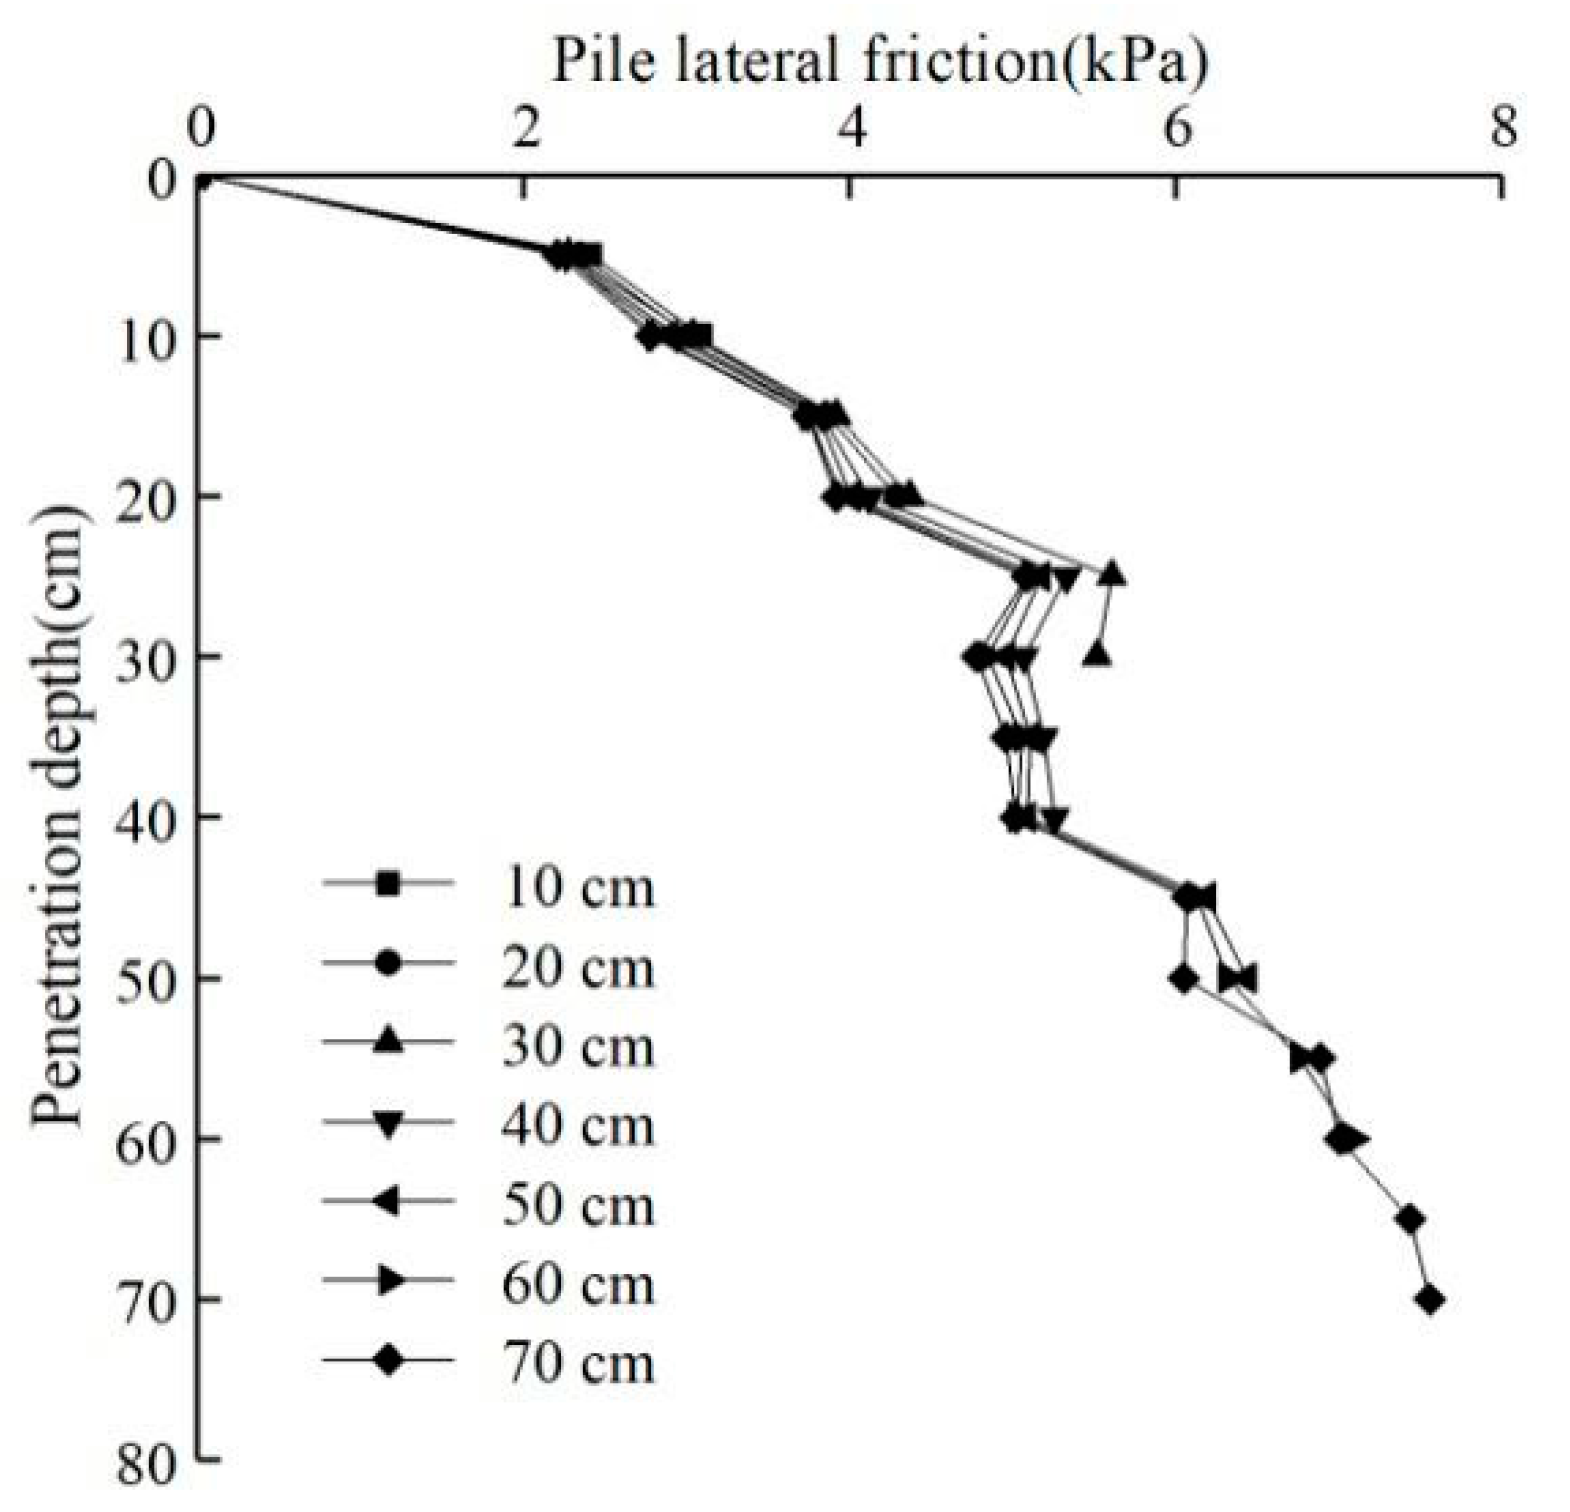
3.4. Distribution of Lateral Friction Resistance
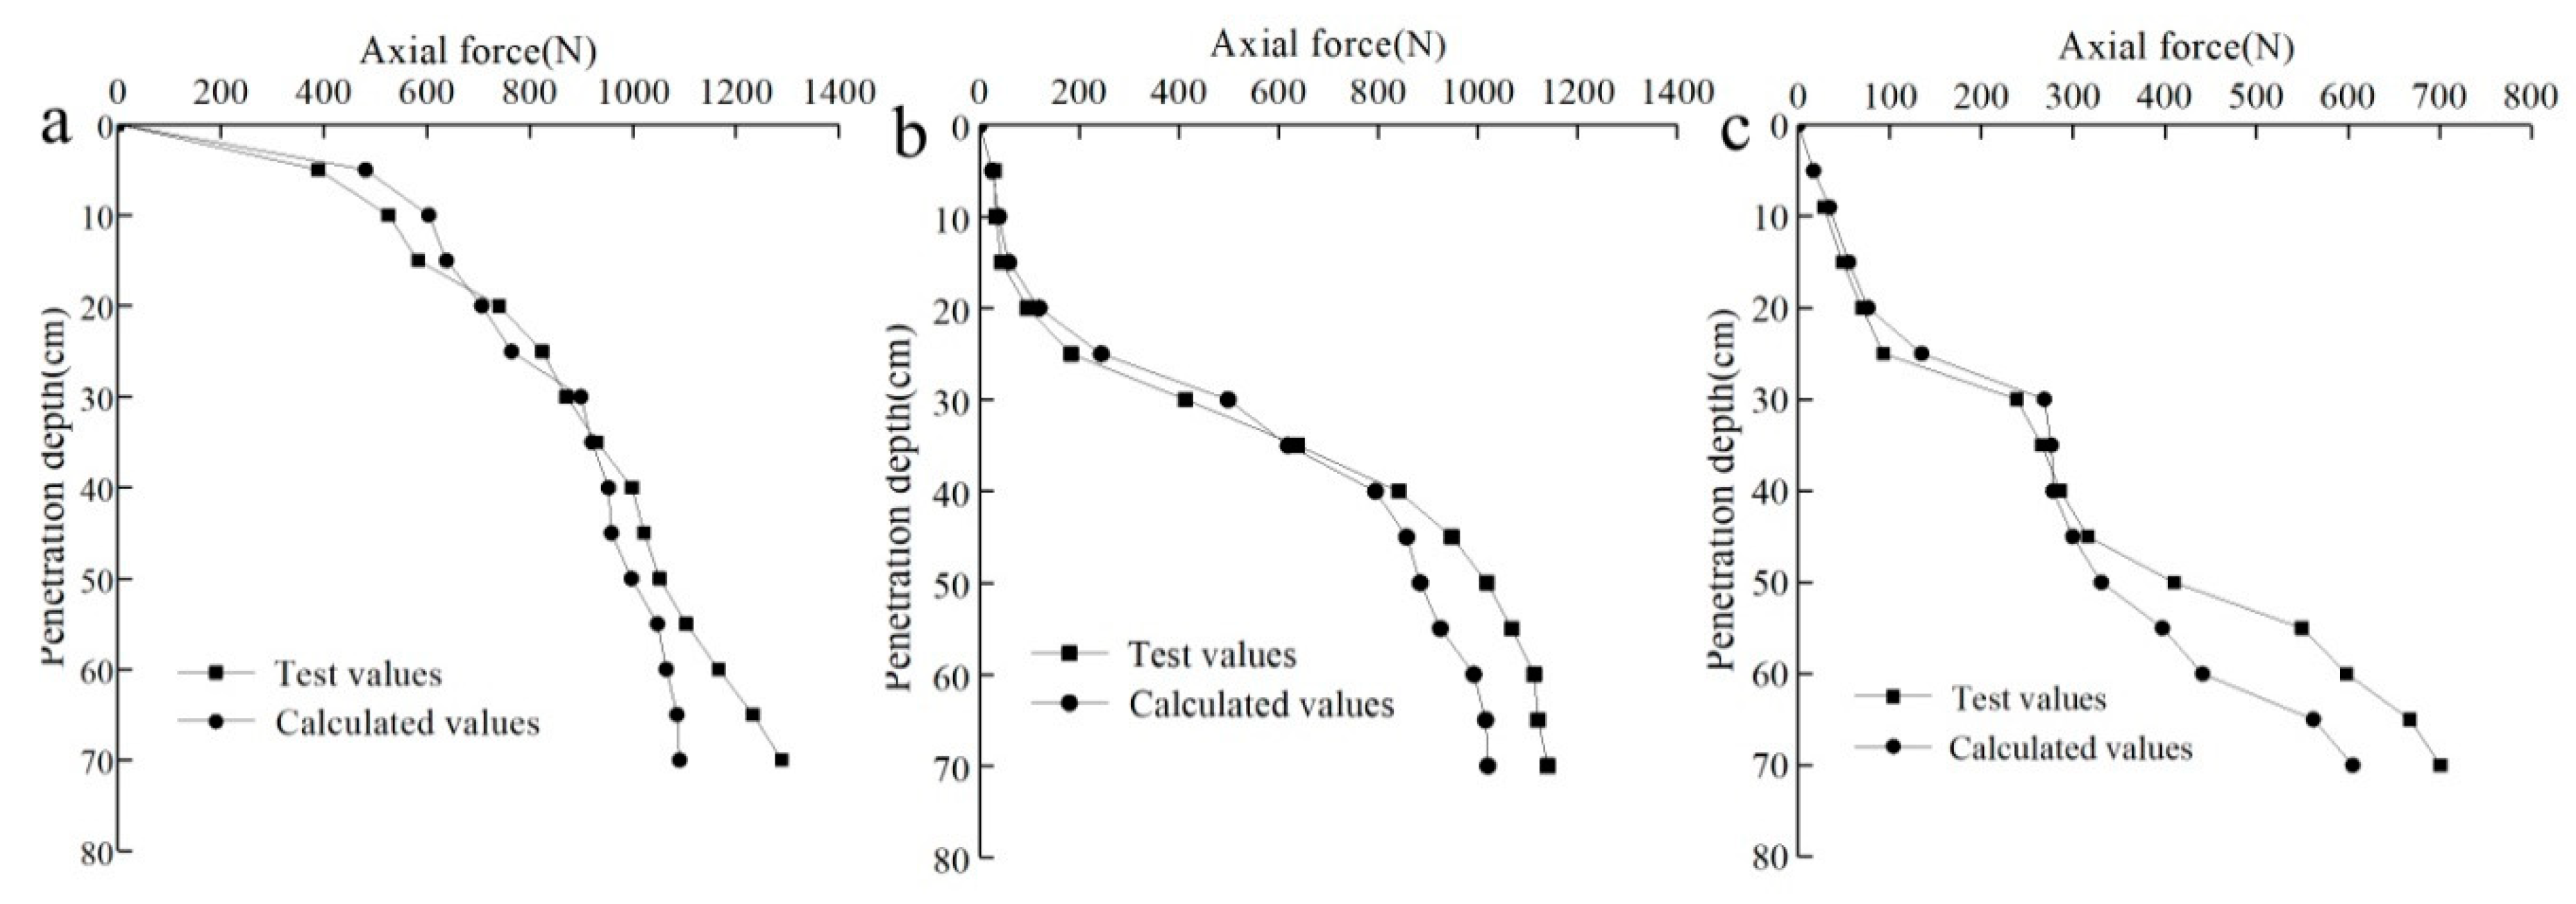
3.5. Axial Force Distribution Law for Pile Body
4. Conclusions
- (1)
- A low-temperature sensitive miniature FBG strain sensor can monitor stress changes of a pile in real time, which is easily installed and has a stable performance. The miniature earth and pore water pressure sensors are small and suitable for dynamic measurements. For the first time, a micro FBG strain sensor, micro earth pressure sensor, and micro pore water pressure sensor were installed in the grooves of a model pile (nylon rod) to mechanically test the pile and verify its feasibility.
- (2)
- In this test, silty clay retrieved from the site was successfully dried and ground to make the model foundation; thus, the soil sample preparation method is feasible.
- (3)
- In the clay soil, the change law for the interfacial force at the pile–soil interface is as follows. During the pile jacking process, the earth pressure on the pile side increased gradually with depth and began to change rapidly. As the depth increased, the earth pressure gradually slowed. The lateral pressure at the same depth tended to decrease at greater pile depths. The distribution law for the effective lateral pressure was nearly consistent with that of the lateral pressure. Under the test, the excess pore water pressure during pile jacking was small and accounted for about 1%–3% of the total lateral pressure. Moreover, the pore water pressure was maximized when the pile penetration depth was half the effective pile length.
- (4)
- Under the influence of the lateral pressure, the measured pile axial force increased compared with the traditional calculated value at approximately 1–2 times the effective lateral pressure at the same depth, where the maximum was a factor of 2.7. Therefore, the influence of lateral pressure should be considered when studying problems such as the pile residual stress.
- (5)
- The foundation soil of this experiment is homogeneous viscous soil. The variation rules of lateral pressure and vertical axial force in other soil layers and the relationship between them need to be further studied.
Author Contributions
Acknowledgments
Conflicts of Interest
References
- Randolph, M.F. Science and empiricism in pile foundation design. Géotechnique 2003, 53, 847–875. [Google Scholar] [CrossRef]
- Togliani, G. Pile capacity prediction for in situ tests. In Proceedings of the Geotechnical and Geophysical Site Characterization, Taylor and Francis Group, London, UK, 1–4 April 2008; pp. 1187–1192. [Google Scholar]
- Igoe, D.; Gavin, K.; O’Kelly, B. Field tests using an instrumented model pipe pile in sand. In Proceedings of the 7th International Conference on Physical Modelling in Geotechnics, Zurich, Switzerland, 28 June–1 July 2010; pp. 775–780. [Google Scholar]
- Lee, W.; Lee, W.J.; Lee, S.B.; Salgado, R. Measurement of pile load transfer using the Fiber Bragg Grating sensor system. Can. Geotech. J. 2004, 41, 1222–1232. [Google Scholar] [CrossRef]
- Pando, M.; Filz, G.; Ealy, C.; Hoppe, E. Axial and lateral load performance of two composite piles and one prestressed concrete pile. Trans. Res. Rec. 2003, 1849, 61–70. [Google Scholar] [CrossRef]
- Oh, J.H.; Lee, W.; Lee, S.B.; Lee, W. Analysis of pile load transfer using optical fiber sensor. Smart Structures and Materials 2000: Smart Systems for Bridges, Structures, and Highways. Int. Soc. Opt. Photonics 2000, 3988, 349–358. [Google Scholar]
- Klar, A.; Bennett, P.J.; Soga, K.; Mair, R.J.; Tester, P.; Fernie, R.; John, H.D.; Torp-Peterson, G. Distributed strain measurement for pile foundations. Proc. Inst. Civ. Eng. Geotech. Eng. 2006, 159, 135–144. [Google Scholar] [CrossRef]
- Roy, M.; Tremblay, M.; Tavenas, F.; Rochelle, P.L. Development of pore pressures in quasi-static penetration tests in sensitive clay. Can. Geotech. J. 1982, 19, 124–138. [Google Scholar] [CrossRef]
- Pestana, J.M.; Hunt, C.E.; Bray, J.D. Soil deformation and excess pore pressure field around a closed-ended pile. J. Geotech. Geoenviron. Eng. 2002, 128, 1–12. [Google Scholar] [CrossRef]
- McCabe, B.A.; Lehane, B.M. Behavior of axially loaded pile groups driven in clayey silt. J. Geotech. Geoenviron. Eng. 2006, 132, 401–410. [Google Scholar] [CrossRef]
- Tang, S.D.; He, L.S.; Fu, Z. Excess pore water pressure caused by an installing pile in soft foundation. Rock Soil Mech. 2002, 23, 725–732. [Google Scholar]
- Li, L.; Huang, J.; Han, B. Centrifugal Investigation of Excavation Adjacent to Existing Composite Foundation. J. Perform. Constr. Facil. 2018, 32, 04018044. [Google Scholar] [CrossRef]
- Liu, J.W.; Cui, L.; Zhu, N.; Han, B.; Liu, J. Investigation of cyclic pile-sand interface weakening mechanism based on large-scale CNS cyclic direct shear tests. Ocean Eng. 2019, 194, 106650. [Google Scholar] [CrossRef]
- Li, J. Study of Shear Stress and Earth Pressure on Jacked Pile. Ph.D. Thesis, Henan University of Technology, Zhengzhou, China, 2006. [Google Scholar]
- Okamura, M.; Takemuka, J.; Kimura, T. A study on bearing capacity of shallow footing on sand. Doboku Gakkai Ronbunshu 1993, 463, 85–94. [Google Scholar] [CrossRef]
- Toyosawa, Y.; Yang, J.J.; Miura, S.; Suemasa, N. Bearing capacity of reinforced ground using centrifuge tests. Doboku Gakkai Ronbunshu 2004, 757, 247–257. [Google Scholar] [CrossRef]
- Rao, S.N.; Ramakrishna, V.; Rao, M.B. Influence of rigidity on laterally loaded pile groups in marine clay. J. Geotech. Geoenviron. Eng. 1998, 124, 542–549. [Google Scholar] [CrossRef]
- Bond, A.J.; Jardine, R.J. Shaft capacity of displacement piles in a high OCR clay. Géotechnique 1995, 45, 3–23. [Google Scholar] [CrossRef]
- Dou, J.; Chen, J.; Liao, C. Method for estimating initial excess pore pressure during pile jacking into saturated fine-grained soil. Comput. Geotech. 2019, 116, 103–203. [Google Scholar] [CrossRef]
- Zhu, B.J. Study of the pore water pressure variation rule in saturated soft soil caused by prestressed concrete pile penetration. In Proceedings of the 2011 International Conference on Electric Technology and Civil Engineering (ICETCE), Lushan, China, 22–24 April 2011; pp. 756–759. [Google Scholar]
- Dash, S.R.; Bhattacharya, S. Pore water pressure generation and dissipation near to pile and far-field in liquefiable soils. Int. J. Geom. 2015, 9, 1454–1459. [Google Scholar] [CrossRef]
- Hwang, J.H.; Liang, N.; Chen, C.H. Ground response during pile driving. J. Geotech. Geoenviron. Eng. 2001, 127, 939–949. [Google Scholar] [CrossRef]
- Vesic, A.S. On the significance of residual loads for load response of piles. In Proceedings of the 9th International Conference on Soil Mechanics and Foundation Engineering, Tokyo, Japan, 10–15 July 1977; pp. 374–379. [Google Scholar]
- O’Neill, M.W.; Hawkins, R.A.; Audibert, J.M.E. Installation of pile group in overconsolidated clay. J. Geotech. Eng. Div. 1982, 108, 1369–1386. [Google Scholar]
- Lee, F.H.; Juneja, A.; Tan, T.S. Stress and pore pressure changes due to sand compaction pile installation in soft clay. Géotechnique 2004, 54, 1–16. [Google Scholar] [CrossRef]
- Liu, J.; Xiao, H.B.; Tang, J.; Li, Q.S. Analysis of load-transfer of single pile in layered soil. Comput. Geotech. 2004, 31, 127–135. [Google Scholar] [CrossRef]
- Baca, M.; Brzakala, W. Numerical modeling of pile installation influence on surrounding soil. In Proceedings of the International Multidisciplinary Scientific GeoConference: SGEM: Surveying Geology & mining Ecology Management, Albena, Bulgaria, 27 June–6 July 2017; pp. 619–626. [Google Scholar]
- Zhang, J.; Zhang, Q.; Feng, R.; Liu, S.W.; Zhang, S.M. Discussion of Field study of residual forces developed in pre-stressed high-strength concrete (PHC) pipe piles. Can. Geotech. J. 2017, 54, 600–601. [Google Scholar] [CrossRef]


| Density (g/cm3) | Moisture Content (%) | Dry Density (g/cm3) | Void Ratio | Saturability (%) | Liquid Limit (%) | Plastic Limit (%) | internal Friction Angle (°) | Cohesion (kPa) | Coefficient of Compressibility αv1-2 (MPa−1) | Modulus of Compression ES1-2 (MPa) | Poisson’s Ratio |
|---|---|---|---|---|---|---|---|---|---|---|---|
| 1.98 | 25.3 | 1.58 | 0.728 | 94.9 | 31.3 | 16.5 | 30 | 27 | 0.32 | 5.5 | 0.3 |
© 2020 by the authors. Licensee MDPI, Basel, Switzerland. This article is an open access article distributed under the terms and conditions of the Creative Commons Attribution (CC BY) license (http://creativecommons.org/licenses/by/4.0/).
Share and Cite
Wang, Y.; Liu, X.; Sang, S.; Zhang, M.; Wang, P. A Model Test for the Influence of Lateral Pressure on Vertical Bearing Characteristics in Pile Jacking Process Based on Optical Sensors. Sensors 2020, 20, 1733. https://doi.org/10.3390/s20061733
Wang Y, Liu X, Sang S, Zhang M, Wang P. A Model Test for the Influence of Lateral Pressure on Vertical Bearing Characteristics in Pile Jacking Process Based on Optical Sensors. Sensors. 2020; 20(6):1733. https://doi.org/10.3390/s20061733
Chicago/Turabian StyleWang, Yonghong, Xueying Liu, Songkui Sang, Mingyi Zhang, and Peng Wang. 2020. "A Model Test for the Influence of Lateral Pressure on Vertical Bearing Characteristics in Pile Jacking Process Based on Optical Sensors" Sensors 20, no. 6: 1733. https://doi.org/10.3390/s20061733
APA StyleWang, Y., Liu, X., Sang, S., Zhang, M., & Wang, P. (2020). A Model Test for the Influence of Lateral Pressure on Vertical Bearing Characteristics in Pile Jacking Process Based on Optical Sensors. Sensors, 20(6), 1733. https://doi.org/10.3390/s20061733