Medical-Grade ECG Sensor for Long-Term Monitoring


Abstract
1. Introduction
2. Sensor Design
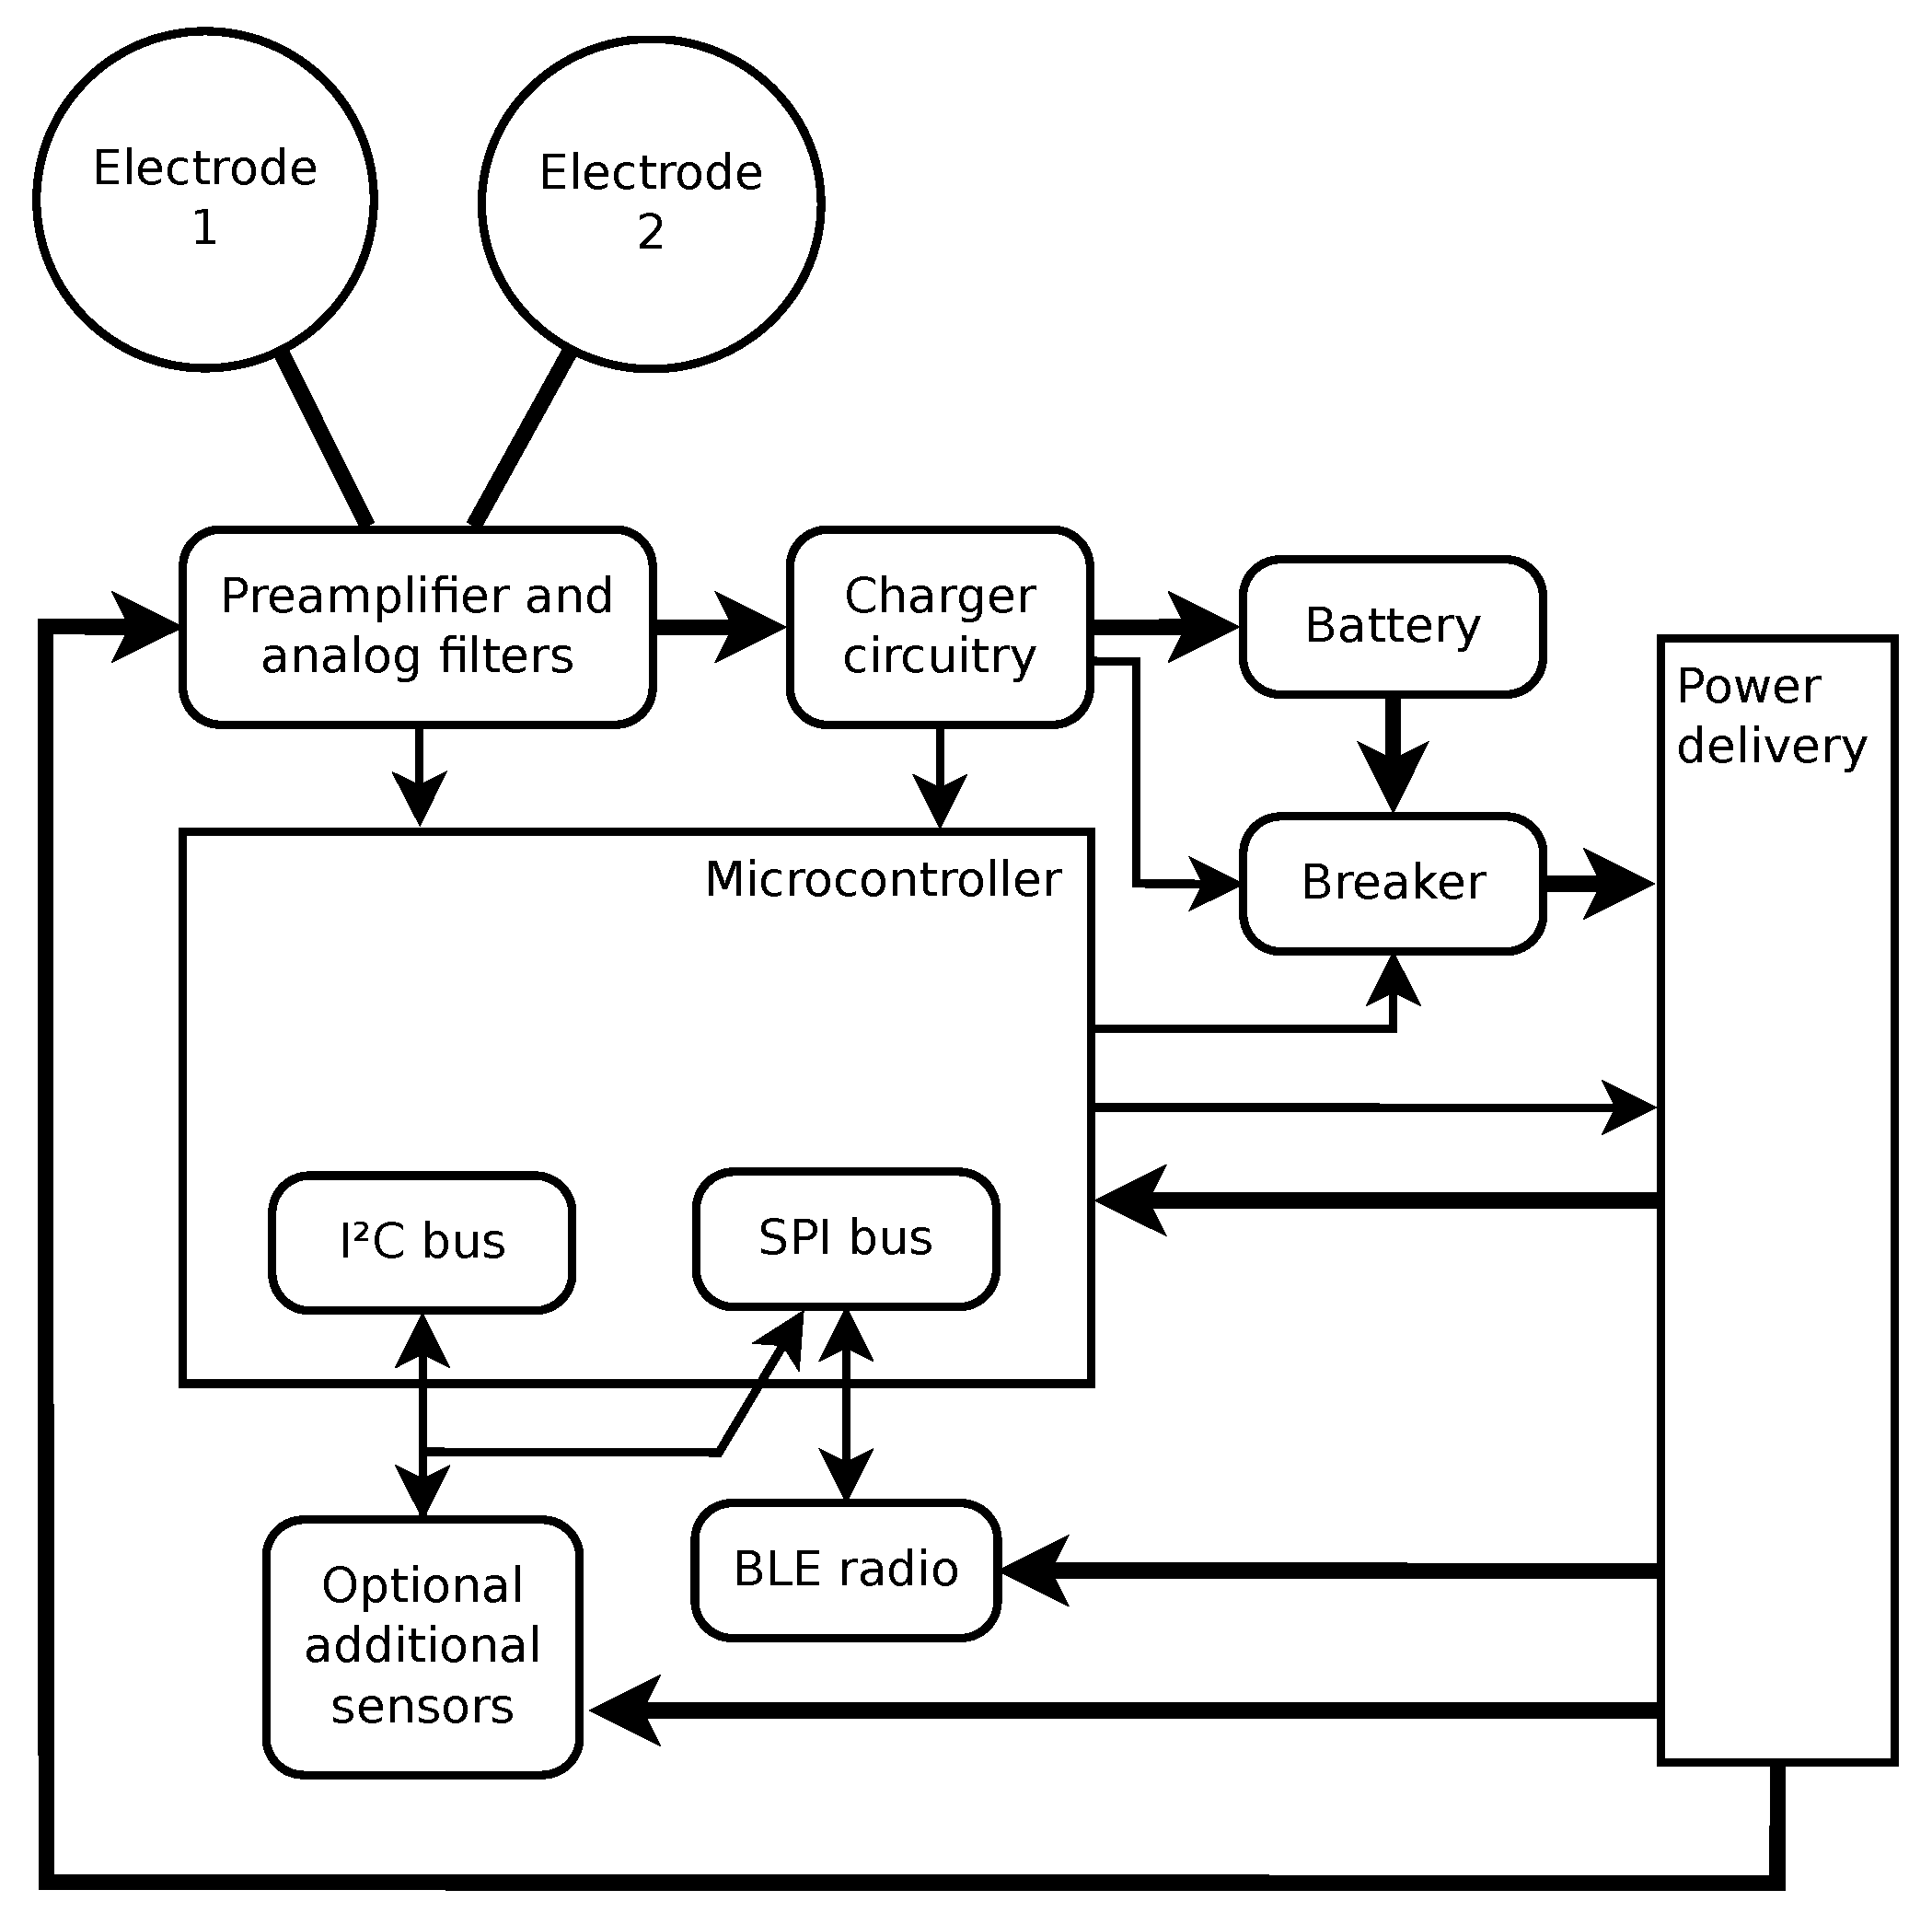
2.1. Hardware
- Electrodes 1 and 2—These two dual-purpose electrodes are the only physical interface with the outside world. They are used to either electrically connect the sensor to the body or to the external battery charger.
- Rechargeable battery.
- Preamplifier and analog filters—this circuitry takes the input signal and converts it to appropriate voltage levels to be detected by the micro-controller, applies the radio frequency low-pass filtering, ECG band-pass filtering, and provides the required input impedance for the electrodes to interface with the human body. Within this circuitry, the lines from the electrodes are also diverted to the charger circuitry.
- Charger circuitry—detects when the external battery charger is connected to the electrodes, and implements proper battery charging with hardware overcharge protection and circuit breaker resetting.
- Breaker—used to isolate all other circuitry from the battery to minimize power usage when the sensor is stored for a longer period of time.
- Micro-controller—the brains of the device, which provides ADC (analog to digital conversion) of input signals, communication with additional sensors (the sensors not embedded to the micro-controller), setting of the circuit breaker, and communication with the BLE radio transceiver.
- Optional supplementary sensors—Currently, the supplementary sensors include a thermometer and an accelerometer. They are optional in the sense that they only represent an additional functionality, which is not always required. For example, they are absent in the first production series of the sensor, which aims to provide a simple ECG measurement device.
- BLE radio—the final block of hardware used to connect to a device (like a smartphone) that will be used for data storage and control of the sensor.
- Power delivery—circuitry that enables the micro-controller to selectively deliver power to other building blocks. It is used to lower the power consumption while the sensor is not active.
- Data sampling—the process of converting the analog input signal into digital form by sampling it in regular intervals, for example, 125 times per second. It starts with the analog circuitry that converts the measured quantity into voltage on a predefined range for the ADC to measure. Then, it continues with the micro-controller that takes samples through its built-in ADC and stores them into a memory buffer, where they wait for further transfer.
- Data transfer—the process of transferring the collected data from the micro-controller to the smartphone. Samples are transmitted in bulk by the micro-controller over a standard SPI (Serial Peripheral Interface) to the chip that contains radio transceiver. The wireless transfer is then conducted by using the BLE protocol. More precisely, a custom wireless protocol built on top of BLE is used as the communication protocol between the sensor and the controlling device.
- Remote control and monitoring—provides the user interface towards the sensor through its BLE connectivity. There are several parameters and settings that may be defined by the user and also parameters that should be monitored to assure the required quality of service. Examples are sensor battery level and sampling rate selection.
2.2. Firmware
2.3. Related Sensors
3. Intended Use
4. Studies and Pilots
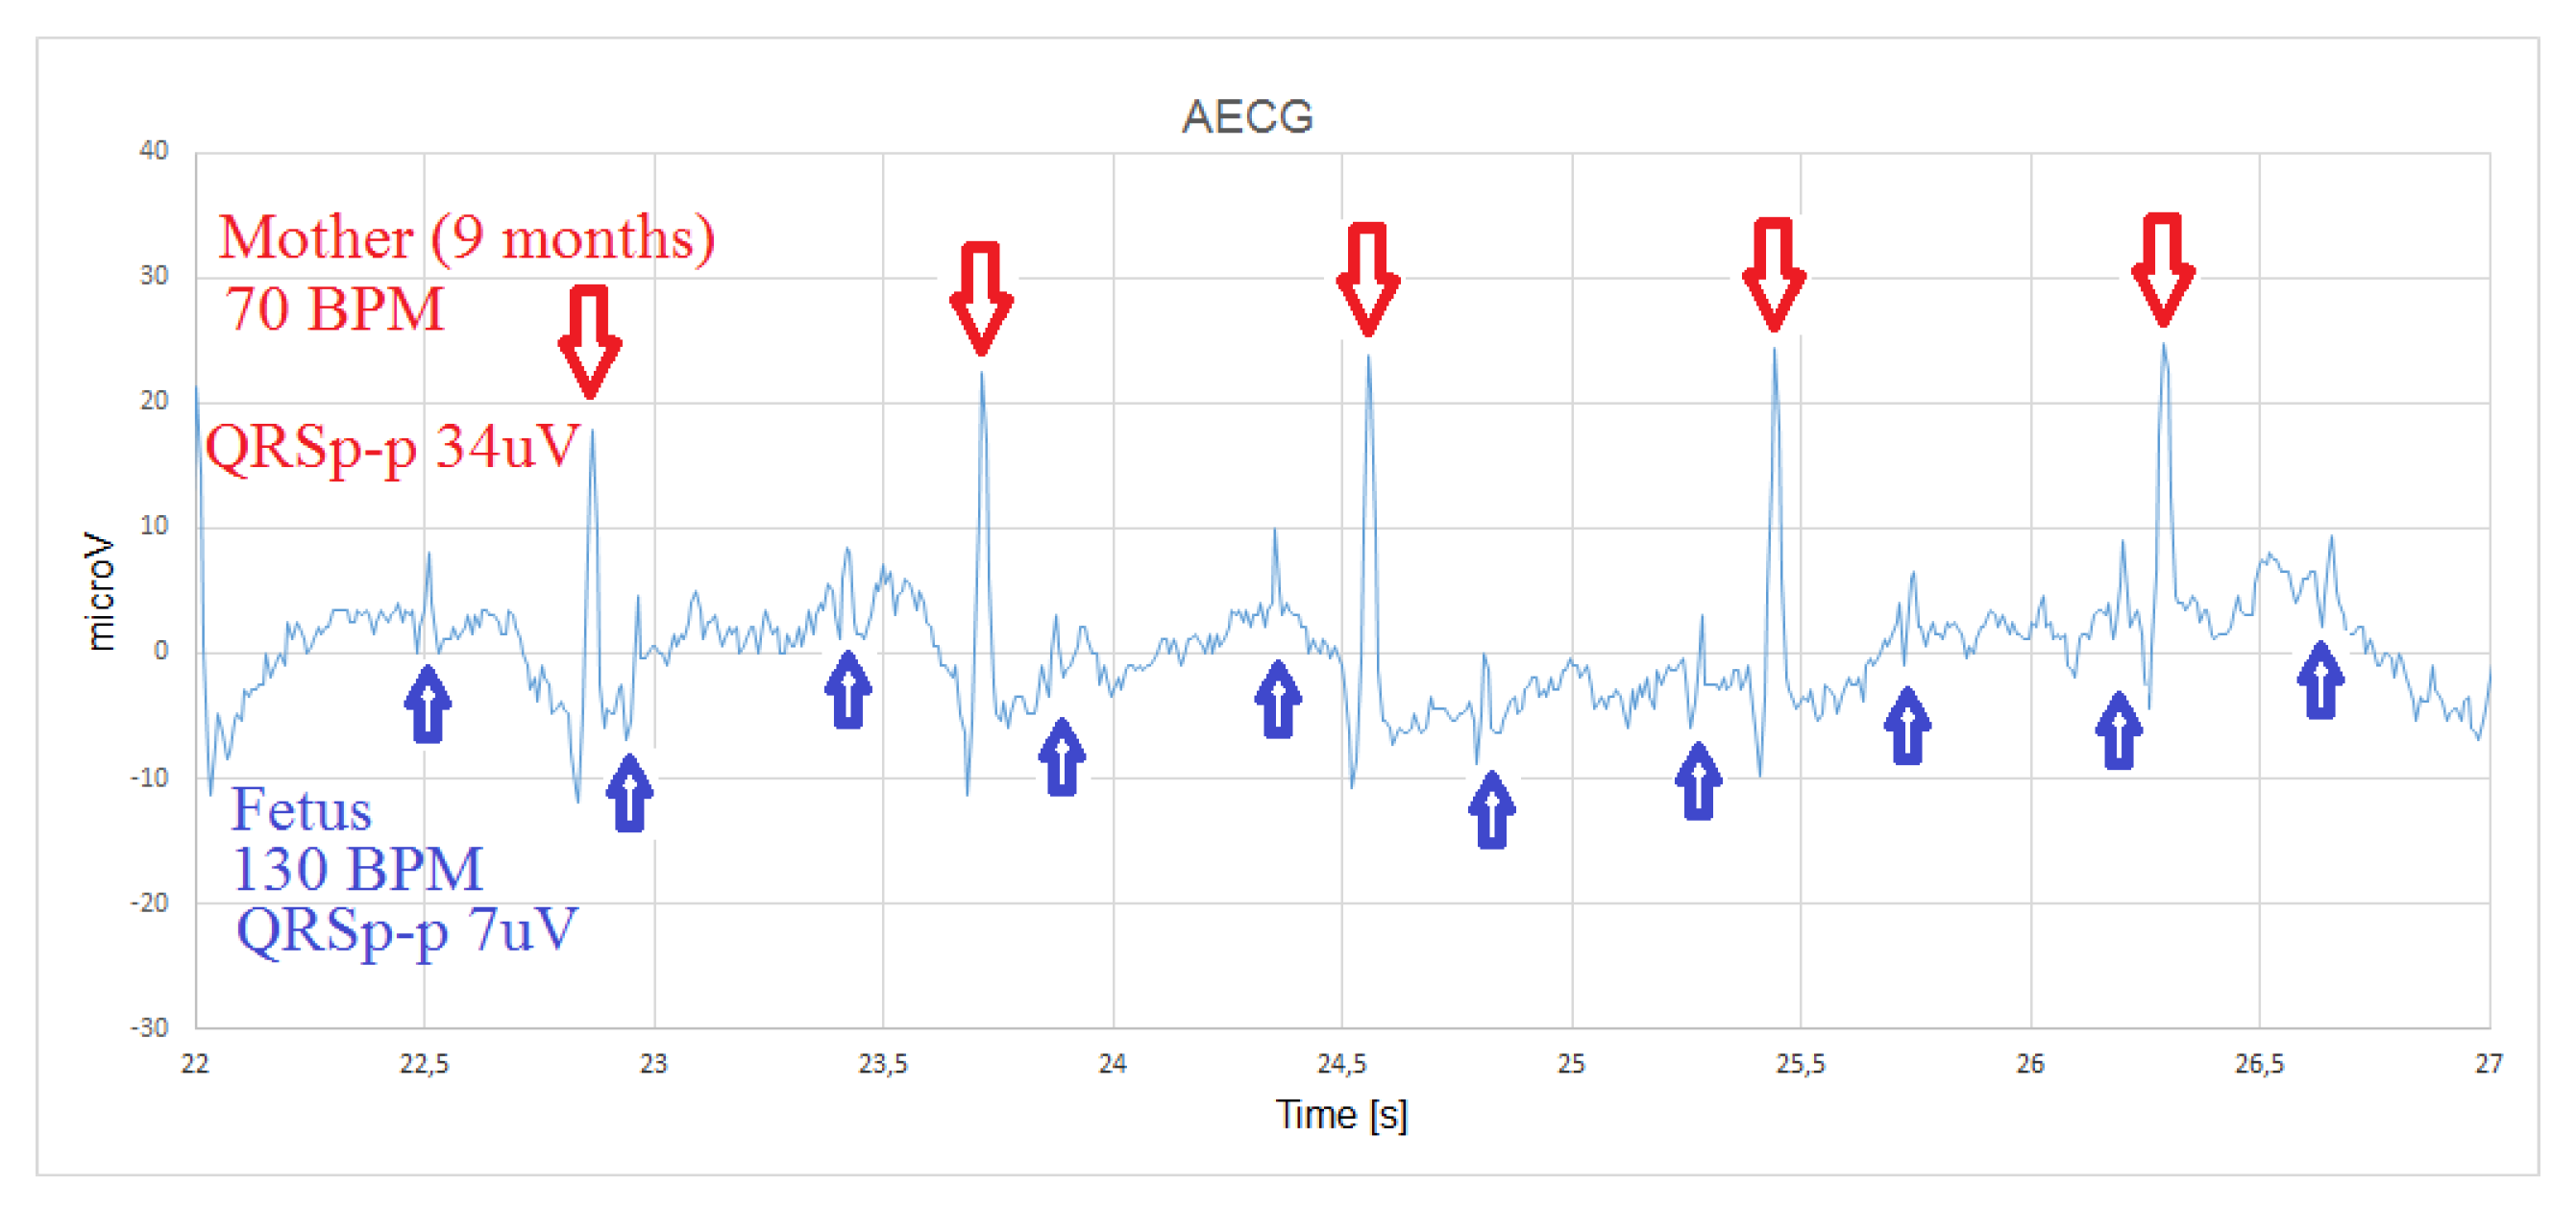
4.1. Abdominal Fetal ECG
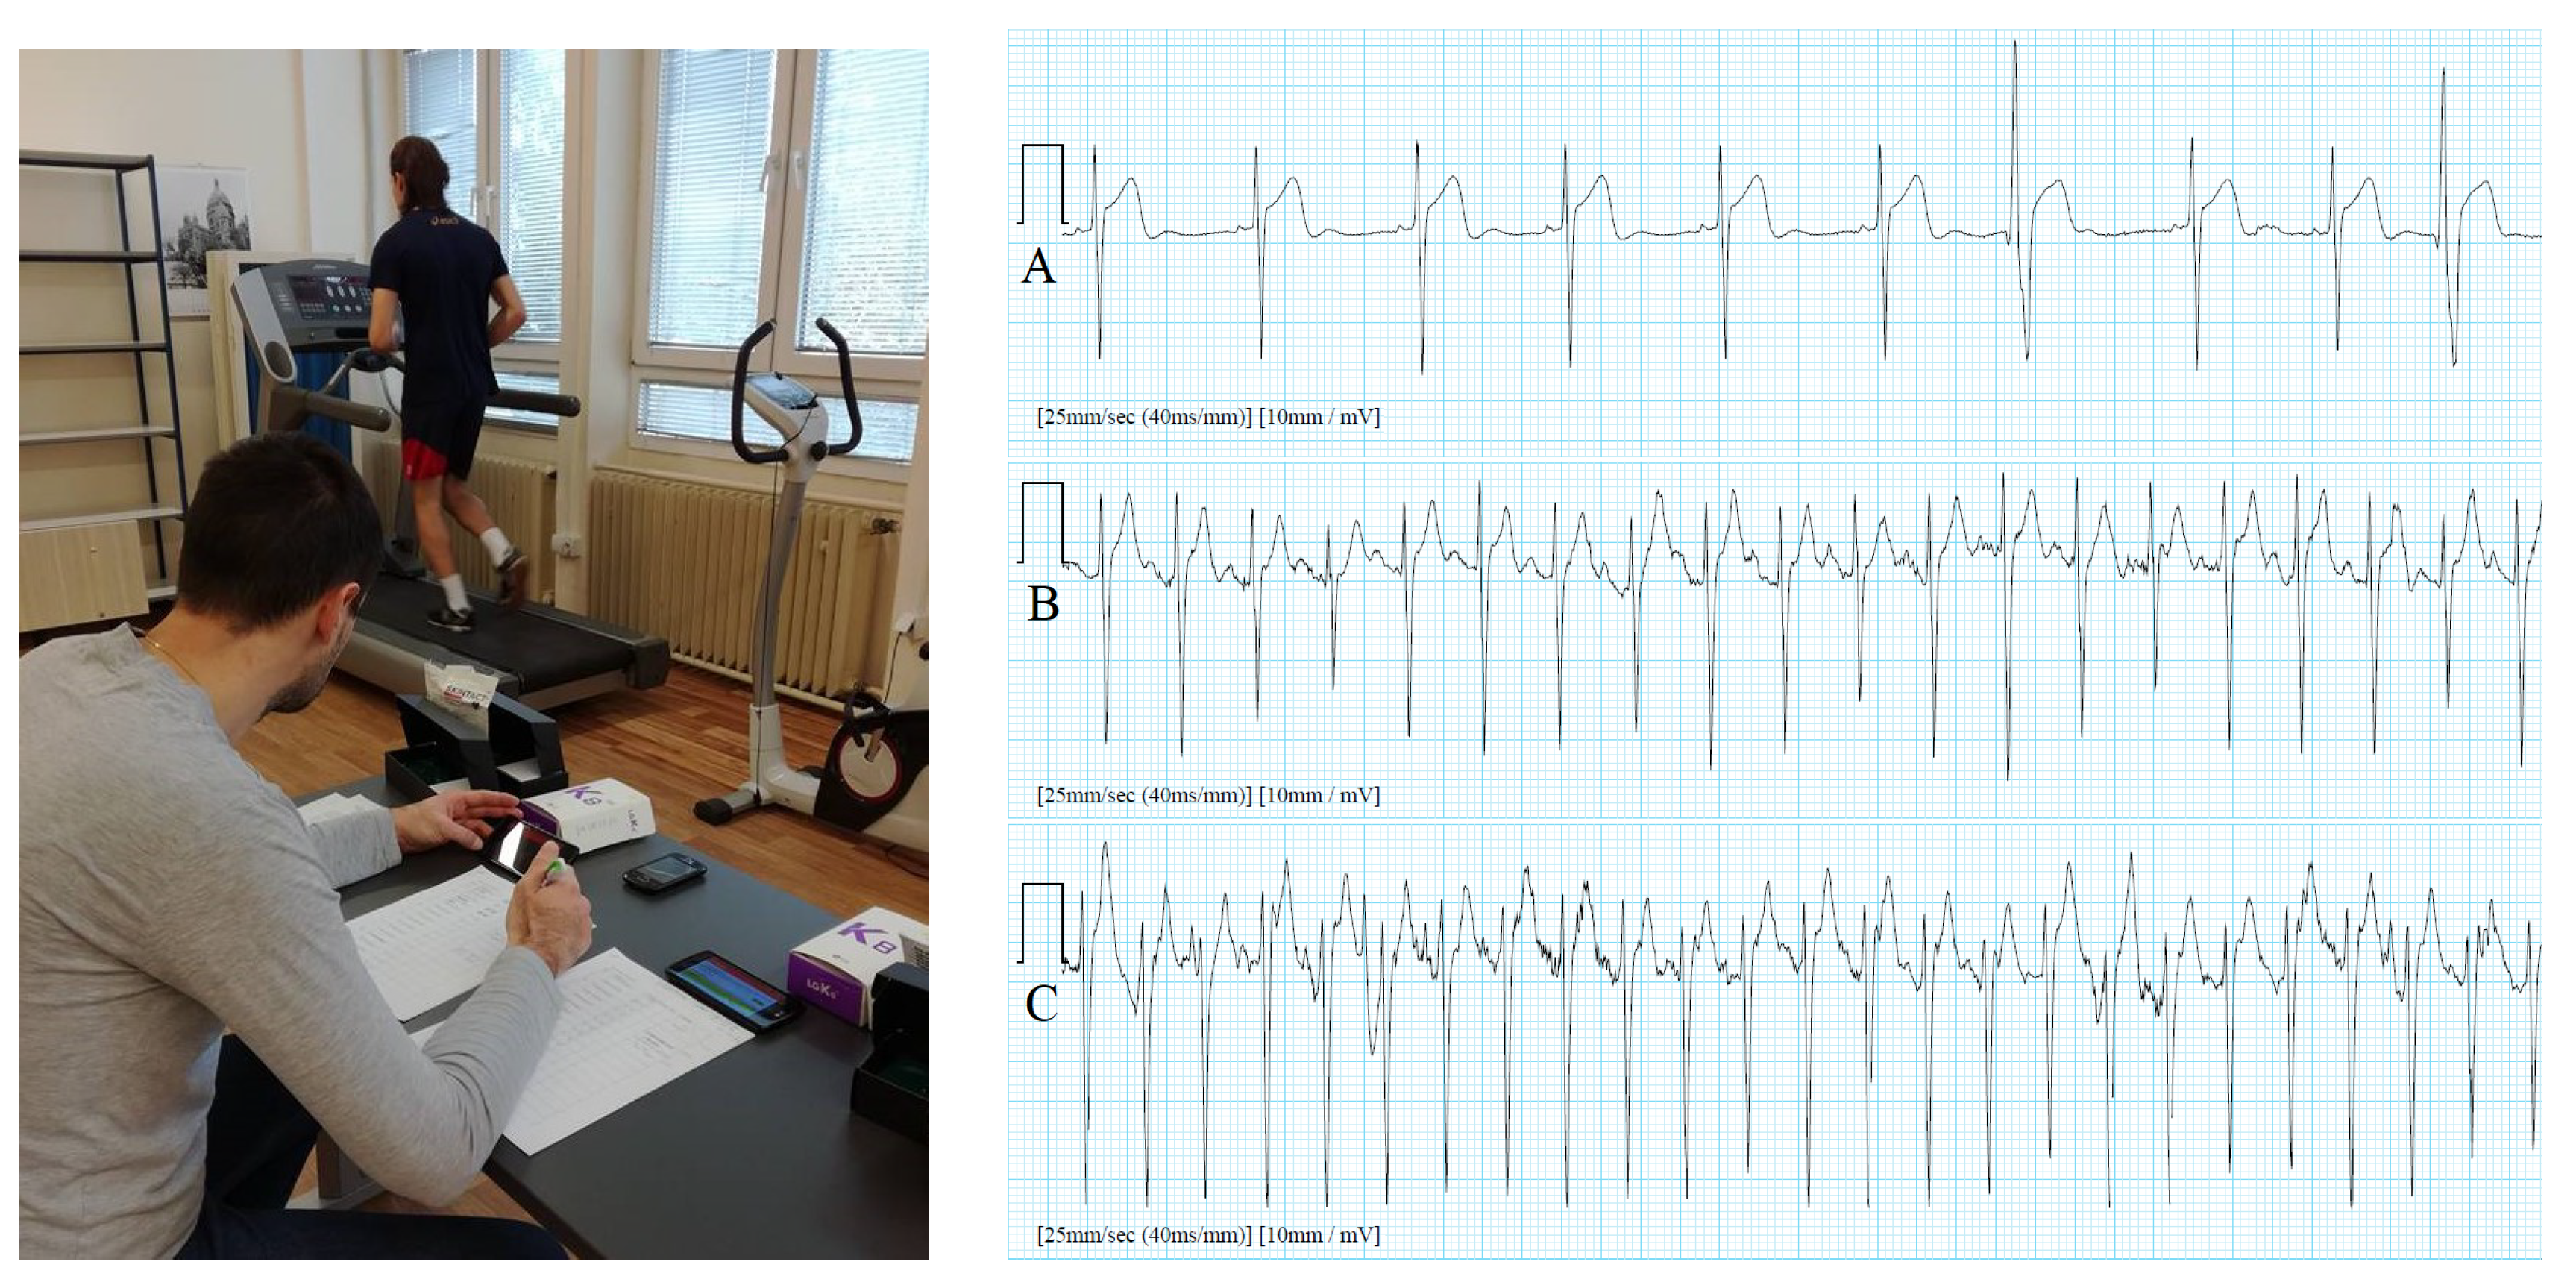
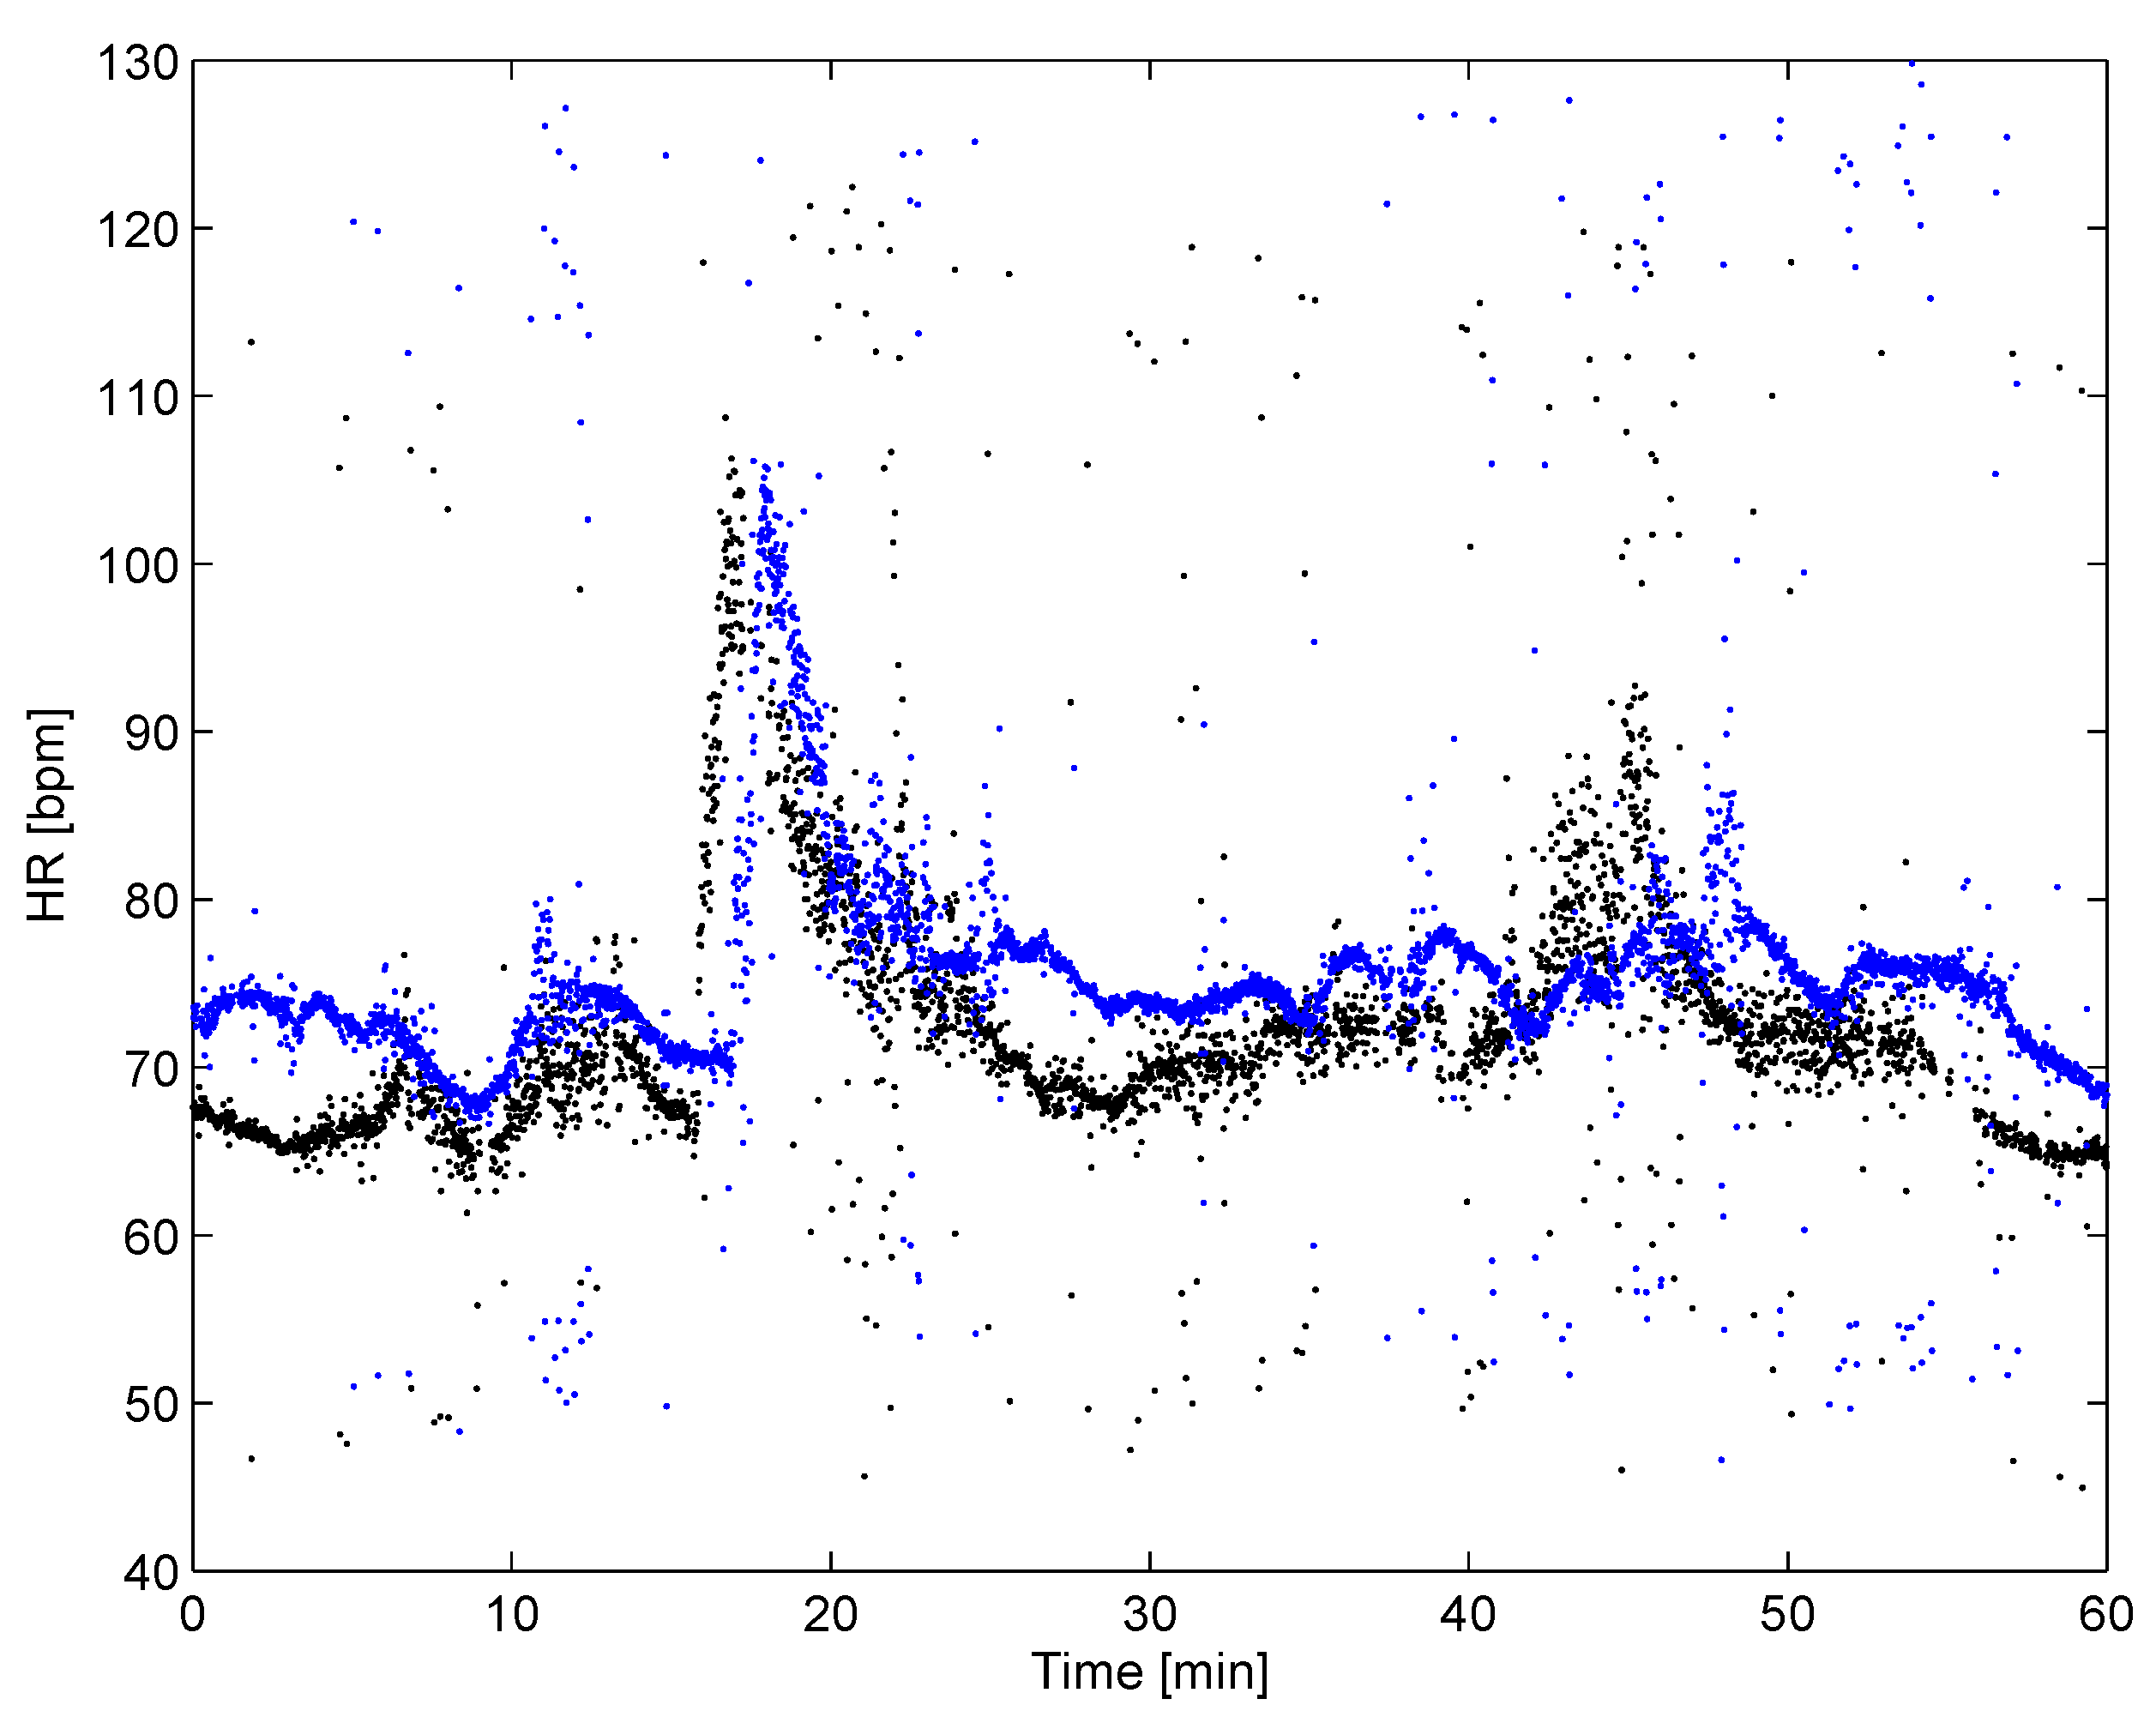
4.2. Sports/Fitness Measurements
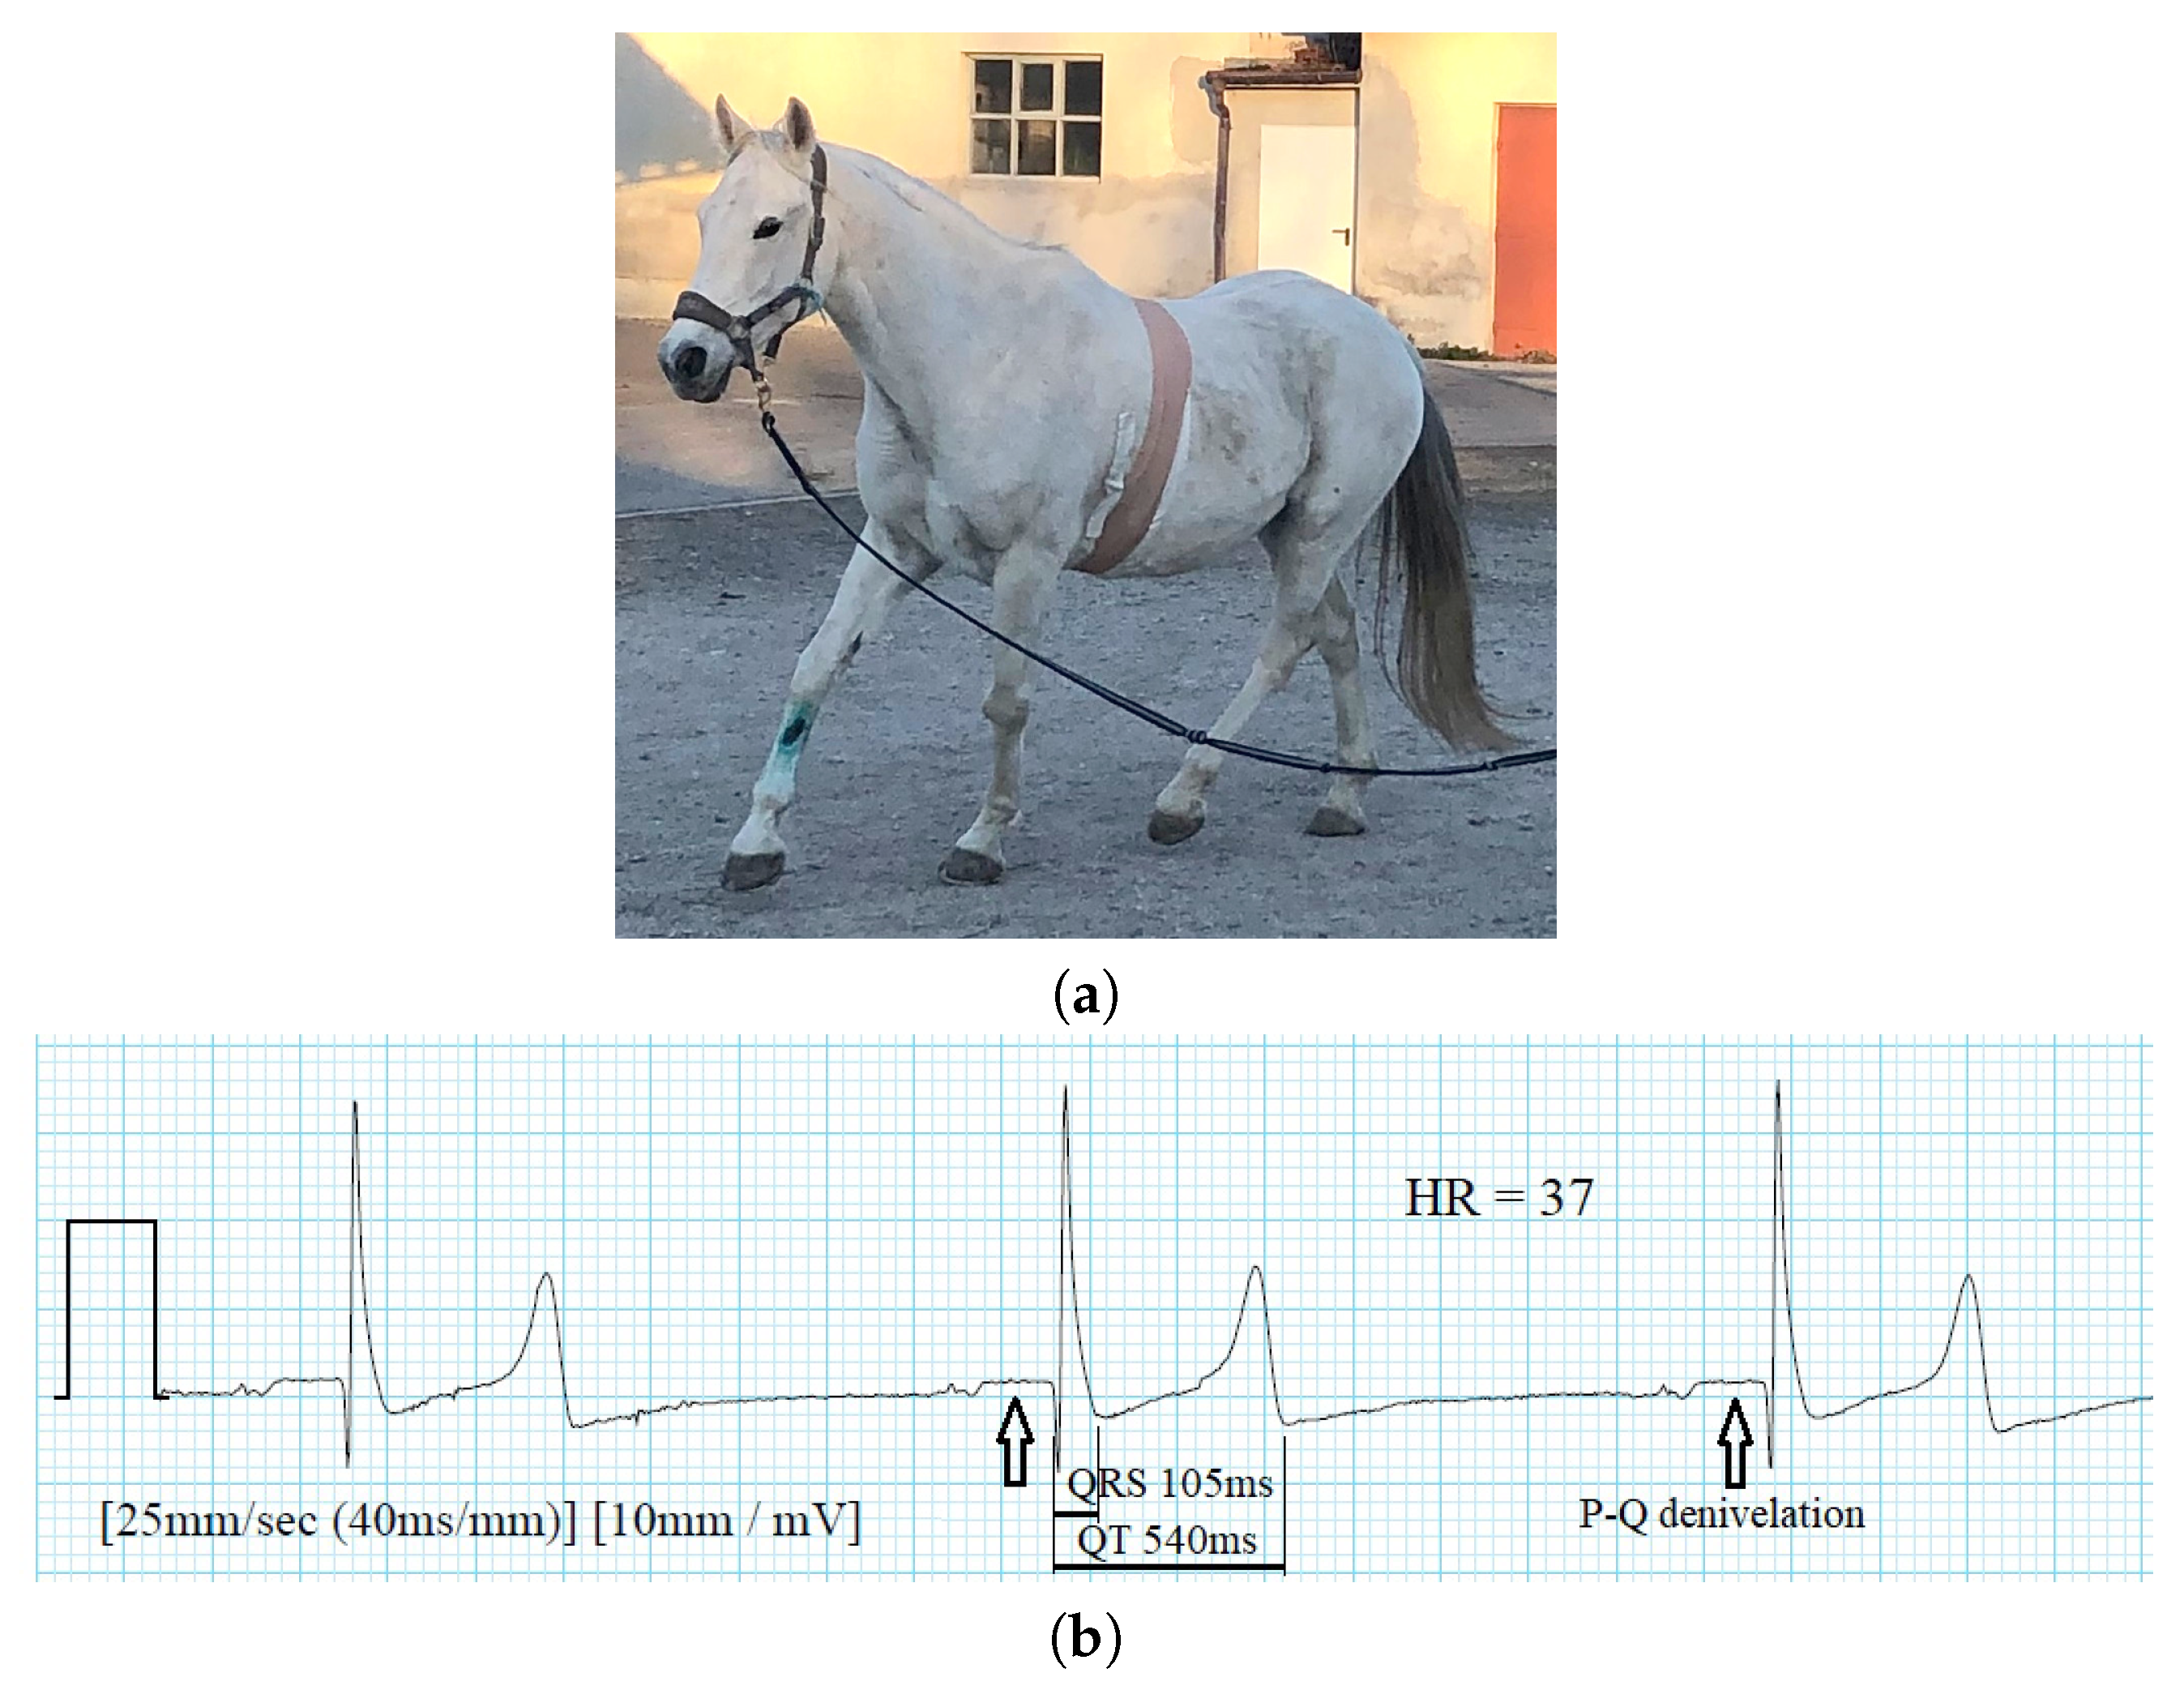
4.3. Veterinary Medicine
4.4. Pilots
4.5. Hearth Rate Variability Biofeedback Assessment and Biometric Authentication
5. Conclusions
Author Contributions
Funding
Conflicts of Interest
References
- Einthoven, W.; Fahr, G.; Waart, A. Über die Richtung und die manifeste Grösse der Potentialschwankungen im menschlichen Herzen und über den Einfluss der Herzlage auf die Form des Elektrokardiogramms. Pflüger’s Archiv für die gesamte Physiologie des Menschen und der Tiere 1913, 150, 275–315. [Google Scholar] [CrossRef]
- Macfarlane, P.W.; Lawrie, T.D.V. (Eds.) Comprehensive Electrocardiology, Theory and Practice in Health and Disease; Pergamon Press: New York, NY, USA, 1989. [Google Scholar]
- Trobec, R. Computer analysis of multichannel ECG. Comput. Biol. Med. 2003, 33, 215–226. [Google Scholar] [CrossRef]
- SCHILLER AG. ECG Measurements and Interpretation Programs, Physician’s Guide; SCHILLER AG: Baar, Switzerland, 2009. [Google Scholar]
- Zellerhoff, C.; Himmrich, E.; Nebeling, D.; Przibille, O.; Nowak, B.; Liebrich, A. How can we identify the best implantation site for an ECG event recorder? Pacing Clin. Electrophysiol. 2000, 23, 1545–1549. [Google Scholar] [CrossRef] [PubMed]
- Bifulco, P.; Cesarelli, M.; Fratini, A.; Ruffo, M.; Pasquariello, G.; Gargiulo, G. A wearable device for recording of biopotentials and body movements. In Proceedings of the IEEE International Workshop on Medical Measurements and Applications (MeMeA), Bari, Italy, 30–31 May 2011; pp. 469–472. [Google Scholar]
- Pantelopoulos, A.; Bourbakis, N.G. A Survey on Wearable Sensor-Based Systems for Health Monitoring and Prognosis. IEEE Trans. Syst. Man Cybern. Part C Appl. Rev. 2010, 40, 1–12. [Google Scholar] [CrossRef]
- Lindén, M.; Björkman, M. Embedded sensor systems for health - providing the tools in future healthcare. Stud. Health Technol. Inf. 2014, 200, 161–163. [Google Scholar]
- Trobec, R.; Tomašić, I.; Rashkovska, A.; Depolli, M.; Avbelj, V. Body Sensors and Electrocardiography; Springer: Cham, Switzerland, 2018. [Google Scholar]
- De Capua, C.; Meduri, A.; Morello, R. A Smart ECG Measurement System Based on Web-Service-Oriented Architecture for Telemedicine Applications. IEEE Trans. Instrum. Meas. 2010, 59, 2530–2538. [Google Scholar] [CrossRef]
- Trobec, R.; Avbelj, V.; Rashkovska, A. Multi-functionality of wireless body sensors. IPSI BgD Trans. Internet Res. 2014, 10, 23–27. [Google Scholar]
- Depolli, M.; Avbelj, V.; Trobec, R.; Kališnik, J.M.; Korošec, T.; Susič, A.P.; Stanič, U.; Semeja, A. PCARD Platform for mHealth Monitoring. Informatica 2016, 40, 117–123. [Google Scholar]
- EU Commission. Commission communication in the framework of the implementation of the Council Directive 93/42/EEC concerning medical devices. Off. J. Eur. Union 2017, 389, 29–61. [Google Scholar]
- Trobec, R.; Depolli, M.; Avbelj, V. Wireless network of bipolar body electrodes. In Proceedings of the Seventh International Conference on Wireless On-demand Network Systems and Services (WONS), Kranjska Gora, Slovenia, 3–5 February 2010; pp. 145–150. [Google Scholar]
- Trobec, R.; Rashkovska, A.; Avbelj, V. Two proximal skin electrodes–a respiration rate body sensor. Sensors 2012, 12, 13813–13828. [Google Scholar] [CrossRef] [PubMed]
- Trobec, R.; Tomašić, I. Synthesis of the 12-lead electrocardiogram from differential leads. IEEE Trans. Inf. Technol. Biomed. 2011, 15, 615–621. [Google Scholar] [CrossRef] [PubMed]
- Tomašić, I.; Frljak, S.; Trobec, R. Estimating the universal positions of wireless body electrodes for measuring cardiac electrical activity. IEEE Trans. Inf. Technol. Biomed. 2013, 60, 3368–3374. [Google Scholar] [CrossRef] [PubMed]
- Turakhia, M.P.; Hoang, D.D.; Zimetbaum, P.; Miller, J.D.; Froelicher, V.F.; Kumar, U.N.; Xu, X.; Yang, F.; Heidenreich, P.A. Diagnostic Utility of a Novel Leadless Arrhythmia Monitoring Device. Am. J. Cardiol. 2013, 112, 520–524. [Google Scholar] [CrossRef]
- Ackermans, P.A.; Solosko, T.A.; Spencer, E.C.; Gehman, S.E.; Nammi, K.; Engel, J.; Russell, J.K. A user-friendly integrated monitor-adhesive patch for long-term ambulatory electrocardiogram monitoring. J. Electrocardio. 2012, 45, 148–153. [Google Scholar] [CrossRef]
- Hansen, I.H.; Hoppe, K.; Gjerde, A.; Kanters, J.K.; Sorensen, H.B.D. Comparing twelve-lead electrocardiography with close-to-heart patch based electrocardiography. In Proceedings of the 37th Annual International Conference of the IEEE Engineering in Medicine and Biology Society (EMBC), Milan, Italy, 25–29 August 2015; pp. 330–333. [Google Scholar]
- Tomašić, I.; Rashkovska, A.; Trobec, R.; Lindén, M. The Implications of the Lead Theory on the Patch ECG Devices Positioning and Measurement. In World Congress on Medical Physics and Biomedical Engineering; Springer: Singapore, 2018; pp. 693–696. [Google Scholar]
- Rashkovska, A.; Avbelj, V. Three-year experience with a wireless ECG sensor. In Proceedings of the 41st International Convention MIPRO, Opatija, Croatia, 21–25 May 2018; pp. 256–259. [Google Scholar]
- Rashkovska, A.; Avbelj, V. Abdominal fetal ECG measured with differential ECG Sensor. In Proceedings of the 40th International Convention MIPRO, Opatija, Croatia, 22–26 May 2017; pp. 308–310. [Google Scholar]
- Thompson, P.D.; Franklin, B.A.; Balady, G.J.; Blair, S.N.; Corrado, D.; Estes, N.M.; Fulton, J.E.; Gordon, N.F.; Haskell, W.L.; Link, M.S.; et al. Exercise and Acute Cardiovascular Events. Circulation 2007, 115, 2358–2368. [Google Scholar] [PubMed]
- Širaiy, B.; Trobec, R.; Ilić, V. Quality of One-channel Telemetric ECG Sensor Signal in Maximum Exercise Stress Tests. Meas. Sci. Rev. 2019, 19, 79–85. [Google Scholar] [CrossRef]
- Porszasz, J.; Casaburi, R.; Somfay, A.; Woodhouse, L.; Whipp, B. A treadmill ramp protocol using simultaneous changes in speed and grade. Med. Sci. Sports Exerc. 2003, 35, 1596–1603. [Google Scholar] [CrossRef] [PubMed]
- WHO. Physical Activity Key Facts. 2018. Available online: http://www.who.int/mediacentre/factsheets/fs385/en/ (accessed on 16 March 2020).
- Širaiy, B.; Stanič, U.J.; Poplas-Sušič, A.; Katkič, Z. Impact assessment of the morning gymnastics “1000 movements” via ECG and sport test. In Proceedings of the 41st International Convention MIPRO, Opatija, Croatia, 21–25 May 2018; pp. 260–264. [Google Scholar]
- Krvavica, A.; Likar, S.; Brložnik, M.; Domanjko-Petrič, A.; Avbelj, V. Comparison of wireless electrocardiographic monitoring and standard ECG in dogs. In Proceedings of the 39th International Convention MIPRO, Opatija, Croatia, 30 May–3 June 2016; pp. 396–399. [Google Scholar]
- Brložnik, M.; Avbelj, V. A case report of long-term wireless electrocardiographic monitoring in a dog with dilated cardiomyopathy. In Proceedings of the 40th International Convention MIPRO, Opatija, Croatia, 22–26 May 2017; pp. 303–307. [Google Scholar]
- Brložnik, M.; Likar, S.; Krvavica, A.; Avbelj, V.; Domanjko-Petrič, A. Wireless body sensor for electrocardiographic monitoring in dogs and cats. J. Small Anim. Pract. 2019, 60, 223–230. [Google Scholar] [CrossRef] [PubMed]
- Brložnik, M.; Petric, A.; Kos, V.; Rashkovska, A.; Avbelj, V. Wireless body sensor for electrocardiographic monitoring in equine medicine. In Proceedings of the 42nd International Convention MIPRO, Opatija, Croatia, 20–24 May 2019; pp. 279–283. [Google Scholar]
- Kocjančič, S.; Avbelj, V. Electrocardiographic sensor: How to use it among general physicians. In Proceedings of the 21st International Multiconference Information Society-IS, Ljubljana, Slovenia, 8–12 October 2018; pp. 35–36. [Google Scholar]
- Čarman, D.; Cvetkovič, T.; Avbelj, V.; Kališnik, J. A study of postoperative atrial fibrillation. In Proceedings of the 21st International Multiconference Information Society-IS, Ljubljana, Slovenia, 8–12 October 2018; pp. 7–10. [Google Scholar]
- Enova, D.; Trobec, R.; Mesarič, K.; Slevec, K.; Ambrožič, B.; Enova, T. New HRV biofeedback technique and monitoring its effects in a psychotherapeutic group of coronary patients with SAVVY mini ECG devices installed. In Proceedings of the 21st International Multiconference Information Society-IS, Ljubljana, Slovenia, 8–12 October 2018; pp. 24–27. [Google Scholar]
- Šprager, S.; Trobec, R.; Jurič, M. Feasibility of biometric authentication using wearable ECG body sensor based on higher-order statistics. In Proceedings of the 40th International Convention MIPRO, Opatija, Croatia, 22–26 May 2017; pp. 264–269. [Google Scholar]
- Šprager, S.; Jurič, M. Inertial sensor-based gait recognition: A review. Sensors 2015, 15, 22089–22127. [Google Scholar] [CrossRef] [PubMed]


© 2020 by the authors. Licensee MDPI, Basel, Switzerland. This article is an open access article distributed under the terms and conditions of the Creative Commons Attribution (CC BY) license (http://creativecommons.org/licenses/by/4.0/).
Share and Cite
Rashkovska, A.; Depolli, M.; Tomašić, I.; Avbelj, V.; Trobec, R. Medical-Grade ECG Sensor for Long-Term Monitoring. Sensors 2020, 20, 1695. https://doi.org/10.3390/s20061695
Rashkovska A, Depolli M, Tomašić I, Avbelj V, Trobec R. Medical-Grade ECG Sensor for Long-Term Monitoring. Sensors. 2020; 20(6):1695. https://doi.org/10.3390/s20061695
Chicago/Turabian StyleRashkovska, Aleksandra, Matjaž Depolli, Ivan Tomašić, Viktor Avbelj, and Roman Trobec. 2020. "Medical-Grade ECG Sensor for Long-Term Monitoring" Sensors 20, no. 6: 1695. https://doi.org/10.3390/s20061695
APA StyleRashkovska, A., Depolli, M., Tomašić, I., Avbelj, V., & Trobec, R. (2020). Medical-Grade ECG Sensor for Long-Term Monitoring. Sensors, 20(6), 1695. https://doi.org/10.3390/s20061695