Article

Non-Destructive Evaluation Device for Monitoring Fluid Viscosity

1
Department of Mechanical and Nuclear Engineering, Virginia Commonwealth University, Richmond, VA 23284, USA
2
Department of Electrical and Computer Engineering, John Hopkins University, Baltimore, MD 21218, USA
*
Author to whom correspondence should be addressed.
Sensors 2020, 20(6), 1657; https://doi.org/10.3390/s20061657
Submission received: 13 February 2020 / Revised: 6 March 2020 / Accepted: 13 March 2020 / Published: 17 March 2020
(This article belongs to the Section Physical Sensors)

Abstract

:
There is an increasing need for non-destructive, low-cost devices for real-time fluid viscosity monitoring. Therefore, in this study, a method based on structural health monitoring is adapted for monitoring fluid properties. A device is built such that an inexpensive and disposable viscosity probe be possible. The design incorporates a sensor/actuator pair using a piezoelectric material layered with copper/brass and capable of monitoring viscosity changes in low volume liquids (e.g., vacutainer vial). Experiments performed with the new device show a definite pattern of wave propagation in viscous solutions. A numerical model is built to investigate the wave propagation in the fluid. For experimental measurements, the sensor part of the device detects the generated pressure wave in fluid (e.g., air, water, glycerin) by the actuator part. The phase shift between the actuator and the sensor signals is then recorded and plotted for different concentrations of glycerin and water at room temperature. The results of this study show a direct correlation between the phase shift and varying viscosity in the ultrasonic frequency range from 6 to 9 MHz. The numerical simulation, performed utilizing acoustic modal and harmonic response analysis, results also demonstrate the same trend as the experimental results: a phase shift increases with the viscosity of the fluid.

1. Introduction

Real-time inline viscosity monitoring of fluids is vital in many different industries ranging from the oil industry to healthcare applications [1,2,3,4,5]. For instance, in the oil and petroleum industry, viscosity measurements play a vital role in determining the oil quality that can affect the pipeline [6]. In the healthcare industry, monitoring blood viscosity is crucial for the treatment of some diseases, such as vascular-related diseases [7]. Standard laboratory viscometers, such as capillary tube and rotating ones, need long measurement times and a large volume sample [8]. Besides, rotating viscometers can be costly and require specialized training [1,8,9], and they are unable to measure viscosity in real-time continuously [1,3]. Thus, there is an increasing need for accurate, real-time, and low-cost viscosity measurement devices. Hence, a wide variety of devices have been developed over the years to establish high sensitivity, small size, easy of manufacture and use, real-time measurement, and low-cost [7,10,11,12]. Modern viscosity measurement devices can be categorized based on their operational principle of monitoring parameters (a) displacement, (b) vibrations, and (c) wave propagation in fluids of different viscosities [4,13,14].
A typical example of the first device category, a displacement approach, is based on correlating the viscosity of a fluid to the displacement of a ferromagnetic piston between two electromagnetic coils [15]. A recent method uses a fiber-optic sensor to measure the amplitude and phase responses to vibration without electromagnetic interference [11]. Zhang et al. [16] demonstrate a system that utilizes a polyvinylidene fluoride (PVDF) cantilever probe for actuation and a laser displacement sensor for detection. Though these devices are designed for specific applications, they usually work within a constrained low range of viscosity values and require specialized equipment such as optic fibers and lasers [17].
For the second category b, vibrations based, a wide variety of devices are available. One typical example consists of a piezoelectric cantilever sensor, which correlates the resonance frequency shift and fluid viscosity [18,19]. Similarly, measuring the resonance frequency of a vibrating beam by applying a Lorentz force generated by an Alternating Current (AC) in a permanent magnetic field is another mechanism that has been explored [20,21]. Lu et al. [22] propose a piezoelectric-excited membrane device using the PVDF membrane’s resonant frequency and Q factor responses to determine viscosity. Thickness shear mode resonators are other examples which use piezoelectric patches with electrodes on both sides [2,7]. The resonator is excited when an AC voltage is applied to the piezoelectric leads, thus changing the vibration characteristics for the resonator. The peak frequency of the resonator is affected by either the fluid medium [2,23] or a microcantilever structure by exerting an external force at the free end of the beam [3].
Similarly, quartz thickness-shear mode sensors are adapted to measure viscosity [7]. This sensor, in particular, monitors the process of platelet activation, which leads to thrombus formation (clotting). By following the sensors admittance frequency shifts concerning different concentrations of platelet activation, coagulation can be detected [7]. Purohit et al. [24] report a radial mode piezo-resonator disc to improve the ultrasonic determination of viscosity in liquids by correlating resonant frequency changes to viscosity. Another type worth mentioning is a capacitive micromachined transducer [12,25], which utilizes a non-destructive ultrasonic pulse-echo system using piezoelectric materials as membrane sensors and actuators. The changes to the waveform received due to mass changes correlate to viscosity. With the development of microelectromechanical systems (MEMS) technology, viscosity, and density measurements of different fluids are possible [5,10,26,27,28,29,30]. However, issues, including inaccurate estimation, low range of viscosities, lack of analytical models, and complex calibration procedures, remain a barrier with these types of devices [10,26,27].
The third type of devices measure the propagation time of wave in a fluid and correlate the result to the fluid viscosity. For instance, a piezoelectric sensor sends a signal to a liquid medium, and a reflector sends the signal back to the device [31]. The reflected wave impedance is then measured and correlated to viscosity [1,9]. This method requires a reflector and a large container and sample volume. This method has been widely used in structural health monitoring of solids or structures for years [31,32,33].
The work presented here proposes a new device that utilizes a method based on structural health monitoring and type c devices. In structural health monitoring, piezoelectric materials (such as lead zirconate titanate, PZT) are often used to sense and send waves to diagnose the mechanical failure of a structure, such as a crack or a loose fastener [32,33]. First, piezoelectric patches are attached to a structure, then using wave propagation, changes in the signal serve to identify structural changes by measuring impedance, current, etc. [33]. This method can be beneficial for the industrial sector as it does not need high-power devices or other sophisticated systems [32,33,34]. The drawbacks of these methods in structural health monitoring are scalability, and data processing can be quite complicated as the structures get large, more sensors and actuators are needed. These disadvantages, however, can be an advantage with viscous flows in small spaces.
In particular, this study aims to monitor fluid viscosity using a method similar to the one used in the non-destructive evaluation of structures. With the proposed approach, changes in the waveform of the signal received by a piezoelectric sensor partially submerged in different fluids can be correlated to viscosity. In this particular case, different viscosities are accomplished by mixing deionized (DI) water with glycerin. The goal is to demonstrate both numerically and experimentally that these techniques can be used to monitor bulk fluid properties such as viscosity, using ultrasound wave propagation in small volumes of fluid. This characteristic can be quite an advantage in specific applications, such as in the healthcare industry. An overview of the available methods to monitor viscosity, including the proposed method is shown in Table 1.

2. Design and Fabrication

2.1. Design

The design presented in this work consists of a piezoelectric sensor and actuator device pair based on a tuning fork principle using an actuator sensor pair. The device design constraints are size (small footprint, portability) and marketability (ease of manufacture, low cost, and expendable). A commercially available soft PZT (type 5A) was chosen for the sensor and actuator pair to satisfy marketability requirements. The PZT is bonded to a hollow brass tube, which is used to accommodate wiring on two opposite sides allowing the device to share a ground connection. The piezoelectric material that serves as an actuator vibrates as a function of the applied voltage signal, Vo sin(wt+ϕo) where Vo is the applied voltage at a particular frequency (f = w/2π), and an initial phase angle ϕo= 0. The actuator produces sound pressure waves that travel approximately 5 mm through the fluid medium to the sensor that then records a waveform with an amplitude, Vr or received voltage, and a phase angle ϕr, VR sin(wt+ϕr). The proposed method is illustrated in Figure 1.

2.2. Fabrication

2.2.1. Materials

After considering several prototypes, the device built consists of layered materials bonded with a conventional adhesive at room temperature. The layers help to ensure structural integrity and ruggedness. These consisted of (a) two rectangular plates of PZT polarized with Nickel electrodes (23 × 5 mm with thickness of 1 mm by Morgan Matroc Ceramics); (b) two copper layers (25 × 6 mm with thickness of 1 mm); and (c) a rectangular hollow bar with a square cross-section made of brass (70 × 5 mm with thickness of 5 mm). The layers can be shown in Figure 1.

2.2.2. Assembly

The assembly consists of a square hollow brass bar coated with polyethylene to provide electrical insulation. Then, two thin layers of Copper (0.1 cm) and PZT (0.1 cm) are placed with an adhesive to two of the outside opposing faces of the bar. Wires are soldered to the PZT surfaces for a positive connection, and the copper layer becomes ground. Heat shrink-wrap is used to secure the cables in place and minimize the footprint of the device. The final prototype fits easily inside a standard vacutainer (Lithium Heparin 56USP with a diameter of 13 mm, a capacity of 3 mL, and tube length of 75 mm). The final fabricated device and all dimensions are shown in Figure 2.

3. Experimental Setup

Once the prototype is complete, a method that provides a consistent volume ratio of the several mixtures of glycerin and water is required. For experimental testing, the volume was kept constant at approximately 0.75 mm3 measured using a syringe. In this manner, only the tip of the probe is submerged in the liquid.
A LabView® program records and controls a Hewlett Packard 4194A Impedance/Gain-Phase Analyser capable of measuring capacitance, impedance, gain, and phase angles. The analyzer scans frequencies and supply a sinusoidal wave to the actuator and monitor the signal received by the sensor. The applied signal is a sinusoidal wave with an amplitude of 0.5Volts at a range of frequencies between 100 Hz and 40 MHz. The measured gain and phase are the ratio of the amplitudes and the phase difference between the two signals. All measurements were performed in a custom-made Faraday cage to avoid interference in the high-frequency ranges. Figure 3 illustrates the experimental setup.
In addition to the Gain-Phase measurements, the impedance of the device in different liquids is also monitored. The range of frequencies is smaller since piezoelectric devices consume more current at the higher frequencies, and the impedance is not measured accurately at higher values. The following steps summarize procedures of a typical set of experiments: Measuring (1) the impedance of the actuator or sensor in water and glycerin; and; (2) the gain-phase with two different concentrations and mixtures of distilled water (DI) and glycerin. Once the experimental data is collected, it is analyzed using the software Sigma Plot.

4. Modeling

A computer-generated model of the piezoelectric viscosity probe is built with dimensions of 5 × 5 × 70 mm, two copper sheets with dimensions of 6 × 0.1 × 25 mm, and two pieces of PZT type 5A with dimensions of 5 × 0.1 × 23 mm. Figure 4a and b show a diagram of the device assembly created using SolidWorks®.
Mechanical properties for all materials are listed in Table 2. All materials utilized are assumed to be isotropic except for the PZT material. The mesh of the probe and the surrounded fluid are assigned automatically using mesh element Solid 186 for the probe and Solid 187 for the surroundings. Mesh element Solid 186 has a quadratic displacement behavior, and each node contains three orthogonal translational degrees of freedom, which ensures the mesh is accurate and complete. For the fluid surrounding the probe, Fluid 220, and Fluid 221 is utilized. These last two elements have four degrees of freedom: the pressure and the three translational degrees of freedom, as shown in Figure 4c. Boundary conditions restrain the top of the probe to be consistent with the experiments to u = ux = uy = uz = 0.
A three-dimensional finite element model was created using multi-physics software (ANSYS® relase19R2). Using this software, eigenvalue frequencies (natural frequencies) for the piezoelectric viscosity probe can be calculated. However, if the probe is immersed in a fluid can have a significant effect on the calculation of natural frequencies and require additional tools [36]. A Fluid Solid Interaction module (FSI) that can couple the effects of the fluid and calculate the interactions is necessary. In this case, a harmonic acoustic analysis was performed for the probe and its surrounding fluid using a two-way Fluid Solid Interaction (FSI) method. This method is based on performing of a harmonic analysis for the actuator under the excitation voltage and then transferred effect of the acoustic wave due the excitation voltage to the sensor through the fluid medium using harmonic acoustic analysis. Then, an additional acoustic analysis is performed on the sensor to calculate the effect of the sound wave propagating in the fluid. In this case, the fluid is stationary and the fluid velocity is small and there is no need to solve for all the fluid dynamic parameters. Those effects are assumed negligible.
In particular, the Fluid Solid Interaction (FSI) method is based on the solution of the equation of motion for the structure coupled with the Helmoholtz’s equation and the Navier–Stokes equation to include the fluid–solid interaction for the probe and the surrounded fluid. The complete finite element in matrix form for the fluid–solid interaction (FSI) is mathematically expressed as [37]:
[ [ M s ] [ 0 ] [ M fs ] [ M f ] ] { { u ¨ } { p ¨ } } + [ [ C s ] [ 0 ] [ 0 ] [ C f ] ] { { u ˙ } { p ˙ } } + [ [ K s ] [ K f s ] [ 0 ] [ M f ] ] { { u } { p } } = { { F s } { 0 } } ,
where, [Ms], [Mf], [Cs], [Cf], [Ks], [Mfs], and [Kfs] are the structural mass, the fluid mass, the structural damping, the fluid damping, the structural stiffness, the equivalent coupling “mass”, and the equivalent coupling “stiffness” matrices, respectively. In the same equation, {Fs}, {u}, and {p} are the applied load vector, the nodal displacement, and the acoustic pressure, respectively.
The piezoelectric material properties [38] for the PZT- 5A are defined as:
[ ε ε 0 ] = [ 919 0 0 0 919.1 0 0 0 826.6 ] ,
[ e ] = [ 0 0 0 12.2947 0 0 5.35116 15.7835 5.35116 0 0 0 0 0 0 0 12.2947 0 ] C / m 2 ,
[ C ] = ( 12.0346 7.5191 7.50901 0 0 0 7.5191 12.0346 7.50901 0 0 0 7.50901 7.50901 11.0867 0 0 0 0 0 0 2.10526 0 0 0 0 0 0 2.10526 0 0 0 0 0 0 2.25734 ) × 10 10   Pa ,
where [ε/ε0] is the relative permittivity, [e] is the coupling (in C/m2), and [C] is the elasticity (in Pa) matrices, respectively. In this manner, the model predicts the phase shift for the sensor immersed in a viscous flow under the same excitation voltage and range of frequency that had been used in the experimental work.

5. Results

The probe’s actuator is excited by applying a sinusoidal signal with 0.5 V (peak–peak voltage) in a range of frequencies from 100 Hz to 30 MHz. The probe’s sensor detects the generated wave in the fluid. The magnitude and the phase shift between the wave produced and the received wave is recorded.

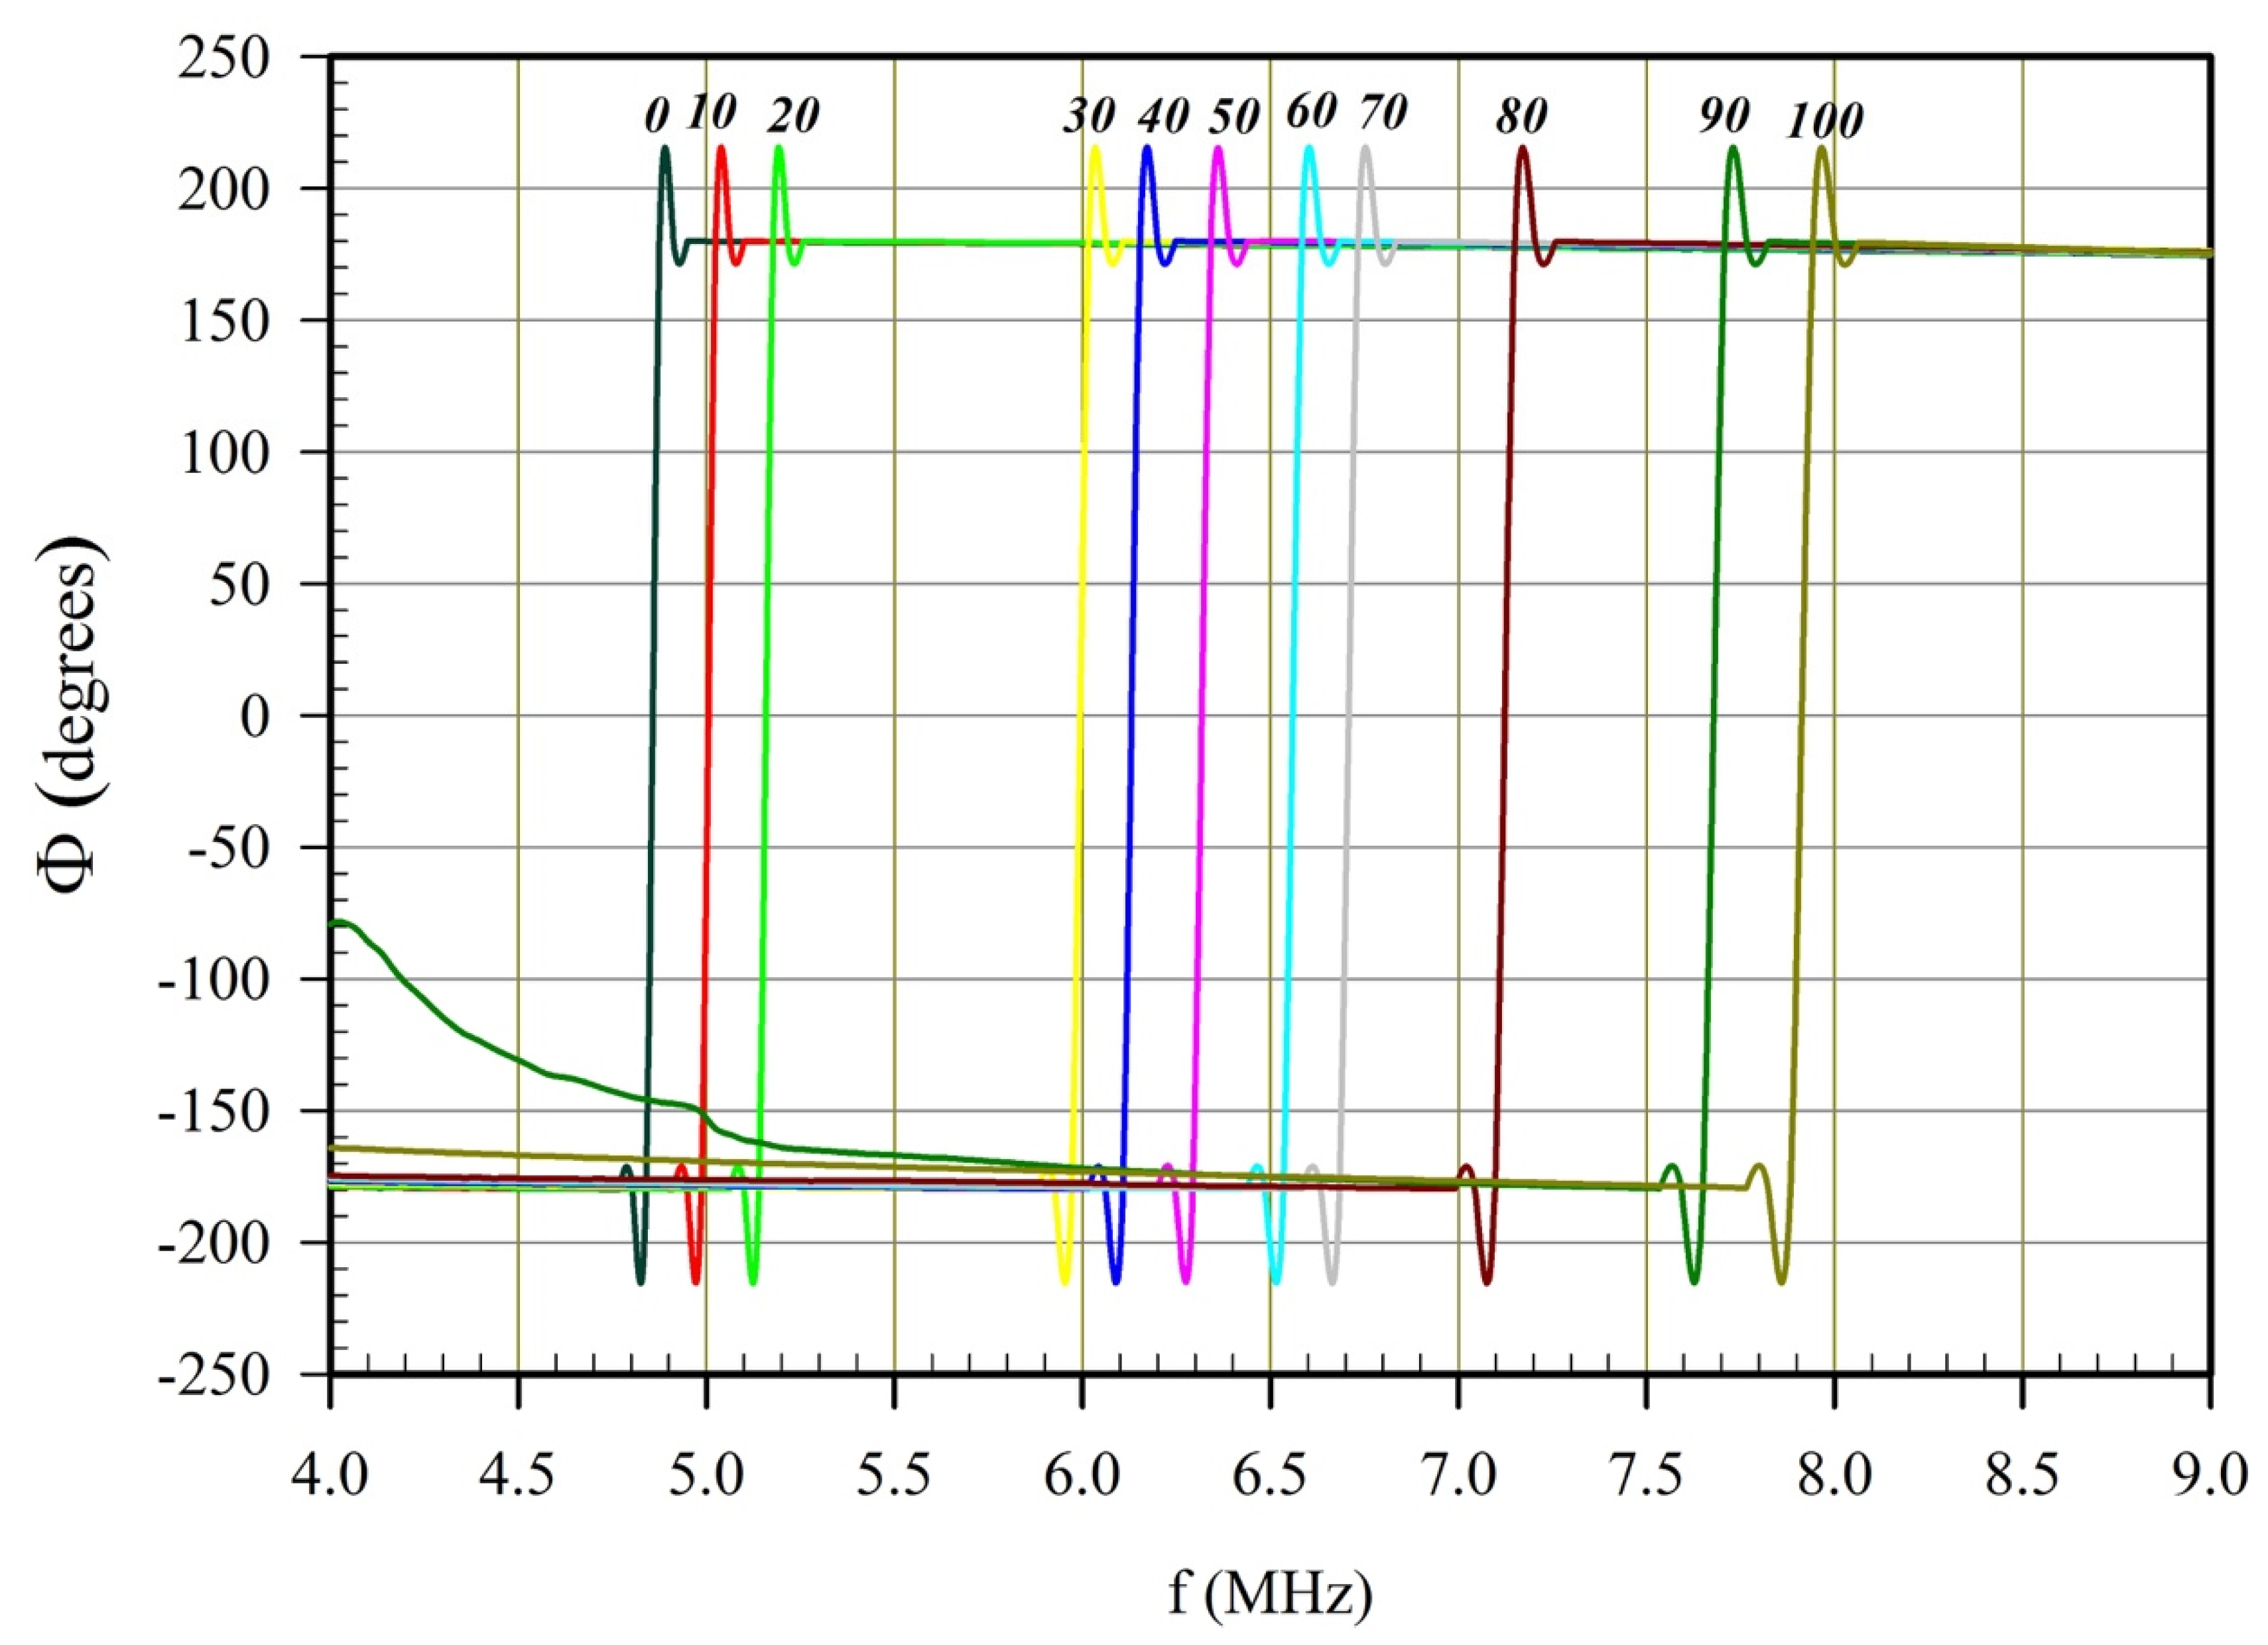
5.1. Experimental Phase Shift Measurements

The measured and recorded phase shifts of the frequency in glycerin and DI-water (Deionized water) mixture of various concentrations are plotted for the probe, as shown in Figure 5. The phase shift is defined as the difference between the phase angle of the send signal and the received one. The frequency of the applied signal was scanned for the entire range the Gain-Phase analyzer is capable of performing (100Hz to 40Mhz). The largest peak phase sfhist was observed for all solutions to be in the higher frequency range. By taking the peak phase shift for each concentration, a pattern with an increasing percentage of the glycerin concentration (from 0 to 100%) is clear. In particular, note that at 100% DI water, the frequency shift can be detected at approximately 6.5 MHz. In contrast, a 100% glycerin solution showed the phase shift at a higher value, about 8.5 MHz. For a given range of concentration, this translates to a change in viscosity from 0.5 to 1600 cP. This pattern is observed for all different levels tested. Besides, a peak frequency at each concentration is measured, and that peak indicated a point where the acoustic pressure wave was maximum when traveling from the actuator to the sensor, under applied excitation voltage.
Since the probe is a prototype, there is room for some variability. Thus, quality assurance tests are crucial in determining prototype integrity. One way to monitor this integrity is periodically monitoring capacitance and impedance values since changes on the measured values may indicate delamination, cracks, or deficiencies in the probe. Phase shifts for each glycerin level are compared to known respective viscosity values, in the form of a calibration curve. Known glycerin viscosities regarding both temperature and solution percentage can be obtained from available literature [39]. A detailed error and p-values of the regression, as well as the values of the coefficient, are shown in Table 3. A statistical analysis of the regression is performed, and the R2 of 0.99, indicating that the data fits a profile of the form is defined as follows.
ν = a e 1 2 · ( f R f 0 b ) 2 ,
where ν is the viscosity in cP, fR is the resonance frequency (MHz), f0, and a, and b are constants that could be related to damping and sound propagation. Though the R2 is high the parameters may not be quite accurate (coefficients have a high standard error and high p-values). This type of equation is usually used for a Gaussian wave equation and maybe significant in calibrating and predicting viscosity values. The large standard errors indicate multi-cocolinearity which indicates more refinement of this equation is needed and more data is required for a more definite model. The purpose of Equation (5) is to illustrate the trends observed in the experiments.
The results of the regression and confidence intervals are shown in Figure 6 that illustrates the viscosity variation of different glycerin/DI water concentration levels with the frequency shifts. It can be seen from the graph that the frequency shift increases with increases of viscosity (increases in glycerin concentration).
The range of frequencies where significant changes in phase shifts and amplitude can be observed is the ultrasound range indicating the presence of acoustic pressure waves. The detailed work from Antlinger et al. [1] demonstrates that the wave propagation characteristics of a PZT device are affected by the fluid-solid interaction of the PZT. Furthermore, their work documents the electrical impedance of PZT resonators in a variety of fluids with different viscosities showing that the impedance amplitude diminishes when the liquid is more viscous [1]. They show that the resonance frequencies for a sensor surrounded by the fluid, under an excitation voltage, is affected by the electrical impedance which is a function of fluid parameters (frequency, speed of sound, viscosity, and damping) [1]. To that end, the impedance of the sensor/actuator pair used in the designed probe is measured, and the results can be seen in Figure 7. An impedance analyzer in the vacutainer measures the acoustic impedance of the PZT. There are differences between magnitudes and frequency peaks when submerged in different fluids. This behavior, as suggested in the work of Antlinger et al. [1], is the result of the electrical impedance of a piezoelectric actuator, which is the mechanism that creates an acoustic wave. However, the observed differences are too small to make inferences about the viscosity of the fluid medium. It does, however, provide an indication that the acoustic impedance is maximized at the MHz frequency.

5.2. Numerical Simulation Results

The modal acoustic analysis with ANSYS was used to calculate the mode shapes of vibration for the probe and the surrounding fluid. In this manner, the natural resonant and vibration modes can be ruled out as a factor in the observed viscosity changes with frequency. The natural frequencies for the probe immersed into a water and glycerin solution are listed in Table 4.
From Table 4, it can be seen that the order of magnitude for the resonance frequencies, based on the modal acoustic analysis for the probe, ranges from 683.86 to 2358 Hz for air, 500 to 1080 Hz for water, and 468 to 625 Hz for glycerin. Table 4 shows that the natural frequency in the air is higher than any of the natural frequencies when the probe is immersed in a fluid, possibly due to the dampening effect the fluid exerts on the probe.
Using ANSYS, numerical simulations, and analysis is performed. This analysis used a two-way FSI to find the phase shift actuator/sensor PZT pair under the excitation of the applied voltage. Figure 8 illustrates the phase shift change for the simulated and experimental of both distilled water and glycerin, respectively. Note that the trend of both results, numerical and experimental, follows the same pattern. The model shows that the phase shift change is at 5.5 MHz, and the experimental one is at 4.8 MHz for water. For glycerin, the values are 8.5 MHz and 7.8 MHz, respectively. The differences between the numerical and experimental results can be a result of several factors: liquid level in the device, slight manufacturing differences such as layer alignment within the probes many layers, and quality of adhesion, among others. The overall trend, however, seems to be quite similar.
All the cases tested experimentally are also modeled, and the results are shown in Figure 9. In spite of these differences, the trend is clear: higher viscosity results in a higher frequency shift. Future work includes exploring the limitations of the simulations of the model used here, such as the magnitude of the wave decays with distance.

6. Conclusions

A new method and probe are designed and tested to monitor viscosity changes in fluids. This probe consists of an actuator and a sensor, both made of a commercially available soft piezoelectric material (PZT). It is mainly designed around two constraints: size, to fit into a 3 mL vacutainer and cost: low-cost, and hence disposable. The operation of the device is based on a tuning fork principle as part of a mechanism for transmitting waves in a fluid medium. The actuator is powered with a sinusoidal signal such that it vibrates, generating an acoustic wave through a fluid. The sensor detects the produced wave in the liquid. The phase shift between the emitted and detected wave signal is recorded and plotted for different concentrations of glycerin in water. Numerical simulations through a finite element method (FEM) and the software ANSYS were performed. Acoustic modal and harmonic acoustic analysis results from the simulations predict the experimental results. The results from the modal analysis show that the first, second, and third modes of the probe are in the range of 683.9–2358 Hz for air, 499.6–1080.2 Hz for water, and 468.5–625.4 Hz for glycerin. From the harmonic acoustic analysis, the results show that the ultrasonic frequency for phase shift effects ranges from 6 to 9 MHz. These results demonstrate that the natural frequencies of the probe are in the kHz region, and the phase shift frequencies are predicted to be in the high-frequency range.
These particular results emphasize that the results obtained seemed to be directly linked to the (electric) acoustic impedance of the probe in a fluid as observed in the impedance measurements of the actuator and sensor. Results show a trend: a phase shift increases with the viscosity of the liquid. The results of this work also show that wall interference is not a contributing factor because the distance between the sensor and actuator is small. The main contribution of this device to the field of viscosity monitoring is the use of techniques used in structural health monitoring. The developed method also has many advantages over other devices such as size, portability, low cost, require minimal samples of liquid to operate, and it is disposable. All these characteristics enable multiple uses for such a method, such as inline monitoring and point-of-care devices. For example, it can be used in medical applications such as monitoring a person in an ambulance who suffers from a chronic disease. The approach and built probe are the initial steps for the development of a robust system. Accuracy and repeatability are yet not assessed since the manufacturing method is not commercially available. The device has not been tested with non-Newtonian or moving fluids, and those are research areas which need to be expanded numerically and experimentally. The method also may have other applications, such as acoustic pressure sensors or density monitoring.

Author Contributions

Conceptualization, K.M. and A.A.; methodology, A.A., U.E. and K.M.; software, A.A.; validation, A.A. and U.E.; formal analysis, K.M., A.A. and U.E.; investigation, A.A; resources, U.E.; data curation, A.A.; writing—original draft preparation, A.A.; writing—review and editing, U.E. and K.M.; visualization, K.M. and A.A.; supervision, K.M.; project administration, K.M.; funding acquisition, A.A. All authors have read and agreed to the published version of the manuscript.

Funding

This research was funded by The Higher Committee For Eduacation Development in Iraq (HCED), College of Electrical and Electronic Technology (CEET) and Virginia Commonwealth University (VCU).

Acknowledgments

The authors are grateful to the insightful discussions with Dr. Hooman Tafreshi and Dr. Ibrahim Guven. The authors also would like to acknowledge Curtis Cox for helping on data collection.

Conflicts of Interest

The authors declare no conflict of interest.

References

  1. Antlinger, H.; Clara, S.; Beigelbeck, R.; Cerimovic, S.; Keplinger, F.; Jakoby, B. Sensing the characteristic acoustic impedance of a fluid utilizing acoustic pressure waves. Sens. Actuators Phys. 2012, 186, 94–99. [Google Scholar] [CrossRef] [PubMed] [Green Version]
  2. Jakoby, B.; Vellekoop, M.J. Physical sensors for liquid properties. IEEE Sens. J. 2011, 11, 3076–3085. [Google Scholar] [CrossRef]
  3. Youssry, M.; Belmiloud, N.; Caillard, B.; Ayela, C.; Pellet, C.; Dufour, I. A straightforward determination of fluid viscosity and density using microcantilevers: From experimental data to analytical expressions. Sens. Actuators Phys. 2011, 172, 40–46. [Google Scholar] [CrossRef]
  4. Zhu, X.; Zhong, C.; Zhe, J. Lubricating oil conditioning sensors for online machine health monitoring–A review. Tribol. Int. 2017, 109, 473–484. [Google Scholar] [CrossRef] [Green Version]
  5. Toledo, J.; Jiménez-Márquez, F.; Úbeda, J.; Ruiz-Díez, V.; Pfusterschmied, G.; Schmid, U.; Sánchez-Rojas, J.L. Piezoelectric MEMS resonators for monitoring grape must fermentation. J. Phys. Conf. Ser. 2016, 757, 012020. [Google Scholar] [CrossRef]
  6. Muñoz, J.A.; Ancheyta, J.; Castañeda, L.C. Required viscosity values to ensure proper transportation of crude oil by pipeline. Energy Fuels 2016, 30, 8850–8854. [Google Scholar] [CrossRef]
  7. Wu, H.; Zhao, G.; Zu, H.; Wang, J.H.-C.; Wang, Q.-M. Real-time monitoring of platelet activation using quartz thickness-shear mode resonator sensors. Biophys. J. 2016, 110, 669–679. [Google Scholar] [CrossRef] [Green Version]
  8. Anderson, A.M.; Bruno, B.A.; Smith, L.S. Viscosity measurement. Mech. Eng. Handb. 2014, 1, 1–28. [Google Scholar]
  9. Antlinger, H.; Clara, S.; Beigelbeck, R.; Cerimovic, S.; Keplinger, F.; Jakoby, B. Utilizing acoustic pressure waves for sensing fluid properties. Procedia Eng. 2011, 25, 775–778. [Google Scholar] [CrossRef] [Green Version]
  10. Zhao, L.; Hu, Y.; Wang, T.; Ding, J.; Liu, X.; Zhao, Y.; Jiang, Z. A MEMS resonant sensor to measure fluid density and viscosity under flexural and torsional vibrating modes. Sensors 2016, 16, 830. [Google Scholar] [CrossRef] [Green Version]
  11. Ma, J.; Huang, X.; Bae, H.; Zheng, Y.; Liu, C.; Zhao, M.; Yu, M. Liquid viscosity measurement using a vibrating flexure hinged structure and a fiber-optic sensor. IEEE Sens. J. 2016, 16, 5249–5258. [Google Scholar] [CrossRef]
  12. Hongbin, Y.; Liang, L.; Yuandong, A.G. Capacitive micromachined ultrasonic transducer (CMUT) based micro viscosity sensor. Sens. Actuators B Chem. 2016, 227, 346–351. [Google Scholar] [CrossRef]
  13. Nwankwo, E.; Durning, C.J. Fluid property investigation by impedance characterization of quartz crystal resonators: Part I: Methodology, crystal screening, and Newtonian fluids. Sens. Actuators Phys. 1999, 72, 99–109. [Google Scholar] [CrossRef]
  14. Shah, V.V.; Balasubramaniam, K. Measuring Newtonian viscosity from the phase of reflected ultrasonic shear wave. Ultrasonics 2000, 38, 921–927. [Google Scholar] [CrossRef]
  15. Markova, L.V.; Makarenko, V.M.; Semenyuk, M.S.; Zozulya, A.P. On-line monitoring of the viscosity of lubricating oils. J. Frict. Wear 2010, 31, 433–442. [Google Scholar] [CrossRef]
  16. Zhang, C.; Zhang, H.; Kaluvan, S. PZN-PT based smart probe for high temperature fluid viscosity measurements. Measurement 2016, 94, 753–758. [Google Scholar] [CrossRef]
  17. Aguilar Sandoval, F.; Sepúlveda, M.; Bellon, L.; Melo, F. High resolution viscosity measurement by thermal noise detection. Sensors 2015, 15, 27905–27916. [Google Scholar] [CrossRef] [Green Version]
  18. Yan, F.; Chan, H.L. Analytical model of piezoelectric cantilever as rheological sensor. Phys. B Condens. Matter 2011, 406, 3605–3608. [Google Scholar] [CrossRef]
  19. Ju, F.; Ling, S.-F. Sensing fluid viscosity and density through mechanical impedance measurement using a whisker transducer. Meas. Sci. Technol. 2013, 24, 055105. [Google Scholar] [CrossRef]
  20. Goodwin, A.R.H.; Fitt, A.D.; Ronaldson, K.A.; Wakeham, W.A. A vibrating plate fabricated by the methods of microelectromechanical systems (MEMS) for the simultaneous measurement of density and viscosity: Results for argon at temperatures between 323 and 423K at pressures up to 68 MPa. Int. J. Thermophys. 2006, 27, 1650–1676. [Google Scholar] [CrossRef]
  21. Etchart, I.; Chen, H.; Dryden, P.; Jundt, J.; Harrison, C.; Hsu, K.; Marty, F.; Mercier, B. MEMS sensors for density–viscosity sensing in a low-flow microfluidic environment. Sens. Actuators Phys. 2008, 141, 266–275. [Google Scholar] [CrossRef]
  22. Lu, X.; Hou, L.; Zhang, L.; Tong, Y.; Zhao, G.; Cheng, Z.-Y. Piezoelectric-excited membrane for liquids viscosity and mass density measurement. Sens. Actuators Phys. 2017, 261, 196–201. [Google Scholar] [CrossRef]
  23. Abdallah, A.; Reichel, E.K.; Voglhuber-Brunnmaier, T.; Jakoby, B. Characterization of viscous and viscoelastic fluids using parallel plate shear-wave transducers. IEEE Sens. J. 2016, 16, 2950–2957. [Google Scholar] [CrossRef]
  24. Purohit, P.; Yadav, Y.K.; Jain, S.K. A study of determination of dynamic viscosity in liquids using radial mode piezo-resonator. Ferroelectrics 2017, 519, 236–240. [Google Scholar] [CrossRef]
  25. Yan, J.; Wright, W.M.; O’Mahony, J.A.; Roos, Y.; Cuijpers, E.; van Ruth, S.M. A sound approach: Exploring a rapid and non-destructive ultrasonic pulse echo system for vegetable oils characterization. Food Res. Int. 2019, 125, 108552. [Google Scholar] [CrossRef]
  26. Pfusterschmied, G.; Kucera, M.; Weinmann, C.; Schneider, M.; Bittner, A.; Sánchez-Rojas, J.L.; Schmid, U. Two-step procedure for multi-mode MEMS resonator-based sensing of fluid properties. In Proceedings of the 2017 IEEE 30th International Conference on Micro Electro Mechanical Systems (MEMS), Las Vegas, NV, USA, 22–26 January 2017. [Google Scholar]
  27. Toledo, J.; Ruiz-Díez, V.; Pfusterschmied, G.; Schmid, U.; Sánchez-Rojas, J.L. Characterization of oscillator circuits for monitoring the density-viscosity of liquids by means of piezoelectric MEMS microresonators. In Proceedings of the Smart Sensors, Actuators, and MEMS VIII.; International Society for Optics and Photonics, Barcelona, Spain, 8–10 May 2017. [Google Scholar]
  28. Toledo, J.; Ruiz-Díez, V.; Pfusterschmied, G.; Schmid, U.; Sánchez-Rojas, J.L. Flow-through sensor based on piezoelectric MEMS resonator for the in-line monitoring of wine fermentation. Sens. Actuators B Chem. 2018, 254, 291–298. [Google Scholar] [CrossRef]
  29. Nguyen, T.-V.; Nguyen, M.-D.; Takahashi, H.; Matsumoto, K.; Shimoyama, I. Viscosity measurement based on the tapping-induced free vibration of sessile droplets using MEMS-based piezoresistive cantilevers. Lab Chip 2015, 15, 3670–3676. [Google Scholar] [CrossRef]
  30. Abdolvand, R.; Bahreyni, B.; Lee, J.E.-Y.; Nabki, F. Micromachined resonators: A review. Micromachines 2016, 7, 160. [Google Scholar] [CrossRef]
  31. Prek, M. Analysis of wave propagation in fluid-filled viscoelastic pipes. Mech. Syst. Signal Process. 2007, 21, 1907–1916. [Google Scholar] [CrossRef]
  32. Song, F.; Huang, G.L.; Hudson, K. Guided wave propagation in honeycomb sandwich structures using a piezoelectric actuator/sensor system. Smart Mater. Struct. 2009, 18, 125007. [Google Scholar] [CrossRef]
  33. Park, S.; Yun, C.-B.; Roh, Y.; Lee, J.-J. PZT-based active damage detection techniques for steel bridge components. Smart Mater. Struct. 2006, 15, 957. [Google Scholar] [CrossRef]
  34. Martowicz, A.; Rosiek, M. Electromechanical impedance method. Adv. Struct. Damage Detect. Theory Eng. Appl. 2013, 1, 141–176. [Google Scholar]
  35. Gere, J.M. Mechanics of Materials; Thomson Learning Inc.: Belmont, CA, USA, 2004. [Google Scholar]
  36. Moosrainer, M. Analyzing vibration with acoustic–Structural coupling. ANSYS Advant. 2009, 3, 40–42. [Google Scholar]
  37. Liang, Q.W.; Rodríguez, C.G.; Egusquiza, E.; Escaler, X.; Farhat, M.; Avellan, F. Numerical simulation of fluid added mass effect on a francis turbine runner. Comput. Fluids 2007, 36, 1106–1118. [Google Scholar] [CrossRef]
  38. Nechibvute, A.; Chawanda, A.; Luhanga, P. Finite element modeling of a piezoelectric composite beam and comparative performance study of piezoelectric materials for voltage generation. ISRN Mater. Sci. 2012, 2012, 921361. [Google Scholar] [CrossRef] [Green Version]
  39. Association, S.D. Glycerine: An overview. Terms Tech. Data Prop. Perform. 1990, 1, 1–27. [Google Scholar]
Figure 1. Probe construction and operation.
Sensors 20 01657 g001
Figure 2. Final prototype dimensions in mm.
Sensors 20 01657 g002
Figure 3. Experimental setup.
Sensors 20 01657 g003
Figure 4. Model built in ANSYS: (a) schematic of the built model and fluid level; (b) the layers of the model; and (c) the mesh configuration.
Sensors 20 01657 g004
Figure 5. Peak phase shift vs. frequency as detected by the Gain-Phase Analyzer at different Glycerin concentrations (0 to 100%).
Sensors 20 01657 g005
Figure 6. Frequency vs. viscosity regression.
Sensors 20 01657 g006
Figure 7. Measured (a) impedance of the probe in a fluid, and (b) the phase shift in a fluid.
Sensors 20 01657 g007
Figure 8. Variation of phase shift with frequency for both experimental and simulated at different concentration of glycerin and water.
Sensors 20 01657 g008
Figure 9. Variation of viscosity with resonant frequency for both experimental and modeled results.
Sensors 20 01657 g009
Table 1. Comparison of our probe with the existing type of devices.
MethodViscometer TypeTypical Measurable Range (cP)PriceDisposable
Displacement
(1st type)
Capillary *0.2–200$$$No
Rotating *0.3–320 M$$$$$No
Vibration/mass
(2nd type)
Vibration *0.3–100 k$$$$No
MEMS **variablevariableNo
Acoustic
(3rd type)
Wave reflection ***1.005–1400variableNo
Non-destructive1.005–1600$Yes
* More detailed information available, Reference [8] (pp 819–820)
** More detailed information available, References [10,26]
*** More detailed information available, Reference [1].
Table 2. Mechanical properties for the viscosity probe [35].
MaterialPiece #Dimensions (mm)Density (kg/m3)Modulus of Elasticity (N/m2)
Hollow brass15 × 5 × 70850096 × 109
Copper26 × 0.1 × 258900110 × 109
PZT 5A25 × 0.1 × 237550
Table 3. Statistical analysis of the regression.
RR2Adjusted R2Standard Error of Estimate
0.99870.99750.996922.19
CoefficientStd. ErrortP
a1341.292342,891,6403.91 × 10−61.00
b0.115118,3809.73 × 10−71.00
f07.365213,3053.687 × 10−51.00
Analysis of Variance
DFSSMS
Regression31,812,696604,232
Residual83940492
Table 4. Natural frequency for the probe of different fluids in (Hz).
FluidDensity (kg/m3)Speed of Sound (m/s)Mode 1Mode 2Mode 3
Air1.2343683.86684.242358
Water10001484499.88533.881080.2
Glycerin12601920468.53501.72625.45

