Current Trends and Confounding Factors in Myoelectric Control: Limb Position and Contraction Intensity


Abstract
1. Introduction
- (a)
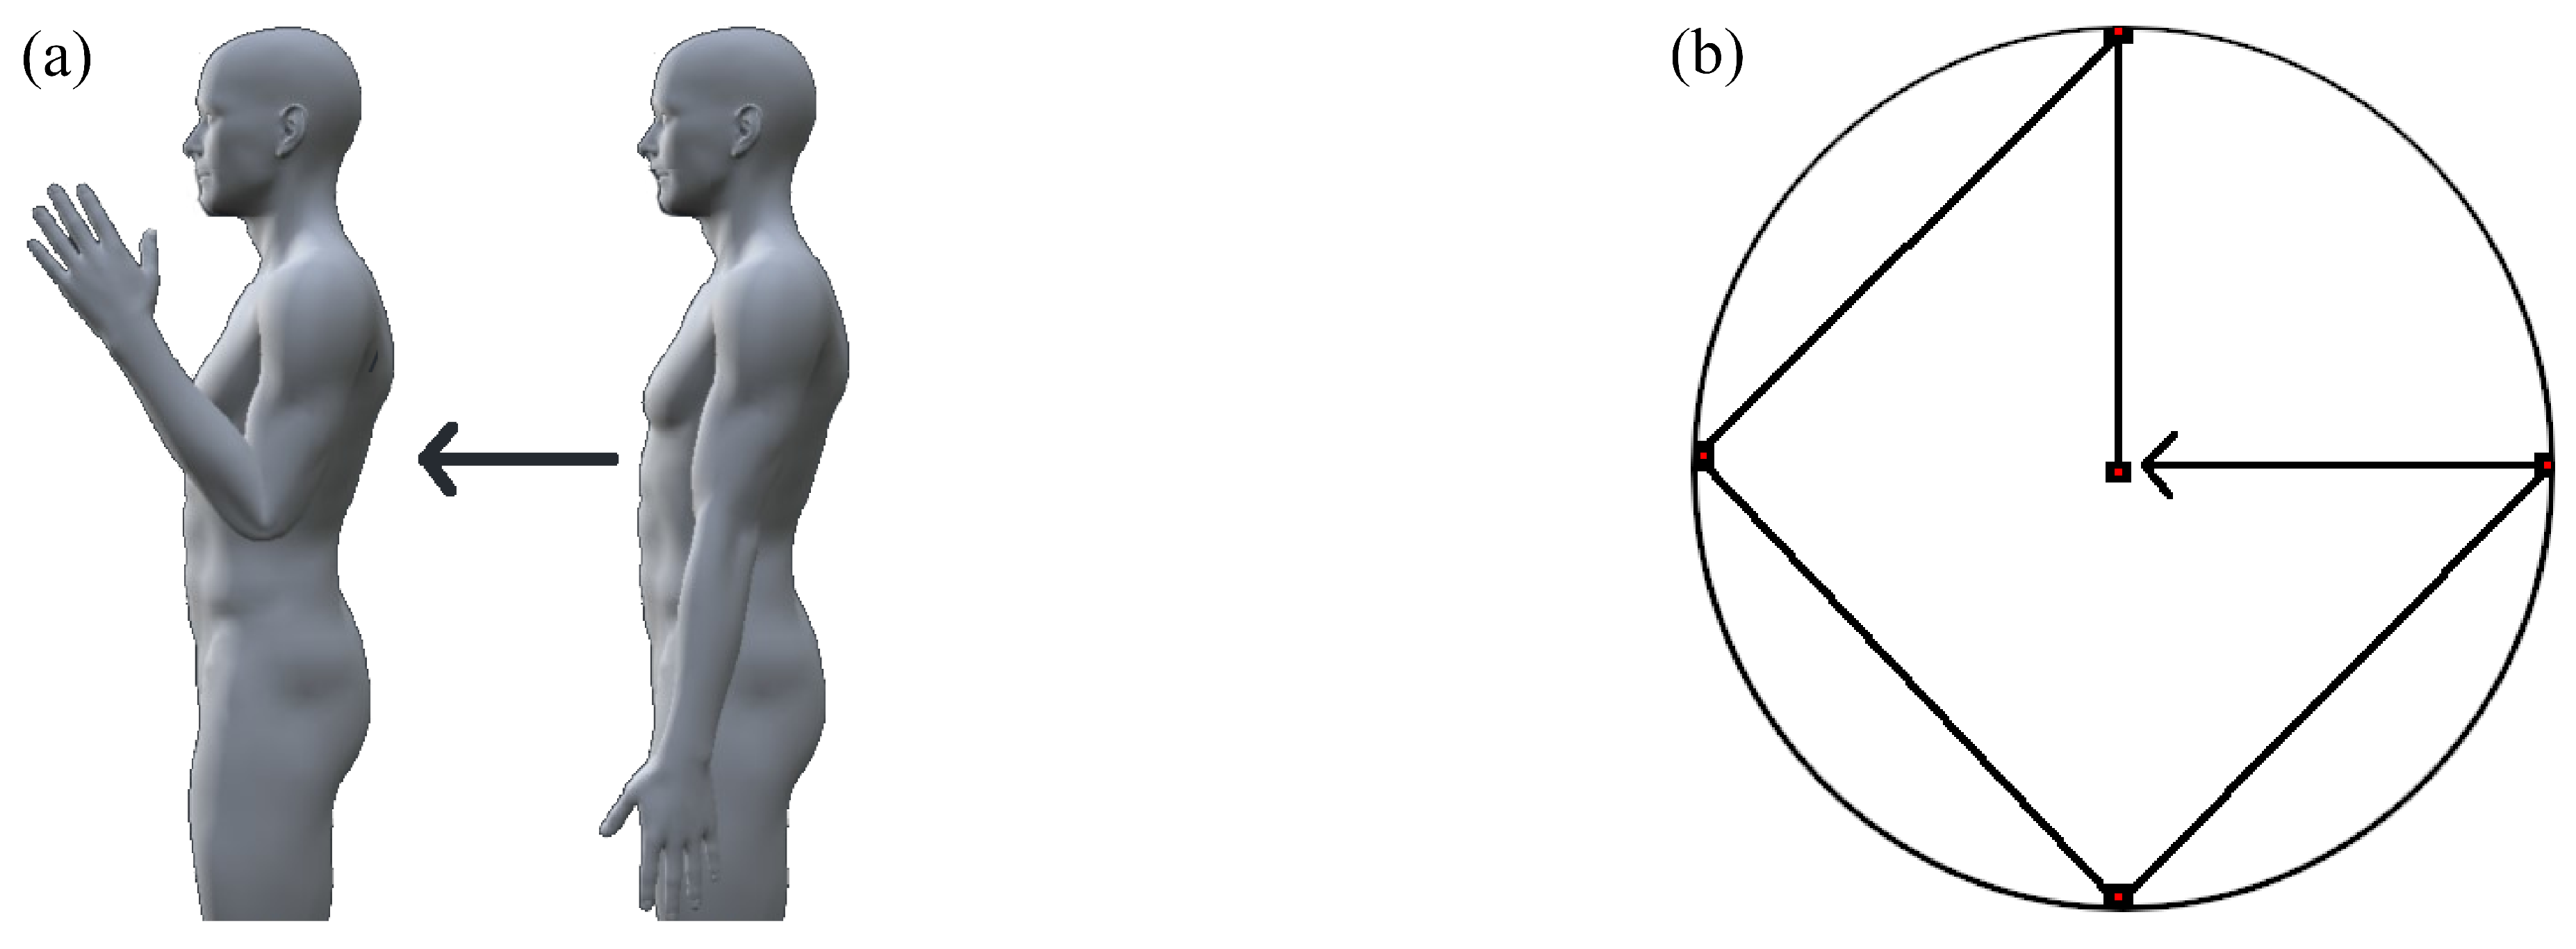
- Limb position factor. The muscular activity that maintains limb positions against gravitational force is dependent on the position of the limb. To an even greater degree, during limb motions even larger amounts of supplemental muscle activity is necessary. Additionally, while in different positions the underlying topography of the muscle fibers may shift relative to the electrodes changing the EMG signal measured substantially. These position-dependent muscular activations manifest as artefacts within the EMG signal which lead to confusion between expected muscle activation patterns and observed patterns.
- (b)
- Contraction intensity factor. The contraction intensity of motions is subconsciously regulated according to the effort expected to act on the target load. The EMG signal amplitude is directly influenced by this intensity variability, as demonstrated by linear and nonlinear relationships in different works. Additionally, frequency characteristics have been shown to vary according to the contraction intensity elicited. These natural variations in intensity produce largely different muscle activation patterns for the same motion for different loads that may lead to differences between anticipated and observed patterns within a given motion.
- (c)
- Electrode shift factor. When the position of an electrode shifts, as is common in socket-based prosthetic devices or circumference-style electrode placement, the underlying musculature changes relative to those electrodes. Subsequently, even in the event the same fibers are underneath the electrode after a shift occurs, a tissue filter effect results in the measured signal being different between electrode locations. Additionally, the change in contact impedance between the electrodes and the skin after a shift occurs introduces further changes in signal properties. As a consequence of these changes, the boundaries defined by a classifier are ill-suited to the properties of the new electrode location.
- (d)
- Within/between day factor. The EMG signal is sensitive to many time-varying physiological, biochemical, or anatomical mechanisms [8], for instance blood flow [9]. An additional component of within/between day factor can encompass the change in electrode position when donning and doffing between sessions of myoelectric device use, or a change in perceived contraction intensities between separate uses of the device. These changes greatly influence the applicability of a trained classifier’s decision boundary. This factor has been similarly referred to as the effect of time and is largely responsible for the usability degradation found after prolonged use of myoelectric devices.
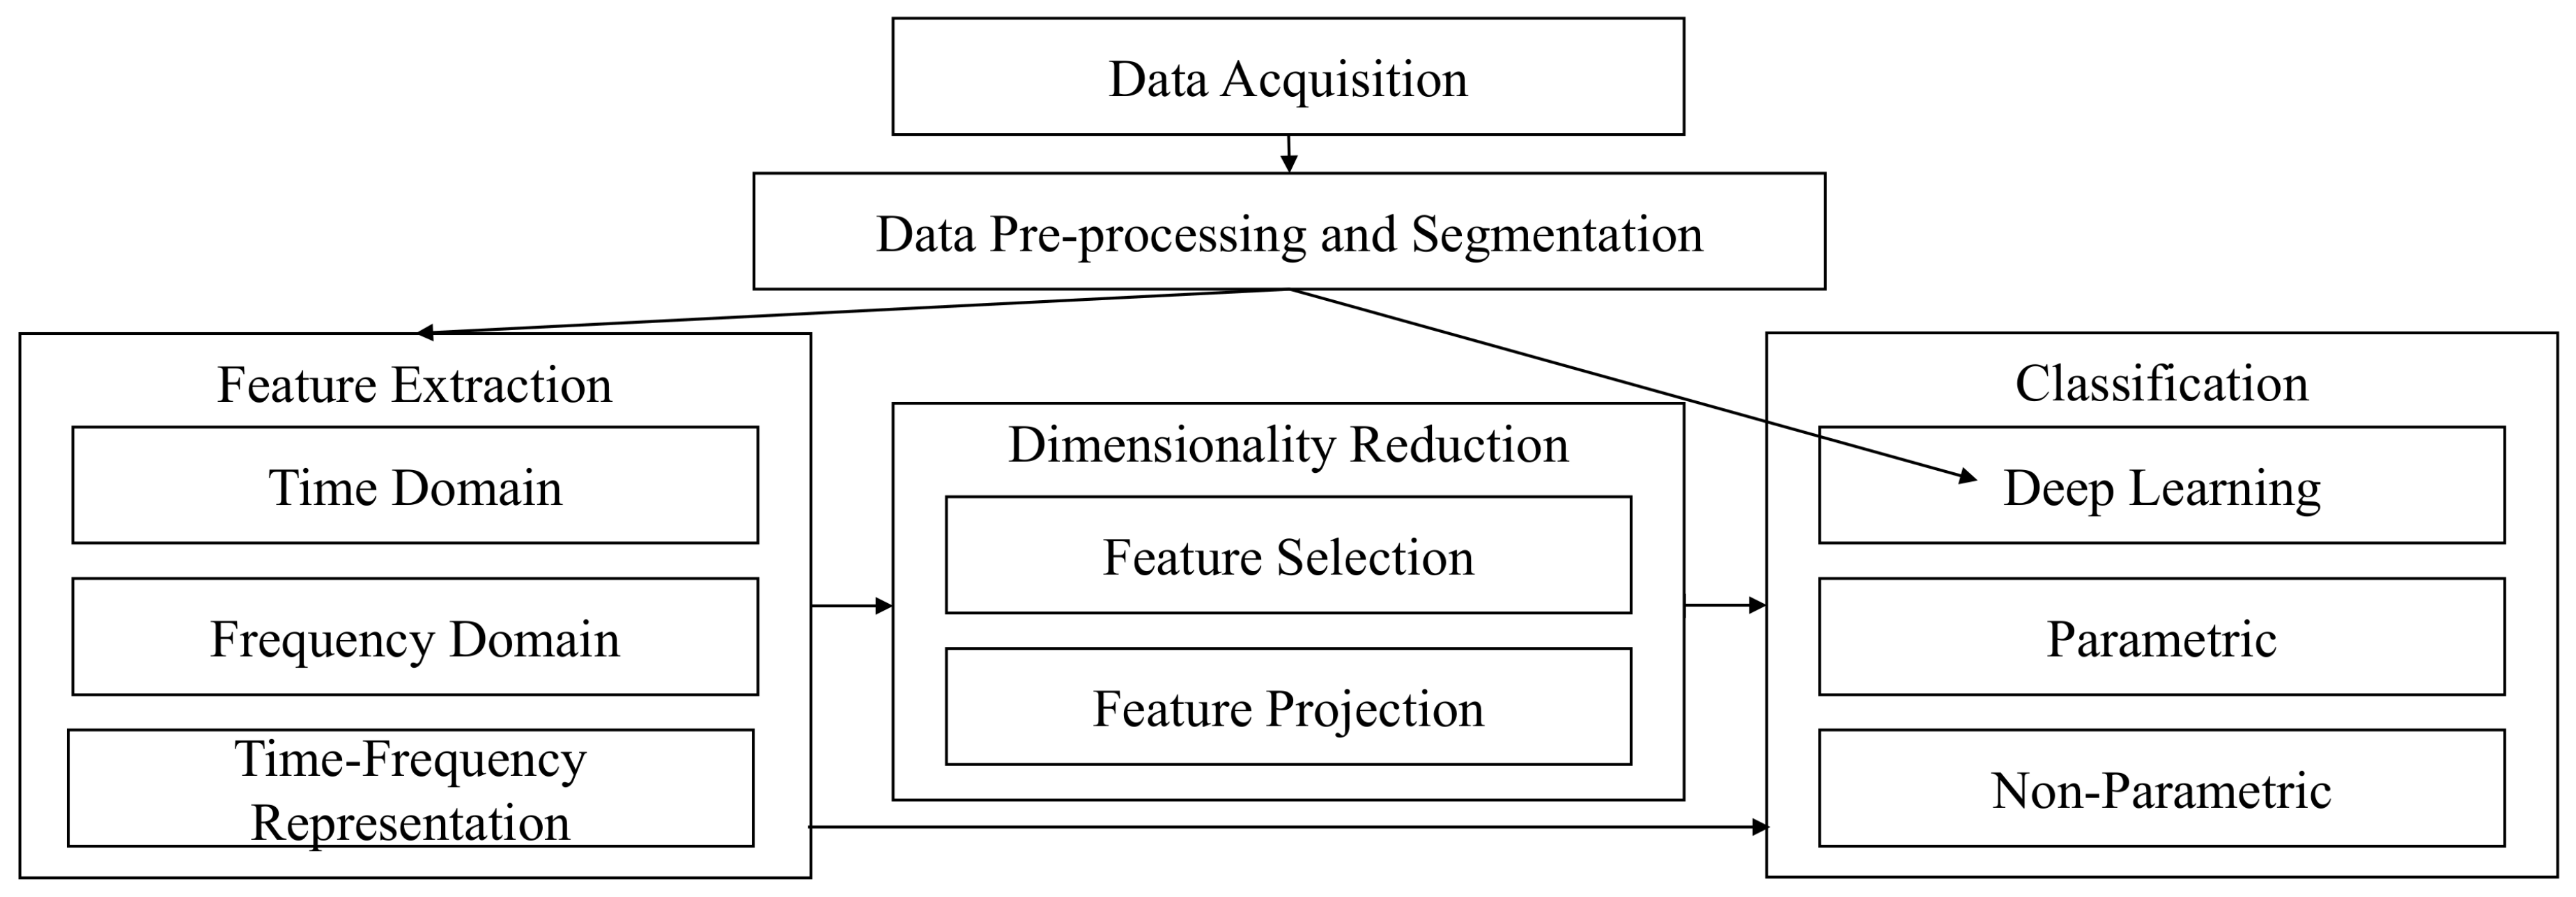
2. EMG Pattern Recognition
2.1. Data Acquisition
Datasets
2.2. Data Pre-Processing
2.3. Data Segmentation
2.4. Feature Extraction
2.5. Dimensionality Reduction
2.6. Classification
2.7. Performance Evaluation
3. The Limb Position Effect
3.1. Background and Theory
3.2. Investigating the Limb Position Effect
3.3. Experimental Protocols
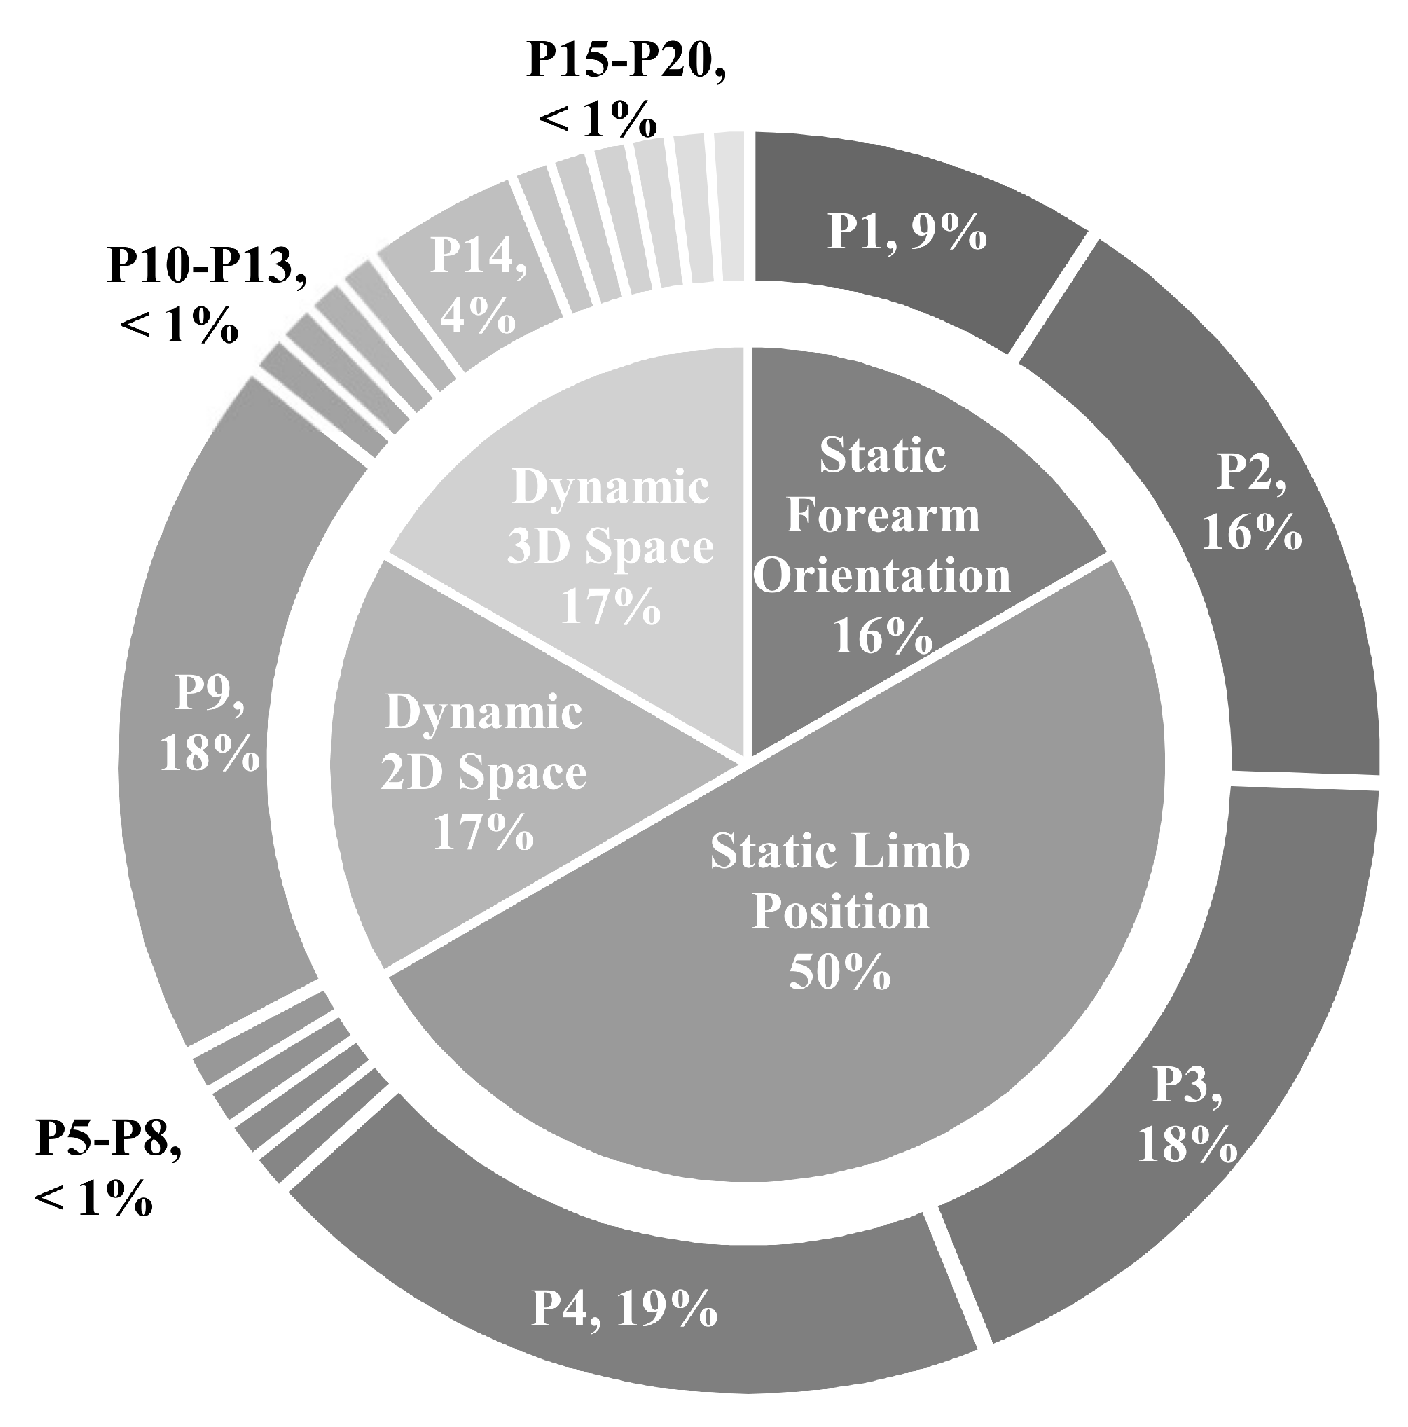
3.3.1. Static Forearm Orientation
3.3.2. Static Limb Position
3.3.3. Dynamic 2D Space
3.3.4. Dynamic 3D Space
3.4. State-of-the-Art Approaches
3.4.1. Robust Algorithms
3.4.2. Training Strategies
3.4.3. Transfer Learning
3.4.4. Extra Sensor Modalities
4. Variation in Contraction Intensity
4.1. Background and Theory
4.2. Investigating the Force Effect
4.3. Experimental Protocols
4.3.1. Types of Muscle Contractions
4.3.2. Intensity Level Normalization Techniques
4.3.3. Intensity Levels
4.4. State-of-the-Art Approaches
4.4.1. Training Strategies
4.4.2. Robust Algorithms
4.4.3. Proportional Control
5. Concluding Remarks and Future Recommendations
5.1. Limb Position Effect
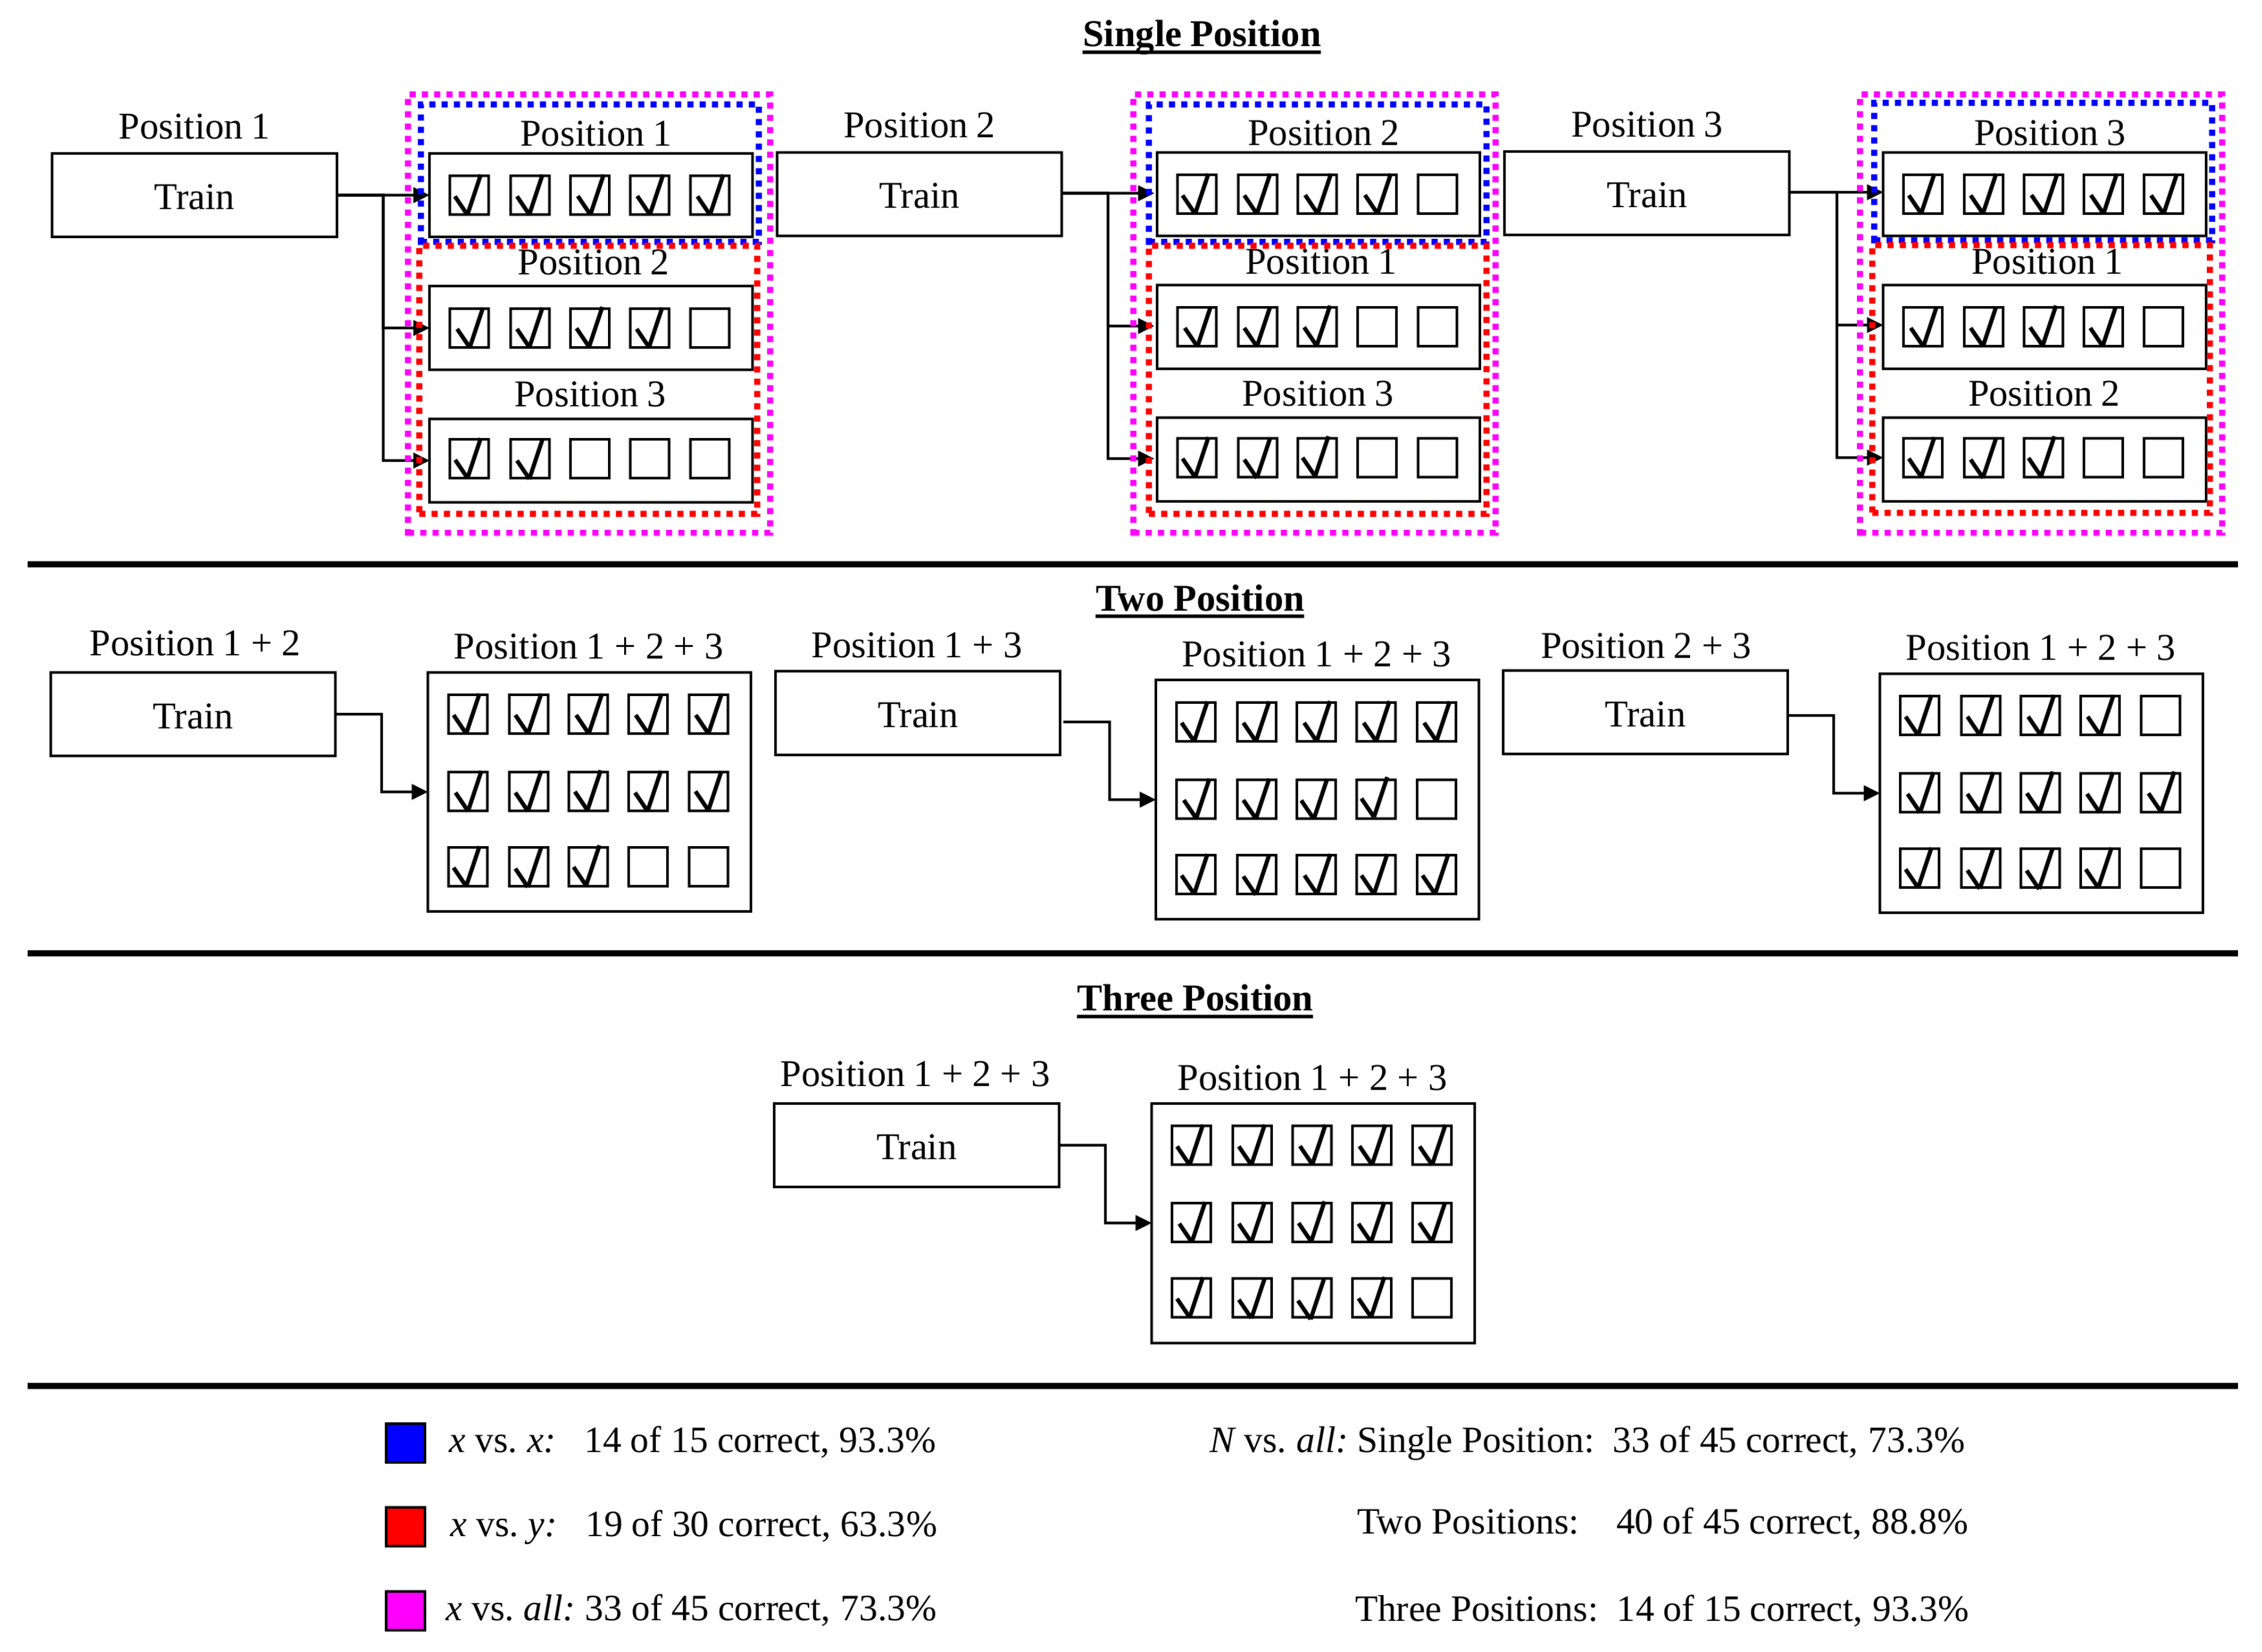
- An expected 12.8% decrease on average in accuracy is expected when systems trained in a single position are tested with naturally varying limb position. The relative performance between various testing frameworks (found using the 16 static limb position data set) suggests that at most 6 positions are needed to capture the variability of limb positions across the humeral and transverse plane. Four positions are sufficient to achieve best performance in the 5 static limb position data set, which may have more closely modelled the range of positions used in everyday tasks. The impact of forearm orientation variation, however, can not be minimized using a subset of the training positions. The variance across forearm orientations is sufficiently high that the neutral, pronated, and supinated orientations all must be included in the training procedure to achieve best performance. The combination of these findings are unified to suggest that future myoelectric studies include repetitions in 4 limb positions and all orientations, for example using P3, P4, P9, P9s, P9p, and P14.
- The static limb position protocol serves as a strong environment to assess the robustness of novel algorithmic solutions. The usability challenge in the field, however, is the development of systems that are robust to dynamic motions that transpire while moving between positions. For this reason, a heavy focus on 2D and 3D space experimental protocols is recommended in future works.
- The review of state-of-the-art methods reveals an abundance of feature extraction techniques that minimize the positional variance and segment classes effectively, such as the TDPSD feature set. While the LDA classifier does not attain the highest accuracy in highly controlled settings, the classifier outperforms all other classifiers in the presence of the limb position effect. More meaningful improvements are demonstrated by novel classification architectures that yield significantly better performance than conventional architectures, such as SRC or cascade classification strategies. The design of novel feature extraction methods and classification strategies, however, remains a current research challenge to minimize the limb position effect.
- Transfer learning has the potential to reduce the variance across positions through algorithmic approaches such as CCA and the bilinear transform. Given the phenomenal impact transfer learning has had in other fields (e.g., object detection, deep learning), applications of unsupervised transfer learning may lead to drastic improvements in the state-of-the-art in the future.
- The incorporation of accelerometer and MMG signals into traditionally EMG only systems has lead to improvements in segmenting feature space locally according to position. Current practices mainly include single-stage position informed classifiers, or cascade classifiers that perform position and motion recognition independently. The treatment of the accompanying (non-EMG) modality, however, has been limited in most cases. Recent works suggested that the graph laplacian IMU feature provides better accuracy than an EMG feature set alone, revealing a potentially new avenue for feature extraction methods to incorporate into EMG pattern recognition pipelines.
5.2. Contraction Intensity Effect
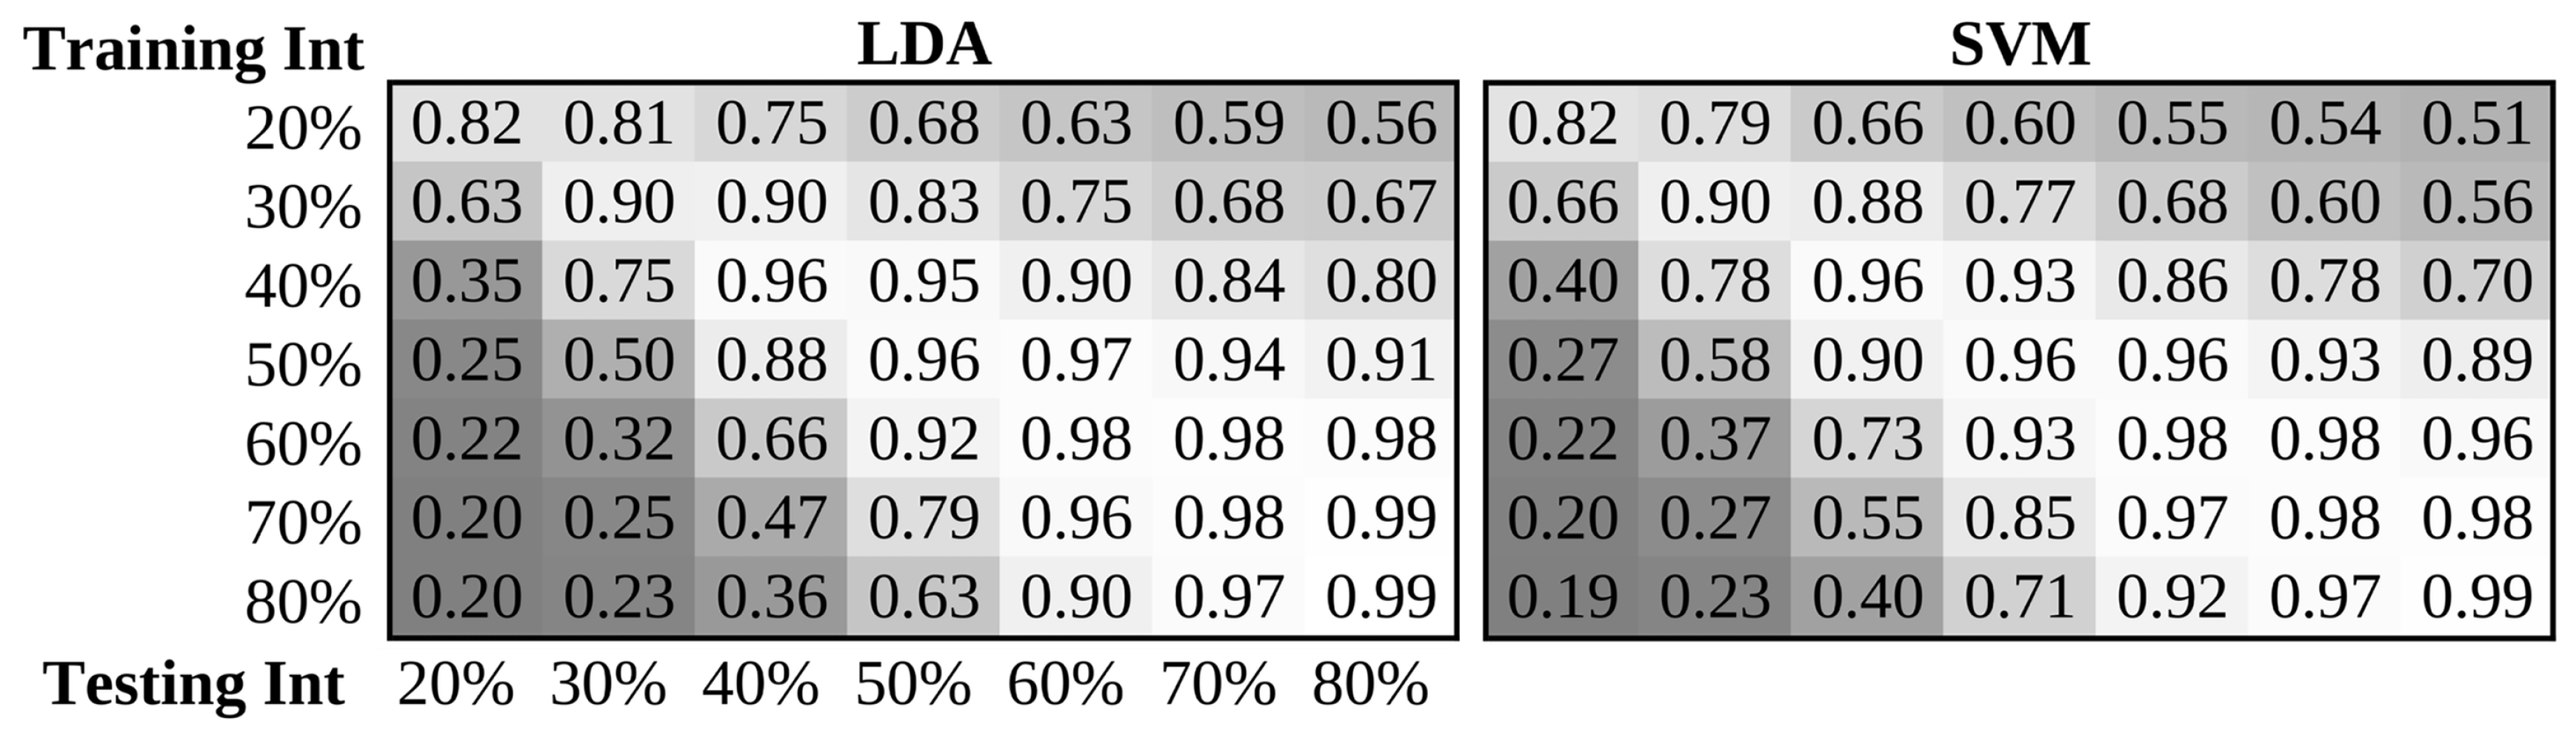
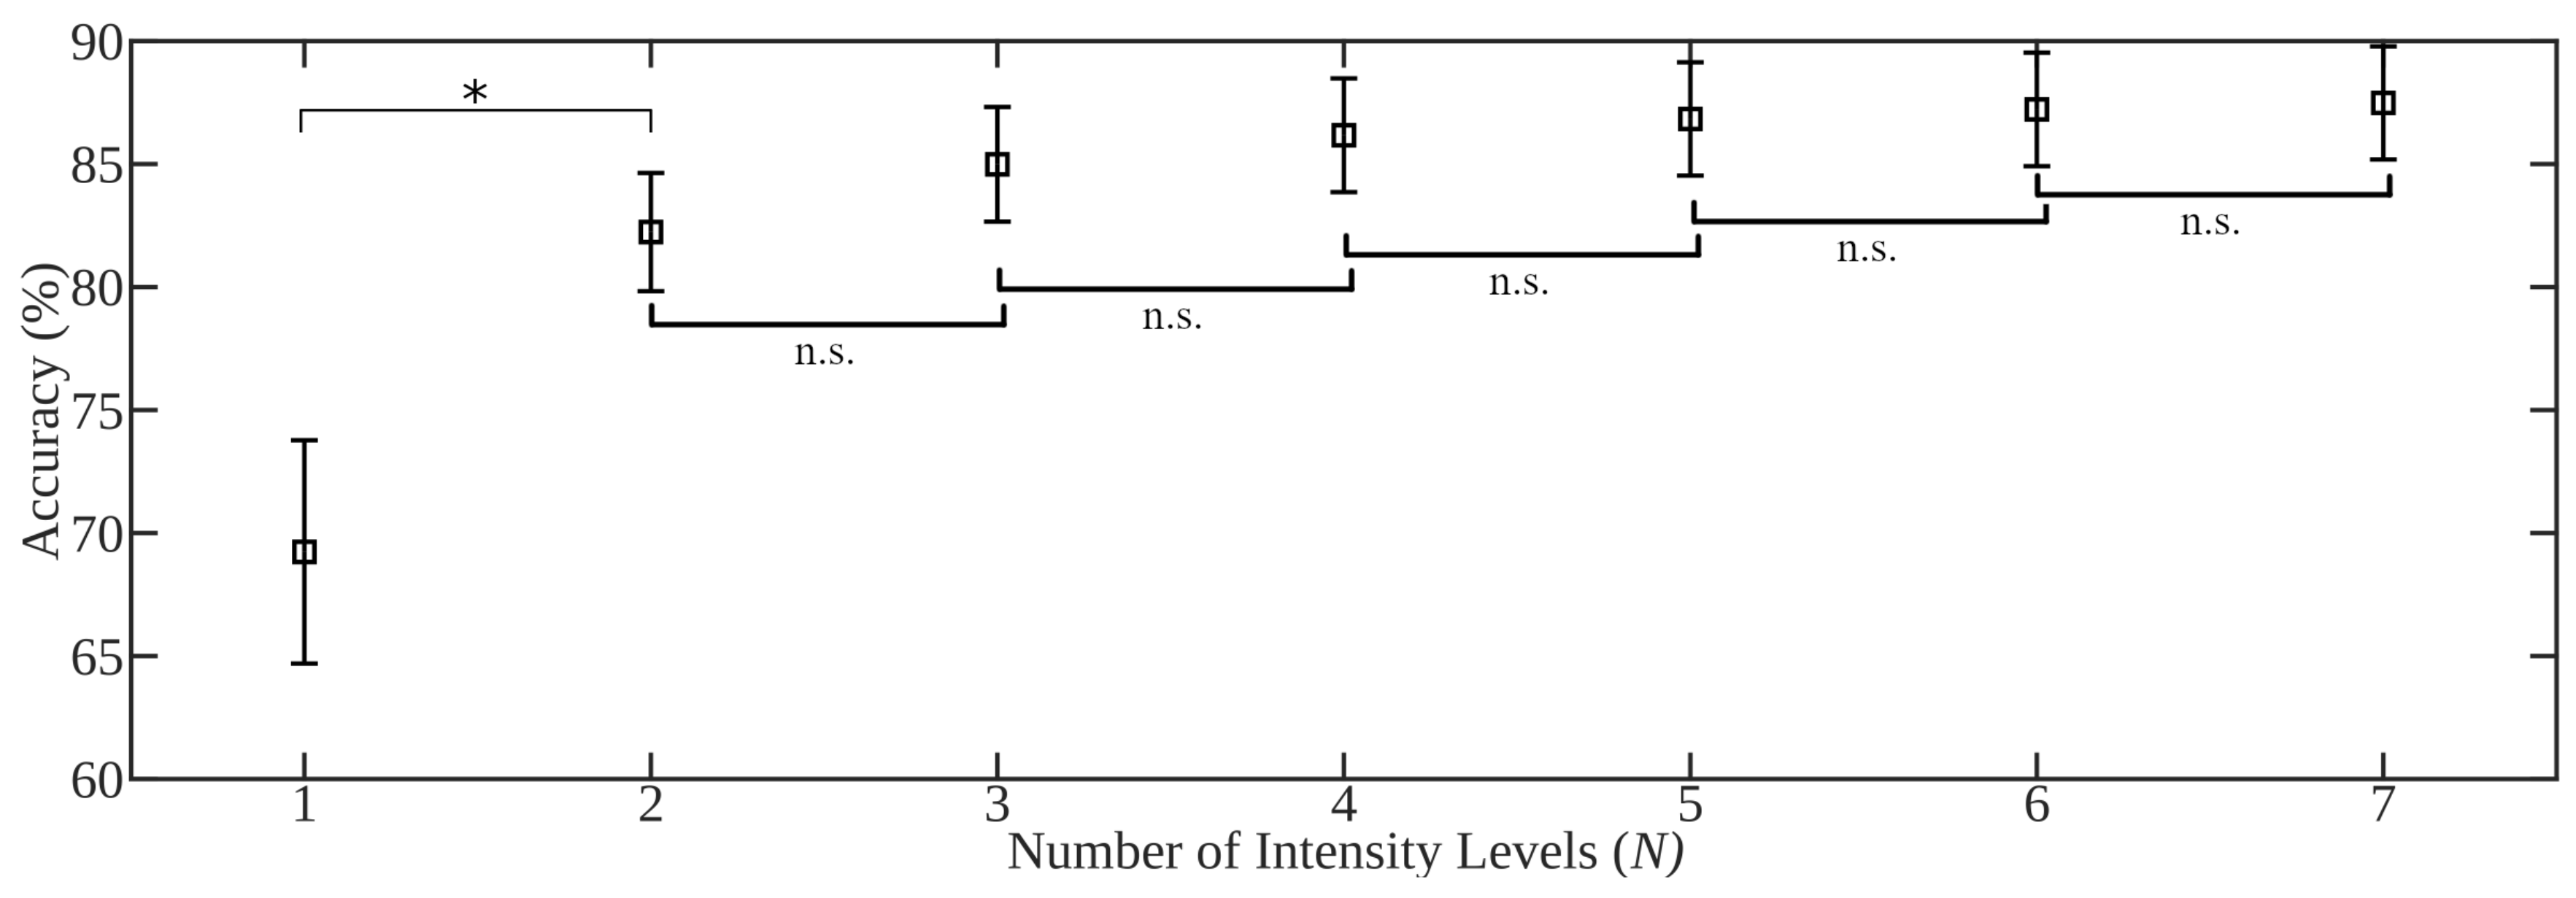
- An expected 20.4% decrease on average in accuracy is expected when systems trained with a single intensity are tested in the context of naturally occurring contraction intensity variation or proportional control. Best performance was achieved when two intensities were included in the training set: 20% MVC and 70% MVC, or low and high subjective intensities. The best single training intensity level determined in the investigation, and across literature, is the median level across the expected range of intensities, however performance was maximized when including examples from across the expected range (statically or dynamically).
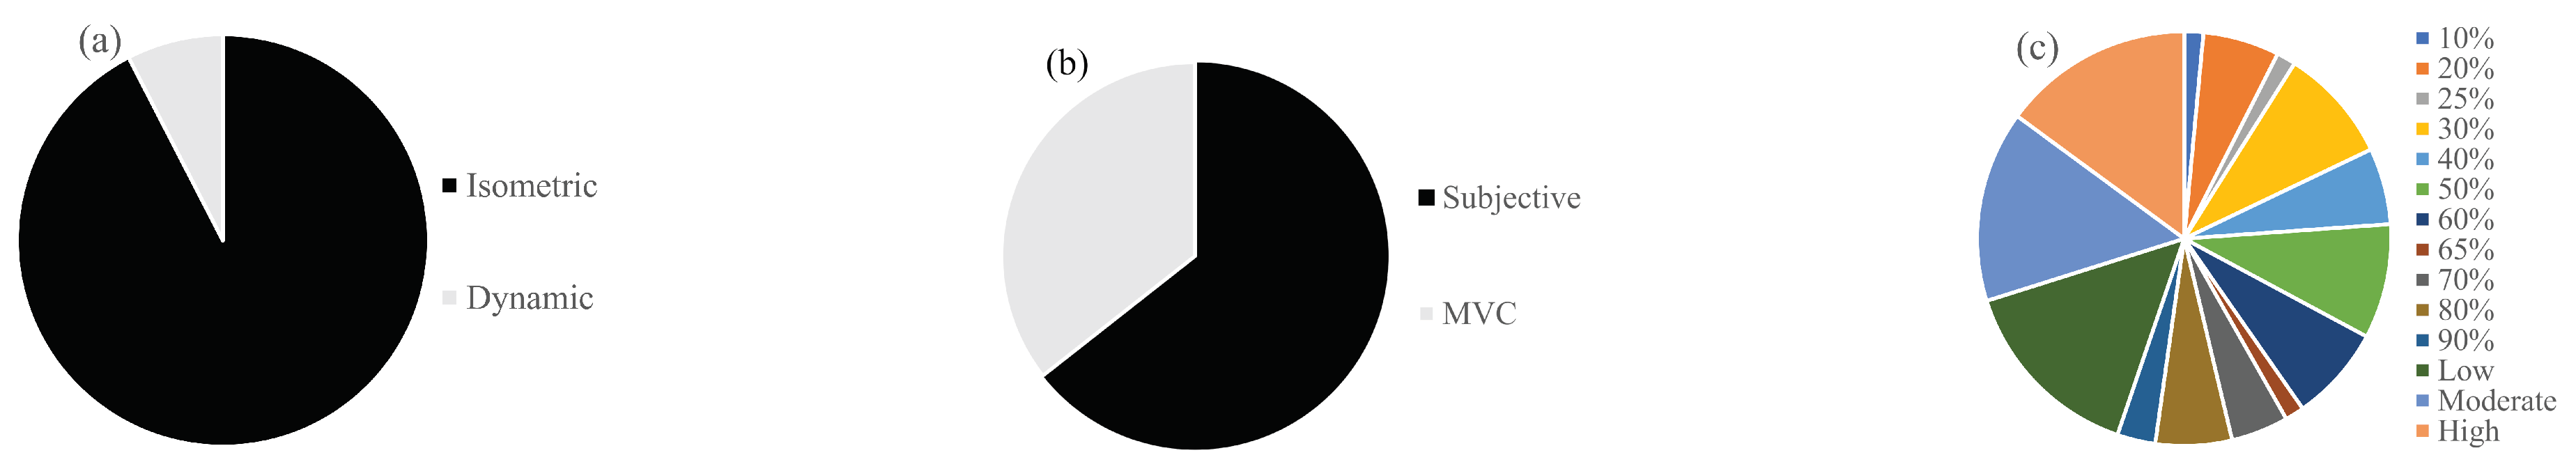
- Traditionally, isometric contractions have been used in myoelectric studies. The intensities of these contractions are commonly regulated using task-specific maximum voluntary isometric contraction normalized levels. A focus of future works should be the extension to dynamic contractions, either isokinetic or isotonic, which more accurately model natural motions. Accordingly, the dynamic-range maximum voluntary contraction normalization technique will be key in appropriately scaling intensity levels.
- The selection of an appropriate pattern recognition pipeline can drastically improve robustness to intensity variation. Nonlinear complexity features demonstrate greater robustness to contraction intensity than the traditional use of amplitude features. Feature projection techniques such as NMF and SR are used to improve resilience of features to intensity variability. Again, the LDA classifier outperformed other traditional classifiers in intensity robustness. Futher improvements are found when using cascade classifiers.
- Auto-calibrated class-specific proportional control has been used in clinical applications; however, bounded proportional control appears to outperform this scheme by ensuring that users can leverage the full range of control.
Supplementary Materials
Author Contributions
Funding
Conflicts of Interest
References
- Stein, J.; Narendran, K.; McBean, J.; Krebs, K.; Hughes, R. Electromyography-Controlled Exoskeletal Upper-Limb–Powered Orthosis for Exercise Training After Stroke. Am. J. Phys. Med. Rehabil. 2007, 86, 255–261. [Google Scholar] [CrossRef]
- Fardipour, S.; Bahramizadeh, M.; Arazpour, M.; Jafarpisheh, A.S.; Azimian, M. First prototype of EMG-controlled power hand orthosis for restoring hand extension in stroke patients. Proc. Inst. Mech. Eng. Part H J. Eng. Med. 2018, 232, 1176–1181. [Google Scholar] [CrossRef] [PubMed]
- Phinyomark, A.; Phukpattaranont, P.; Limsakul, C. A Review of Control Methods for Electric Power Wheelchairs Based on Electromyography Signals with Special Emphasis on Pattern Recognition. IETE Tech. Rev. 2011, 28, 316–326. [Google Scholar] [CrossRef]
- Scheme, E.J.; Hudgins, B.; Parker, P.A. Myoelectric Signal Classification for Phoneme-Based Speech Recognition. IEEE Trans. Biomed. Eng. 2007, 54, 694–699. [Google Scholar] [CrossRef] [PubMed]
- Scheme, E.; Castillo-Guerra, E.; Englehart, K.; Kizhanatham, A. Practical Considerations for Real-Time Implementation of Speech-Based Gender Detection. In Progress in Pattern Recognition, Image Analysis and Applications; Martínez-Trinidad, J.F., Carrasco Ochoa, J.A., Kittler, J., Eds.; Springer: Berlin/Heidelberg, Germany, 2006; pp. 426–436. [Google Scholar]
- Summa, S.; Gori, R.; Freda, L.; Castelli, E.; Petrarca, M. Development of a Dynamic Oriented Rehabilitative Integrated System (DORIS) and Preliminary Tests. Sensors 2019, 19, 3402. [Google Scholar] [CrossRef] [PubMed]
- Gomez-Gil, J.; San-Jose-Gonzalez, I.; Nicolas-Alonso, L.F.; Alonso-Garcia, S. Steering a Tractor by Means of an EMG-Based Human-Machine Interface. Sensors 2011, 11, 7110–7126. [Google Scholar] [CrossRef]
- Reaz, M.B.I.; Hussain, M.S.; Mohd-Yasin, F. Techniques of EMG signal analysis: Detection, processing, classification and applications. Biol. Proced. Online 2006, 8, 11–35. [Google Scholar] [CrossRef]
- Murphy, S.; Durand, M.; Negro, F.; Farina, D.; Hunter, S.; Schmit, B.; Gutterman, D.; Hyngstrom, A. The Relationship Between Blood Flow and Motor Unit Firing Rates in Response to Fatiguing Exercise Post-stroke. Front. Physiol. 2019, 10, 545. [Google Scholar] [CrossRef]
- Scheme, E.; Englehart, K. Electromyogram pattern recognition for control of powered upper-limb prostheses: State of the art and challenges for clinical use. J. Rehabil. Res. Dev. 2011, 48, 643–660. [Google Scholar] [CrossRef]
- Samuel, O.W.; Asogbon, M.G.; Geng, Y.; Al-Timemy, A.H.; Pirbhulal, S.; Ji, N.; Chen, S.; Fang, P.; Li, G. Intelligent EMG Pattern Recognition Control Method for Upper-Limb Multifunctional Prostheses: Advances, Current Challenges, and Future Prospects. IEEE Access 2019, 7, 10150–10165. [Google Scholar] [CrossRef]
- Kyranou, I.; Vijayakumar, S.; Erden, M.S. Causes of Performance Degradation in Non-invasive Electromyographic Pattern Recognition in Upper Limb Prostheses. Front. Neurorobotics 2018, 12, 58. [Google Scholar] [CrossRef] [PubMed]
- Phinyomark, A.; Campbell, E.; Scheme, E. Surface Electromyography (EMG) Signal Processing, Classification, and Practical Considerations. In Biomedical Signal Processing: Advances in Theory, Algorithms and Applications; Naik, G., Ed.; Springer: Singapore, 2020; pp. 3–29. [Google Scholar] [CrossRef]
- Oskoei, M.A.; Hu, H. Myoelectric control systems—A survey. Biomed. Signal Process. Control 2007, 2, 275–294. [Google Scholar] [CrossRef]
- Hermens, H.J.; Freriks, B.; Disselhorst-Klug, C.; Rau, G. Development of recommendations for SEMG sensors and sensor placement procedures. J. Electromyogr. Kinesiol. 2000, 10, 361–374. [Google Scholar] [CrossRef]
- Young, A.J.; Hargrove, L.J.; Kuiken, T.A. The Effects of Electrode Size and Orientation on the Sensitivity of Myoelectric Pattern Recognition Systems to Electrode Shift. IEEE Trans. Biomed. Eng. 2011, 58, 2537–2544. [Google Scholar] [CrossRef] [PubMed]
- Phinyomark, A.; Quaine, F.; Laurillau, Y. The Relationship between Anthropometric Variables and Features of Electromyography Signal for Human—Computer Interface. In Applications, Challenges, and Advancements in Electromyography Signal Processing; IGI Global: Pennsylvania, PA, USA, 2014; pp. 321–353. [Google Scholar]
- Sensinger, J.W.; Lock, B.A.; Kuiken, T.A. Adaptive pattern recognition of myoelectric signals: Exploration of conceptual framework and practical algorithms. IEEE Trans. Neural Syst. Rehabil. Eng. 2009, 17, 270–278. [Google Scholar] [CrossRef] [PubMed]
- Campbell, E.; Phinyomark, A.; Al-Timemy, A.H.; Khushaba, R.N.; Petri, G.; Scheme, E. Differences in EMG Feature Space between Able-Bodied and Amputee Subjects for Myoelectric Control. In Proceedings of the 9th International IEEE/EMBS Conference on Neural Engineering (NER), San Francisco, CA, USA, 20–23 March 2019; pp. 33–36. [Google Scholar]
- Campbell, E.; Phinyomark, A.; Scheme, E. A Comparison of Amputee and Able-Bodied Inter-Subject Variability In Myoelectric Control. arXiv 2003, arXiv:2003.03481. [Google Scholar]
- Fougner, A.; Scheme, E.; Chan, A.D.C.; Englehart, K.; Stavdahl, Ø. Resolving the Limb Position Effect in Myoelectric Pattern Recognition. IEEE Trans. Neural Syst. Rehabil. Eng. 2011, 19, 644–651. [Google Scholar] [CrossRef]
- Radmand, A.; Scheme, E.; Englehart, K. A characterization of the effect of limb position on EMG features to guide the development of effective prosthetic control schemes. In Proceedings of the 36th Annual International Conference of the IEEE Engineering in Medicine and Biology Society, Chicago, IL, USA, 26–30 August 2014; pp. 662–667. [Google Scholar] [CrossRef]
- Khushaba, R.N.; Al-Timemy, A.; Kodagoda, S.; Nazarpour, K. Combined influence of forearm orientation and muscular contraction on EMG pattern recognition. Expert Syst. Appl. 2016, 61, 154–161. [Google Scholar] [CrossRef]
- Scheme, E.; Englehart, K. Training Strategies for Mitigating the Effect of Proportional Control on Classification in Pattern Recognition Based Myoelectric Control. J. Prosthet. Orthot. 2013, 25, 76–83. [Google Scholar] [CrossRef]
- Chowdhury, R.H.; Reaz, M.B.I.; Ali, M.A.B.M.; Bakar, A.A.A.; Chellappan, K.; Chang, T.G. Surface Electromyography Signal Processing and Classification Techniques. Sensors 2013, 13, 12431–12466. [Google Scholar] [CrossRef]
- Luca, C.J.D.; Gilmore, L.D.; Kuznetsov, M.; Roy, S.H. Filtering the surface EMG signal: Movement artifact and baseline noise contamination. J. Biomech. 2010, 43, 1573–1579. [Google Scholar] [CrossRef] [PubMed]
- Hargrove, L.; Zhou, P.; Englehart, K.; Kuiken, T.A. The Effect of ECG Interference on Pattern-Recognition- Based Myoelectric Control for Targeted Muscle Reinnervated Patients. IEEE Trans. Biomed. Eng. 2009, 56, 2197–2201. [Google Scholar] [CrossRef] [PubMed]
- Zhou, P.; Lock, B.; Kuiken, T.A. Real time ECG artifact removal for myoelectric prosthesis control. Physiol. Meas. 2007, 28, 397. [Google Scholar] [CrossRef] [PubMed]
- Phinyomark, A.; Limsakul, C.; Phukpattaranont, P. Application of Wavelet Analysis in EMG Feature Extraction for Pattern Classification. Meas. Sci. Rev. 2011, 11, 45–52. [Google Scholar] [CrossRef]
- Phinyomark, A.; Nuidod, A.; Phukpattaranont, P.; Limsakul, C. Feature extraction and reduction of wavelet transform coefficients for EMG pattern classification. Elektron. Elektrotech. 2012, 122, 27–32. [Google Scholar] [CrossRef]
- Phinyomark, A.; Phukpattaranont, P.; Limsakul, C. Wavelet-based denoising algorithm for robust EMG pattern recognition. Fluct. Noise Lett. 2011, 10, 157–167. [Google Scholar] [CrossRef]
- Wang, G.; Wang, Z.; Chen, W.; Zhuang, J. Classification of surface EMG signals using optimal wavelet packet method based on Davies-Bouldin criterion. Med. Biol. Eng. Comput. 2006, 44, 865–872. [Google Scholar] [CrossRef]
- Englehart, K.; Hudgins, B.; Parker, P.; Stevenson, M. Improving myoelectric signal classification using wavelet packets and principal components analysis. Proc. IEEE 1999, 1, 569–570. [Google Scholar]
- Andrade, A.O.; Nasuto, S.; Kyberd, P.; Sweeney-Reed, C.M.; Van Kanijn, F. EMG signal filtering based on empirical mode decomposition. Biomed. Signal Process. Control 2006, 1, 44–55. [Google Scholar] [CrossRef]
- Zhang, X.; Zhou, P. Filtering of surface EMG using ensemble empirical mode decomposition. Med. Eng. Phys. 2013, 35, 537–542. [Google Scholar] [CrossRef]
- Naik, G.R.; Selvan, S.E.; Nguyen, H.T. Single-channel EMG classification with ensemble-empirical-mode- decomposition-based ICA for diagnosing neuromuscular disorders. IEEE Trans. Neural Syst. Rehabil. Eng. 2015, 24, 734–743. [Google Scholar] [CrossRef] [PubMed]
- Tabatabaei, S.M.; Chalechale, A. Local binary patterns for noise-tolerant sEMG classification. Signal Image Video Process. 2019, 13, 491–498. [Google Scholar] [CrossRef]
- Ertuğrul, Ö.F.; Kaya, Y.; Tekin, R. A novel approach for SEMG signal classification with adaptive local binary patterns. Med. Biol. Eng. Comput. 2016, 54, 1137–1146. [Google Scholar] [CrossRef] [PubMed]
- Tabatabaei, S.M.; Chalechale, A. One Dimensional Second Order Derivative Local Binary Pattern for Hand Gestures Classification Using sEMG Signals. In Proceedings of the 8th International Conference on Computer and Knowledge Engineering (ICCKE), Mashhad, Iran, 25–26 October 2018; pp. 16–19. [Google Scholar] [CrossRef]
- Liu, L.; Liu, P.; Clancy, E.A.; Scheme, E.; Englehart, K.B. Whitening of the electromyogram for improved classification accuracy in prosthesis control. In Proceedings of the Annual International Conference of the IEEE Engineering in Medicine and Biology Society, San Diego, CA, USA, 28 August–1 September 2012; pp. 2627–2630. [Google Scholar] [CrossRef]
- Englehart, K.; Hudgins, B. A robust, real-time control scheme for multifunction myoelectric control. IEEE Trans. Biomed. Eng. 2003, 50, 848–854. [Google Scholar] [CrossRef] [PubMed]
- Campbell, E.D.; Phinyomark, A.; Scheme, E. Linear Discriminant Analysis with Bayesian Risk Parameters for Myoelectric Control. In Proceedings of the IEEE Global Conference on Signal and Information Processing (GlobalSIP) (GlobalSIP 2019), Ottawa, ON, Canada, 11–14 November 2019. [Google Scholar]
- Khushaba, R.N.; Kodagoda, S.; Takruri, M.; Dissanayake, G. Toward improved control of prosthetic fingers using surface electromyogram (EMG) signals. Expert Syst. Appl. 2012, 39, 10731–10738. [Google Scholar] [CrossRef]
- Amsüss, S.; Goebel, P.M.; Jiang, N.; Graimann, B.; Paredes, L.; Farina, D. Self-Correcting Pattern Recognition System of Surface EMG Signals for Upper Limb Prosthesis Control. IEEE Trans. Biomed. Eng. 2014, 61, 1167–1176. [Google Scholar] [CrossRef]
- Al-Timemy, A.H.; Bugmann, G.; Escudero, J. Adaptive Windowing Framework for Surface Electromyogram- Based Pattern Recognition System for Transradial Amputees. Sensors 2018, 18, 2402. [Google Scholar] [CrossRef]
- Robertson, J.W.; Englehart, K.B.; Scheme, E.J. Rejection of Systemic and Operator Errors in a Real-Time Myoelectric Control Task. In Proceedings of the 40th Annual International Conference of the IEEE Engineering in Medicine and Biology Society (EMBC), Honolulu, HI, USA, 17–21 July 2018; pp. 5640–5643. [Google Scholar] [CrossRef]
- Robertson, J.; Scheme, E.; Englehart, K. Effects of Confidence-Based Rejection on Usability and Error in Pattern Recognition-Based Myoelectric Control. IEEE J. Biomed. Health Inform. 2018, 1. [Google Scholar] [CrossRef]
- Farfán, F.D.; Politti, J.C.; Felice, C.J. Evaluation of EMG processing techniques using information theory. Biomed. Eng. Online 2010, 9, 72. [Google Scholar] [CrossRef]
- Farrell, T.R.; Weir, R.F. The optimal controller delay for myoelectric prostheses. IEEE Trans. Neural Syst. Rehabil. Eng. 2007, 15, 111–118. [Google Scholar] [CrossRef]
- Boostani, R.; Moradi, M.H. Evaluation of the forearm EMG signal features for the control of a prosthetic hand. Physiol. Meas. 2003, 24, 309. [Google Scholar] [CrossRef] [PubMed]
- Zardoshti-Kermani, M.; Wheeler, B.C.; Badie, K.; Hashemi, R.M. EMG feature evaluation for movement control of upper extremity prostheses. IEEE Trans. Rehabil. Eng. 1995, 3, 324–333. [Google Scholar] [CrossRef]
- Phinyomark, A.; Phukpattaranont, P.; Limsakul, C. Feature Reduction and Selection for EMG Signal Classification. Expert Syst. Appl. 2012, 39, 7420–7431. [Google Scholar] [CrossRef]
- Phinyomark, A.; Quaine, F.; Charbonnier, S.; Serviere, C.; Tarpin-Bernard, F.; Laurillau, Y. EMG feature evaluation for improving myoelectric pattern recognition robustness. Expert Syst. Appl. 2013, 40, 4832–4840. [Google Scholar] [CrossRef]
- Zhang, X.; Wang, Y.; Han, R.P.S. Wavelet transform theory and its application in EMG signal processing. In Proceedings of the Seventh International Conference on Fuzzy Systems and Knowledge Discovery, Shandong, China, 10–12 August 2010; Volume 5, pp. 2234–2238. [Google Scholar] [CrossRef]
- Duan, F.; Dai, L.; Chang, W.; Chen, Z.; Zhu, C.; Li, W. sEMG-Based Identification of Hand Motion Commands Using Wavelet Neural Network Combined With Discrete Wavelet Transform. IEEE Trans. Ind. Electron. 2016, 63, 1923–1934. [Google Scholar] [CrossRef]
- Ren, X.; Hu, X.; Wang, Z.; Yan, Z. MUAP extraction and classification based on wavelet transform and ICA for EMG decomposition. Med. Biol. Eng. Comput. 2006, 44, 371. [Google Scholar] [CrossRef]
- Hudgins, B.; Parker, P.; Scott, R.N. A new strategy for multifunction myoelectric control. IEEE Trans. Biomed. Eng. 1993, 40, 82–94. [Google Scholar] [CrossRef]
- Phinyomark, A.; Quaine, F.; Laurillau, Y.; Thongpanja, S.; Limsakul, C.; Phukpattaranont, P. EMG amplitude estimators based on probability distribution for muscle–computer interface. Fluct. Noise Lett. 2013, 12, 1350016. [Google Scholar] [CrossRef]
- Thongpanja, S.; Phinyomark, A.; Phukpattaranont, P.; Limsakul, C. Mean and Median Frequency of EMG Signal to Determine Muscle Force Based on Time-Dependent Power Spectrum. Elektron. Elektrotech. 2013, 19. [Google Scholar] [CrossRef]
- Thongpanja, S.; Phinyomark, A.; Hu, H.; Limsakul, C.; Phukpattaranont, P. The effects of the force of contraction and elbow joint angle on mean and median frequency analysis for muscle fatigue evaluation. ScienceAsia 2015, 41, 263–272. [Google Scholar] [CrossRef]
- Phinyomark, A.; Hu, H.; Phukpattaranont, P.; Limsakul, C. Application of Linear Discriminant Analysis in Dimensionality Reduction for Hand Motion Classification. Meas. Sci. Rev. 2012, 12, 82–89. [Google Scholar] [CrossRef]
- Richman, J.S.; Moorman, J.R. Physiological time-series analysis using approximate entropy and sample entropy. Am. J. Physiol.-Heart Circ. Physiol. 2000, 278, H2039–H2049. [Google Scholar] [CrossRef] [PubMed]
- Phinyomark, A.; Quaine, F.; Charbonnier, S.; Serviere, C.; Tarpin-Bernard, F.; Laurillau, Y. Feature extraction of the first difference of EMG time series for EMG pattern recognition. Comput. Methods Programs Biomed. 2014, 117, 247–256. [Google Scholar] [CrossRef]
- Park, S.H.; Lee, S.P. EMG pattern recognition based on artificial intelligence techniques. IEEE Trans. Rehabil. Eng. 1998, 6, 400–405. [Google Scholar] [CrossRef] [PubMed]
- Kim, K.S.; Choi, H.H.; Moon, C.S.; Mun, C.W. Comparison of k-nearest neighbor, quadratic discriminant and linear discriminant analysis in classification of electromyogram signals based on the wrist-motion directions. Curr. Appl. Phys. 2011, 11, 740–745. [Google Scholar] [CrossRef]
- Gitter, J.A.; Czerniecki, M.J. Fractal analysis of the electromyographic interference pattern. J. Neurosci. Methods 1995, 58, 103–108. [Google Scholar] [CrossRef]
- Phinyomark, A.; Phukpattaranont, P.; Limsakul, C.; Phothisonothai, M. Electromyography (EMG) signal classification based on detrended fluctuation analysis. Fluct. Noise Lett. 2011, 10, 281–301. [Google Scholar] [CrossRef]
- Arjunan, S.P.; Kumar, D.K. Decoding subtle forearm flexions using fractal features of surface electromyogram from single and multiple sensors. J. Neuroeng. Rehabil. 2010, 7, 53. [Google Scholar] [CrossRef]
- Gupta, V.; Suryanarayanan, S.; Reddy, N.P. Fractal analysis of surface EMG signals from the biceps. Int. J. Med. Inform. 1997, 45, 185–192. [Google Scholar] [CrossRef]
- Phinyomark, A.N.; Khushaba, R.; Scheme, E. Feature Extraction and Selection for Myoelectric Control Based on Wearable EMG Sensors. Sensors 2018, 18, 1615. [Google Scholar] [CrossRef]
- Asogbon, M.G.; Samuel, O.W.; Geng, Y.; Idowu, P.O.; Chen, S.; R, N.G.; Feng, P.; Li, G. Enhancing the Robustness of EMG-PR Based System against the Combined Influence of Force Variation and Subject Mobility. In Proceedings of the 2018 3rd Asia-Pacific Conference on Intelligent Robot Systems (ACIRS), Singapore, 21–23 July 2018; pp. 12–17. [Google Scholar] [CrossRef]
- Hjorth, B. EEG analysis based on time domain properties. Electroencephalogr. Clin. Neurophysiol. 1970, 29, 306–310. [Google Scholar] [CrossRef]
- Al-Timemy, A.H.; Khushaba, R.N.; Bugmann, G.; Escudero, J. Improving the performance against force variation of EMG controlled multifunctional upper-limb prostheses for transradial amputees. IEEE Trans. Neural Syst. Rehabil. Eng. 2015, 24, 650–661. [Google Scholar] [CrossRef] [PubMed]
- Phinyomark, A.; Khushaba, R.N.; Ibáñez-Marcelo, E.; Patania, A.; Scheme, E.; Petri, G. Navigating features: A topologically informed chart of electromyographic features space. J. R. Soc. Interface 2017, 14. [Google Scholar] [CrossRef] [PubMed]
- Oskoei, M.A.; Hu, H. Support vector machine-based classification scheme for myoelectric control applied to upper limb. IEEE Trans. Biomed. Eng. 2008, 55, 1956–1965. [Google Scholar] [CrossRef] [PubMed]
- Saponas, T.S.; Tan, D.S.; Morris, D.; Balakrishnan, R. Demonstrating the feasibility of using forearm electromyography for muscle-computer interfaces. In Proceedings of the SIGCHI Conference on Human Factors in Computing Systems, Florence, Italy, 5–10 April 2008; ACM: New York, NY, USA, 2008; pp. 515–524. [Google Scholar]
- Phinyomark, A.; Phukpattaranont, P.; Limsakul, C. Fractal analysis features for weak and single-channel upper-limb EMG signals. Expert Syst. Appl. 2012, 39, 11156–11163. [Google Scholar] [CrossRef]
- Qingju, Z.; Zhizeng, L. Wavelet de-noising of electromyography. In Proceedings of the IEEE International Conference on Mechatronics and Automation, Henan, China, 25–28 June 2006; pp. 1553–1558. [Google Scholar]
- Du, S.; Vuskovic, M. Temporal vs. spectral approach to feature extraction from prehensile EMG signals. In Proceedings of the 2004 IEEE International Conference on Information Reuse and Integration, Las Vegas, NV, USA, 1–3 November 2004; pp. 344–350. [Google Scholar]
- Sinderby, C.; Lindstrom, L.; Grassino, A. Automatic assessment of electromyogram quality. J. Appl. Physiol. 1995, 79, 1803–1815. [Google Scholar] [CrossRef]
- McCool, P.; Fraser, G.D.; Chan, A.D.; Petropoulakis, L.; Soraghan, J.J. Identification of contaminant type in surface electromyography (EMG) signals. IEEE Trans. Neural Syst. Rehabil. Eng. 2014, 22, 774–783. [Google Scholar] [CrossRef]
- Phinyomark, A.; Phothisonothai, M.; Phukpattaranont, P.; Limsakul, C. Critical exponent analysis applied to surface EMG signals for gesture recognition. Metrol. Meas. Syst. 2011, 18, 645–658. [Google Scholar] [CrossRef]
- Phinyomark, A.; Phothisonothai, M.; Phukpattaranont, P.; Limsakul, C. Evaluation of movement types and electrode positions for EMG pattern classification based on linear and non-linear features. Eur. J. Sci. Res 2011, 62, 24–34. [Google Scholar]
- Thongpanja, S.; Phinyomark, A.; Quaine, F.; Laurillau, Y.; Limsakul, C.; Phukpattaranont, P. Probability density functions of stationary surface EMG signals in noisy environments. IEEE Trans. Instrum. Meas. 2016, 65, 1547–1557. [Google Scholar] [CrossRef]
- Van Den Broek, E.L.; Schut, M.H.; Westerink, J.H.; van Herk, J.; Tuinenbreijer, K. Computing emotion awareness through facial electromyography. In Proceedings of the European Conference on Computer Vision, Graz, Austria, 7–13 May 2006; Springer: Berlin, Germany, 2006; pp. 52–63. [Google Scholar]
- Talebinejad, M.; Chan, A.D.; Miri, A.; Dansereau, R.M. Fractal analysis of surface electromyography signals: A novel power spectrum-based method. J. Electromyogr. Kinesiol. 2009, 19, 840–850. [Google Scholar] [CrossRef] [PubMed]
- Oskoei, M.A.; Hu, H. GA-based feature subset selection for myoelectric classification. In Proceedings of the IEEE International Conference on Robotics and Biomimetics, Kunming, China, 17–20 December 2006; pp. 1465–1470. [Google Scholar]
- Phinyomark, A.; Phukpattaranont, P.; Limsakul, C. Applications of variance fractal dimension: A survey. Fractals 2014, 22, 1450003. [Google Scholar] [CrossRef]
- Khushaba, R.N.; Al-Ani, A.; Al-Timemy, A.; Al-Jumaily, A. A fusion of time-domain descriptors for improved myoelectric hand control. In Proceedings of the IEEE Symposium Series on Computational Intelligence (SSCI), Athens, Greece, 6–9 December 2016; pp. 1–6. [Google Scholar]
- He, J.; Zhang, D.; Sheng, X.; Meng, J.; Zhu, X. Improved discrete fourier transform based spectral feature for surface electromyogram signal classification. In Proceedings of the 35th Annual International Conference of the IEEE Engineering in Medicine and Biology Society (EMBC), Osaka, Japan, 3–7 July 2013; pp. 6897–6900. [Google Scholar] [CrossRef]
- Khushaba, R.N.; Krasoulis, A.; Al-Jumaily, A.; Nazarpour, K. Spatio-Temporal Inertial Measurements Feature Extraction Improves Hand Movement Pattern Recognition without Electromyography. In Proceedings of the 40th Annual International Conference of the IEEE Engineering in Medicine and Biology Society (EMBC), Honolulu, HI, USA, 17–21 July 2018; pp. 2108–2111. [Google Scholar] [CrossRef]
- Hu, X.; Wang, Z.; Ren, X. Classification of surface EMG signal using relative wavelet packet energy. Comput. Methods Programs Biomed. 2005, 79, 189–195. [Google Scholar] [CrossRef] [PubMed]
- Chang, G.C.; Kang, W.J.; Luh, J.J.; Cheng, C.K.; Lai, J.S.; Chen, J.J.J.; Kuo, T.S. Real-time implementation of electromyogram pattern recognition as a control command of man-machine interface. Med. Eng. Phys. 1996, 18, 529–537. [Google Scholar] [CrossRef]
- Khushaba, R.N.; Shi, L.; Kodagoda, S. Time-dependent spectral features for limb position invariant myoelectric pattern recognition. In Proceedings of the 2012 International Symposium on Communications and Information Technologies (ISCIT), Gold Coast, Australia, 2–5 October 2012; pp. 1015–1020. [Google Scholar] [CrossRef]
- Tkach, D.; Huang, H.; Kuiken, T.A. Study of stability of time-domain features for electromyographic pattern recognition. J. Neuroeng. Rehabil. 2010, 7, 21. [Google Scholar] [CrossRef]
- He, J.; Zhang, D.; Sheng, X.; Li, S.; Zhu, X. Invariant Surface EMG Feature Against Varying Contraction Level for Myoelectric Control Based on Muscle Coordination. IEEE J. Biomed. Health Inform. 2015, 19, 874–882. [Google Scholar] [CrossRef]
- Liu, J.; Li, X.; Li, G.; Zhou, P. EMG feature assessment for myoelectric pattern recognition and channel selection: A study with incomplete spinal cord injury. Med. Eng. Phys. 2014, 36, 975–980. [Google Scholar] [CrossRef]
- Negi, S.; Kumar, Y.; Mishra, V.M. Feature extraction and classification for EMG signals using linear discriminant analysis. In Proceedings of the 2nd International Conference on Advances in Computing, Communication, Automation (ICACCA) (Fall), Bareillym, India, 30 September–1 October 2016; pp. 1–6. [Google Scholar] [CrossRef]
- Ververidis, D.; Kotropoulos, C. Sequential forward feature selection with low computational cost. In Proceedings of the 13th European Signal Processing Conference, Antalya, Turkey, 4–8 September 2005; pp. 1–4. [Google Scholar]
- Gao, Q.; Wang, Q.; Huang, Y.; Gao, X.; Hong, X.; Zhang, H. Dimensionality reduction by integrating sparse representation and Fisher criterion and its applications. IEEE Trans. Image Process. 2015, 24, 5684–5695. [Google Scholar] [CrossRef]
- Lee, D.D.; Seung, H.S. Algorithms for non-negative matrix factorization. In Advances in Neural Information Processing Systems; MIT Press: London, UK, 2001; pp. 556–562. [Google Scholar]
- Thompson, B. Canonical correlation analysis. In Encyclopedia of Statistics in Behavioral Science; Wiley: Hoboken, NJ, USA, 2005. [Google Scholar]
- Güler, N.F.; Koçer, S. Classification of EMG signals using PCA and FFT. J. Med. Syst. 2005, 29, 241–250. [Google Scholar] [CrossRef]
- Balasubramanian, M.; Schwartz, E.L. The isomap algorithm and topological stability. Science 2002, 295, 7. [Google Scholar] [CrossRef]
- Maaten, L.v.d.; Hinton, G. Visualizing data using t-SNE. J. Mach. Learn. Res. 2008, 9, 2579–2605. [Google Scholar]
- Hinton, G.E.; Zemel, R.S. Autoencoders, minimum description length and Helmholtz free energy. In Advances in Neural Information Processing Systems; MIT Press: London, UK, 1994; pp. 3–10. [Google Scholar]
- Kruskal, J.B. Nonmetric multidimensional scaling: A numerical method. Psychometrika 1964, 29, 115–129. [Google Scholar] [CrossRef]
- Côté-Allard, U.; Campbell, E.; Phinyomark, A.; Laviolette, F.; Gosselin, B.; Scheme, E. Interpreting deep learning features for myoelectric control: A comparison with handcrafted features. arXiv 2019, arXiv:1912.00283. [Google Scholar] [CrossRef]
- Xia, P.; Hu, J.; Peng, Y. EMG-based estimation of limb movement using deep learning with recurrent convolutional neural networks. Artif. Organs 2018, 42, E67–E77. [Google Scholar] [CrossRef]
- Scheme, E.J.; Englehart, K.B. Validation of a selective ensemble-based classification scheme for myoelectric control using a three-dimensional Fitts’ law test. IEEE Trans. Neural Syst. Rehabil. Eng. 2012, 21, 616–623. [Google Scholar] [CrossRef]
- Kamavuako, E.N.; Scheme, E.J.; Englehart, K.B. On the usability of intramuscular EMG for prosthetic control: A Fitts’ law approach. J. Electromyogr. Kinesiol. 2014, 24, 770–777. [Google Scholar] [CrossRef]
- Wurth, S.M.; Hargrove, L.J. A real-time comparison between direct control, sequential pattern recognition control and simultaneous pattern recognition control using a Fitts’ law style assessment procedure. J. Neuroeng. Rehabil. 2014, 11, 91. [Google Scholar] [CrossRef]
- Scheme, E.; Fougner, A.; Stavdahl, Ø.; Chan, A.D.C.; Englehart, K. Examining the adverse effects of limb position on pattern recognition based myoelectric control. In Proceedings of the 2010 Annual International Conference of the IEEE Engineering in Medicine and Biology, Buenos Aires, Argentina, 31 August–4 September 2010; pp. 6337–6340. [Google Scholar] [CrossRef]
- Jiang, N.; Muceli, S.; Graimann, B.; Farina, D. Effect of arm position on the prediction of kinematics from EMG in amputees. Med. Biol. Eng. Comput. 2013, 51, 143–151. [Google Scholar] [CrossRef]
- Chen, L.; Geng, Y.; Li, G. Effect of upper-limb positions on motion pattern recognition using electromyography. In Proceedings of the 4th International Congress on Image and Signal Processing, Shanghai, China, 15–17 October 2011; Volume 1, pp. 139–142. [Google Scholar] [CrossRef]
- Liu, J.; Zhang, D.; He, J.; Zhu, X. Effect of dynamic change of arm position on myoelectric pattern recognition. In Proceedings of the IEEE International Conference on Robotics and Biomimetics (ROBIO), Guangzhou, China, 11–14 December 2012; pp. 1470–1475. [Google Scholar] [CrossRef]
- Clites, T.; Herr, H.; Srinivasan, S.; Zorzos, A.; Carty, M. The Ewing Amputation: The First Human Implementation of the Agonist-Antagonist Myoneural Interface. Plast. Reconstr. Surg. 2018, 6, 1–8. [Google Scholar] [CrossRef]
- Lorrain, T.; Jiang, N.; Farina, D. Influence of the training set on the accuracy of surface EMG classification in dynamic contractions for the control of multifunction prostheses. J. Neuroeng. Rehabil. 2011, 8, 25. [Google Scholar] [CrossRef]
- You, K.J.; Rhee, K.W.; Shin, H.C. Finger Motion Decoding Using EMG Signals Corresponding Various Arm Postures. Exp Neurobiol 2010, 19, 54–61. [Google Scholar] [CrossRef] [PubMed]
- Khushaba, R.N.; Al-Timemy, A.; Kodagoda, S. Influence of multiple dynamic factors on the performance of myoelectric pattern recognition. In Proceedings of the 37th Annual International Conference of the IEEE Engineering in Medicine and Biology Society (EMBC), Milano, Italy, 25–29 August 2015; pp. 1679–1682. [Google Scholar] [CrossRef]
- Ishii, A.; Kondo, T.; Yano, S. Improvement of EMG Pattern Recognition by Eliminating Posture-Dependent Components. Intelligent Autonomous Systems 14; Chen, W., Hosoda, K., Menegatti, E., Shimizu, M., Wang, H., Eds.; Springer International Publishing: Cham, Switzerland, 2017; pp. 19–30. [Google Scholar]
- Yang, D.; Yang, W.; Huang, Q.; Liu, H. Classification of Multiple Finger Motions During Dynamic Upper Limb Movements. IEEE J. Biomed. Health Inform. 2017, 21, 134–141. [Google Scholar] [CrossRef]
- Yang, D.; Gu, Y.; Jiang, L.; Osborn, L.; Liu, H. Dynamic training protocol improves the robustness of PR-based myoelectric control. Biomed. Signal Process. Control 2017, 31, 249–256. [Google Scholar] [CrossRef]
- Adewuyi, A.A.; Hargrove, L.J.; Kuiken, T.A. Resolving the effect of wrist position on myoelectric pattern recognition control. J. Neuroeng. Rehabil. 2017, 14, 39. [Google Scholar] [CrossRef]
- Gupta, T.; Yadav, J.; Chaudhary, S.; Agarwal, U. EMG Pattern Classification Using Neural Networks. In Intelligent Systems Technologies and Applications; Thampi, S.M., Mitra, S., Mukhopadhyay, J., Li, K.C., James, A.P., Berretti, S., Eds.; Springer International Publishing: Cham, Switzerland, 2018; pp. 232–242. [Google Scholar]
- Geng, Y.; Chen, L.; Tian, L.; Li, G. Comparison of electromyography and mechanomyogram in control of prosthetic system in multiple limb positions. In Proceedings of the IEEE-EMBS International Conference on Biomedical and Health Informatics, Hong Kong, China, 5–7 January 2012; pp. 788–791. [Google Scholar] [CrossRef]
- Geng, Y.; Zhou, P.; Li, G. Toward attenuating the impact of arm positions on electromyography pattern-recognition based motion classification in transradial amputees. J. NeuroEng. Rehabil. 2012, 9, 74. [Google Scholar] [CrossRef] [PubMed]
- Geng, Y.; Zhang, F.; Yang, L.; Zhang, Y.; Li, G. Reduction of the effect of arm position variation on real-time performance of motion classification. In Proceedings of the Annual International Conference of the IEEE Engineering in Medicine and Biology Society, San Diego, CA, USA, 28 August–1 September 2012; pp. 2772–2775. [Google Scholar] [CrossRef]
- Khushaba, R.N. Correlation Analysis of Electromyogram Signals for Multiuser Myoelectric Interfaces. IEEE Trans. Neural Syst. Rehabil. Eng. 2014, 22, 745–755. [Google Scholar] [CrossRef]
- Liu, J.; Zhang, D.; Sheng, X.; Zhu, X. Quantification and solutions of arm movements effect on sEMG pattern recognition. Biomed. Signal Process. Control 2014, 13, 189–197. [Google Scholar] [CrossRef]
- Masters, M.R.; Smith, R.J.; Soares, A.B.; Thakor, N.V. Towards better understanding and reducing the effect of limb position on myoelectric upper-limb prostheses. In Proceedings of the 36th Annual International Conference of the IEEE Engineering in Medicine and Biology Society, Chicago, IL, USA, 26–30 August 2014; pp. 2577–2580. [Google Scholar] [CrossRef]
- Radmand, A.; Scheme, E.; Englehart, K. On the Suitability of Integrating Accelerometry Data with Electromyography Signals for Resolving the Effect of Changes in Limb Position during Dynamic Limb Movement. J. Prosthet. Orthot. 2014, 26, 185–193. [Google Scholar] [CrossRef]
- Boschmann, A.; Platzner, M. Towards robust HD EMG pattern recognition: Reducing electrode displacement effect using structural similarity. In Proceedings of the 36th Annual International Conference of the IEEE Engineering in Medicine and Biology Society, EMBC, Chicago, IL, USA, 26–30 August 2014; pp. 4547–4550. [Google Scholar] [CrossRef]
- Al-Angari, H.M.; Kanitz, G.; Tarantino, S.; Cipriani, C. Distance and mutual information methods for EMG feature and channel subset selection for classification of hand movements. Biomed. Signal Process. Control 2016, 27, 24–31. [Google Scholar] [CrossRef]
- Betthauser, J.L.; Hunt, C.L.; Osborn, L.E.; Kaliki, R.R.; Thakor, N.V. Limb-position robust classification of myoelectric signals for prosthesis control using sparse representations. In Proceedings of the 38th Annual International Conference of the IEEE Engineering in Medicine and Biology Society (EMBC), Orlando, FL, USA, 16–20 August 2016; pp. 6373–6376. [Google Scholar] [CrossRef]
- Yu, Y.; Sheng, X.; Guo, W.; Zhu, X. Attenuating the impact of limb position on surface EMG pattern recognition using a mixed-LDA classifier. In Proceedings of the 2017 IEEE International Conference on Robotics and Biomimetics (ROBIO), Chicago, IL, USA, 26–30 August 2017; pp. 1497–1502. [Google Scholar] [CrossRef]
- Yanjuan, G.; Oluwarotimi, S.W.; Yue, W.; Guanglin, L. Improving the Robustness of Real-Time Myoelectric Pattern Recognition against Arm Position Changes in Transradial Amputees. BioMed Res. Int. 2017, 2017, 10. [Google Scholar] [CrossRef]
- Kanitz, G.; Cipriani, C.; Edin, B.B. Classification of Transient Myoelectric Signals for the Control of Multi-Grasp Hand Prostheses. IEEE Trans. Neural Syst. Rehabil. Eng. 2018, 26, 1756–1764. [Google Scholar] [CrossRef] [PubMed]
- Beaulieu, R.J.; Masters, M.R.; Betthauser, J.; Smith, R.J.; Kaliki, R.; Thakor, N.V.; Soares, A.B. Multi-position training improves robustness of pattern recognition and reduces limb-position effect in prosthetic control. J. Prosthet. Orthot. 2019, 29, 54. [Google Scholar] [CrossRef] [PubMed]
- Gu, Y.; Yang, D.; Huang, Q.; Yang, W.; Liu, H. Robust EMG pattern recognition in the presence of confounding factors: Features, classifiers and adaptive learning. Expert Syst. Appl. 2018, 96, 208–217. [Google Scholar] [CrossRef]
- Krasoulis, A.; Kyranou, I.; Erden, M.S.; Nazarpour, K.; Vijayakumar, S. Improved prosthetic hand control with concurrent use of myoelectric and inertial measurements. J. Neuroeng. Rehabil. 2017, 14, 71. [Google Scholar] [CrossRef] [PubMed]
- Urra, O.; Casals, A.; Jané, R. Evaluating Spatial Characteristics of Upper-Limb Movements from EMG Signals. In Proceedings of the XIII Mediterranean Conference on Medical and Biological Engineering and Computing, Seville, Spain, 25–28 September 2013; Roa Romero, L.M., Ed.; Springer International Publishing: Cham, Switzerland, 2014; pp. 1795–1798. [Google Scholar]
- González, J.; Horiuchi, Y.; Yu, W. Classification of Upper Limb Motions from Around-Shoulder Muscle Activities: Hand Biofeedback. Open Med. Informatics J. 2010, 4, 74–80. [Google Scholar] [CrossRef]
- Horiuchi, Y.; Kishi, T.; Gonzalez, J.; Yu, W. A study on classification of upper limb motions from around-shoulder muscle activities. In Proceedings of the IEEE International Conference on Rehabilitation Robotics, Kyoto, Japan, 23–26 June 2009; pp. 311–315. [Google Scholar] [CrossRef]
- Liarokapis, M.V.; Artemiadis, P.K.; Katsiaris, P.T.; Kyriakopoulos, K.J.; Manolakos, E.S. Learning human reach-to-grasp strategies: Towards EMG-based control of robotic arm-hand systems. In Proceedings of the IEEE International Conference on Robotics and Automation, St Paul, MN, USA, 14–19 May 2012; pp. 2287–2292. [Google Scholar] [CrossRef]
- Liarokapis, M.; Artemiadis, P.; Katsiaris, P.; Kyriakopoulos, K. Learning Task-Specific Models for Reach to Grasp Movements: Towards EMG-based Teleoperation of Robotic Arm-Hand Systems. In Proceedings of the 4th IEEE RAS & EMBS International Conference on Biomedical Robotics and Biomechatronics (BioRob), Rome, Italy, 24–27 June 2012. [Google Scholar] [CrossRef]
- Rivela, D.; Scannella, A.; Pavan, E.E.; Frigo, C.A.; Belluco, P.; Gini, G. Processing of surface EMG through pattern recognition techniques aimed at classifying shoulder joint movements. In Proceedings of the 37th Annual International Conference of the IEEE Engineering in Medicine and Biology Society (EMBC), Agia Napa, Cyprus, 31 October–4 November 2015; pp. 2107–2110. [Google Scholar] [CrossRef]
- Batzianoulis, I.; Krausz, N.E.; Simon, A.M.; Hargrove, L.; Billard, A. Decoding the grasping intention from electromyography during reaching motions. J. Neuroeng. Rehabil. 2018, 15, 57. [Google Scholar] [CrossRef]
- Schwarz, A.; Ofner, P.; Pereira, J.; Sburlea, A.I.; Mueller-Putz, G.R. Decoding natural reach-and-grasp actions from human EEG. J. Neural Eng. 2017, 15, 1. [Google Scholar]
- Betthauser, J.L.; Hunt, C.L.; Osborn, L.E.; Masters, M.R.; Lévay, G.; Kaliki, R.R.; Thakor, N.V. Limb Position Tolerant Pattern Recognition for Myoelectric Prosthesis Control with Adaptive Sparse Representations From Extreme Learning. IEEE Trans. Biomed. Eng. 2018, 65, 770–778. [Google Scholar] [CrossRef]
- Cheng, J.; Wei, F.; Li, C.; Liu, Y.; Liu, A.; Chen, X. Position-independent gesture recognition using sEMG signals via canonical correlation analysis. Comput. Biol. Med. 2018. [Google Scholar] [CrossRef]
- Khushaba, R.N.; Takruri, M.; Miro, J.V.; Kodagoda, S. Towards limb position invariant myoelectric pattern recognition using time-dependent spectral features. Neural Networks 2014, 55, 42–58. [Google Scholar] [CrossRef]
- Mukhopadhyay, A.K.; Samui, S. An experimental study on upper limb position invariant EMG signal classification based on deep neural network. Biomed. Signal Process. Control 2020, 55, 101669. [Google Scholar] [CrossRef]
- Powar, O.S.; Chemmangat, K. Reducing the effect of wrist variation on pattern recognition of Myoelectric Hand Prostheses Control through Dynamic Time Warping. Biomed. Signal Process. Control 2020, 55, 101626. [Google Scholar] [CrossRef]
- Liu, J.; Ren, Y.; Xu, D.; Kang, S.H.; Zhang, L. EMG-Based Real-Time Linear-Nonlinear Cascade Regression Decoding of Shoulder, Elbow and Wrist Movements in Able-Bodied Persons and Stroke Survivors. IEEE Trans. Biomed. Eng. 2019, 1. [Google Scholar] [CrossRef]
- Scheme, E.; Biron, K.; Englehart, K. Improving myoelectric pattern recognition positional robustness using advanced training protocols. In Proceedings of the Annual International Conference of the IEEE Engineering in Medicine and Biology Society, Boston, MA, USA, August 30–3 September 2011; pp. 4828–4831. [Google Scholar]
- Gazzoni, M.; Celadon, N.; Mastrapasqua, D.; Paleari, M.; Margaria, V.; Ariano, P. Quantifying Forearm Muscle Activity during Wrist and Finger Movements by Means of Multi-Channel Electromyography. PLoS ONE 2014, 9, 1–11. [Google Scholar] [CrossRef] [PubMed]
- Matsubara, T.; Morimoto, J. Bilinear Modeling of EMG Signals to Extract User-Independent Features for Multiuser Myoelectric Interface. IEEE Trans. Biomed. Eng. 2013, 60, 2205–2213. [Google Scholar] [CrossRef] [PubMed]
- Côté-Allard, U.; Fall, C.L.; Campeau-Lecours, A.; Gosselin, C.; Laviolette, F.; Gosselin, B. Transfer learning for sEMG hand gestures recognition using convolutional neural networks. In Proceedings of the IEEE International Conference on Systems, Man, and Cybernetics (SMC), Banff, AB, Canada, 5–8 October 2017; pp. 1663–1668. [Google Scholar] [CrossRef]
- Côé-Allard, U.; Latyr Fall, C.; Drouin, A.; Campeau-Lecours, A.; Gosselin, C.; Glette, K.; Laviolette, F.; Gosselin, B. Deep Learning for Electromyographic Hand GestureSignal Classification Using Transfer Learning. arXiv 2019, arXiv:1801.07756v5. [Google Scholar]
- Du, Y.; Jin, W.; Wei, W.; Hu, Y.; Geng, W. Surface EMG-Based Inter-Session Gesture Recognition Enhanced by Deep Domain Adaptation. Sensors 2017, 17, 458. [Google Scholar] [CrossRef]
- Shahzad, W.; Ayaz, Y.; Khan, M.J.; Naseer, N.; Khan, M. Enhanced Performance for Multi-Forearm Movement Decoding Using Hybrid IMU–sEMG Interface. Front. Neurorobotics 2019, 13, 43. [Google Scholar] [CrossRef]
- Campbell, E.; Phinyomark, A.; Scheme, E. Differences in Perspective on Inertial Measurement Unit Sensor Integration in Myoelectric Control. arXiv 2020, arXiv:2003.03424. [Google Scholar]
- Buskirk, E.; Komi, P. Reproducibility of electromyographic measurements with inserted wire electrodes and surface electrodes. Acta Physiol. Scand. 1970, 79, 29A. [Google Scholar]
- Moritani, T.; Devries, H.A. Neural factors versus hypertrophy in the time course of muscle strength gain. Am. J. Phys. Med. 1979, 58, 115–130. [Google Scholar]
- Moritani, T.; Devries, H.A. Reexamination of the relationship between the surface integrated electromyogram (IEMG) and force of isometric contraction. Am. J. Phys. Med. 1978, 57, 263–277. [Google Scholar]
- Moritani, T.; Muro, M. Motor unit activity and surface electromyogram power spectrum during increasing force of contraction. Eur. J. Appl. Physiol. Occup. Physiol. 1987, 56, 260–265. [Google Scholar] [CrossRef] [PubMed]
- Scheme, E.; Lock, B.; Hargrove, L.; Hill, W.; Kuruganti, U.; Englehart, K. Motion Normalized Proportional Control for Improved Pattern Recognition-Based Myoelectric Control. IEEE Trans. Neural Syst. Rehabil. Eng. 2014, 22, 149–157. [Google Scholar] [CrossRef] [PubMed]
- Yatsenko, D.; McDonnall, D.; Guillory, K.S. Simultaneous, proportional, multi-axis prosthesis control using multichannel surface EMG. In Proceedings of the 29th Annual International Conference of the IEEE Engineering in Medicine and Biology Society, Lyon, France, 23–26 August 2007; pp. 6133–6136. [Google Scholar]
- Rehbaum, H.; Jiang, N.; Paredes, L.; Amsuess, S.; Graimann, B.; Farina, D. Real time simultaneous and proportional control of multiple degrees of freedom from surface EMG: Preliminary results on subjects with limb deficiency. In Proceedings of the IEEE Annual International Conference of the IEEE Engineering in Medicine and Biology Society, San Diego, CA, USA, 28 August–1 September 2012; pp. 1346–1349. [Google Scholar]
- Harris, C.M.; Wolpert, D.M. Signal-dependent noise determines motor planning. Nature 1998, 394, 780–784. [Google Scholar] [CrossRef] [PubMed]
- Jones, K.E.; Hamilton, A.F.d.C.; Wolpert, D.M. Sources of signal-dependent noise during isometric force production. J. Neurophysiol. 2002, 88, 1533–1544. [Google Scholar] [CrossRef] [PubMed]
- Al-Timemy, A.H.; Bugmann, G.; Escudero, J.; Outram, N. A preliminary investigation of the effect of force variation for myoelectric control of hand prosthesis. In Proceedings of the 35th Annual International Conference of the IEEE Engineering in Medicine and Biology Society (EMBC), Osaka, Japan, 3–7 July 2013; pp. 5758–5761. [Google Scholar] [CrossRef]
- Brucker, B.S.; Buylaeva, N.V. Biofeedback effect on electromyography responses in patients with spinal cord injury. Arch. Phys. Med. Rehabil. 1996, 77, 133–137. [Google Scholar] [CrossRef]
- Halaki, M.; Ginn, K. Normalization of EMG signals: To normalize or not to normalize and what to normalize to? In Computational Intelligence in Electromyography Analysis—A Perspective on Current Applications and Future Challenges; IntechOpen: London, UK, 2012. [Google Scholar]
- Perry, J.; Davids, J.R.; Burnfield, J.M. Gait analysis: Normal and pathological function. J. Pediatr. Orthop. 1992, 12, 815. [Google Scholar] [CrossRef]
- Winter, D. EMG interpretation. In Electromyography in Ergonomics; Routledge: London, UK, 2017; pp. 109–126. [Google Scholar]
- Jobe, F.W.; Moynes, D.R.; Tibone, J.E.; Perry, J. An EMG analysis of the shoulder in pitching: A second report. Am. J. Sport. Med. 1984, 12, 218–220. [Google Scholar] [CrossRef]
- Pincivero, D.M.; Salfetnikov, Y.; Campy, R.M.; Coelho, A.J. Angle-and gender-specific quadriceps femoris muscle recruitment and knee extensor torque. J. Biomech. 2004, 37, 1689–1697. [Google Scholar] [CrossRef]
- Mathiassen, S.; Winkel, J.; Hägg, G. Normalization of surface EMG amplitude from the upper trapezius muscle in ergonomic studies—A review. J. Electromyogr. Kinesiol. 1995, 5, 197–226. [Google Scholar] [CrossRef]
- De Luca, C.J. The use of surface electromyography in biomechanics. J. Appl. Biomech. 1997, 13, 135–163. [Google Scholar] [CrossRef]
- Piitulainen, H.; Rantalainen, T.; Linnamo, V.; Komi, P.; Avela, J. Innervation zone shift at different levels of isometric contraction in the biceps brachii muscle. J. Electromyogr. Kinesiol. 2009, 19, 667–675. [Google Scholar] [CrossRef] [PubMed]
- Gander, R. Power spectral density of the surface myoelectric signal of the biceps brachi as a function of static load. Electromyograph. Clin. Neurophysiol. 1985, 25, 469–479. [Google Scholar]
- Gerdle, B.; Eriksson, N.; Brundin, L. The behaviour of the mean power frequency of the surface electromyogram in biceps brachii with increasing force and during fatigue. With special regard to the electrode distance. Electromyogr. Clin. Neurophysiol. 1990, 30, 483–489. [Google Scholar]
- Li, W.; Sakamoto, K. The influence of location of electrode on muscle fiber conduction velocity and EMG power spectrum during voluntary isometric contraction measured with surface array electrodes. Appl. Hum. Sci. 1996, 15, 25–32. [Google Scholar] [CrossRef][Green Version]
- Rainoldi, A.; Galardi, G.; Maderna, L.; Comi, G.; Conte, L.L.; Merletti, R. Repeatability of surface EMG variables during voluntary isometric contractions of the biceps brachii muscle. J. Electromyogr. Kinesiol. 1999, 9, 105–119. [Google Scholar] [CrossRef]
- Kaplanis, P.; Pattichis, C.; Hadjileontiadis, L.; Roberts, V. Surface EMG analysis on normal subjects based on isometric voluntary contraction. J. Electromyogr. Kinesiol. 2009, 19, 157–171. [Google Scholar] [CrossRef]
- Hussain, M.; Reaz, M.B.I.; Mohd-Yasin, F.; Ibrahimy, M.I. Electromyography signal analysis using wavelet transform and higher order statistics to determine muscle contraction. Expert Syst. 2009, 26, 35–48. [Google Scholar] [CrossRef]
- Nazarpour, K.; Al-Timemy, A.H.; Bugmann, G.; Jackson, A. A note on the probability distribution function of the surface electromyogram signal. Brain Res. Bull. 2013, 90, 88–91. [Google Scholar] [CrossRef]
- Naik, G.R.; Kumar, D.K.; Arjunan, S.P. Kurtosis and negentropy investigation of myo electric signals during different MVCs. In Proceedings of the ISSNIP Biosignals and Biorobotics Conference 2011, Adelaide, Australia, 6–9 December 2011; pp. 1–4. [Google Scholar]
- Kaplanis, P.; Pattichis, C.; Hadjileontiadis, L.; Panas, S. Bispectral analysis of surface EMG. In Proceedings of the 10th IEEE Mediterranean Electrotechnical Conference. Information Technology and Electrotechnology for the Mediterranean Countries, MeleCon 2000 (Cat. No. 00CH37099), Lemesos, Cyprus, 29–31 May 2000; Volume 2, pp. 770–773. [Google Scholar]
- Li, X.; Fang, P.; Tian, L.; Li, G. Increasing the robustness against force variation in EMG motion classification by common spatial patterns. In Proceedings of the 2017 39th Annual International Conference of the IEEE Engineering in Medicine and Biology Society (EMBC), Jeju Island, Korea, 11–15 July 2017; pp. 406–409. [Google Scholar] [CrossRef]
- Ameri, A.; Kamavuako, E.N.; Scheme, E.J.; Englehart, K.B.; Parker, P.A. Real-time, simultaneous myoelectric control using visual target-based training paradigm. Biomed. Signal Process. Control 2014, 13, 8–14. [Google Scholar] [CrossRef]
- Pan, L.; Zhang, D.; Liu, J.; Sheng, X.; Zhu, X. Continuous estimation of finger joint angles under different static wrist motions from surface EMG signals. Biomed. Signal Process. Control 2014, 14, 265–271. [Google Scholar] [CrossRef]
- Iqbal, N.V.; Subramaniam, K.; P., S.A. Robust feature sets for contraction level invariant control of upper limb myoelectric prosthesis. Biomed. Signal Process. Control 2019, 51, 90–96. [Google Scholar] [CrossRef]
- Iqbal, N.V.; Subramaniam, K.; P., S.A. Wavelet Packet Entropy Based Control of Myoelectric Prosthesis. Biomed. Pharmacol. J. 2018, 11, 375–380. [Google Scholar] [CrossRef]
- Lv, B.; Sheng, X.; Guo, W.; Zhu, X.; Ding, H. Towards Finger Gestures and Force Recognition Based on Wrist Electromyography and Accelerometers. In Intelligent Robotics and Applications; Huang, Y., Wu, H., Liu, H., Yin, Z., Eds.; Springer International Publishing: Cham, Switzerland, 2017; pp. 373–380. [Google Scholar]
- Atoufi, B.; Kamavuako, E.; Hudgins, B.; Englehart, K. Classification of hand and wrist tasks of unknown force levels using muscle synergies. In Proceedings of the 37th Annual International Conference of the IEEE Engineering in Medicine and Biology Society, EMBC, Milan, Italy, 25–29 August 2015; IEEE Press: New York, NY, USA, 2015; pp. 1663–1666. [Google Scholar] [CrossRef]
- Cai, D.; He, X.; Han, J. SRDA: An Efficient Algorithm for Large-Scale Discriminant Analysis. IEEE Trans. Knowl. Data Eng. 2008, 20, 1–12. [Google Scholar] [CrossRef]
- Powar, O.S.; Chemmangat, K. Dynamic time warping for reducing the effect of force variation on myoelectric control of hand prostheses. J. Electromyogr. Kinesiol. 2019. [Google Scholar] [CrossRef]
- Li, X.; Xu, R.; Samuel, O.W.; Tian, L.; Zou, H.; Zhang, X.; Chen, S.; Fang, P.; Li, G. A new approach to mitigate the effect of force variation on pattern recognition for myoelectric control. In Proceedings of the 38th Annual International Conference of the IEEE Engineering in Medicine and Biology Society (EMBC), Orlando, FL, USA, 16–20 August 2016; pp. 1684–1687. [Google Scholar] [CrossRef]
- Hoozemans, M.J.; van Dieën, J.H. Prediction of handgrip forces using surface EMG of forearm muscles. J. Electromyogr. Kinesiol. 2005, 15, 358–366. [Google Scholar] [CrossRef]
- Atoufi, B.; Kamavuako, E.; Hudgins, B.; Englehart, K. Toward proportional control of myoelectric prostheses with muscle synergies. J. Med. Biol. Eng. 2014, 34, 475–481. [Google Scholar] [CrossRef]
- Bilodeau, M.; Schindler-Ivens, S.; Williams, D.; Chandran, R.; Sharma, S. EMG frequency content changes with increasing force and during fatigue in the quadriceps femoris muscle of men and women. J. Electromyogr. Kinesiol. 2003, 13, 83–92. [Google Scholar] [CrossRef]
- Karlsson, S.; Gerdle, B. Mean frequency and signal amplitude of the surface EMG of the quadriceps muscles increase with increasing torque—A study using the continuous wavelet transform. J. Electromyogr. Kinesiol. 2001, 11, 131–140. [Google Scholar] [CrossRef]
- Soma, H.; Horiuchi, Y.; Gonzalez, J.; Yu, W. Classification of Upper Limb Motions from Around-Shoulder Muscle Activities. In Advances in Applied Electromyography; Mizrahi, J., Ed.; IntechOpen: Rijeka, Croatia, 2011; Chapter 3. [Google Scholar] [CrossRef]
- Luciw, M.; Jarocka, E.; Edin, B. Multi-channel EEG recordings during 3936 grasp and lift trials with varying weight and friction. Sci. Data 2014, 1. [Google Scholar] [CrossRef] [PubMed]
- Amsüss, S.; Paredes, L.P.; Rudigkeit, N.; Graimann, B.; Herrmann, M.J.; Farina, D. Long term stability of surface EMG pattern classification for prosthetic control. In Proceedings of the 2013 35th Annual International Conference of the IEEE Engineering in Medicine and Biology Society (EMBC), Osaka, Japan, 3–7 July 2013; pp. 3622–3625. [Google Scholar] [CrossRef]


| P# | Description | (,,,,) |
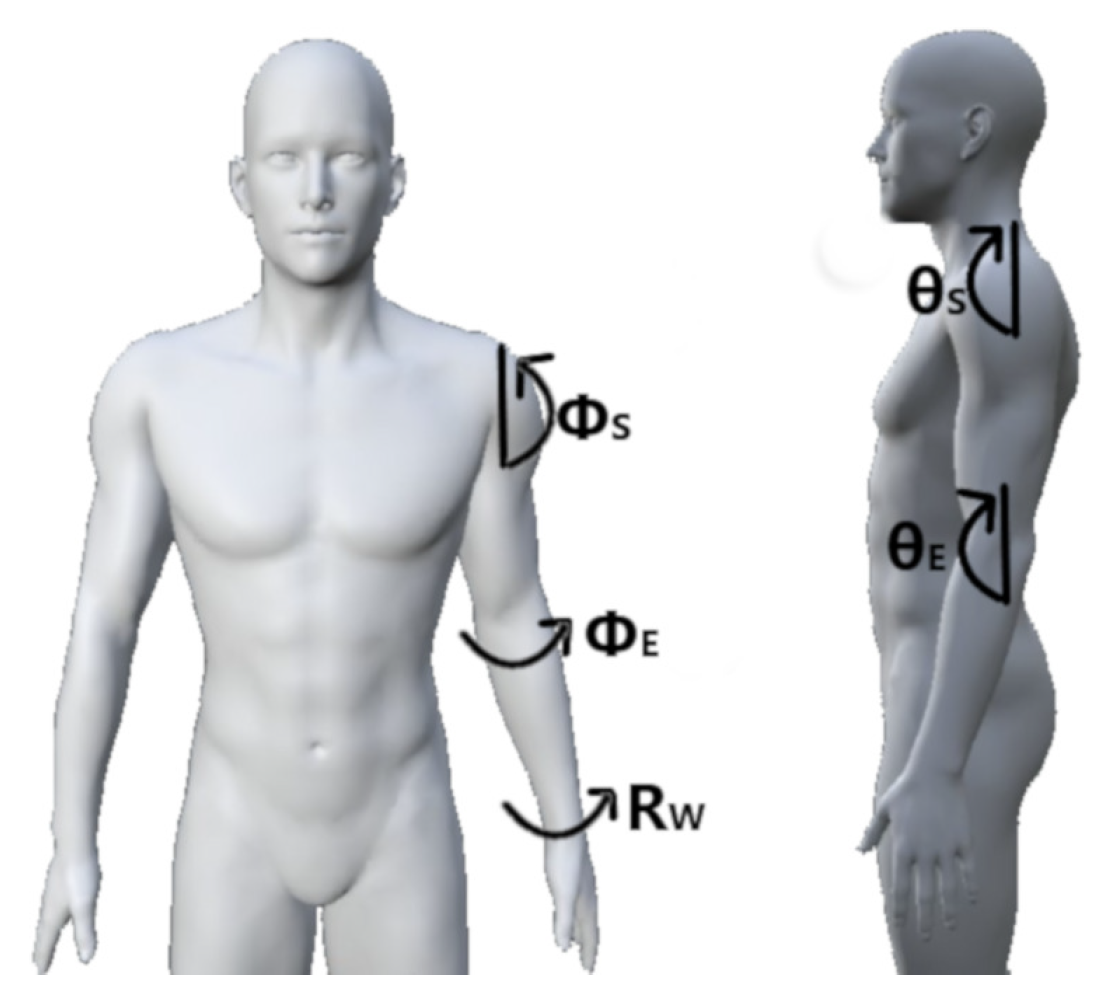
| P1 | Shoulder relaxed, elbow flexed 45, neutral wrist | (0, 0, 45, 0, 0) |
| P2 | Shoulder relaxed, elbow flexed 90, neutral wrist | (0, 0, 90, 0, 0) |
| P2s | Shoulder relaxed, elbow flexed 90, supinated wrist | (0, 0, 90, 0, 90) |
| P2p | Shoulder relaxed, elbow flexed 90, pronated wrist | (0, 0, 90, 0, −90) |
| P3 | Shoulder relaxed, elbow flexed 135, neutral wrist | (0, 0, 135, 0, 0) |
| P3s | Shoulder relaxed, elbow flexed 135, supinated wrist | (0, 0, 135, 0, 90) |
| P3p | Shoulder relaxed, elbow flexed 135, pronated wrist | (0, 0, 135, 0, −90) |
| P4 | Shoulder relaxed, elbow relaxed, neutral wrist | (0, 0, 0, 0, 0) |
| P5 | Shoulder hyperextension 30, elbow relaxed, neutral wrist | (−30, 0, 0, 0, 0) |
| P6 | Shoulder hyperextension 30, elbow flexed 90, neutral wrist | (−30, 0, 90, 0, 0) |
| P7 | Shoulder flexion 45, elbow relaxed, neutral wrist | (45, 0, 0, 0, 0) |
| P8 | Shoulder flexion/abduction 45, elbow relaxed, neutral wrist | (45, 45, 0, 0, 0) |
| P9 | Shoulder flexion 90, elbow relaxed, neutral wrist | (90, 0, 0, 0, 0) |
| P9s | Shoulder flexion 90, elbow relaxed, supinated wrist | (90, 0, 0, 0, 90) |
| P9p | Shoulder flexion 90, elbow relaxed, pronated wrist | (90, 0, 0, 0, −90) |
| P10 | Shoulder flexion 90, elbow flexion 90, neutral wrist | (90, 0, 90, 0, 0) |
| P11 | Shoulder flexion 90, elbow adduction 90, neutral wrist | (90, 0, 0, −90, 0) |
| P12 | Shoulder flexion/abduction 90, elbow relaxed, neutral wrist | (90, 90, 0, 0, 0) |
| P13 | Shoulder flexion 110, elbow relaxed, neutral wrist | (110, 0, 0, 0, 0) |
| P14 | Shoulder flexion 135, elbow relaxed, neutral wrist | (135, 0, 0, 0, 0) |
| P15 | Shoulder abduction 30, elbow flexion 90, neutral wrist | (0, 30, 90, 0, 0) |
| P16 | Shoulder abduction 45, elbow relaxed, neutral wrist | (0, 45, 0, 0, 0) |
| P17 | Shoulder abduction 75, elbow flexion 90, neutral wrist | (0, 75, 90, 0, 0) |
| P18 | Shoulder abduction 90, elbow relaxed, neutral wrist | (0, 90, 90, 0, 0) |
| P19 | Shoulder abduction 90, elbow flexed 90, wrist neutral | (0, 90, 90, 0, 0) |
| P20 | Torso horizontal, shoulder relaxed, elbow relaxed, neutral wrist | (0, 0, 0, 0, 0) |


| Ref | Dataset | N | C | M | R | Fs | A/D | Confounding Factors |
|---|---|---|---|---|---|---|---|---|
| [21] | D1: 5 Limb Position | 17 | 8 | 8 | 10 | 1000 | 16 | P2, P3, P4, P9, P14 |
| [22] | D2: 16 Limb Position | 10 | 6 | 8 | 4 | 1000 | n/a | 16 Saggital and Humeral |
| [23] | D3: 3 Forearm Orientation | 10 | 6 | 6 | 3 | 4000 | 12 | P2s, P2, P2p |
| [24] | D4: 7% MVC Level | 10 | 8 | 7 | 4 | 1000 | 16 | 20:10:80% MVC |
| [24] | D5: 3 Subjective Level (A) | 10 | 8 | 7 | 4 | 1000 | 16 | Low, Medium, High |
| [23] | D6: 3 Subjective Level (B) | 10 | 6 | 6 | 3 | 4000 | 12 | Low, Medium, High |
| Ref | Feature Extraction Method | Name | Ref | Feature Extraction Method | Name |
|---|---|---|---|---|---|
| [52] | Amplitude of the First Burst | AFB | [53,62] | Sample Entropy | SampEn |
| [63,64,65] | Difference Absolute Mean Value | DAMV | [53,62] | Approximate Entropy | ApEn |
| [63,65] | Difference Absolute Standard Deviation Value | DASDV | [51,52] | Willison’s Amplitude | WAMP |
| [51,52,63] | Difference Log Detector | DLD | [52,53] | Myopulse Percentage Rate | MYOP |
| [52,63] | Difference Temporal Moment | DTM | [53,66] | Box-Counting Fractal Dimension | BC |
| [51,52,63] | Difference Variance Value | DVARV | [67,68] | Higuchi Fractal Dimension | HG |
| [51,52,63] | Difference v-Order | DV | [53,69] | Katz Fractal Dimension | KATZ |
| [70] | Ł-Score | LS | [71] | Integral Square Descriptor | ISD |
| [71] | Coefficient of Regularization | COR | [71] | Modified Absolute Square Sum | MDIFF |
| [71] | Mean Difference Derivative | MDIFF | [72] | Activity | ACT |
| [72] | Mobility | MOB | [72] | Complexity | COMP |
| [51,52,64] | Integral of Electromyogram | IEMG | [53,68] | Maximum Fractal Length | MFL |
| [51,52,63] | Log Detector | LD | [51,63,64] | Autoregressive Coefficients | AR |
| [63,73] | Second-Order Moment | M2 | [63,64] | Cepstral Coefficients | CC |
| [74] | Mean Absolute Value First Difference | MAVFS | [70] | Mean Squared Ratio | MSR |
| [52,75] | Modified Mean Absolute Value 1 | MMAV1 | [51,63,64] | Difference Autoregressive Coefficient | DAR |
| [52,75] | Modified Mean Absolute Value 2 | MMAV2 | [63,64] | Difference Cepstral Coeffients | DCC |
| [51,58,76] | Mean Absolute Value | MAV | [67,77] | Detrend Fluctuation Analysis | DFA |
| [52,53] | Maximum | MAX | [52,78] | Power Spectrum Ratio | PSR |
| [52,79] | Multiple Hamming Windows | MHW | [80,81] | Signal to Noise Ratio | SNR |
| [52,53,79] | Mean Power | MNP | [82,83] | Critical Exponent | CE |
| [52,79] | Multiple Trapezoidal Windows | MTW | [80,81] | Drop in Power Density Ratio | DPR |
| [52,76] | Root Mean Square | RMS | [51,52] | Histogram | HIST |
| [52,79] | Spectral Moment | SM | [84,85] | Kurtosis | KURT |
| [52,79] | Sum of Squared Integral | SSI | [52] | Mean Absolute Value Slope | MAVS |
| [52,63] | Temporal Moment | TM | [80,81] | Power Spectrum Deformation | OHM |
| [52,53,79] | Total Power | TTP | [52,53] | Peak Frequency | PKF |
| [51,52,63] | Variance | VAR | [53,86] | Power Spectrum Density Fractal Dimension | PSDFD |
| [51,52,63] | v-Order | V | [84,85] | Skewness | SKEW |
| [52] | Waveform Length | WL | [80,81] | Signal to Motion Artefact Ratio | SMR |
| [52,75,87] | Frequency Ratio | FR | [73] | Time Domain Power Spectral Descriptors | TDPSD |
| [59,60] | Median Frequency | MDF | [52] | Variance of Central Frequency | VCF |
| [59,60] | Mean Frequency | MNF | [53,88] | Variance Fractal Dimension | VFD |
| [52] | Slope Sign Change | SSC | [89] | Fused Time Domain Descriptors | FTDD |
| [51,52] | Zero Crossings | ZC | [29,30] | Discrete Wavelet Transform | DWT |
| [90] | Discrete Fourier Transform | DFT | [33] | Wavelet Packet Transform | WPT |
| [91] | Graph Laplacian | GL | [92] | Relative Wavelet Packet Energy | RWPE |
| [71] | Mean Logrithmic Kernel | MLK |
| Ref | Abbrev. | Feature Set | Features |
|---|---|---|---|
| [57] | TD | Hudgin’s Time Domain | MAV, ZC, SSC, WL |
| [93] | TDAR | Time Domain Autoregressive | MAV, ZC, SSC, WL, AR4 |
| [74] | TSTD | Topologically Selected Time Domain | MAVFD, DASDV, WAMP, ZC, MFL, SampEn, |
| TDPSD | |||
| [70] | LSF4 | Low Sampling Frequency 4 | LS, MFL, MSR, WAMP |
| [70] | LSF9 | Low Sampling Frequency 9 | LS, MFL, MSR, WAMP, ZC. RMS, |
| IEMG, DASDV, VAR | |||
| [94] | TDPSD | Time Domain Power Spectral Descriptors | TDPSD |
| [95] | COMB | Combined | WL, SSC, LD, AR9 |
| [96] | DFTR | Discrete Fourier Transform Representation | DFTR |
| [71] | invTDF | Inverse Time Domain Features | ISD, COR, MASS, MDIFF, MLK |
| [72] | Hjorth | Hjorth Parameters | ACT, MOB, COMP |
| Reference | Reduction | Supervision | Linearity | Algorithm Name | Objective |
|---|---|---|---|---|---|
| [99] | Selection | Supervised | – | SFS (Wrapper) | Maximum Classification Accuracy |
| [99] | Either | – | SFS (Filter) | Optimal Statistical Measure | |
| [97] | – | MRMR | Class Separability - Feature Correlation | ||
| [61] | Linear | ULDA | Maximum Separability | ||
| [100] | Supervised | Linear | SR | Maximum Separability | |
| [101] | Projection | Linear | NMF | Non-negative Factors | |
| [102] | Linear | CCA | Maximize Domain Correlation | ||
| [103] | Linear | PCA | Preserve Variability | ||
| [104] | Unsupervised | Nonlinear | Isomap | Preserve Neighborhood Relationships | |
| [105] | Nonlinear | t-SNE | Preserve Neighborhood Relationships | ||
| [106] | Nonlinear | Autoencoder | Reduce Reconstruction Loss | ||
| [107] | Nonlinear | MDS | Preserve Pairwise Distance |
| Feature Set | Classifier | Test Framework | 5 Limb Position | 16 Limb Position | 3 Forearm Orientation |
|---|---|---|---|---|---|
| Mean±SD (Min, Max) | Mean±SD (Min, Max) | Mean±SD (Min, Max) | |||
| TD | LDA | Intra-Position | 94.5 ± 1.2 (93.1, 96.0) | 86.9 ± 1.9 (83.7, 90.2) | 96.1 ± 1.4 (94.6, 97.3) |
| Inter-Position | 80.2 ± 7.1 (67.7, 92.0) | 75.4 ± 6.6 (58.2, 89.4) | 36.8 ± 8.6 (27.8, 47.4) | ||
| Single-Position | 83.1 ± 2.2 (80.6, 86.6) | 76.1 ± 2.9 (70.9, 80.1) | 56.6 ± 1.1 (55.5, 57.6) | ||
| SVM | Intra-Position | 95.2 ± 0.9 (93.7, 96.1) | 85.9 ± 1.8 (83.0, 88.8) | 92.3 ± 1.7 (90.7, 94.1) | |
| Inter-Position | 86.5 ± 4.7 (77.5, 93.8) | 74.2 ± 6.4 (57.2, 86.4) | 36.1 ± 8.8 (25.7, 47.6) | ||
| Single-Position | 88.3 ± 0.8 (86.9, 89.1) | 74.9 ± 2.6 (70.3, 78.4) | 54.8 ± 2.2 (53.1, 57.3) | ||
| TSTD | LDA | Intra-Position | 96.9 ± 0.6 (96.1, 97.7) | 91.2 ± 1.8 (88.7, 94.6) | 97.0 ± 1.1 (95.9, 97.9) |
| Inter-Position | 86.3 ± 5.9 (75.9, 95.6) | 79.9 ± 7.0 (57.1, 92.5) | 38.2 ± 7.7 (31.1, 50.4) | ||
| Single-Position | 88.4 ± 0.9 (87.3, 89.7) | 80.6 ± 2.6 (76.1, 83.6) | 57.8 ± 1.9 (55.7, 59.4) | ||
| SVM | Intra-Position | 94.9 ± 0.6 (93.9, 95.3) | 86.7 ± 2.1 (83.5, 90.1) | 94.4 ± 1.4 (93.2, 95.9) | |
| Inter-Position | 85.6 ± 5.1 (76.6, 92.7) | 75.1 ± 6.5 (59.4, 88.6) | 45.8 ± 7.4 (35.6, 54.8) | ||
| Single-Position | 87.4 ± 1.0 (86.0, 88.7) | 75.9 ± 2.6 (71.6, 79.3) | 62.0 ± 1.2 (60.7, 63.1) |
| Feature Set | Classifier | Test Framework | 7% MVC Level | 3 Subjective Level (A) | 3 Subjective Level (B) |
|---|---|---|---|---|---|
| Mean±SD (Min, Max) | Mean±SD (Min, Max) | Mean±SD (Min, Max) | |||
| TD | LDA | Intra-Level | 94.0 ± 5.8 (83.0, 99.2) | 92.7 ± 2.9 (89.5, 95.2) | 96.1 ± 2.0 (93.8, 97.8) |
| Inter-Level | 67.9 ± 26.0 (19.7, 99.0) | 67.2 ± 19.2 (36.7, 90.2) | 71.4 ± 11.9 (55.5, 81.5) | ||
| Single-Level | 71.7 ± 6.6 (61.2, 79.3) | 75.7 ± 6.4 (68.4, 79.9) | 79.6 ± 5.7 (76.0, 86.2) | ||
| SVM | Intra-Level | 94.1 ± 6.3 (81.6, 99.2) | 93.4± 3.2 (90.3, 96.7) | 92.8 ± 1.8 (91.7, 94.9) | |
| Inter-Level | 67.2 ± 25.1 (19.3, 98.4) | 65.7 ± 17.6 (36.7, 85.8) | 59.4 ± 12.0 (40.5, 71.2) | ||
| Single-Level | 71.0 ± 6.1 (63.0, 78.5) | 75.0 ± 4.3 (70.2, 78.7) | 70.6 ± 6.0 (64.1, 76.0) | ||
| TSTD | LDA | Intra-Level | 95.0 ± 5.0 (85.1, 99.2) | 94.1 ± 3.4 (91.1, 97.7) | 96.9 ± 1.1 (95.7, 97.7) |
| Inter-Level | 71.2 ± 23.1 (25.7, 98.9) | 68.4 ± 15.8 (49.6, 87.8) | 69.0 ± 17.4 (40.4, 84.7) | ||
| Single-Level | 74.6 ± 7.9 (59.3, 82.5) | 77.0 ± 6.0 (70.9, 82.9) | 78.3 ± 8.6 (69.3, 86.6) | ||
| SVM | Intra-Level | 91.8 ± 5.3 (81.6, 96.1) | 91.0 ± 2.9 (88.2, 94.0) | 93.8 ± 2.4 (91.3, 96.1) | |
| Inter-Level | 66.3 ± 20.4 (28.4, 94.1) | 62.7 ± 13.7 (46.8, 77.8) | 62.7 ± 11.1 (45.1, 72.9) | ||
| Single-Level | 69.9 ± 8.1 (54.2, 77.8) | 72.1 ± 5.2 (66.7, 77.0) | 73.1 ± 4.5 (68.8, 77.8) |
| Ref. | Subject Details | Motion Details | Electrode Details | Instrumentation Details | Pattern Recognition Architecture | ||||||||||
|---|---|---|---|---|---|---|---|---|---|---|---|---|---|---|---|
| No. | Age | Sex | No. | Type | Position | No. | Location | Layout | Fs | Res. | Gain | Win Size/Inc | Features | Classifier | |
| [144] | 4N | 23.75 ± 2.06 | M | 3H | Dyn | 3D | 8 | DP, DD, DT | Sparse | 2000 | n/a | n/a | n/a | MN PK | kMeans |
| [143] | 4N | 23.75 ± 2.06 | M | 3H | Dyn | 3D | 8 | DP, DD, DT | Sparse | 2000 | n/a | n/a | n/a | MN PK | kMeans |
| [113] | 8N | n/a | 7M 1F | 7H + NM | Iso | P2 P3 P4 P9 P10 P14 P19 P20 | 8EMG 2ACC | DF | Circ. | 1000 | 16 | n/a | 250/50 | TD ACC | LDA |
| [119] | 2N | n/a | n/a | 8F + NM | Dyn | P2 P2s P2p P3 P3s P3p P9 P9s P9p | 4 | DW | Circ. | 512 | n/a | n/a | n/a | ShannonEn | MLF |
| [206] | 3N | 23 | M | 3H | Dyn | 3D | 5EMG 4ACC | DP DD DT | Sparse | 2000 | n/a | n/a | 100 200 300 | MN SB PK | ANN |
| [115] | 5A | 20–43 | 4M 1F | 6H + NM | Iso | P1 P2 P3 P4 P9 | 8 | F | Sparse | 4000 | n/a | n/a | 300/200 | TD | LDA |
| [206] | 3N | 23 | M | 3H | Dyn | 3D | 5EMG 4ACC | DP DD DT | Sparse | 400 | n/a | n/a | 100 200 300 | MN SB PK | ANN |
| [21] | 17N | 18–34 | 10M 7F | 7H + NM | Iso | P2 P3 P4 P9 P14 | 8EMG 2ACC | DF | Circ. | 1000 | 16 | n/a | 250/50 | TD ACC | LDA |
| [127] | 5A | 22–43 | 4M 1F | 6H + NM | Iso | P1 P2 P3 P4 P9 | 8 | F | 6 Circ. 2 Sparse | 4000 296.3 | n/a | n/a | 150/100 | TD MMG | LDA |
| [116] | 4N | n/a | n/a | 4H + NM | Iso | P3 P4 | 4 | DF | Circ. | 2000 | n/a | n/a | 200/50 | TD AR | LDA |
| [145] | 5N | 21–40 | n/a | 3 R2G | Dyn | 3D | 16 | DD DT DB DF | Sparse | 1000 | 16 | n/a | n/a | Boxplot | LDA QDA kNN ANN SVM RF |
| [146] | 5N | 21–40 | n/a | 3 R2G | Dyn | 3D | 16 | DD DT DB DF | Sparse | 1000 | 16 | n/a | n/a | Boxplot | LDA QDA kNN ANN SVM RF |
| [127] | 10N | 22–33 | 3M 7F | 6H + NM | Iso | P1 P2 P3 P4 P9 | 4EMG 4ACC | DF | Sparse | 1000 | n/a | n/a | 150/50 | TD | LDA |
| [94] | 8N | 20–37 | 7M 1F | 7H + NM | Iso | P2 P3 P4 P9 P14 | 7 | DF | Circ. | 4000 | 12 | 1000 | 150/50 | TDPSD | SVM |
| [127] | 5A | 22–43 | 4M 1F | 6H + NM | Iso | P1 P2 P3 P4 P9 | 8EMG 8ACC | AF nAF | Sparse | 4000 296.3 | n/a | n/a | 150/100 | TD MMG | LDA |
| [114] | 3A 5N | 31–42 24–40 | 2M 1F 2M 3F | 6H | Dyn | P9 P15 P18 | 7EMG | AF, nAF DF, nDF | Circ. | 2048 | 12 | 2000 | 100/40 | TD AR | MLP |
| [142] | 4N | 27–35 | 3M 1F | R | Dyn | 2D | 2 | DT DB | Sparse | 1000 | n/a | 500 | 50 | TD MPSDMNF MDF RMS TTP | SVM |
| [132] | 10N | 19–32 | 9M 1F | n/a | Dyn | 16 | 6 | DF | Circ. | 1000 | n/a | n/a | 200/100 | TD | LDA |
| [207] | 12N | 19–35 | 4M 8F | 1H | Dyn | 3D | 5EMG 32EEG | DF | Sparse | 500 5000 | n/a | n/a | n/a | n/a | n/a |
| [22] | 10N | 19–32 | 9M 1F | n/a | Dyn | 16 HP/ SP | 6 | DF | Circ. | 1000 | n/a | n/a | 200/100 | TD | LDA |
| [130] | 6N | n/a | 5M 1F | 6H + NM | Iso | P3 P4 P9 P18 | 6 | DF | Circ. | 2000 | n/a | n/a | 200/50 | AR | LDA CGMM |
| [157] | 8N | 25–40 | M | 14H | Dyn | P15 | 112 | LF | Grid | 2048 | 12 | 500 | n/a | Motor Modules | n/a |
| [131] | 2N | 25–25 | 1M 1F | 4H+NM | Iso | 2D | 8 | DF | Circ. | 1000 | n/a | n/a | 200/25 | TD | LDA |
| [152] | 11N | 20–37 | 9M 2F | 7H + NM | Iso | P2 P3 P4 P9 P14 | 7 | DF | Circ. | 4000 | 12 | 1000 | 100/25 | TDPSD | SVM LDA KNN ELM |
| Ref. | Subject Details | Motion Details | Electrode Details | Instrumentation Details | Pattern Recognition Architecture | ||||||||||
|---|---|---|---|---|---|---|---|---|---|---|---|---|---|---|---|
| No. | Age | Sex | No. | Type | Intensity | No. | Location | Layout | Fs | Res. | Gain | Win Size/Inc | Features | Classifier | |
| [173] | 2A | 32,29 | 2M | 4H | n/a | Low Moderate High | 12 | A | n/a | 2000 | n/a | 1000 | 160/40 | TD + KURT AR(4) + RMS | LDA |
| [208] | 5N | 25.8 ± 0.8 | 3M 2F | 7H + NM | n/a | 30 60 90 | 8 | DF | n/a | 1000 | 10 | 0-4.5 V | 128/50 | TD | LDA |
| [24] | 10N | 25–50 | 7M 3F | 6H + NM | n/a | 20 30 40 50 60 70 80 ramp | 8 | DF | n/a | 1000 | 16 | n/a | 160/16 | TD | LDA MV9 |
| [203] | 8N | 23-53 | 7M 1F | 8H | Dyn | 25 50 | 12 | DF | n/a | 1000 | 12 | 5000 | 200/50 | NMF | ANN |
| [198] | 9N | n/a | n/a | 6H + NM | Dyn | 20 30 40 50 60 70 80 | n/a | n/a | n/a | n/a | n/a | n/a | 200/200 | NMF | LDA |
| [120] | 10N | 20–30 | M | 6H | n/a | Low Moderate High | 6;8 | DF | n/a | 4000/2000 | 12;16 | 1000 | 150/75 | TDPSD DFT WT TD TDAR TDAR2 | SVM |
| [96] | 9N | 20–30 | M | 8H + NM | n/a | 20 50 80 | 8 | DF | Sparse | 2000 | n/a | n/a | 200/150 | cnDFTR gnDFTR TD COMB | LDA |
| [201] | 3N | 23–26 | n/a | 4H + NM | n/a | 20 50 80 | 4 | DF | Sparse | 1000 | n/a | n/a | 150/100 | TD | Parallel LDA |
| [23] | 12N 1A | 20–33 | 12M 1F | 6H | n/a | Low Medium High | 6 | DF | Sparse | 4000/2000 | 12;16 | 1000 | 150/75 | TDPSD DFT WT TD TDAR | SVM |
| [71] | 5N | 25–32 | n/a | n/a | n/a | n/a | 6 | DF | 4 Circ. 2 Sparse | 1024 | n/a | n/a | 150/100 | invTDF TD4 AR4 NOV | LDA |
| [95] | 8N | 35 ± 15 | 4M 4F | 4F + NM | Iso | 25 65 | 2 | DB DT | 4x4 Grid | 2500 | n/a | 60 dB | 150/75 | MAV ZC SSL WL WAMP V-Order LD VAR HIST(9) AR(9) CepC | LDA |
| [122] | 6N | 26.5 ± 3.1 | M | n/a | n/a | n/a | 8 | DF | Circ. | 2000 | n/a | n/a | 128/64 | TD FD TDF DFT_TD WT_TD WPT_TD | PNN LDA KNN SVM |
| [197] | 8N | 20–30 | n/a | n/a | n/a | n/a | 4EMG 4IMU | DW | Circ. | 2000/148 | n/a | n/a | 200/150 | TD iDFTm ACC TD+ACC iDFT+ACC | LDA |
| [195] | 9A | 31.8 ± 10.6 | 7M 2F | 6H | Iso | Low Medium High | 8 | A | Circ. | 2000 | 16 | 1000 | 250/125 | FFS PSEAR COMB DFA MFL TDPSD PSE AR HG TD | LDA SVM PNN QDA |
| [196] | 9A | 31.8 ± 10.6 | 7M 2F | 6H | Iso | Low Medium High | 8 | A | Circ. | 2000 | 16 | 1000 | 250/125 | SEN PEN ShannonWPE, LogEnergyWPE NormWPE SureWPE ThresholdWPE | LDA SVM PNN QDA |
| [200] | 9A 10N | 31.8 ± 10.6 20–30 | 7M 2F n/a | 6H | Iso | Low Medium High | 8 6 | A DF | Circ. | 2000 4000 | 16 12 | 1000 | 5000 250 | RMS TDPSD | DTW |
© 2020 by the authors. Licensee MDPI, Basel, Switzerland. This article is an open access article distributed under the terms and conditions of the Creative Commons Attribution (CC BY) license (http://creativecommons.org/licenses/by/4.0/).
Share and Cite
Campbell, E.; Phinyomark, A.; Scheme, E. Current Trends and Confounding Factors in Myoelectric Control: Limb Position and Contraction Intensity. Sensors 2020, 20, 1613. https://doi.org/10.3390/s20061613
Campbell E, Phinyomark A, Scheme E. Current Trends and Confounding Factors in Myoelectric Control: Limb Position and Contraction Intensity. Sensors. 2020; 20(6):1613. https://doi.org/10.3390/s20061613
Chicago/Turabian StyleCampbell, Evan, Angkoon Phinyomark, and Erik Scheme. 2020. "Current Trends and Confounding Factors in Myoelectric Control: Limb Position and Contraction Intensity" Sensors 20, no. 6: 1613. https://doi.org/10.3390/s20061613
APA StyleCampbell, E., Phinyomark, A., & Scheme, E. (2020). Current Trends and Confounding Factors in Myoelectric Control: Limb Position and Contraction Intensity. Sensors, 20(6), 1613. https://doi.org/10.3390/s20061613