Abstract
A facile and effective colorimetric-sensing platform based on the diazotization of phenosafranin for the detection of under acidic conditions using the Griess assay is presented. Diazotization of commercial phenosafranin produces a color change from purplish to blue, which enables colorimetric quantitative detection of . Optimal detection conditions were obtained at a phenosafranin concentration of 0.25 mM, HCl concentration of 0.4 M, and reaction time of 20 min. Under the optimized detection conditions, an excellent linearity range from 0 to 20 μM was obtained with a detection limit of 0.22 μM. Favorable reproducibility and selectivity of the colorimetric sensing platform toward were also verified. In addition, testing spiked ham sausage, bacon, and sprouts samples demonstrated its excellent practicability. The presented colorimetric sensing platform is a promising candidate for the detection of in real applications.
1. Introduction
As one of the most important inorganic salt anions, nitrite () plays significant roles in the fields of food, organic synthesis, pharmaceuticals, dyes, and agrochemicals [1,2,3,4,5]. However, the widespread use of nitrite poses a great threat to the environment due to its persistence in the soil and water [6,7]. In particular, in order to inhibit the propagation of toxic microorganisms in food and improve the color and flavor of meat products, nitrite has also been heavily used as an additive [8,9,10,11,12]. Extensive intake of nitrite can result in dysfunction of hemoglobin, digestive system cancer, and some other diseases [13,14,15,16,17]. In regards to the these problems, World Health Organization (WHO) and U.S. Environmental Protection Agency (EPA) set maximum contaminant levels (MCL) of nitrite in drinking water to 3.0 mg/L (65.1 μM) and 1.0 mg/L (21.7 μM), respectively [18]. Therefore, detection of nitrite is of great importance for environmental protection and food safety.
Currently, numerous detection technologies have been developed for the nitrite analysis. For example, high performance liquid chromatography (HPLC) [19,20], ion chromatography (IC) [21,22], gas chromatography-mass spectrometry (GC-MS) [23,24], and other sensing platform [25] are widely employed for the detection of nitrite. Despite accuracy and sensitivity, the large-scaled equipment needed, complex samples pretreatment, and requirement of skilled personnel handicap their in-field applications. To address these issues, electrochemical sensors based on various nano-materials were fabricated [26,27,28]. Yet, the vulnerability of the electrode (ease of being poisoned) may influence the sensitivity and precision of detection. The reproducibility and selectivity could pose large challenges for real samples analysis based on electrochemical sensors [29,30]. Thus, the development of a robust and simple sensing platform for nitrite detection is urgently needed.
The colorimetric sensor is being examined by scientists and engineers in the field of nitrite discrimination due to its speed and ability to be visualized by naked eyes [31,32,33,34,35]. Among them, the catalytic spectrophotometric method was extensively investigated based on the reaction between an oxidizing agent (potassium bromate, potassium chlorate, potassium permanganate, and hydrogen peroxide) and some organic dyes in the presence of nitrite, which leads to the color change of dyes and quantitative detection of nitrite [36,37]. However, the time-consuming catalytic spectrophotometric method and the ease of disturbance by and hinder their widespread use in real application [38]. The Griess assay, as one of the most common alternatives to the colorimetric detection of nitrite, involves a diazo-coupling procedure under acidic conditions in the presence of nitrite and on a certain chromophore, by which the color of sensing system changes and subsequently nitrite detection is achieved [18,39]. For example, some reported a spectrophotometric sensor based on diazotization of p-nitrophenol (Griess assay) to quantitatively detect nitrite [40,41]. Although a satisfactory detection goal can be obtained using a UV-visible spectrometer, the relatively small conjugation degree of the diazonium salt of p-nitrophenol (absorbance at 400 to 500 nm) is hard to visualize by the naked eye. Recently, Noor et al. [42] presented a new optosensor for visual quantitation of nitrite by physically immobilizing safranine O (SO) reagent onto a self-adhesive poly(n-butyl acrylate) (poly(nBA)) microspheres matrix. The large conjugate structure of SO (purplish) was diazotized through the Griess assay and formed a blue diazonium salt compound, which produces an obvious color change from purplish to blue and subsequently can be easily identified using the naked eye. The possible incomplete diazotization reaction resulted in a relatively high linear nitrite concentration ranging from 10 to 100 ppm (0.22 to 2.17 mM) in the solid phase, which does not meet the requirements set by the WHO (65.22 μM) and EPA (21.74 μM) [43].
To improve the practicality of the sensing platform for nitrite detection in the real world, we present a simple and effective colorimetric sensing platform based on the Griess assay. As shown in Figure 1, commercially cost-efficient phenosafranin (serving as the acting site and signal reporter) with large conjugated structure (purple) can be diazotized to form a blue diazonium salt (DOS) by nitrite under acidic conditions in the presence of nitrite in aqueous solution. Thus, qualitative and quantitative detection of nitrite was achieved according to the changes in absorbance of the UV-visible spectrum. In addition, the sensing platform was able to detect nitrite spiked into ham sausage, bacon, and sprouts with remarkable recovery. The results demonstrated that the sensing platform as presented displays excellent sensitivity and is robust against disturbance, and is a promising candidate for nitrite analysis in real samples.
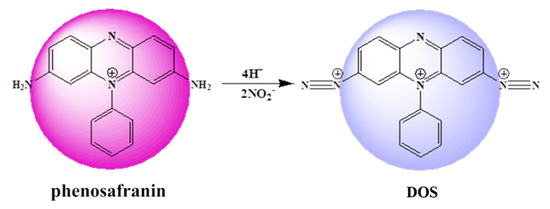
Figure 1.
Scheme of proposed sensing platform.
2. Experiment
2.1. Reagents and Chemicals
Phenosafranin (PS, 80%) and NaHSO3 were purchased from Aladdin Chemistry (Shanghai, China). NaHCO3 was obtained from Chongqing Inorganic Chemical Reagent Plant. Disodium hydrogen phosphate (Na2HPO4) and sodium hydroxide (NaOH) were bought from Tianjin Chemical Reagent Co. Ltd. (Tianjin, China). A standard stock solution of was prepared using NaNO2 with ultrapure water. Other stock solutions of anions at 15 mM were prepared in ultrapure water with the corresponding salts with different anions of NaHCO3, Na2SO4, Na2SO3, Na2S2O3·5H2O, Na2S2O5, Na2CO3, Na3PO4·12H2O, Na2HPO4·12H2O, NaH2PO4, CH3COONa, C6H5O7Na3·2H2O, NaF, NaCl, NaBr, NaI, NaNO3, NH4NO3, NH4Cl, KCl, MgCl2, CuCl2·2H2O, MnCl2·4H2O, KSCN, FeCl3, and FeCl2·4H2O. All the above-mentioned chemicals were purchased from Chengdu Kelong Chemical Reagent Factory (Chengdu, China) except where indicated. All the above-mentioned reagents were of analytical purity unless otherwise stated. All aqueous solutions were prepared with deionized (DI) water (18.25 MΩ cm) from a Millipore water system.
2.2. Instruments
The UV-Vis absorption spectra obtained were recorded by a TU-1901 double-beam UV-vis spectrophotometer (Peking General Instrument Co. Ltd. Beijing, China). Fourier-transform infrared spectroscopy (FT-IR) with Spectrum GX Infrared and Microscopy System (PerkinElmer, USA) were used to confirm the chemical structure change of phenosafranin.
2.3. Preparation of Stock Solutions
To form 1 M aqueous stock solution for further use, 6.90 g of NaNO2 was dissolved in 100 mL deionized water. We prepared 1 M HCl aqueous solution by diluting 9 mL concentrated hydrochloric acid (36%–39%) into 100 mL deionized water. All the inorganic salts aqueous solutions were obtained by diluting them into 100 mL deionized water to form 0.1 μM stock solutions. All these aqueous solutions with certain concentrations were acquired by diluting corresponding stock solutions.
2.4. Preparation of Real Samples
Sprouts, bacon, and ham sausages bought from the local supermarket were selected as real samples for modeling the real world application of the proposed sensing platform. Pretreatment of these samples was performed according to the GB 5009.33-2016 (determination of nitrite and nitrate in food). Five grams of sample (sprouts, bacon, and ham sausage) was cut up and put into a 250 mL conical flask loaded with 10 mL deionized water to form a homogenate. After that, 12.5 mL saturated borax solution (50 g/L) and 150 mL hot deionized water (70 ℃) were added into the conical flask and incubated boiling water for 15 min. Then, the conical flask was taken out and cooled to room temperature. The extracting solution was transferred to 200 mL volumetric flask and added with 5 mL potassium ferricyanide aqueous solution (106 g/L). After shaking up, 5 mL zinc acetate solution (220 g/L) was added to precipitate the protein. Subsequently, deionized water was added into the volumetric flask to a total volume of 200 mL and allowed to stand for 30 min. Residuals were removed by filtering the stock solution was acquired. Finally, real samples were obtained after stock solution spiking with various concentrations of .
2.5. Measurement Procedure
The analytical performance of phenosafranin toward was investigated at room temperature. Briefly, the phenosafranin solution (0.5 mL, 0.25 mM) was mixed with HCl aqueous solution (2 mL, 0.4 M) and loaded into a 5 mL centrifuge tube, followed by adding 1 mL in certain concentrations and incubating for 15 min. Finally, the UV-visible spectra of the mixture were recorded.
3. Results and Discussion
3.1. Sensing Mechanism
The mechanism of the phenosafranin-based colorimetric-sensing platform is shown in Figure 1 and Figure 2. HCl was employed since the Griess assay occurs under acidic conditions. As shown in Figure 2, the UV-visible absorbance spectrum of phenosafranin was dominated by a single intense peak at 538 nm. No obvious change was observed for absorbance spectra of phenosafranin after incubation with HCl, indicating no influence of HCl on the color change of phenosafranin. Upon addition of at a concentration of 14 μM into phenosafranin solution with the presence of HCl, the strong absorbance peak at 538 nm receded and broadened, accompanied by a slight bathochromic shift (Figure 2), which can be ascribed to the diazotization of phenosafranin in agreement with a previous report [42]. As displayed in Figure 1, diazotization of increases the conjugation degree of phenosafranin, resulting in the bathochromic shift of the absorbance peak. The color change of sensing system from red to blue can be clearly verified by the photo images in the inset of Figure 2. In order to demonstrate the chemical structure change, the DOS sample was first obtained by complete reaction between high concentration phenosafranin aqueous solutions with excess sodium nitrite under acidic conditions. Figure 3 shows the FT-IR spectra of phenosafranin and DOS in the wavenumber ranging from 2000 to 4000 cm−1. Two well-defined peaks at 3320.0 and 3185.0 cm−1 of phenosafranin are attributed to stretching vibration of amino group. After complete reaction with excessive , the stretching vibration of amino group disappeared, suggesting the formation of diazonium salts DOS. Thus, colorimetric detection of based on phenosafranin under acidic conditions through the Griess assay could be achieved.
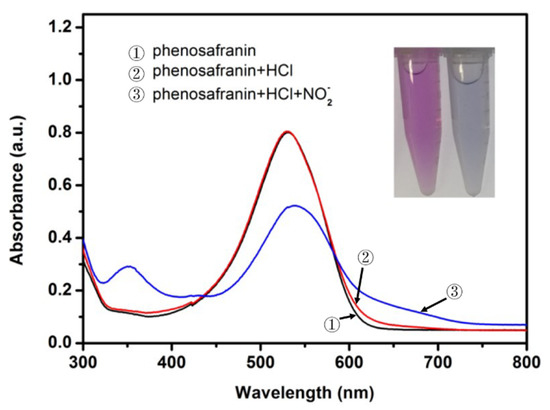
Figure 2.
UV-visible spectra of phenosafranin (0.25 mM) before and after incubation with (10 μM) under acidic condition (HCl of 0.4 M) (inset: corresponding photo image with (right) and without (left) ).
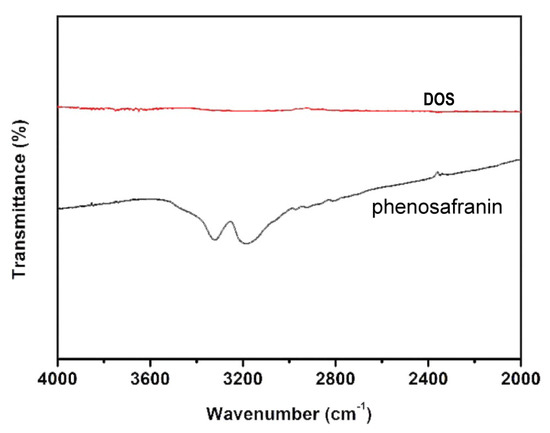
Figure 3.
Fourier-transform infrared spectroscopy (FT-IR) spectra of phenosafranin and DOS.
3.2. Optimization of Detection Conditions
In order to obtain an improved colorimetric response, the influence of concentrations of phenosafranin and HCl and incubation time were studied. As a sensing element and signal producer, a higher concentration of phenosafranin enables a more efficient diazotization reaction. However, quantitative detection is affected by the exorbitant concentration of phenosafranin due to the deviation from Lambert’s law. Additionally, a deep background disturbance influences the judgment on the color change of the sensing platform, extremely in the case of trace sensing. Therefore, appropriate concentration is important for the fabricated sensing platform. Figure 4A displays the absorbance spectra of phenosafranin at five concentrations. Taking these considerations into account, 0.25 mM phenosafranin was used for further studies. After optimization of phenosafranin concentration, the effect of concentration of HCl was also investigated. As shown in Figure 4B, the changes in the absorbance of phenosafranin (ΔA) at 532 nm increased with increasing HCl addition until it reached a maximum at a HCl concentration of 0.4 M and concentration of 14 μM, suggesting that HCl facilitates the diazotization of phenosafranin. At high HCl concentration (>0.4 M), ΔA decreased gradually with the increase in concentration of HCl, which may be contributed by the protonation of amidogen, being detrimental to diazotization [44]. Thus, we selected the HCl concentration of 0.4 M as optimal for conducting subsequent studies. Additionally, the influence of incubation time on detection even with large concentration (20 μM, to ensure the complete reaction time we can obtain) was researched and the test results are presented in Figure 4C. After a 10-minute incubation, an intense ΔA was obtained. After 20 min of reaction time, the ΔA leveled off, indicating that the reaction reached saturation. Typically, the reaction time of 20 min was chosen as the optimal time for further tests. Generally, we used the optimized phenosafranin concentration of 0.25 mM, HCl concentration of 0.4 M, and reaction time of 20 as favorable detection conditions for the investigation of the analytical performance of the sensing platform for .
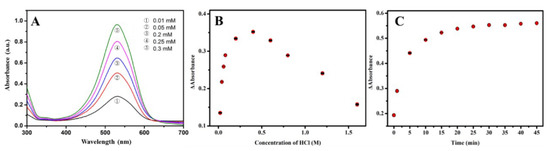
Figure 4.
Optimization of concentrations of (A) phenosafranin (0.01, 0.05, 0.2, 0.25, 0.3 mM), (B) HCl (0.025, 0.05, 0.075, 0.1, 0.2, 0.4, 0.6, 0.8, 1.2, 1.6 M), and (C) reaction time (0, 1, 5, 10, 15, 20, 25, 30, 35, 40, 45 min).
3.3. The Sensitivity of Colorimetric Sensing Platform
Under optimized detection condition, the sensitivity of the colorimetric sensor for was investigated and the test results are displayed in Figure 5. The UV-visible spectra, in the range from 300 to 750 nm of 0.25 mM phenosafranin in the presence of with various concentrations, are recorded in Figure 5A. Well-defined UV-visible absorbance peaks were obtained after incubation with in different concentrations. The absorbance peaks intensities decreased at 532 nm gradually with increasing concentrations ranging from 0 to 100 μM, accompanied by gradually increasing bathochromic shift. New stepped-up peaks at 350 nm arose with increasing concentrations. Figure 5B shows the ΔA at 532 nm with the addition of different concentrations of . When increasing concentrations, ΔA increased accordingly. A well-defined linear relationship (R2 = 0.9977) between ΔA with ranging from 0 to 20 μM was obtained. The detection limit was calculated to be 0.22 μM (3S/N), which is much lower than the MCL of nitrite in drinking water set by the EPA and the WHO. Notably, satisfactory sensitivity and linear relationship range were acquired compared with the previously reported colorimetric sensing platform listed in Table 1, which are attributed to the large conjugated structure of phenosafranin and its highly reactive diazotization reaction. The low cost and ease of operation of this colorimetric sensing platform enable its widespread use. The test results demonstrated the potential feasibility of the sensing platform for the quantitative detection of within the requirements given by the EPA and WHO.
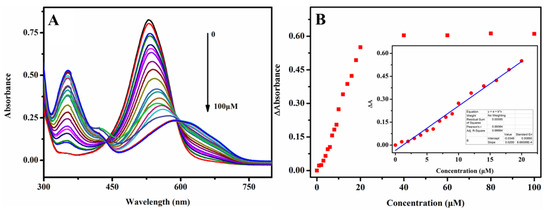
Figure 5.
(A) UV spectra of phenosafranin (0.25 mM) at HCl concentration of 0.4 M versus with various concentrations from 0 to 100 μM and (B) corresponding ΔA at 532 nm of the sensing system at respective concentrations; (inset B: linear relationship between ΔA and concentrations ranging from 0 to 20 μM).

Table 1.
Comparison of the analytical performance of previously reported colorimetric sensors with this work.
3.4. Interferences Study
We conducted an interferences study to verify the selectivity of the colorimetric sensing platform. We selected 27 potential co-existing organic salts or alkali as interference chemicals to be tested. As shown in Figure 6, ΔA at 532 nm of the sensing platform after reaction with different substances (350 μM Na2SO4, NaHSO3, Na2S2O3, Na2SO3, Na2S2O5, Na2CO3, NaHCO3, Na3PO4, Na2HPO4, NaH2PO4, CH3COONa, C6H5O7Na3, NaOH, NaF, NaCl, NaBr, NaI, NaNO3, NH4Cl, NH4NO3, KCl, KSCN, CuCl2, MgCl2, FeCl2, FeCl3, and MnCl2) under optimal conditions were recorded, suggesting little influence on the sensing platform from these interferences. In contrast, ΔA (absorbance change) at 532 nm of the as-presented sensing platform after incubation with 35 μM of NaNO2 under the same detection conditions significantly increased, indicating a good selectivity of this sensing platform toward . The selectivity of the sensing platform was assigned to the diazotization reaction of phenosafranin with . The results indicated that the colorimetric sensing platform presented here has a good anti-disturbance ability.
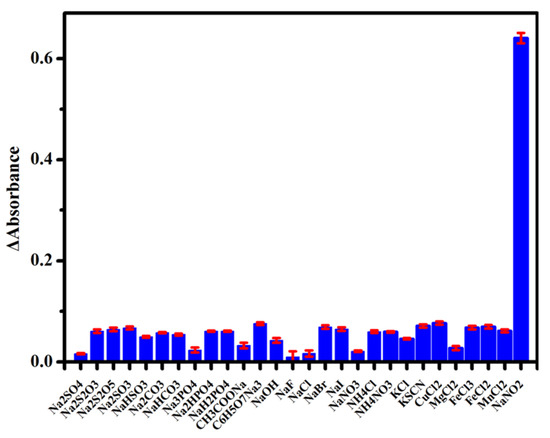
Figure 6.
ΔA at 532 nm of the sensing platform for NaNO2 (35 μM) and other analytes (350 μM).
3.5. Reproducibility Study
To evaluate the stability, we recorded ΔA at 532 nm for the sensing platform upon incubation with 35 μM NaNO2 under the optimized detection conditions. Ten batches with six replicates for one batch were tested and the results are shown in Figure 7. An excellent reproducibility (relative standard deviation (RSD) = 1.59%) of the colorimetric sensing platform was obtained.
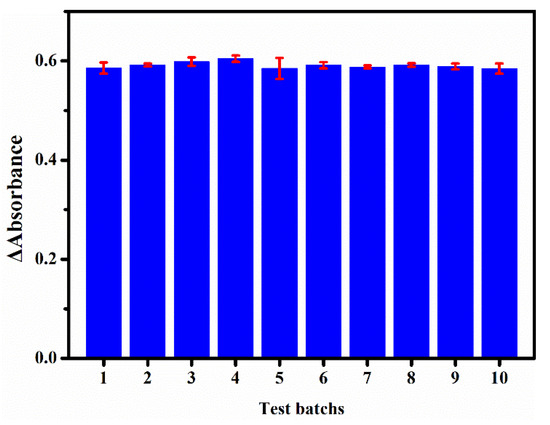
Figure 7.
ΔA at 532 nm for the sensing platform for 10 batches of tests (35 μM of NaNO2) at different times.
3.6. The Practicability of the Colorimetric Sensing Platform
Various concentrations of spiked ham sausage, bacon, and sprouts samples (real sample pretreatment procedure was described in Preparation of real samples) were tested to evaluate the practicability of the colorimetric sensing platform. The ΔA at 532 nm of ham sausage, bacon, and sprouts samples spiked with were recoded to calculate the recoveries (Table 2). The detection results matched well with the accurate concentration for nearly all cases spiked with 0, 10, and 20 μM of , demonstrating the good practicability of the colorimetric sensing platform. The recoveries acquired were calculated to range from 94.63% to 109.94%, with favorable reproducibility (RSD < 2%). These results suggested that the colorimetric sensing platform displays the potential for trace detection in real applications.
Table 2.
Detection of in spiked ham sausage, bacon, and sprouts samples.
4. Conclusions
We presented a simple and effective colorimetric sensing platform based on the diazotization of phenosafranin for the detection of under acidic conditions using the Griess assay. Commercial phenosafranin served as both acting site and signal producer. The color of phenosafranin changed from purplish to blue upon addition of , enabling colorimetric sensing to achieve quantitative detection of . A satisfactory sensitivity and favorable linearity were obtained under the optimal detection conditions. Interferences and reproducibility studies were conducted verify the selectivity and stability of the sensing platform. The testing of spiked real samples (ham sausage, bacon, and sprouts) confirmed its excellent practicability. All the results suggested the presented colorimetric sensing platform is a promising strategy for analysis in real applications.
Author Contributions
J.H. and H.W. consulted the literature, conducted the experiments, charted production, and initiated the writing of the manuscript; these two authors made equal contributions to this work. X.S. and C.Z. discussed the results and revised the manuscript. Q.H. and D.H. conceived and developed the data analysis methods. C.H. took part in data analysis and revision of the manuscript. D.H. managed the project and also finalized the manuscript. All authors have read and agreed to the published version of the manuscript.
Funding
This work was supported by the Fundamental Research Funds for the Central University (2018CDYJSY0055), Solid-State Fermentation Resource Utilization Key Laboratory of Sichuan Province (No. 2018GTJ010), the National Natural Science Foundation of China Chongqing Science and Technology Commission (CSTC2018jcyjAX0062), Brew Microorganisms Technology and Application of Key Laboratory Project in Sichuan Province (No. NJ2018-01), Chongqing Graduate Tutor Team Construction Project, Analytical and Testing Center of Chongqing University for FT-IR characterization and the sharing fund of Chongqing University’s large equipment.
Conflicts of Interest
The authors declare no conflicts of interest.
References
- World Health Organization. The Selection and Use of Essential Medicines: World Health Organization Technical Report Series; World Health Organization: Geneva, Switzerland, 2011. [Google Scholar]
- Gomes, A.; Fernandes, E.; Lima, J.L. Use of fluorescence probes for detection of reactive nitrogen species: A review. J. Fluoresc. 2006, 16, 119–139. [Google Scholar] [CrossRef]
- Ghosh, A.; Das, P.; Saha, S.; Banerjee, T.; Bhatt, H.B.; Das, A. Diamine derivative of a ruthenium (II)-polypyridyl complex for chemodosimetric detection of nitrite ion in aqueous solution. Inorg. Chim. Acta 2011, 372, 115–119. [Google Scholar] [CrossRef]
- Møller, J.K.; Skibsted, L.H. Nitric oxide and myoglobins. Chem. Rev. 2002, 102, 1167–1178. [Google Scholar] [CrossRef] [PubMed]
- Carlsen, C.U.; Møller, J.K.; Skibsted, L.H. Heme-iron in lipid oxidation. Coord. Chem. Rev. 2005, 249, 485–498. [Google Scholar] [CrossRef]
- Chung, J.-C.; Chou, S.-S.; Hwang, D.-F. Changes in nitrate and nitrite content of four vegetables during storage at refrigerated and ambient temperatures. Food Addit. Contam. 2004, 21, 317–322. [Google Scholar] [CrossRef] [PubMed]
- Li, H.-q.; Han, H.-j. Nitrite accumulation performance of aerobic MBBR treating Lurgi coal gasification waste water by adjusting pollutant load and DO concentration. Environ. Technol. 2015, 36, 3210–3220. [Google Scholar] [CrossRef]
- Adarsh, N.; Shanmugasundaram, M.; Ramaiah, D. Efficient reaction based colorimetric probe for sensitive detection, quantification, and on-site analysis of nitrite ions in natural water resources. Anal. Chem. 2013, 85, 10008–10012. [Google Scholar] [CrossRef]
- Sebranek, J.G.; Bacus, J.N. Cured meat products without direct addition of nitrate or nitrite: What are the issues? Meat Sci. 2007, 77, 136–147. [Google Scholar] [CrossRef]
- Yetim, H.; Kayacier, A.; Kesmen, Z.; Sagdic, O. The effects of nitrite on the survival of Clostridium sporogenes and the autoxidation properties of the Kavurma. Meat Sci. 2006, 72, 206–210. [Google Scholar] [CrossRef]
- Salama, M.F.; Abbas, A.; Darweish, M.M.; El-Hawwary, A.A.; Al-Gayyar, M.M. Hepatoprotective effects of cod liver oil against sodium nitrite toxicity in rats. Pharm. Biol. 2013, 51, 1435–1443. [Google Scholar] [CrossRef]
- Froehlich, D.A.; Gullett, E.; Usborne, W. Effect of nitrite and salt on the color, flavor and overall acceptability of ham. J. Food Sci. 1983, 48, 152–154. [Google Scholar] [CrossRef]
- Jiao, S.; Jin, J.; Wang, L. One-pot preparation of Au-RGO/PDDA nanocomposites and their application for nitrite sensing. Sens. Actuators B Chem. 2015, 208, 36–42. [Google Scholar] [CrossRef]
- Xiao, N.; Yu, C. Rapid-response and highly sensitive noncross-linking colorimetric nitrite sensor using 4-aminothiophenol modified gold nanorods. Anal. Chem. 2010, 82, 3659–3663. [Google Scholar] [CrossRef] [PubMed]
- Chan, T.Y. Food-borne nitrates and nitrites as a cause of methemoglobinemia. Southeast Asian J. Trop. Med. Public Health 1996, 27, 189–192. [Google Scholar] [PubMed]
- Li, L.; Wang, P.; Xu, X.; Zhou, G. Influence of Various Cooking Methods on the Concentrations of Volatile N-Nitrosamines and Biogenic Amines in Dry-Cured Sausages. J. Food Sci. 2012, 77, C560–C565. [Google Scholar] [CrossRef] [PubMed]
- Brender, J.D.; Olive, J.M.; Felkner, M.; Suarez, L.; Marckwardt, W.; Hendricks, K.A. Dietary nitrites and nitrates, nitrosatable drugs, and neural tube defects. Epidemiology 2004, 15, 330–336. [Google Scholar] [CrossRef]
- Daniel, W.L.; Han, M.S.; Lee, J.-S.; Mirkin, C.A. Colorimetric nitrite and nitrate detection with gold nanoparticle probes and kinetic end points. J. Am. Chem. Soc. 2009, 131, 6362–6363. [Google Scholar] [CrossRef]
- Li, H.; Meininger, C.J.; Wu, G. Rapid determination of nitrite by reversed-phase high-performance liquid chromatography with fluorescence detection. J. Chromatogr. B Biomed. Sci. Appl. 2000, 746, 199–207. [Google Scholar] [CrossRef]
- Jedličková, V.; Paluch, Z.; Alušík, Š. Determination of nitrate and nitrite by high-performance liquid chromatography in human plasma. J. Chromatogr. B 2002, 780, 193–197. [Google Scholar] [CrossRef]
- Helaleh, M.I.; Korenaga, T. Ion chromatographic method for simultaneous determination of nitrate and nitrite in human saliva. J. Chromatogr. B Biomed. Sci. Appl. 2000, 744, 433–437. [Google Scholar] [CrossRef]
- Niedzielski, P.; Kurzyca, I.; Siepak, J. A new tool for inorganic nitrogen speciation study: Simultaneous determination of ammonium ion, nitrite and nitrate by ion chromatography with post-column ammonium derivatization by Nessler reagent and diode-array detection in rain water samples. Anal. Chim. Acta 2006, 577, 220–224. [Google Scholar] [CrossRef] [PubMed]
- Kage, S.; Kudo, K.; Ikeda, N. Simultaneous determination of nitrate and nitrite in human plasma by gas chromatography-mass spectrometry. J. Anal. Toxicol. 2002, 26, 320–324. [Google Scholar] [CrossRef] [PubMed][Green Version]
- Helmke, S.M.; Duncan, M.W. Measurement of the NO metabolites, nitrite and nitrate, in human biological fluids by GC–MS. J. Chromatogr. B 2007, 851, 83–92. [Google Scholar] [CrossRef] [PubMed]
- Stobiecka, M.; Hepel, M.; Radecki, J. Transient conformation changes of albumin adsorbed on gold piezoelectrodes. Electrochim. Acta 2005, 50, 4873–4887. [Google Scholar] [CrossRef]
- Welch, C.M.; Compton, R.G. The use of nanoparticles in electroanalysis: A review. Anal. Bioanal. Chem. 2006, 384, 601–619. [Google Scholar] [CrossRef]
- Zhu, N.; Xu, Q.; Li, S.; Gao, H. Electrochemical determination of nitrite based on poly (amidoamine) dendrimer-modified carbon nanotubes for nitrite oxidation. Electrochem. Commun. 2009, 11, 2308–2311. [Google Scholar] [CrossRef]
- Xue, W.; Hui, L.; Min, W.; Shu-Li, G.; Yan, Z.; Qing-Jiang, W.; Ping-Gang, H.; Yu-Zhi, F. Simultaneous electrochemical determination of sulphite and nitrite by a gold nanoparticle/graphene-chitosan modified electrode. Chin. J. Anal. Chem. 2013, 41, 1232–1237. [Google Scholar]
- Dong, Q.; Huang, Y.; Song, D.; Wu, H.; Cao, F.; Lei, Y. Dual functional rhodium oxide nanocorals enabled sensor for both non-enzymatic glucose and solid-state pH sensing. Biosens. Bioelectron. 2018, 112, 136–142. [Google Scholar] [CrossRef]
- Dong, Q.; Song, D.; Huang, Y.; Xu, Z.; Chapman, J.H.; Willis, W.S.; Li, B.; Lei, Y. High-temperature annealing enabled iridium oxide nanofibers for both non-enzymatic glucose and solid-state pH sensing. Electrochim. Acta 2018, 281, 117–126. [Google Scholar] [CrossRef]
- Mubarak, A.T.; Mohamed, A.A.; Fawy, K.F.; Al-Shihry, A.S. A novel kinetic determination of nitrite based on the perphenazine-bromate redox reaction. Microchim. Acta 2007, 157, 99–105. [Google Scholar] [CrossRef]
- Ensafi, A.A.; Amini, M. A highly selective optical sensor for catalytic determination of ultra-trace amounts of nitrite in water and foods based on brilliant cresyl blue as a sensing reagent. Sens. Actuators B Chem. 2010, 147, 61–66. [Google Scholar] [CrossRef]
- Lo, H.S.; Lo, K.W.; Yeung, C.F.; Wong, C.Y. Rapid visual and spectrophotometric nitrite detection by cyclometalated ruthenium complex. Anal. Chim. Acta 2017, 990, 135–140. [Google Scholar] [CrossRef] [PubMed]
- Ye, Y.; Guo, Y.; Yue, Y.; Zhang, Y. Facile colorimetric detection of nitrite based on anti-aggregation of gold nanoparticles. Anal. Methods 2015, 7, 4090–4096. [Google Scholar] [CrossRef]
- Zhang, X.X.; Song, Y.Z.; Fang, F.; Wu, Z.Y. Sensitive paper-based analytical device for fast colorimetric detection of nitrite with smartphone. Anal. Bioanal. Chem. 2018, 410, 2665–2669. [Google Scholar] [CrossRef] [PubMed]
- Ghasemi, J.; Jabbari, A.; Amini, A.; Oskoei, A.; Abdolahi, B. Kinetic spectrophotometric determination of nitrite based on its catalytic effect on the oxidation of methyl red by bromate. Anal. Lett. 2004, 37, 2205–2214. [Google Scholar] [CrossRef]
- Moldovan, Z. Kinetic spectrophotometric determination of nitrite with Tropaeolin 00-Bromate System. Anal. Lett. 2010, 43, 1344–1354. [Google Scholar] [CrossRef]
- Moorcroft, M.J.; Davis, J.; Compton, R.G. Detection and determination of nitrate and nitrite: A review. Talanta 2001, 54, 785–803. [Google Scholar] [CrossRef]
- Shinn, M.B. Colorimetric method for determination of nitrate. Ind. Eng. Chem. Anal. Ed. 1941, 13, 33–35. [Google Scholar] [CrossRef]
- Afkhami, A.; Masahi, S.; Bahram, M. Spectrophotometric determination of nitrite based on its reaction with p-nitroaniline in the presence of diphenylamine in micellar media. Bull. Korean Chem. Soc. 2004, 25, 1009–1011. [Google Scholar]
- Cherian, T.; Narayana, B. A new system for the spectrophotometric determination of trace amounts of nitrite in environmental samples. J. Braz. Chem. Soc. 2006, 17, 577–581. [Google Scholar] [CrossRef]
- Noor, N.S.M.; Tan, L.L.; Heng, L.Y.; Chong, K.F.; Tajuddin, S.N. Acrylic microspheres-based optosensor for visual detection of nitrite. Food Chem. 2016, 207, 132–138. [Google Scholar] [CrossRef] [PubMed]
- Chen, J.; Pang, S.; He, L.; Nugen, S.R. Highly sensitive and selective detection of nitrite ions using Fe3O4@SiO2/Au magnetic nanoparticles by surface-enhanced Raman spectroscopy. Biosens. Bioelectron. 2016, 85, 726–733. [Google Scholar] [CrossRef] [PubMed]
- Tsikas, D. Analysis of nitrite and nitrate in biological fluids by assays based on the Griess reaction: Appraisal of the Griess reaction in the L-arginine/nitric oxide area of research. J. Chromatogr. B 2007, 851, 51–70. [Google Scholar] [CrossRef] [PubMed]
© 2020 by the authors. Licensee MDPI, Basel, Switzerland. This article is an open access article distributed under the terms and conditions of the Creative Commons Attribution (CC BY) license (http://creativecommons.org/licenses/by/4.0/).