Love Wave Sensors with Silver Modified Polypyrrole Nanoparticles for VOCs Monitoring

 , ,
, , 
Abstract
1. Introduction
2. Materials and Methods
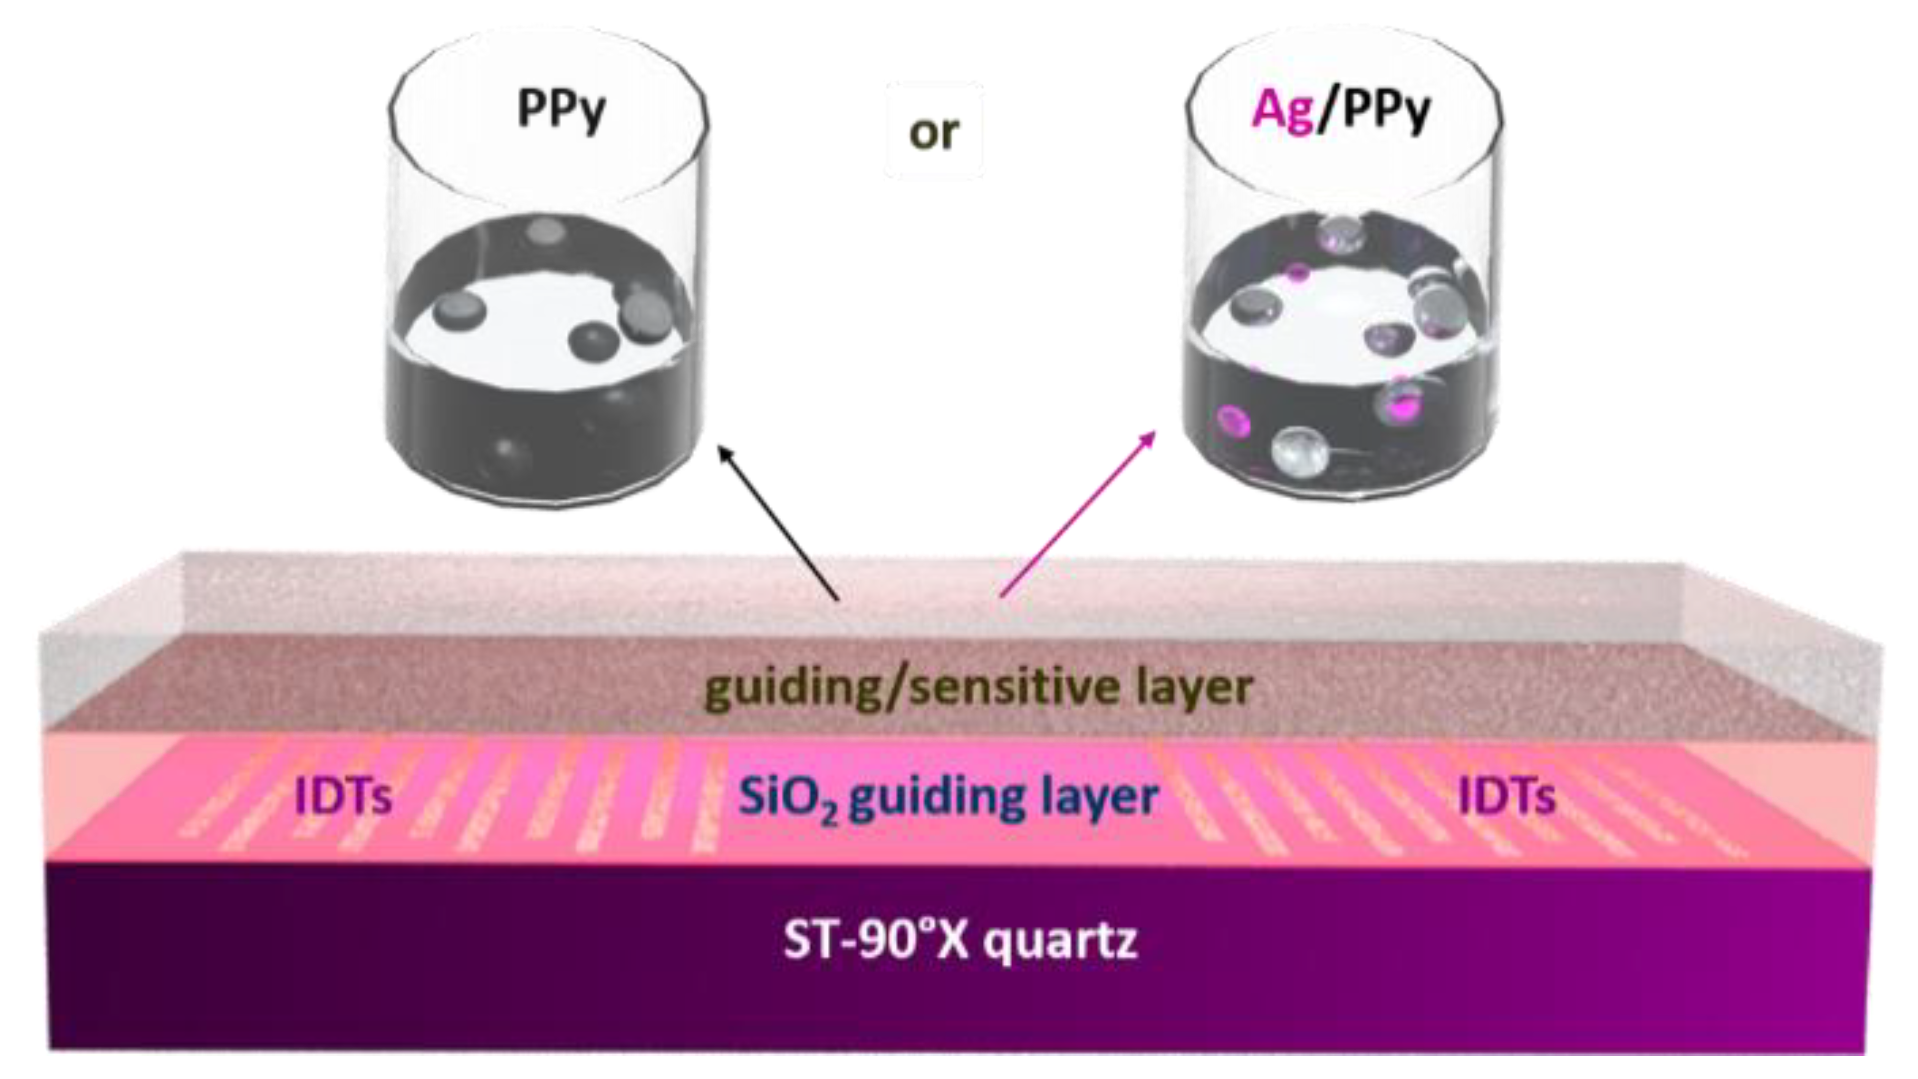
2.1. L-SAW Sensor
2.2. Gas Sensing Test
3. Results
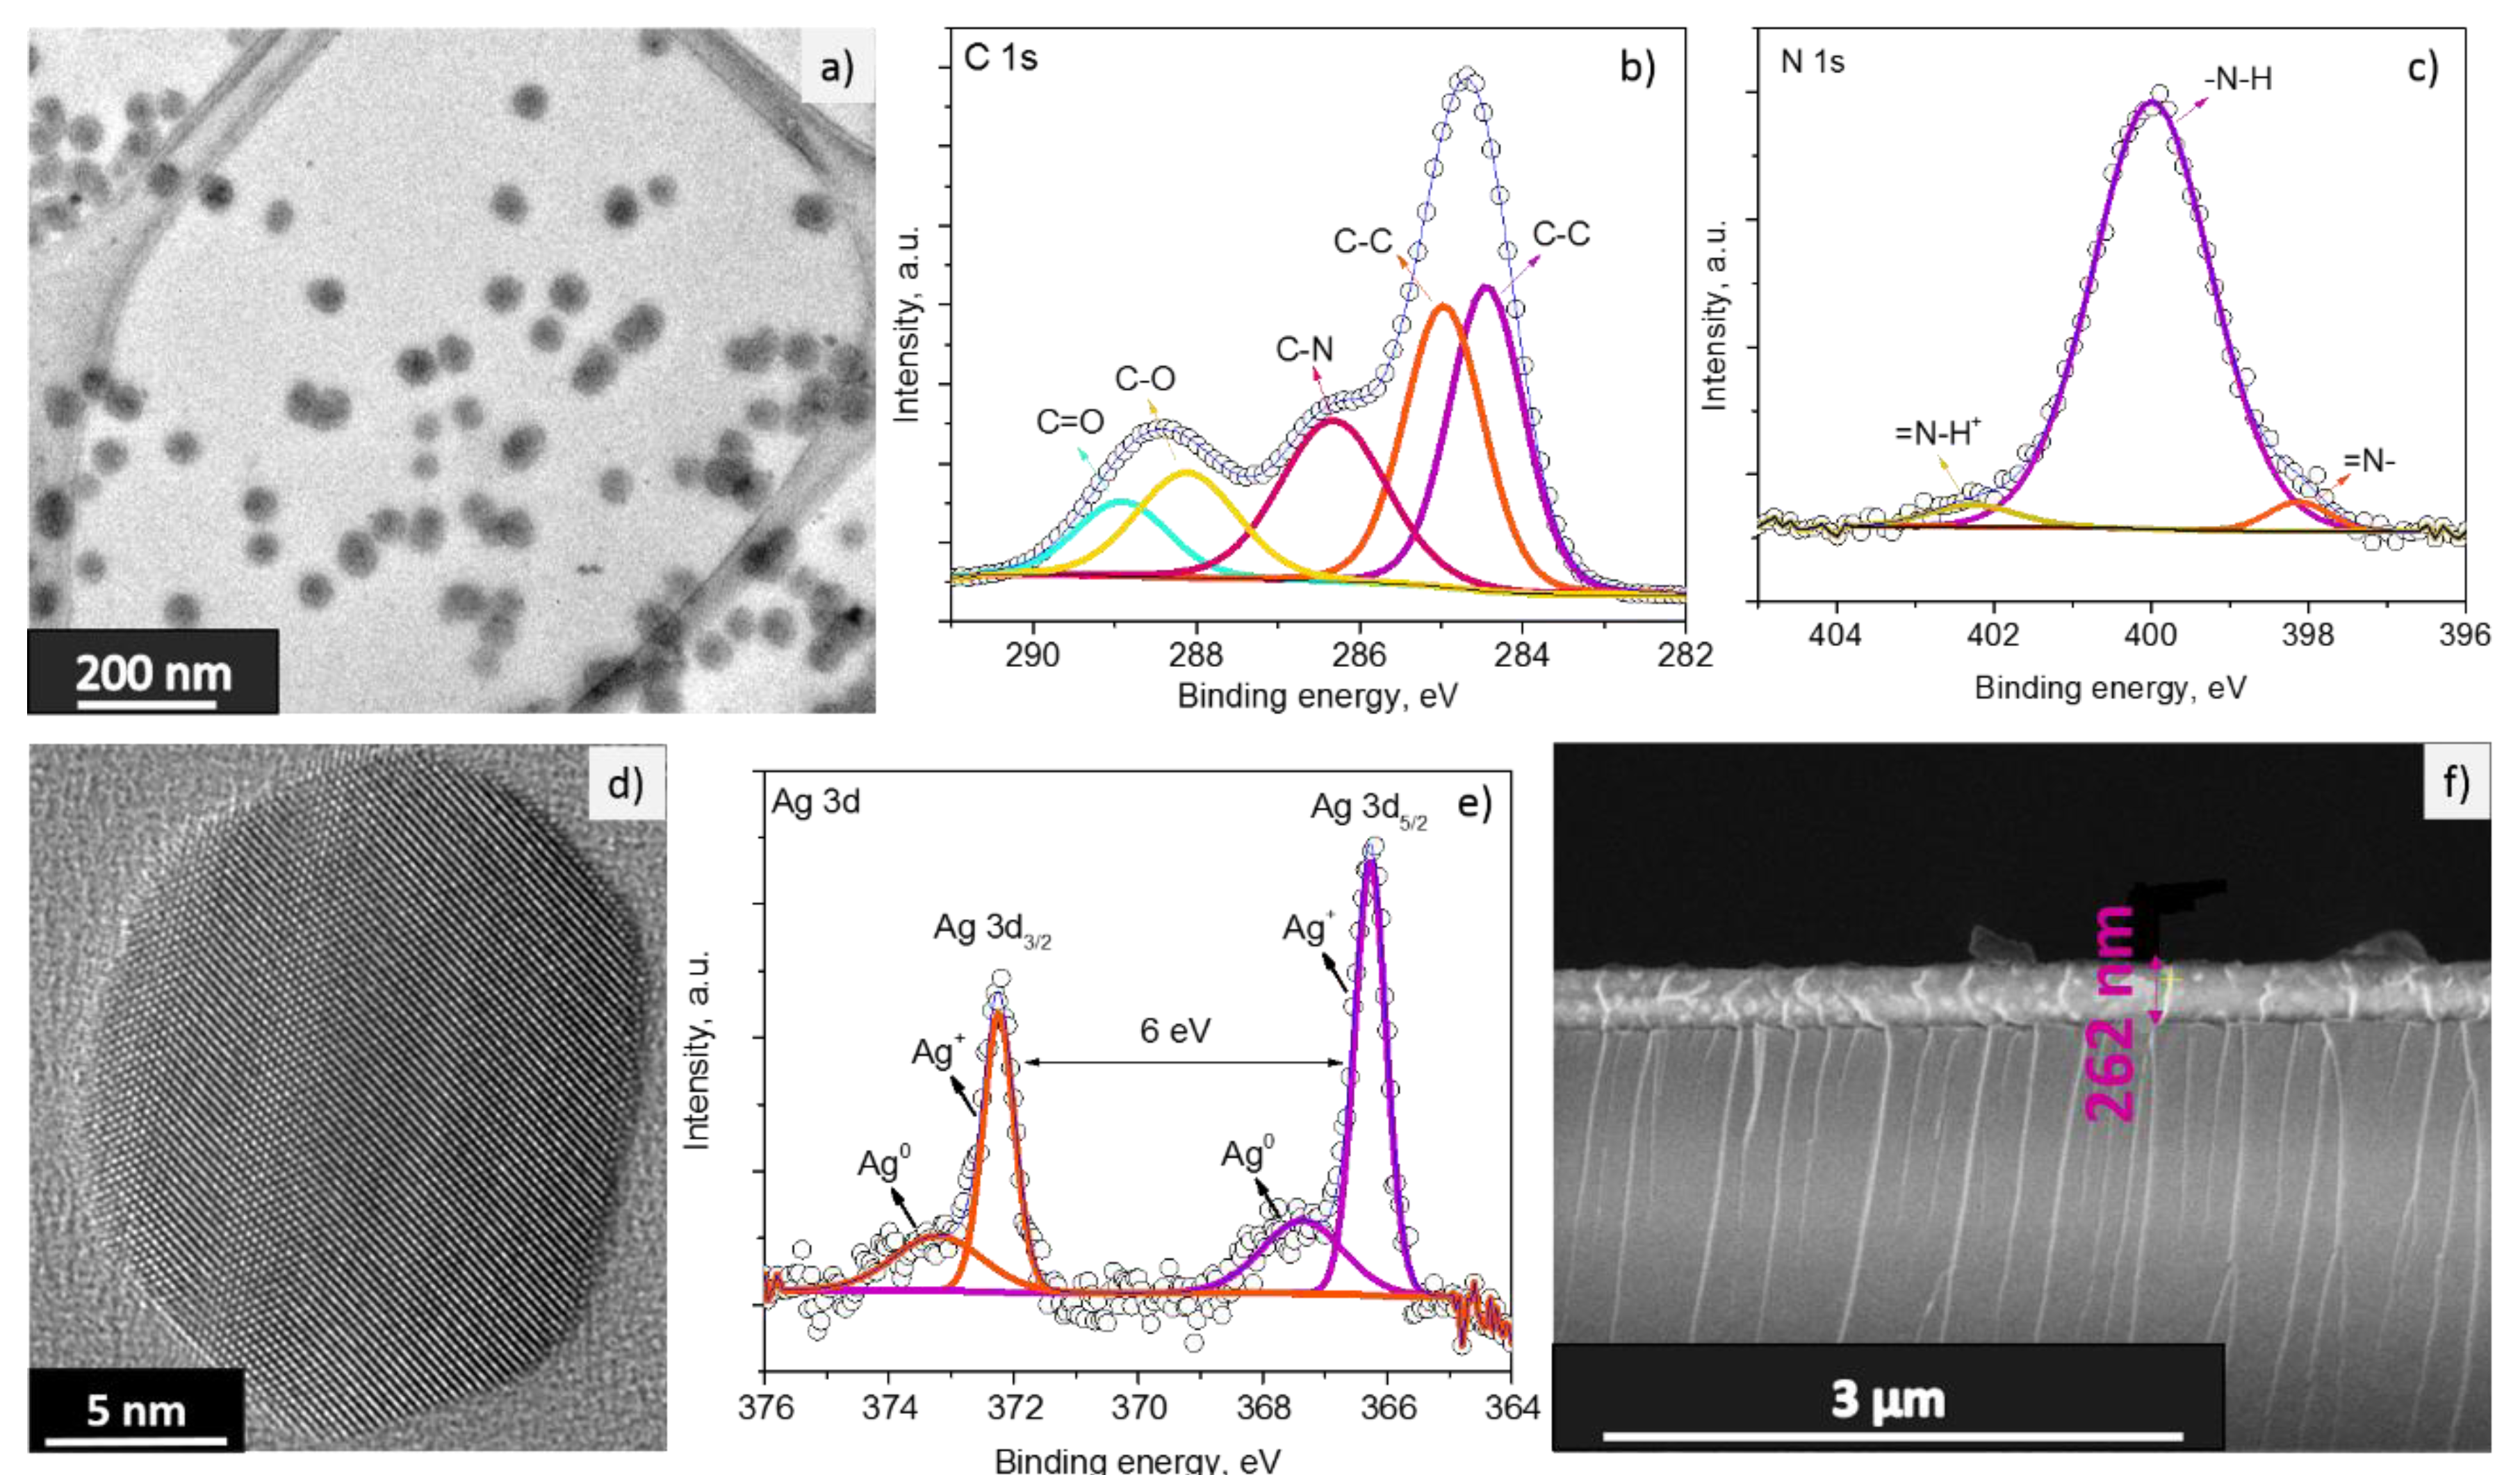
3.1. Gas Sensitive Material Properties
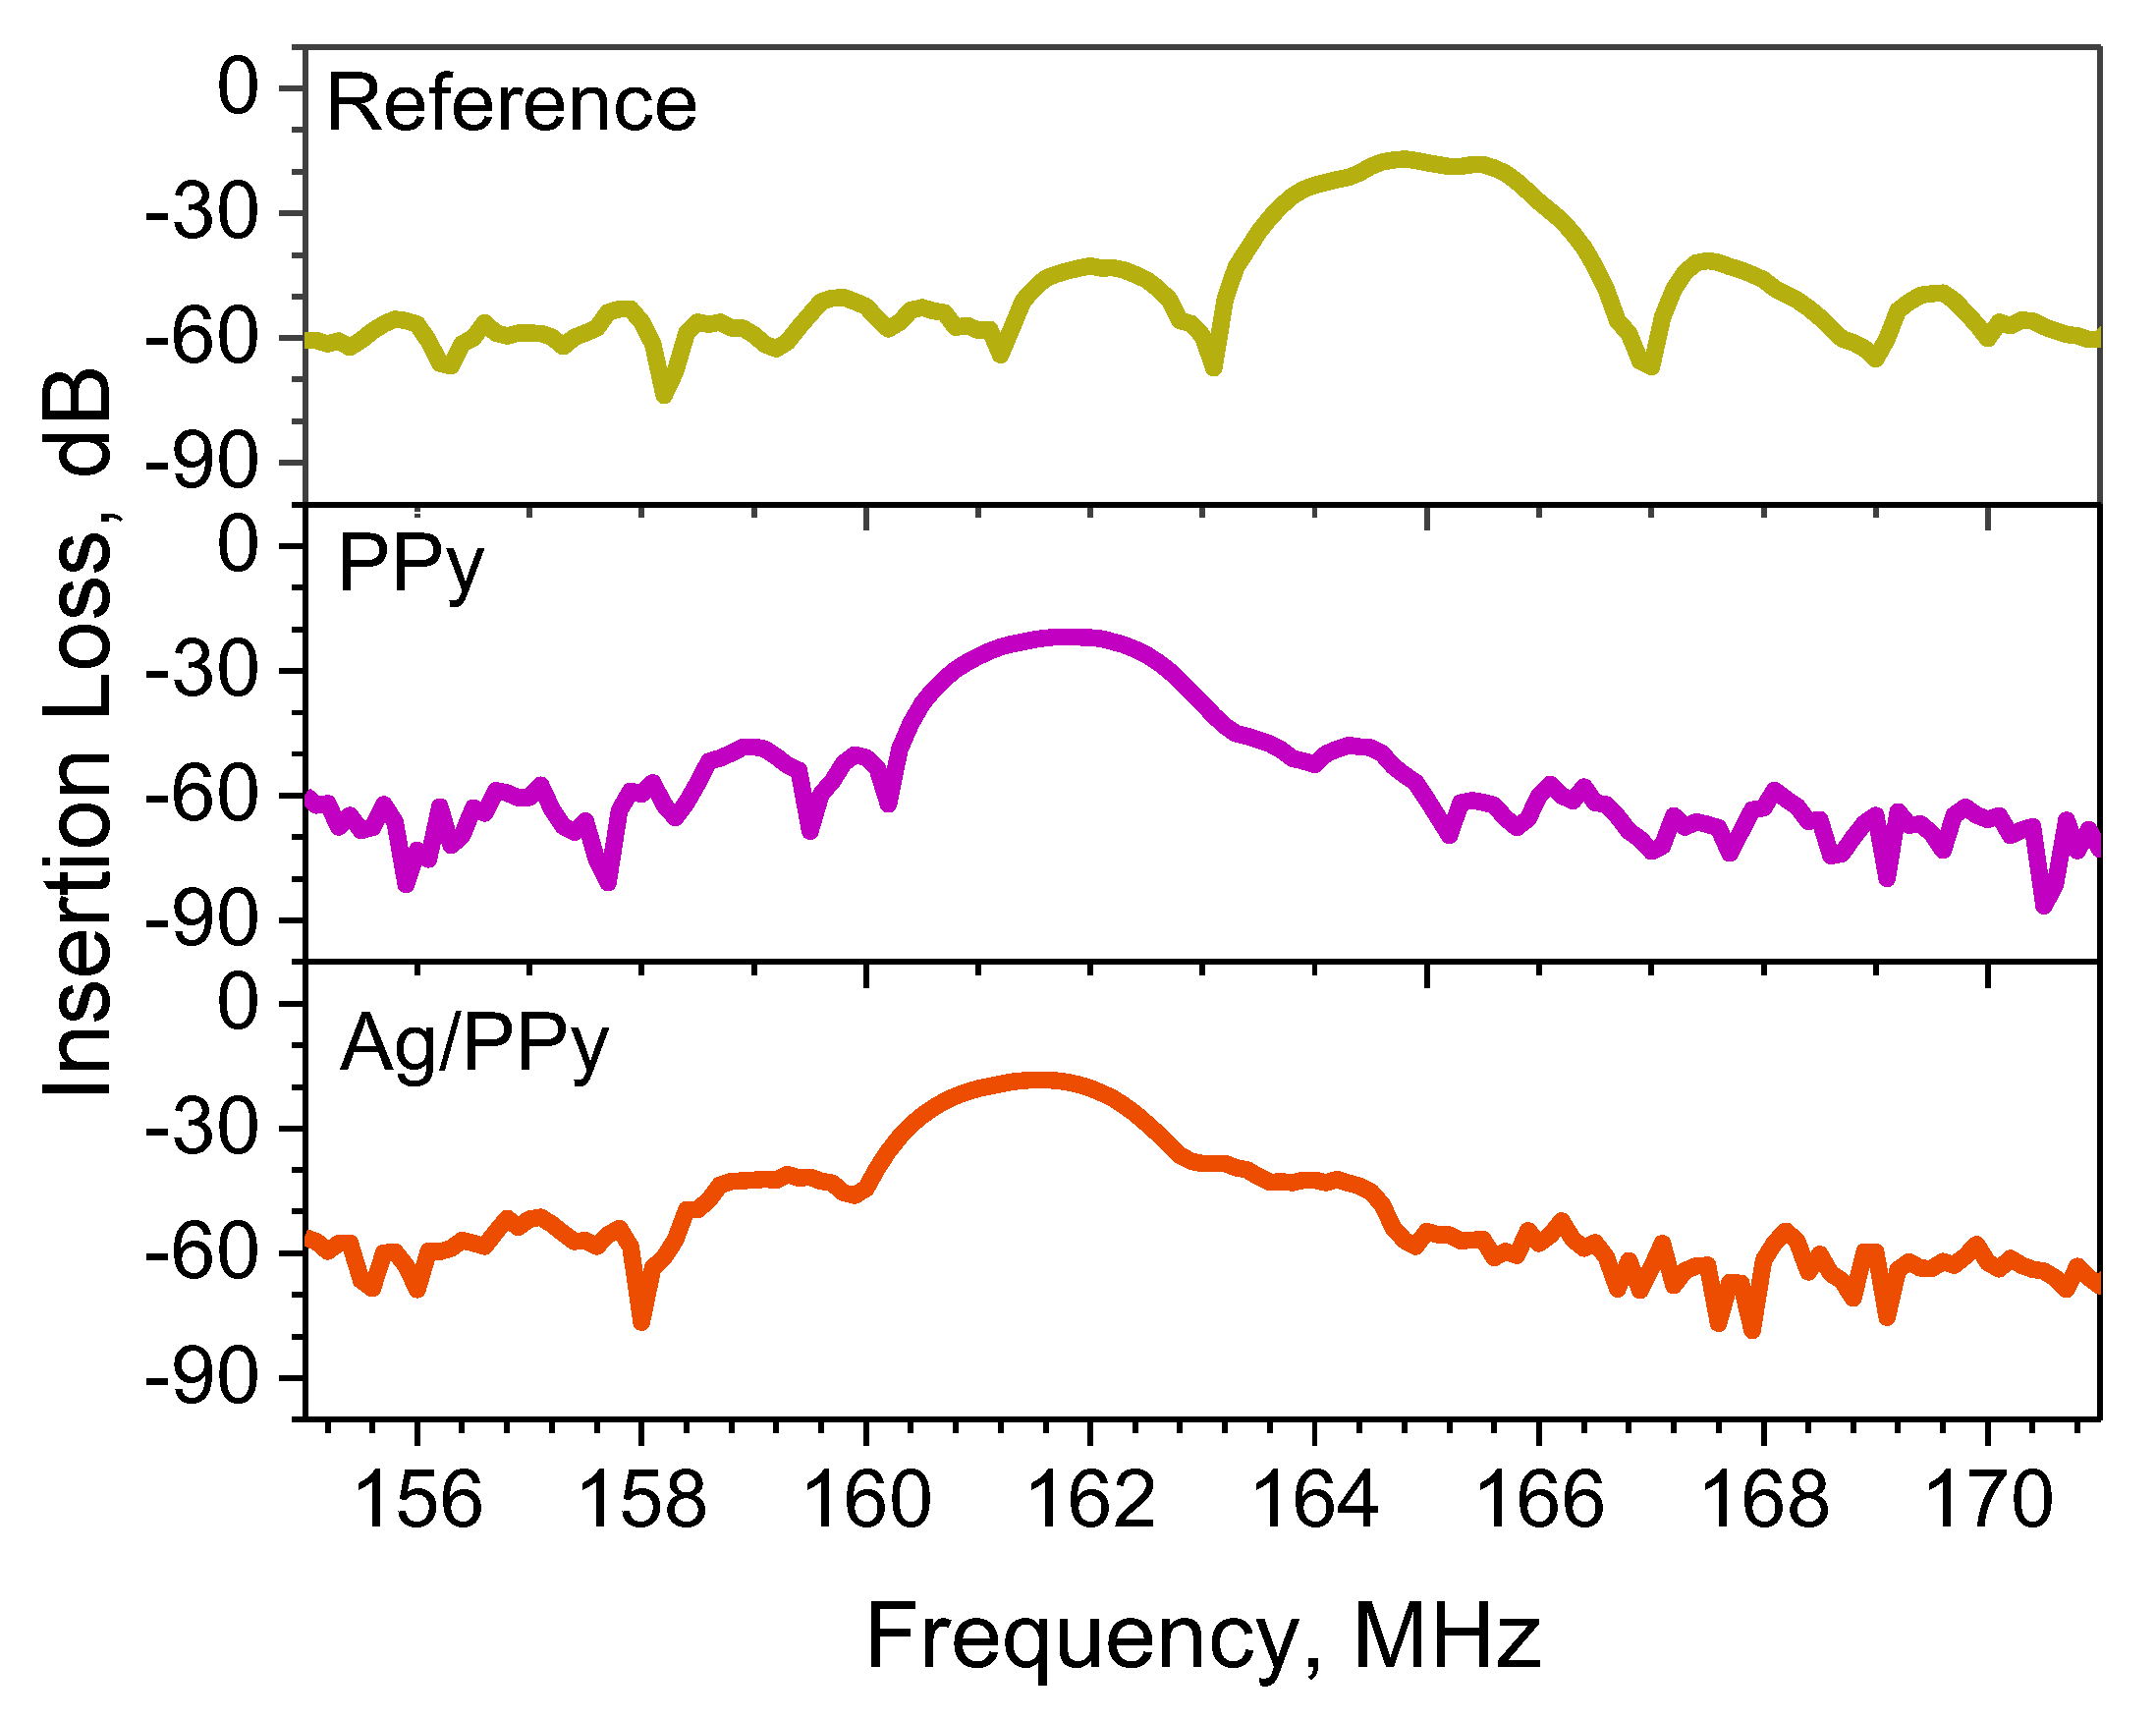
3.2. Electrical Characterization of the L-SAW Sensors
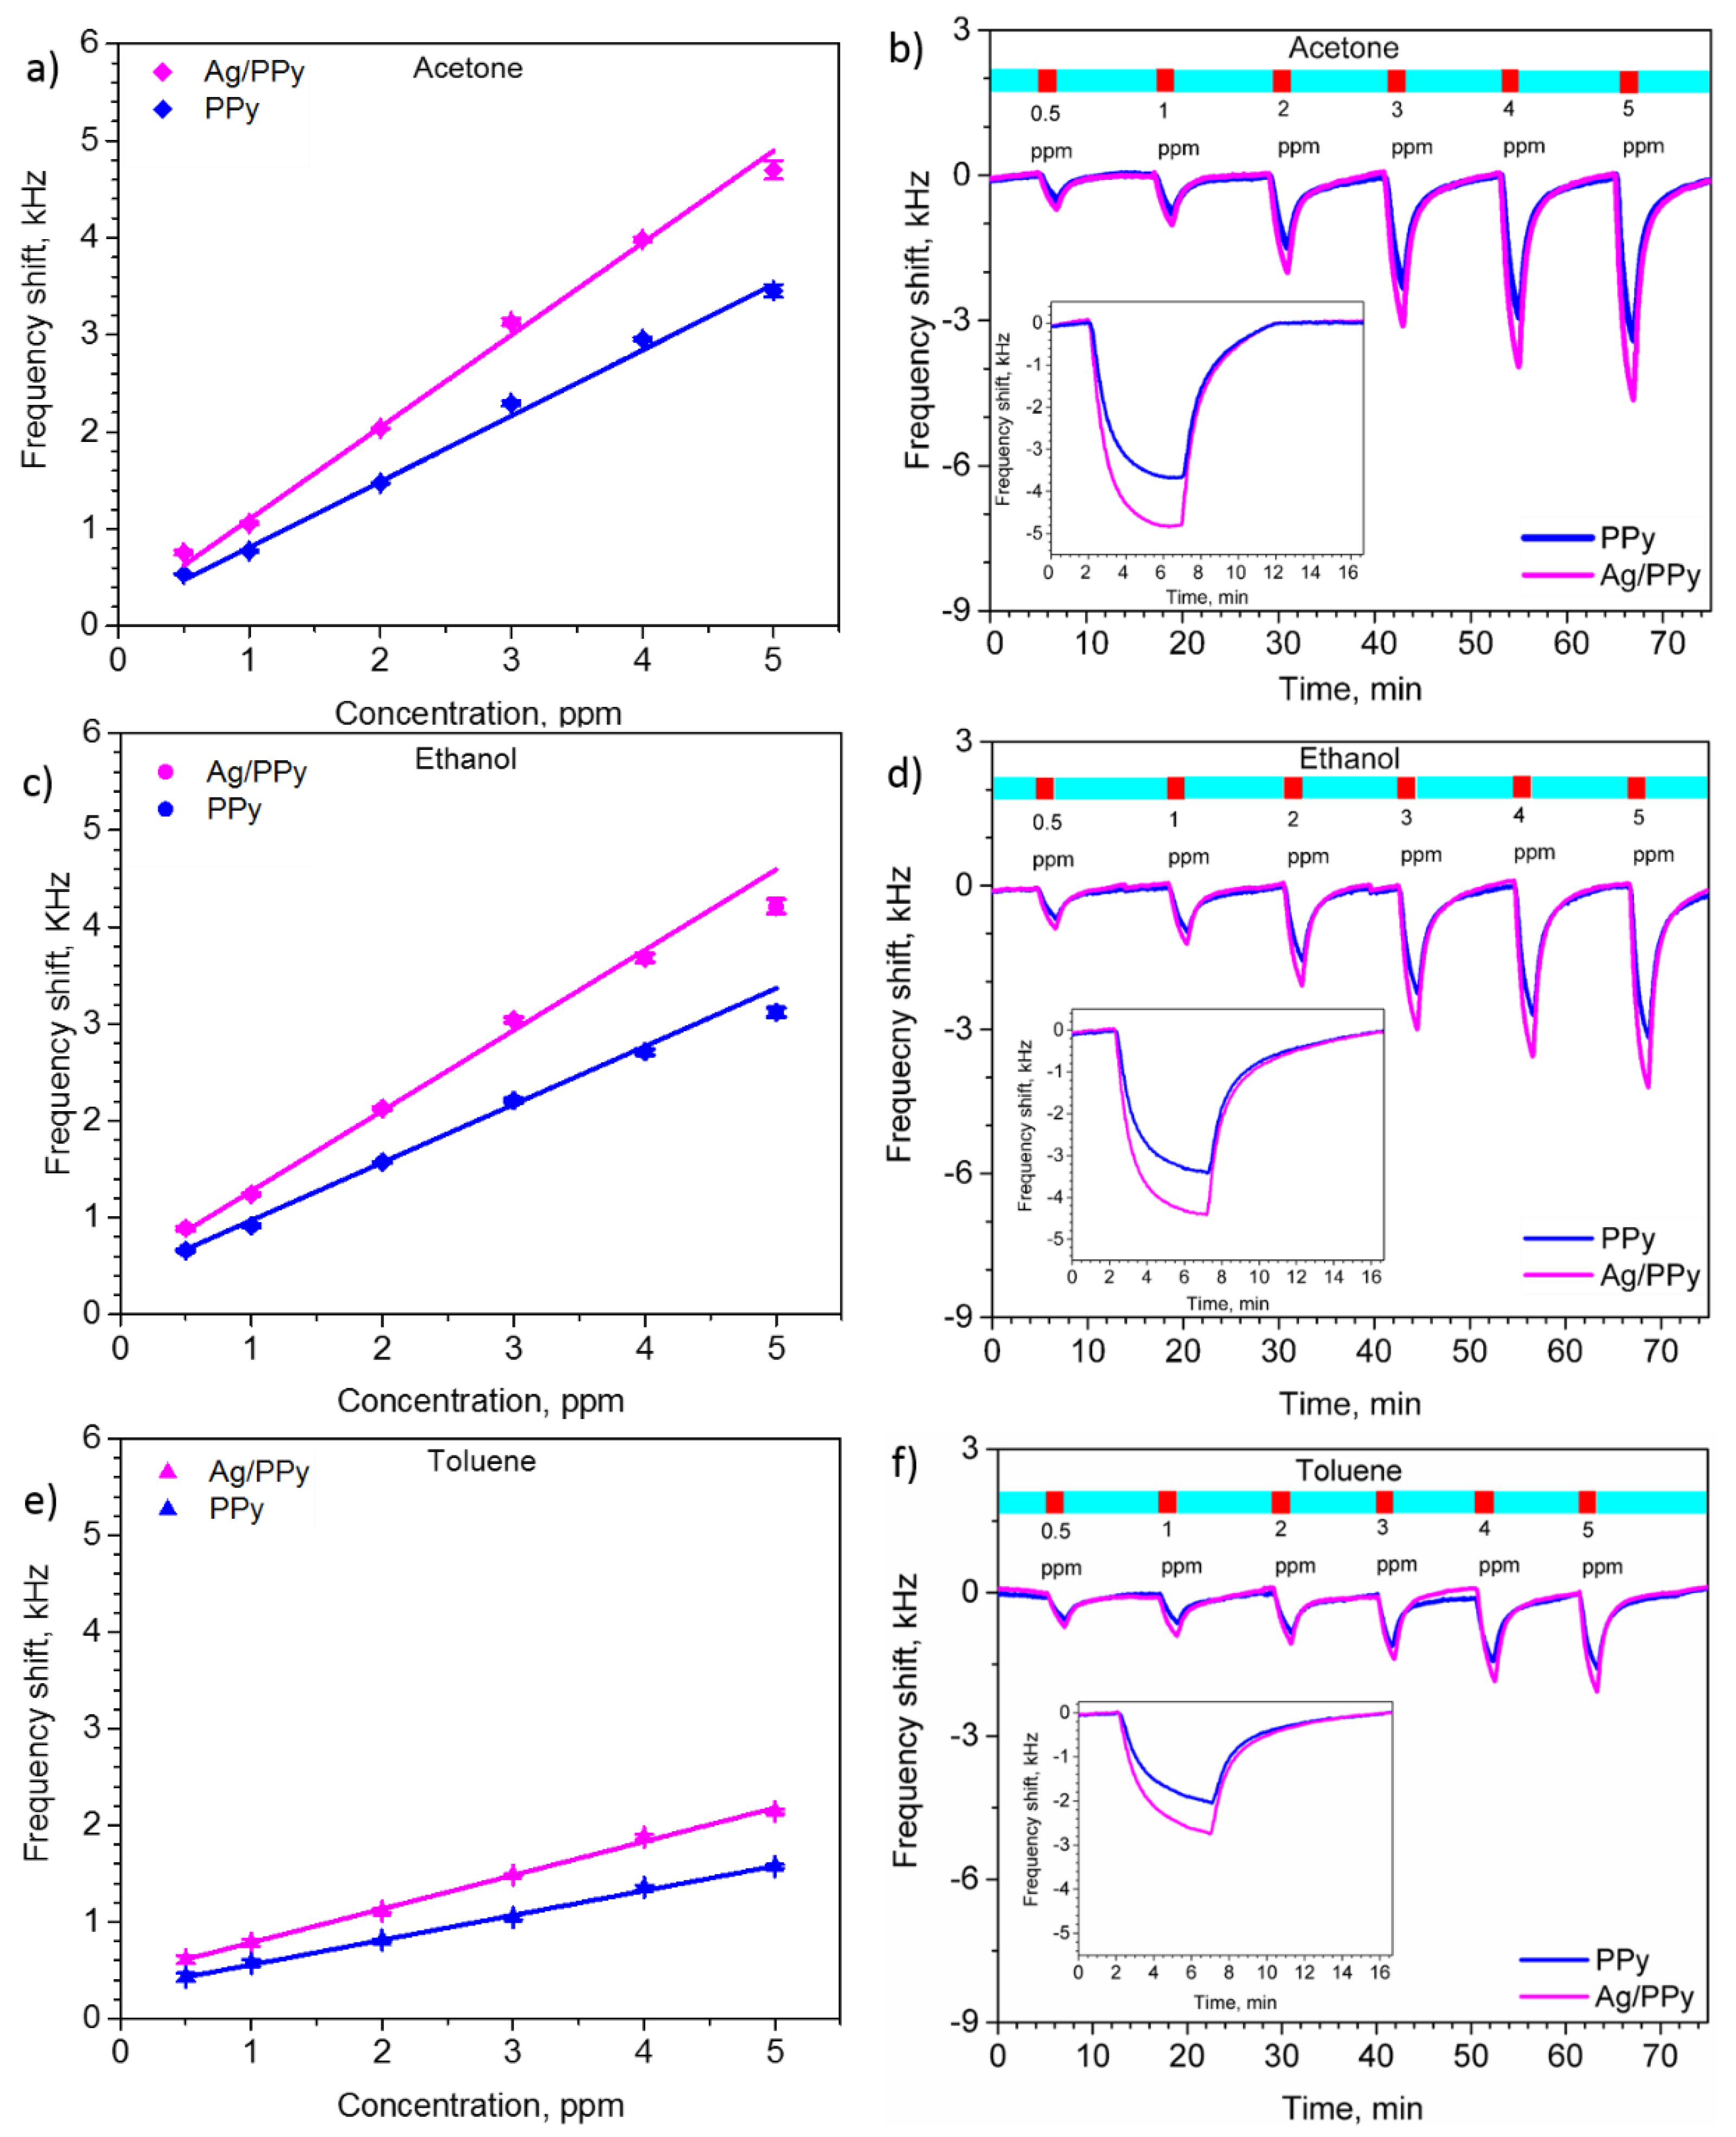
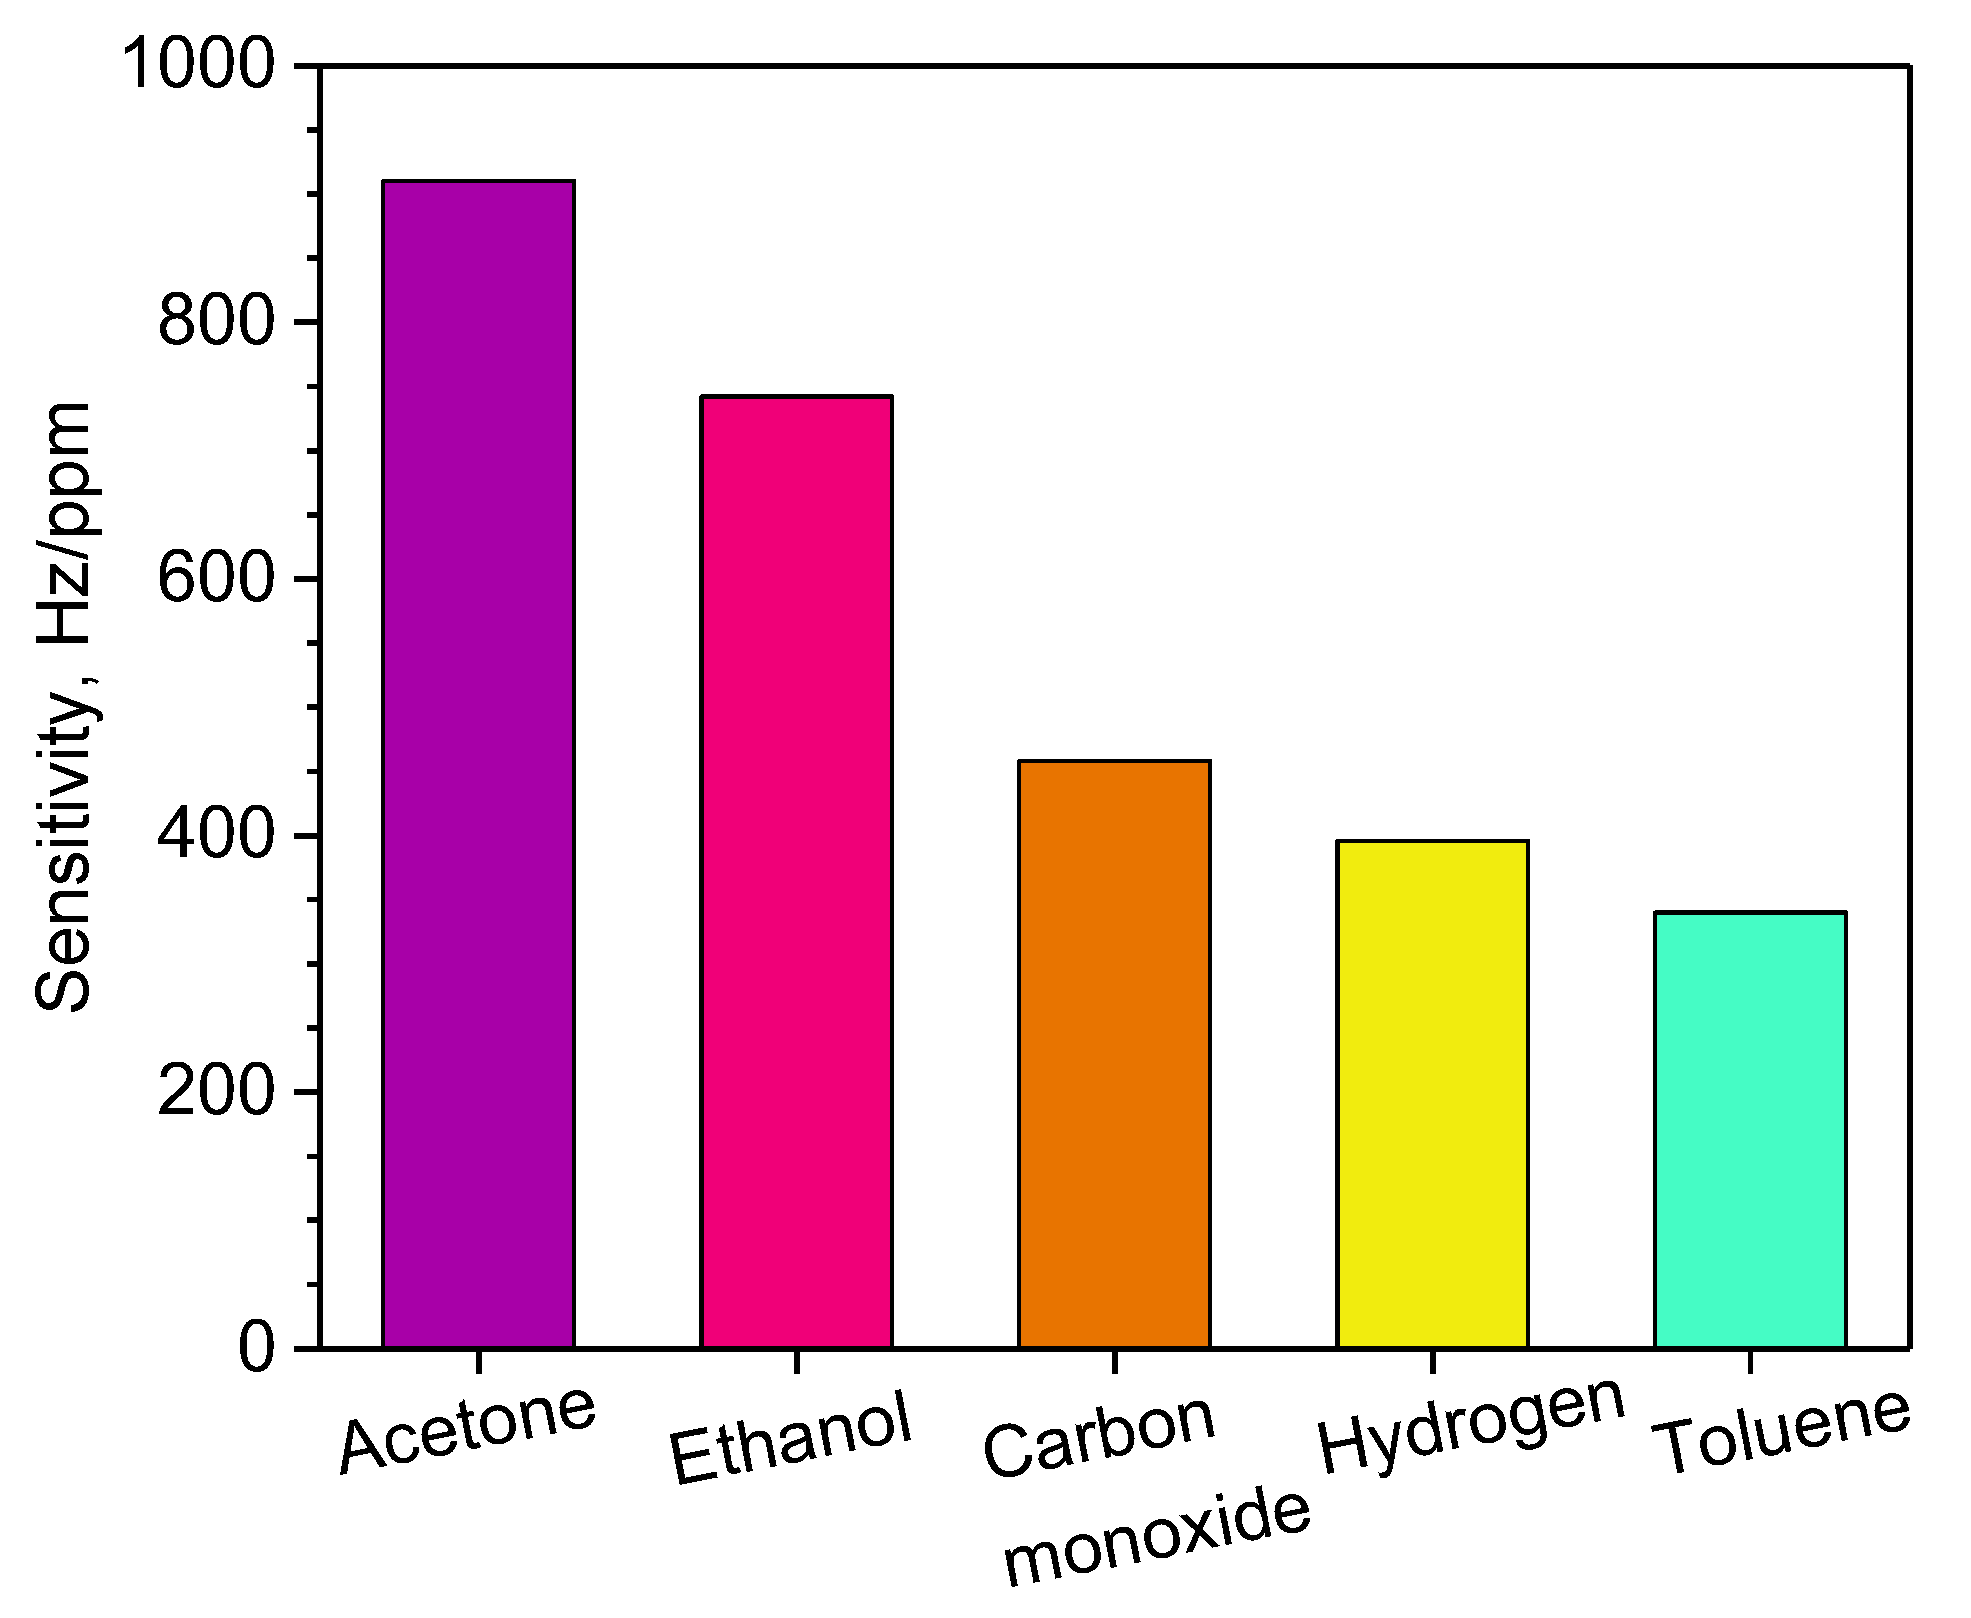
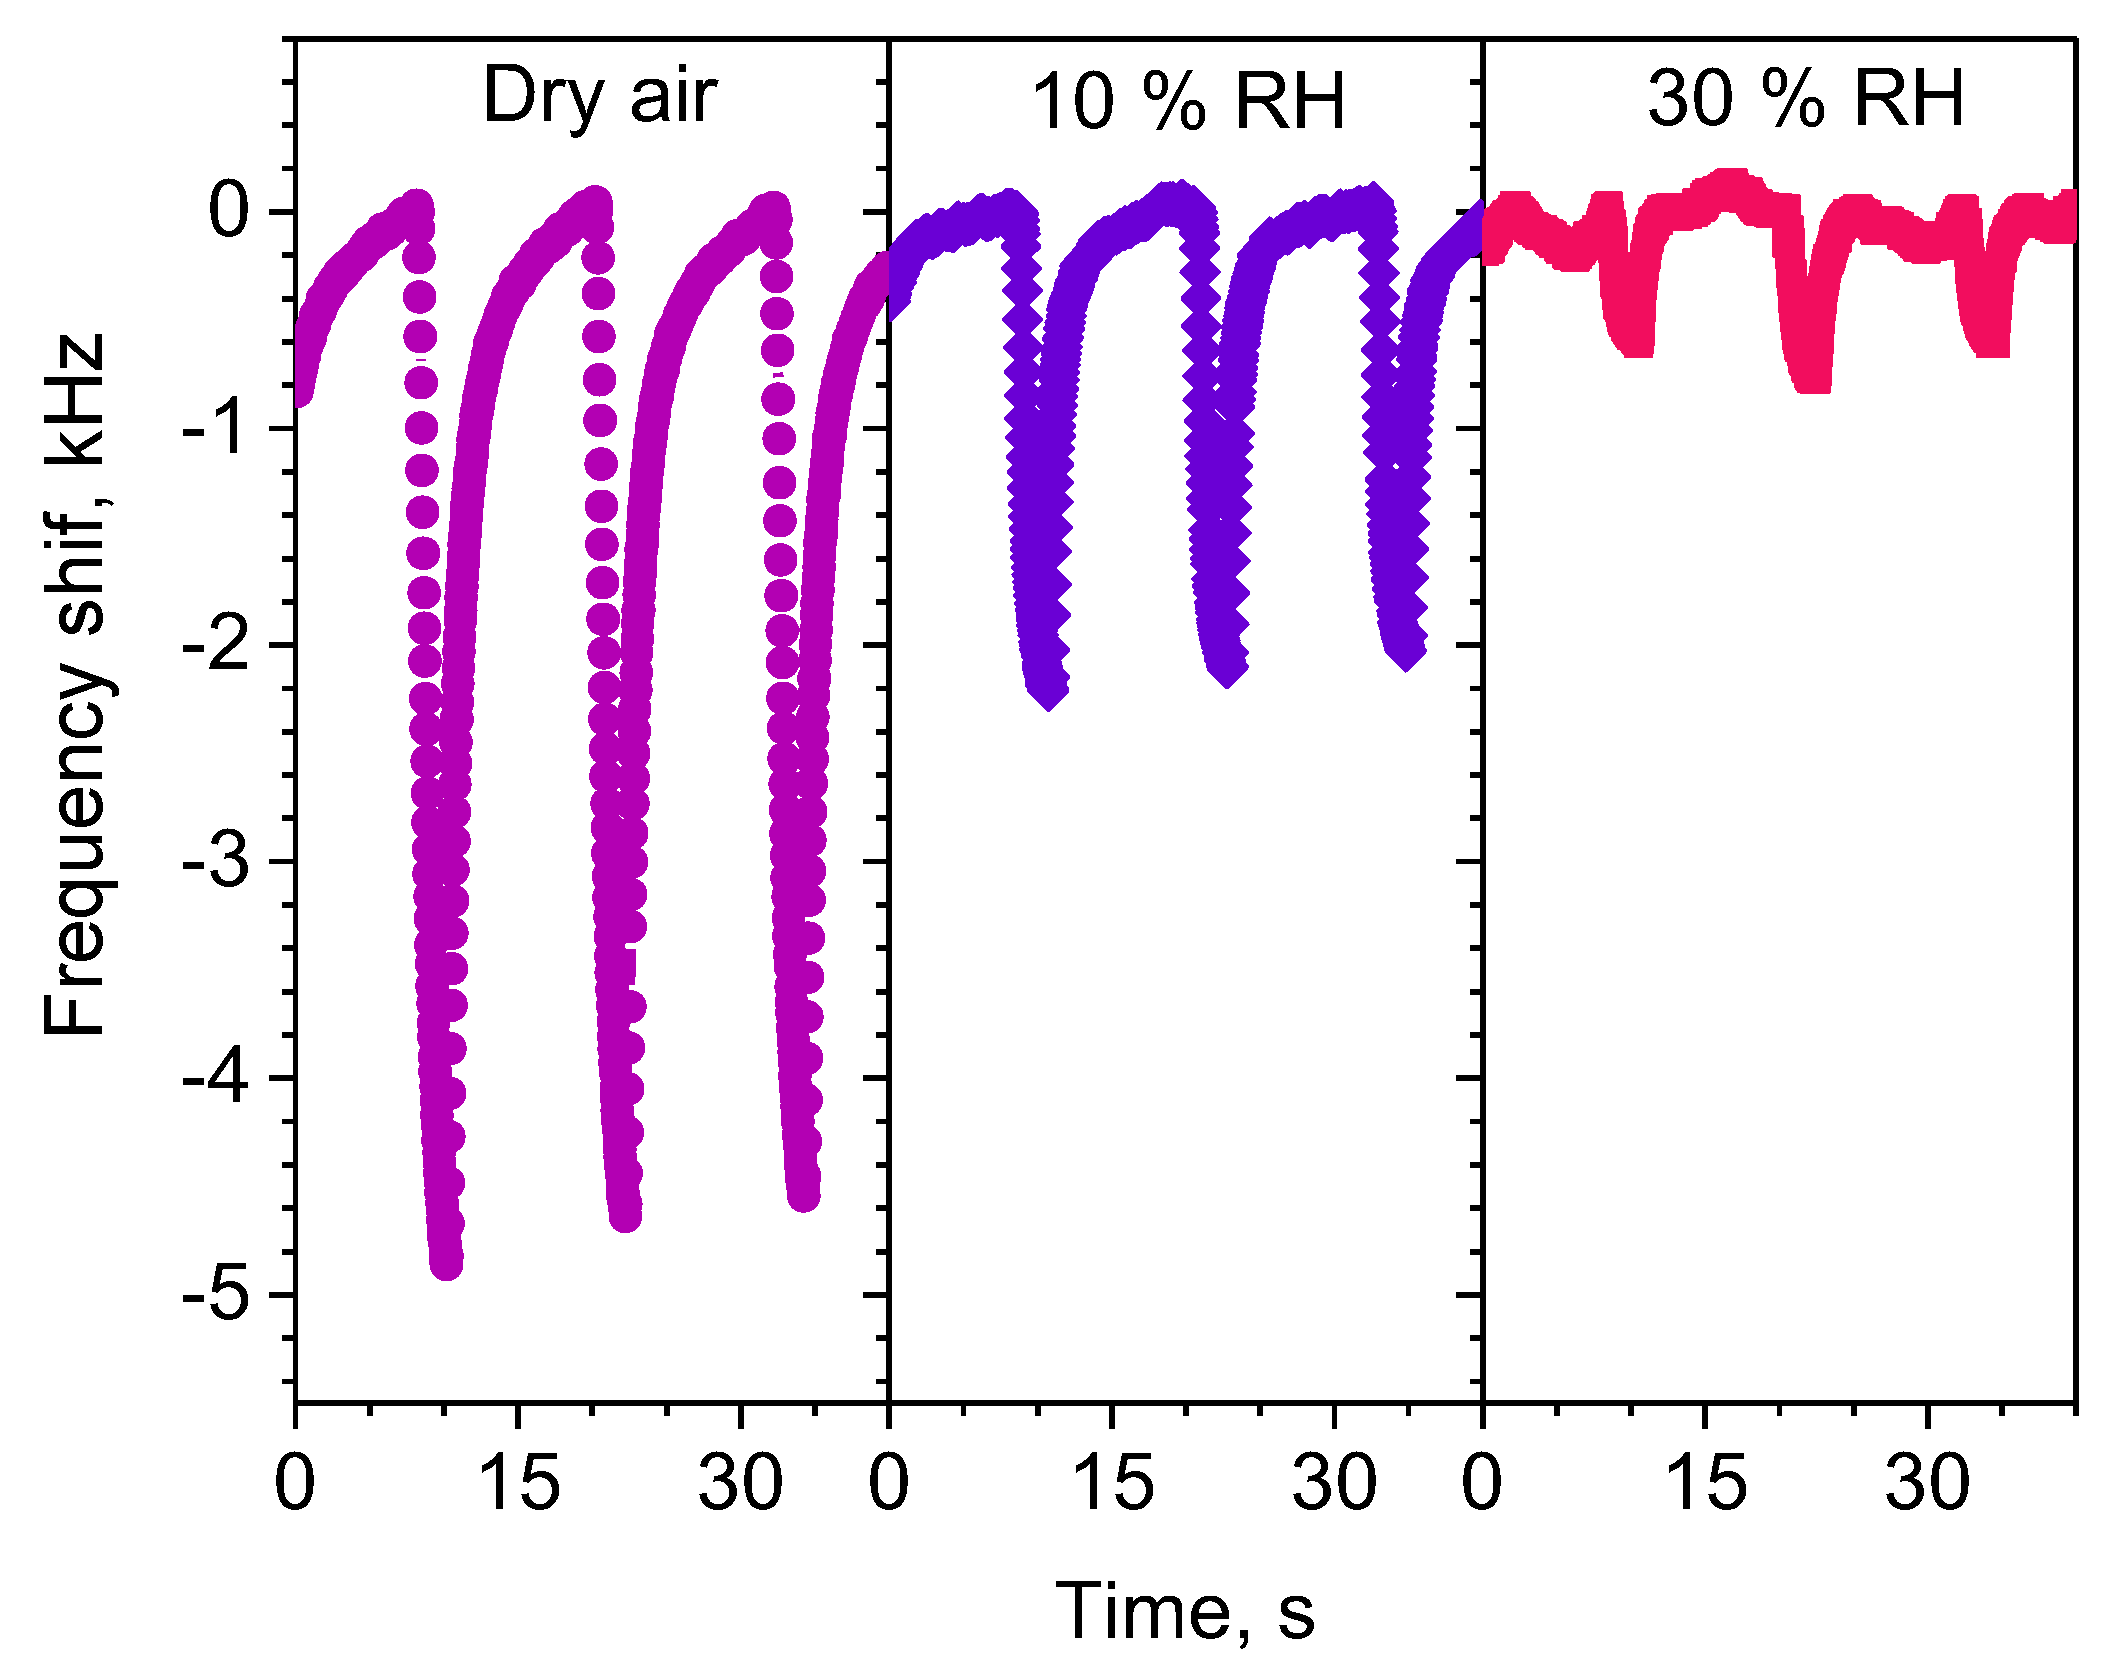
3.3. Gas Sensing Properties of the L-SAW Sensors
4. Conclusions
Author Contributions
Funding
Acknowledgments
Conflicts of Interest
References
- Ramírez, N.; Cuadras, A.; Rovira, E.; Borrull, F.; Marcé, R.M. Chronic risk assessment of exposure to volatile organic compounds in the atmosphere near the largest Mediterranean industrial site. Environ. Int. 2012, 39, 200–209. [Google Scholar] [CrossRef] [PubMed]
- Bai, J.; Baker, S.M.; Goodrich-Schneider, R.M.; Montazeri, N.; Sarnoski, P.J. Aroma Profile Characterization of Mahi-Mahi and Tuna for Determining Spoilage Using Purge and Trap Gas Chromatography-Mass Spectrometry. J. Food Sci. 2019, 84, 481–489. [Google Scholar] [CrossRef] [PubMed]
- Font, X.; Artola, A.; Sanchez, A. Detection, Composition and Treatment of Volatile Organic Compounds from Waste Treatment Plants. Sensors 2011, 11, 4043–4059. [Google Scholar] [CrossRef] [PubMed]
- Ulanowska, A.; Kowalkowski, T.; Trawinska, E.; Buszewski, B. The application of statistical methods using VOCs to identify patients with lung cancer. J. Breath Res. 2011, 5, 11. [Google Scholar] [CrossRef]
- Goodman, N.B.; Wheeler, A.J.; Paevere, P.J.; Selleck, P.W.; Cheng, M.; Steinemann, A. Indoor volatile organic compounds at an Australian university. Build. Environ. 2018, 135, 344–351. [Google Scholar] [CrossRef]
- Devkota, J.; Ohodnicki, P.R.; Greve, D.W. SAW Sensors for Chemical Vapors and Gases. Sensors 2017, 17, 28. [Google Scholar] [CrossRef]
- Constantinoiu, I.; Miu, D.N.; Viespe, C. Surface Acoustic Wave Sensors for Ammonia Detection at Room Temperature Based on SnO2/Co3O4 Bilayers. J. Sens. 2019. [Google Scholar] [CrossRef]
- Constantinoiu, I.; Viespe, C. Detection of Volatile Organic Compounds Using Surface Acoustic Wave Sensor Based on Nanoparticles Incorporated in Polymer. Coatings 2019, 9, 9. [Google Scholar] [CrossRef]
- Nikolaou, I.; Hallil, H.; Conedera, V.; Deligeorgis, G.; Dejous, C.; Rebiere, D. Inkjet-Printed Graphene Oxide Thin Layers on Love Wave Devices for Humidity and Vapor Detection. IEEE Sens. J. 2016, 16, 7620–7627. [Google Scholar] [CrossRef]
- Sayago, I.; Fernández, M.J.; Fontecha, J.L.; Horrillo, M.C.; Vera, C.; Obieta, I.; Bustero, I. New sensitive layers for surface acoustic wave gas sensors based on polymer and carbon nanotube composites. Sens. Actuators B Chem. 2012, 175, 67–72. [Google Scholar] [CrossRef]
- Feng, S.B.; Farha, F.; Li, Q.J.; Wan, Y.L.; Xu, Y.; Zhang, T.; Ning, H.S. Review on Smart Gas Sensing Technology. Sensors 2019, 19, 22. [Google Scholar] [CrossRef]
- Xu, Z.; Yuan, Y.J. Implementation of guiding layers of surface acoustic wave devices: A review. Biosens. Bioelectron. 2018, 99, 500–512. [Google Scholar] [CrossRef]
- Šetka, M.; Drbohlavová, J.; Hubálek, J. Nanostructured polypyrrole-based ammonia and volatile organic compound sensors. Sensors 2017, 17, 28. [Google Scholar] [CrossRef]
- Šetka, M.; Bahos, F.A.; Matatagui, D.; Potoček, M.; Kral, Z.; Drbohlavová, J.; Gràcia, I.; Vallejos, S. Love wave sensors based on gold nanoparticle-modified polypyrrole and their properties to ammonia and ethylene. Sens. Actuators B Chem. 2019, 304, 127337. [Google Scholar] [CrossRef]
- Fragoso-Mora, J.R.; Matatagui, D.; Bahos, F.A.; Fontecha, J.; Fernandez, M.J.; Santos, J.P.; Sayago, I.; Gràcia, I.; Horrillo, M.C. Gas sensors based on elasticity changes of nanoparticle layers. Sens. Actuators B Chem. 2018, 268, 93–99. [Google Scholar] [CrossRef]
- Mulfinger, L.; Solomon, S.D.; Bahadory, M.; Jeyarajasingam, A.V.; Rutkowsky, S.A.; Boritz, C. Synthesis and Study of Silver Nanoparticles. J. Chem. Educ. 2007, 84, 322. [Google Scholar] [CrossRef]
- Vallejos, S.; Grácia, I.; Chmela, O.; Figueras, E.; Hubálek, J.; Cané, C. Chemoresistive micromachined gas sensors based on functionalized metal oxide nanowires: Performance and reliability. Sens. Actuators B Chem. 2016, 235, 525–534. [Google Scholar] [CrossRef]
- Matatagui, D.; Bahos, F.A.; Gràcia, I.; Horrillo, M.D.C. Portable Low-Cost Electronic Nose Based on Surface Acoustic Wave Sensors for the Detection of BTX Vapors in Air. Sensors 2019, 19, 5406. [Google Scholar] [CrossRef] [PubMed]
- Setka, M.; Calavia, R.; Vojkuvka, L.; Llobet, E.; Drbohlavova, J.; Vallejos, S. Raman and XPS studies of ammonia sensitive polypyrrole nanorods and nanoparticles. Sci. Rep. 2019, 9, 10. [Google Scholar] [CrossRef]
- Zhang, Q.; Chen, C.; Wan, G.; Lei, M.; Chi, M.; Wang, S.; Min, D. Solar light induced synthesis of silver nanoparticles by using lignin as a reductant, and their application to ultrasensitive spectrophotometric determination of mercury(II). Microchim. Acta 2019, 186, 727. [Google Scholar] [CrossRef]
- Yu, J.J.; Sun, D.P.; Wang, T.H.; Li, F. Fabrication of Ag@AgCl/ZnO submicron wire film catalyst on glass substrate with excellent visible light photocatalytic activity and reusability. Chem. Eng. J. 2018, 334, 225–236. [Google Scholar] [CrossRef]
- Wei, L.; Sun, J.; Xu, L.; Zhu, S.D.; Zhou, X.Y.; Yang, S.; Dong, B.; Bai, X.; Lu, G.Y.; Song, H.W. Understanding the noble metal modifying effect on In2O3 nanowires: Highly sensitive and selective gas sensors for potential early screening of multiple diseases. Nanoscale Horiz. 2019, 4, 1361–1371. [Google Scholar] [CrossRef]
- Li, M.; Kan, H.; Che, S.T.; Feng, X.Y.; Li, H.; Li, C.; Fu, C.; Quan, A.J.; Sun, H.B.; Luo, J.T.; et al. Colloidal quantum dot-based surface acoustic wave sensors for NO2-sensing behavior. Sens. Actuators B Chem. 2019, 287, 241–249. [Google Scholar] [CrossRef]
- Edirisinghe, R.K.B.; Graham, A.J.; Taylor, S.J. Characterisation of the volatiles of yellowfin tuna (Thunnus albacares) during storage by solid phase microextraction and GC-MS and their relationship to fish quality parameters. Int. J. Food Sci. Technol. 2007, 42, 1139–1147. [Google Scholar] [CrossRef]
- Bhasker Raj, V.; Nimal, A.T.; Parmar, Y.; Sharma, M.U.; Gupta, V. Investigations on the origin of mass and elastic loading in the time varying distinct response of ZnO SAW ammonia sensor. Sens. Actuators B Chem. 2012, 166–167, 576–585. [Google Scholar] [CrossRef]
- Li, Y.; Ban, H.; Yang, M. Highly sensitive NH3 gas sensors based on novel polypyrrole-coated SnO2 nanosheet nanocomposites. Sens. Actuators B Chem. 2016, 224, 449–457. [Google Scholar] [CrossRef]
- Li, F.; Li, H.; Jiang, H.; Zhang, K.; Chang, K.; Jia, S.; Jiang, W.; Shang, Y.; Lu, W.; Deng, S.; et al. Polypyrrole nanoparticles fabricated via Triton X-100 micelles template approach and their acetone gas sensing property. Appl. Surf. Sci. 2013, 280, 212–218. [Google Scholar] [CrossRef]
- Viespe, C.; Miu, D. Characteristics of Surface Acoustic Wave Sensors with Nanoparticles Embedded in Polymer Sensitive Layers for VOC Detection. Sensors 2018, 18, 9. [Google Scholar] [CrossRef]
- Viespe, C.; Grigoriu, C. Surface acoustic wave sensors with carbon nanotubes and SiO2/Si nanoparticles based nanocomposites for VOC detection. Sens. Actuators B Chem. 2010, 147, 43–47. [Google Scholar] [CrossRef]
- Bahos, F.A.; Sainz-Vidal, A.; Sanchez-Perez, C.; Saniger, J.M.; Gracia, I.; Saniger-Alba, M.M.; Matatagui, D. ZIF Nanocrystal-Based Surface Acoustic Wave (SAW) Electronic Nose to Detect Diabetes in Human Breath. Biosensors 2018, 9, 13. [Google Scholar] [CrossRef]
- Moon, J.D.; Galizia, M.; Borjigin, H.; Liu, R.; Riffle, J.S.; Freeman, B.D.; Paul, D.R. Water Vapor Sorption, Diffusion, and Dilation in Polybenzimidazoles. Macromolecules 2018, 51, 7197–7208. [Google Scholar] [CrossRef]
- Ahmadi, M.T.; Ismail, R.; Anwar, S. Handbook of Research on Nanoelectronic Sensor Modeling and Applications; IGI Global: Hershey, PA, USA, 2016. [Google Scholar]


| Sensitive Material | Gas | LTC (ppm) | HTC (ppm) | Sensitivity (Hz/ppm) | LOD (ppm) | Temperature | Reference |
|---|---|---|---|---|---|---|---|
| Ag/PPy | Acetone | 0.5 | 5 | 910 | 0.003 | RT | This work |
| Ethanol | 742 | 0.005 | |||||
| Toluene | 340 | 0.020 | |||||
| PPy | Acetone | 5.5 | 80 | 116.4 | - | RT | [27] |
| PEI/Fe3O4 | Ethanol | 160 | 16,000 | 1.6 | 65 | ND | [28] |
| Toluene | 1.9 | 54 | |||||
| MWCNTs-PEI | Ethanol | 200 | 40,000 | 1.2 | 176.5 | ND | [29] |
| Toluene | 1.2 | 170.7 | |||||
| PEI/WO3 | Acetone | 50 | 800 | 3.4 | 15 | RT | [8] |
| Ethanol | 7.9 | 6 | |||||
| Toluene | 4.8 | 11 | |||||
| GO | Ethanol | 30 | 750 | 30 | - | ND | [9] |
| Toluene | 24 | - | |||||
| ZIF/Au | Acetone | 5 | 25 | 28 | 1.1 | RT | [30] |
| Ethanol | 72 | 0.5 | |||||
| SnO2/Co3O4 | Toluene | 100 | 900 | 0.6 | 50 | RT | [7] |
| PEUT-MWCNTs | Toluene | 25 | 200 | 12.2 | 0.6 | RT | [10] |
© 2020 by the authors. Licensee MDPI, Basel, Switzerland. This article is an open access article distributed under the terms and conditions of the Creative Commons Attribution (CC BY) license (http://creativecommons.org/licenses/by/4.0/).
Share and Cite
Šetka, M.; Bahos, F.A.; Matatagui, D.; Gràcia, I.; Figueras, E.; Drbohlavová, J.; Vallejos, S. Love Wave Sensors with Silver Modified Polypyrrole Nanoparticles for VOCs Monitoring. Sensors 2020, 20, 1432. https://doi.org/10.3390/s20051432
Šetka M, Bahos FA, Matatagui D, Gràcia I, Figueras E, Drbohlavová J, Vallejos S. Love Wave Sensors with Silver Modified Polypyrrole Nanoparticles for VOCs Monitoring. Sensors. 2020; 20(5):1432. https://doi.org/10.3390/s20051432
Chicago/Turabian StyleŠetka, Milena, Fabio A. Bahos, Daniel Matatagui, Isabel Gràcia, Eduard Figueras, Jana Drbohlavová, and Stella Vallejos. 2020. "Love Wave Sensors with Silver Modified Polypyrrole Nanoparticles for VOCs Monitoring" Sensors 20, no. 5: 1432. https://doi.org/10.3390/s20051432
APA StyleŠetka, M., Bahos, F. A., Matatagui, D., Gràcia, I., Figueras, E., Drbohlavová, J., & Vallejos, S. (2020). Love Wave Sensors with Silver Modified Polypyrrole Nanoparticles for VOCs Monitoring. Sensors, 20(5), 1432. https://doi.org/10.3390/s20051432