Evaluation of Remotely Sensed and Interpolated Environmental Datasets for Vector-Borne Disease Monitoring Using In Situ Observations over the Amhara Region, Ethiopia


Abstract
1. Introduction
2. Study Area, Data and Methods
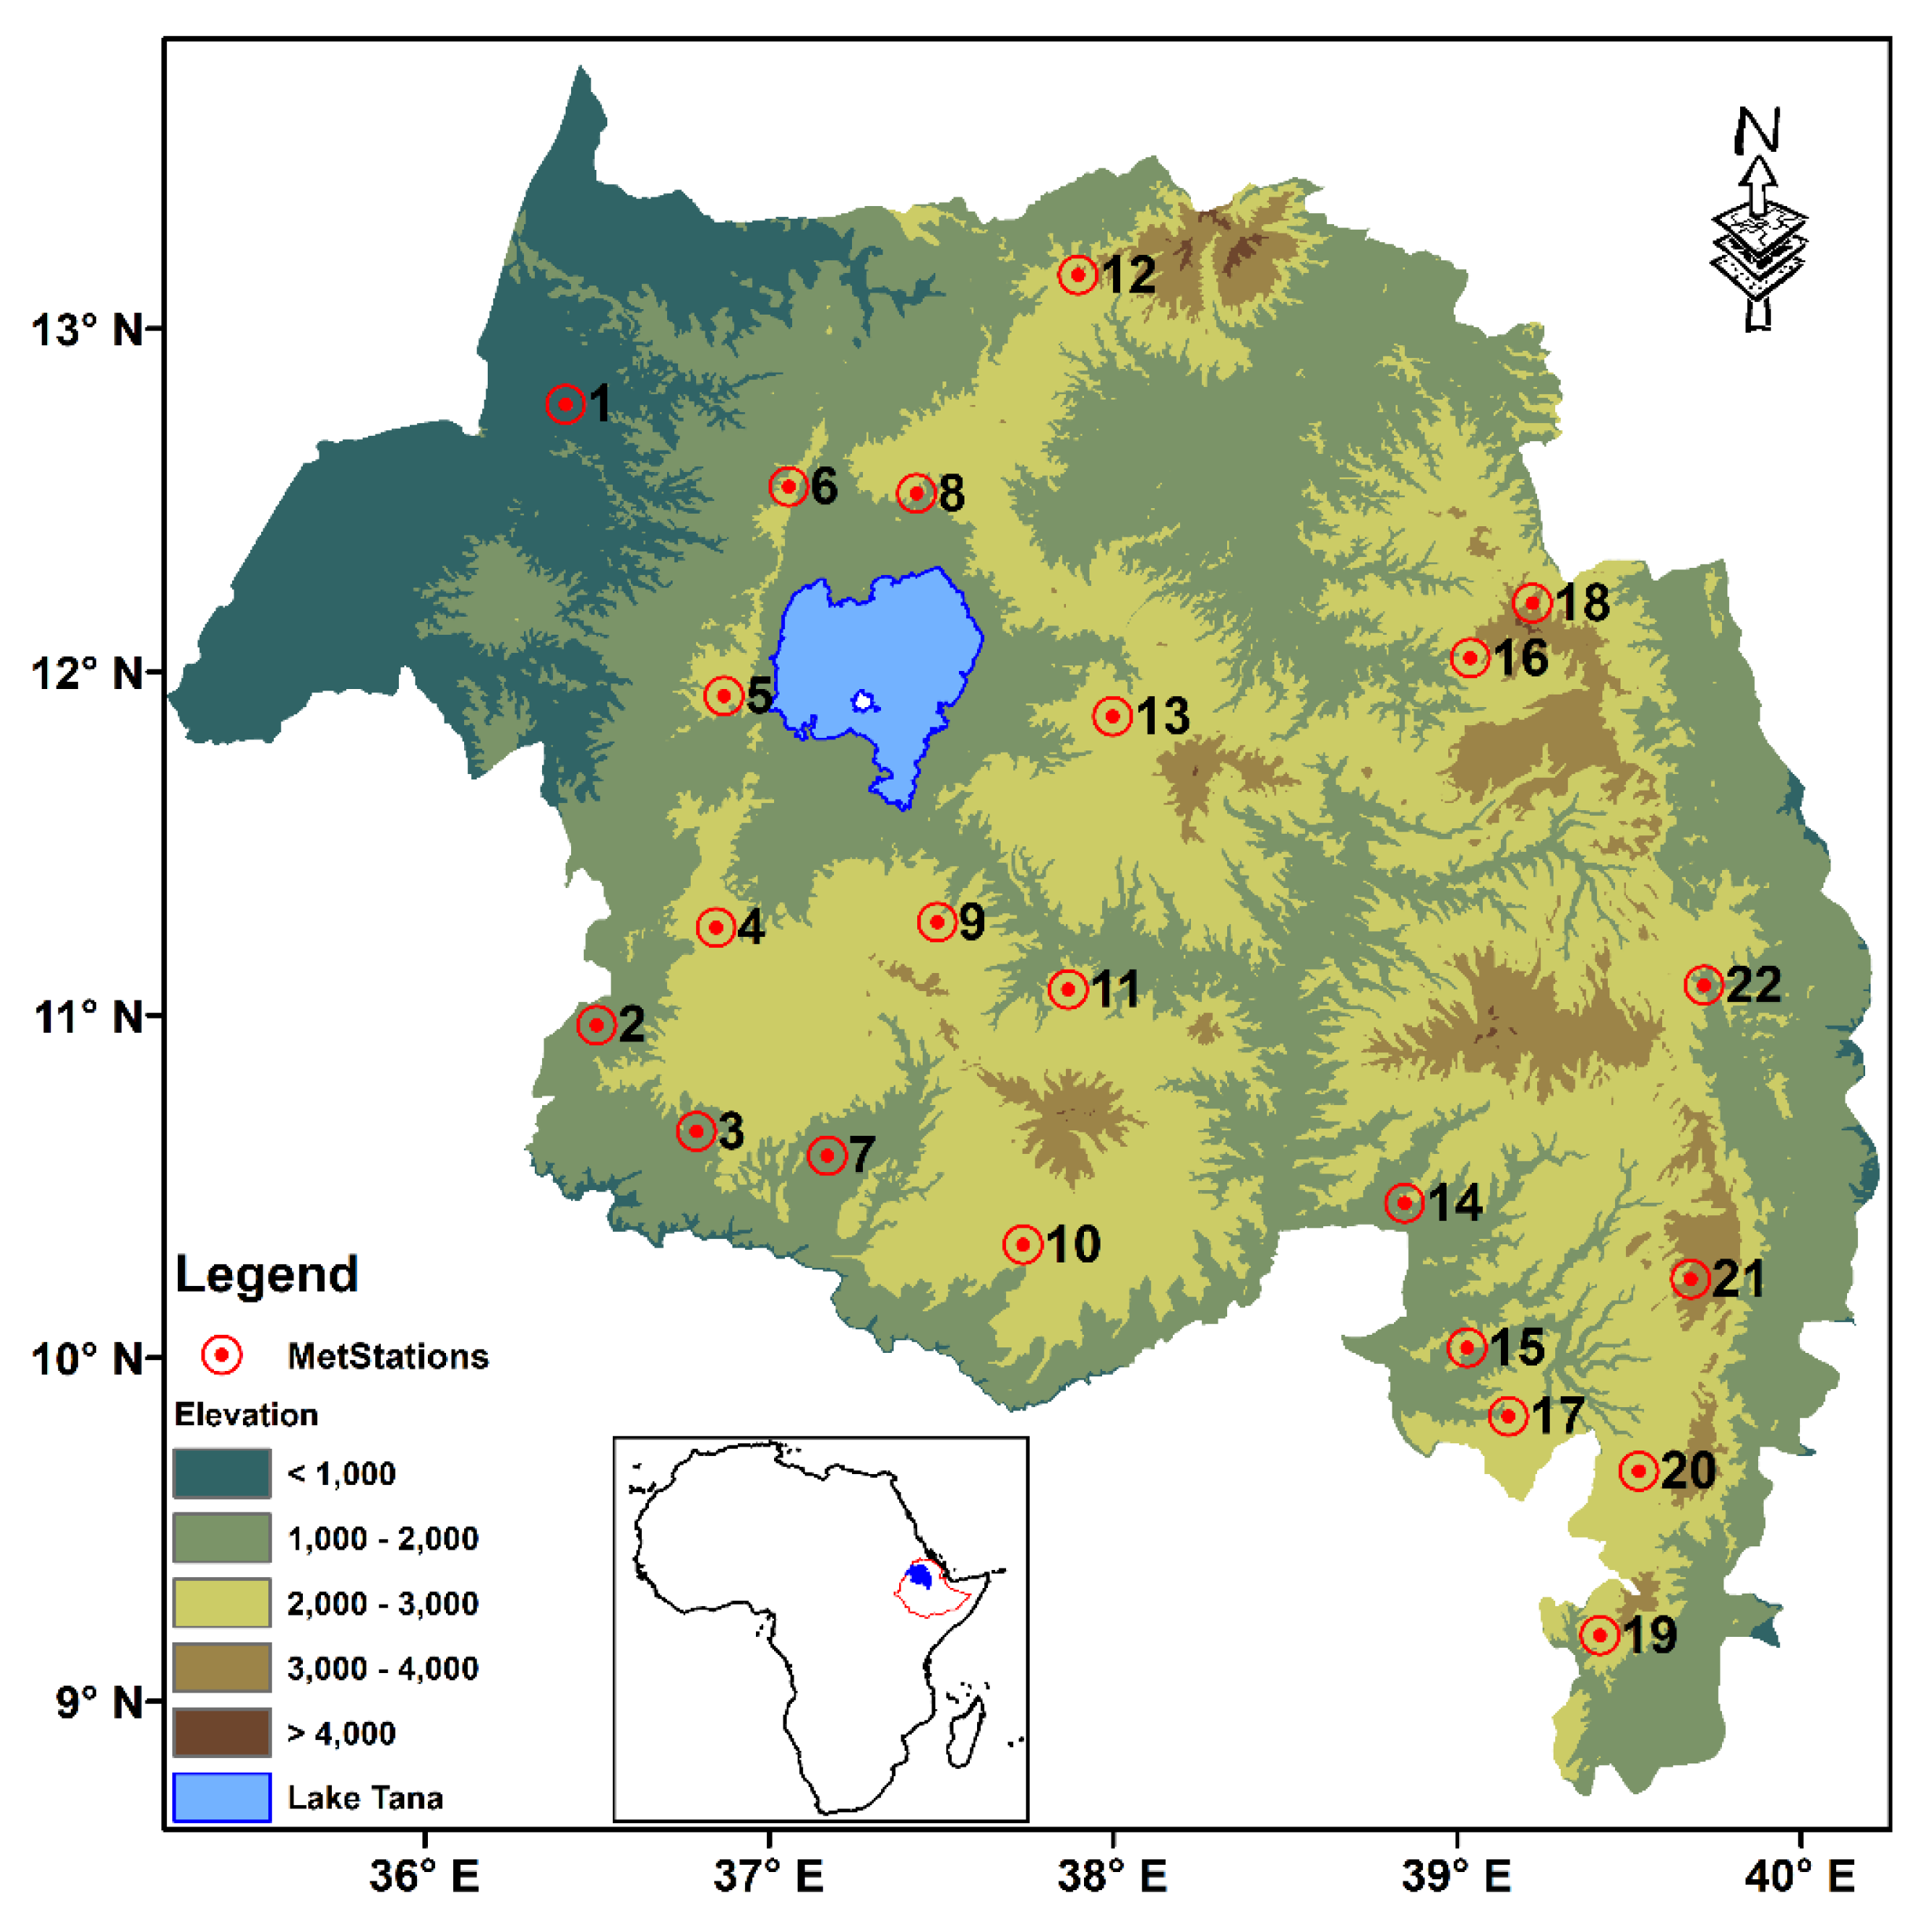
2.1. Study Area
2.2. Data
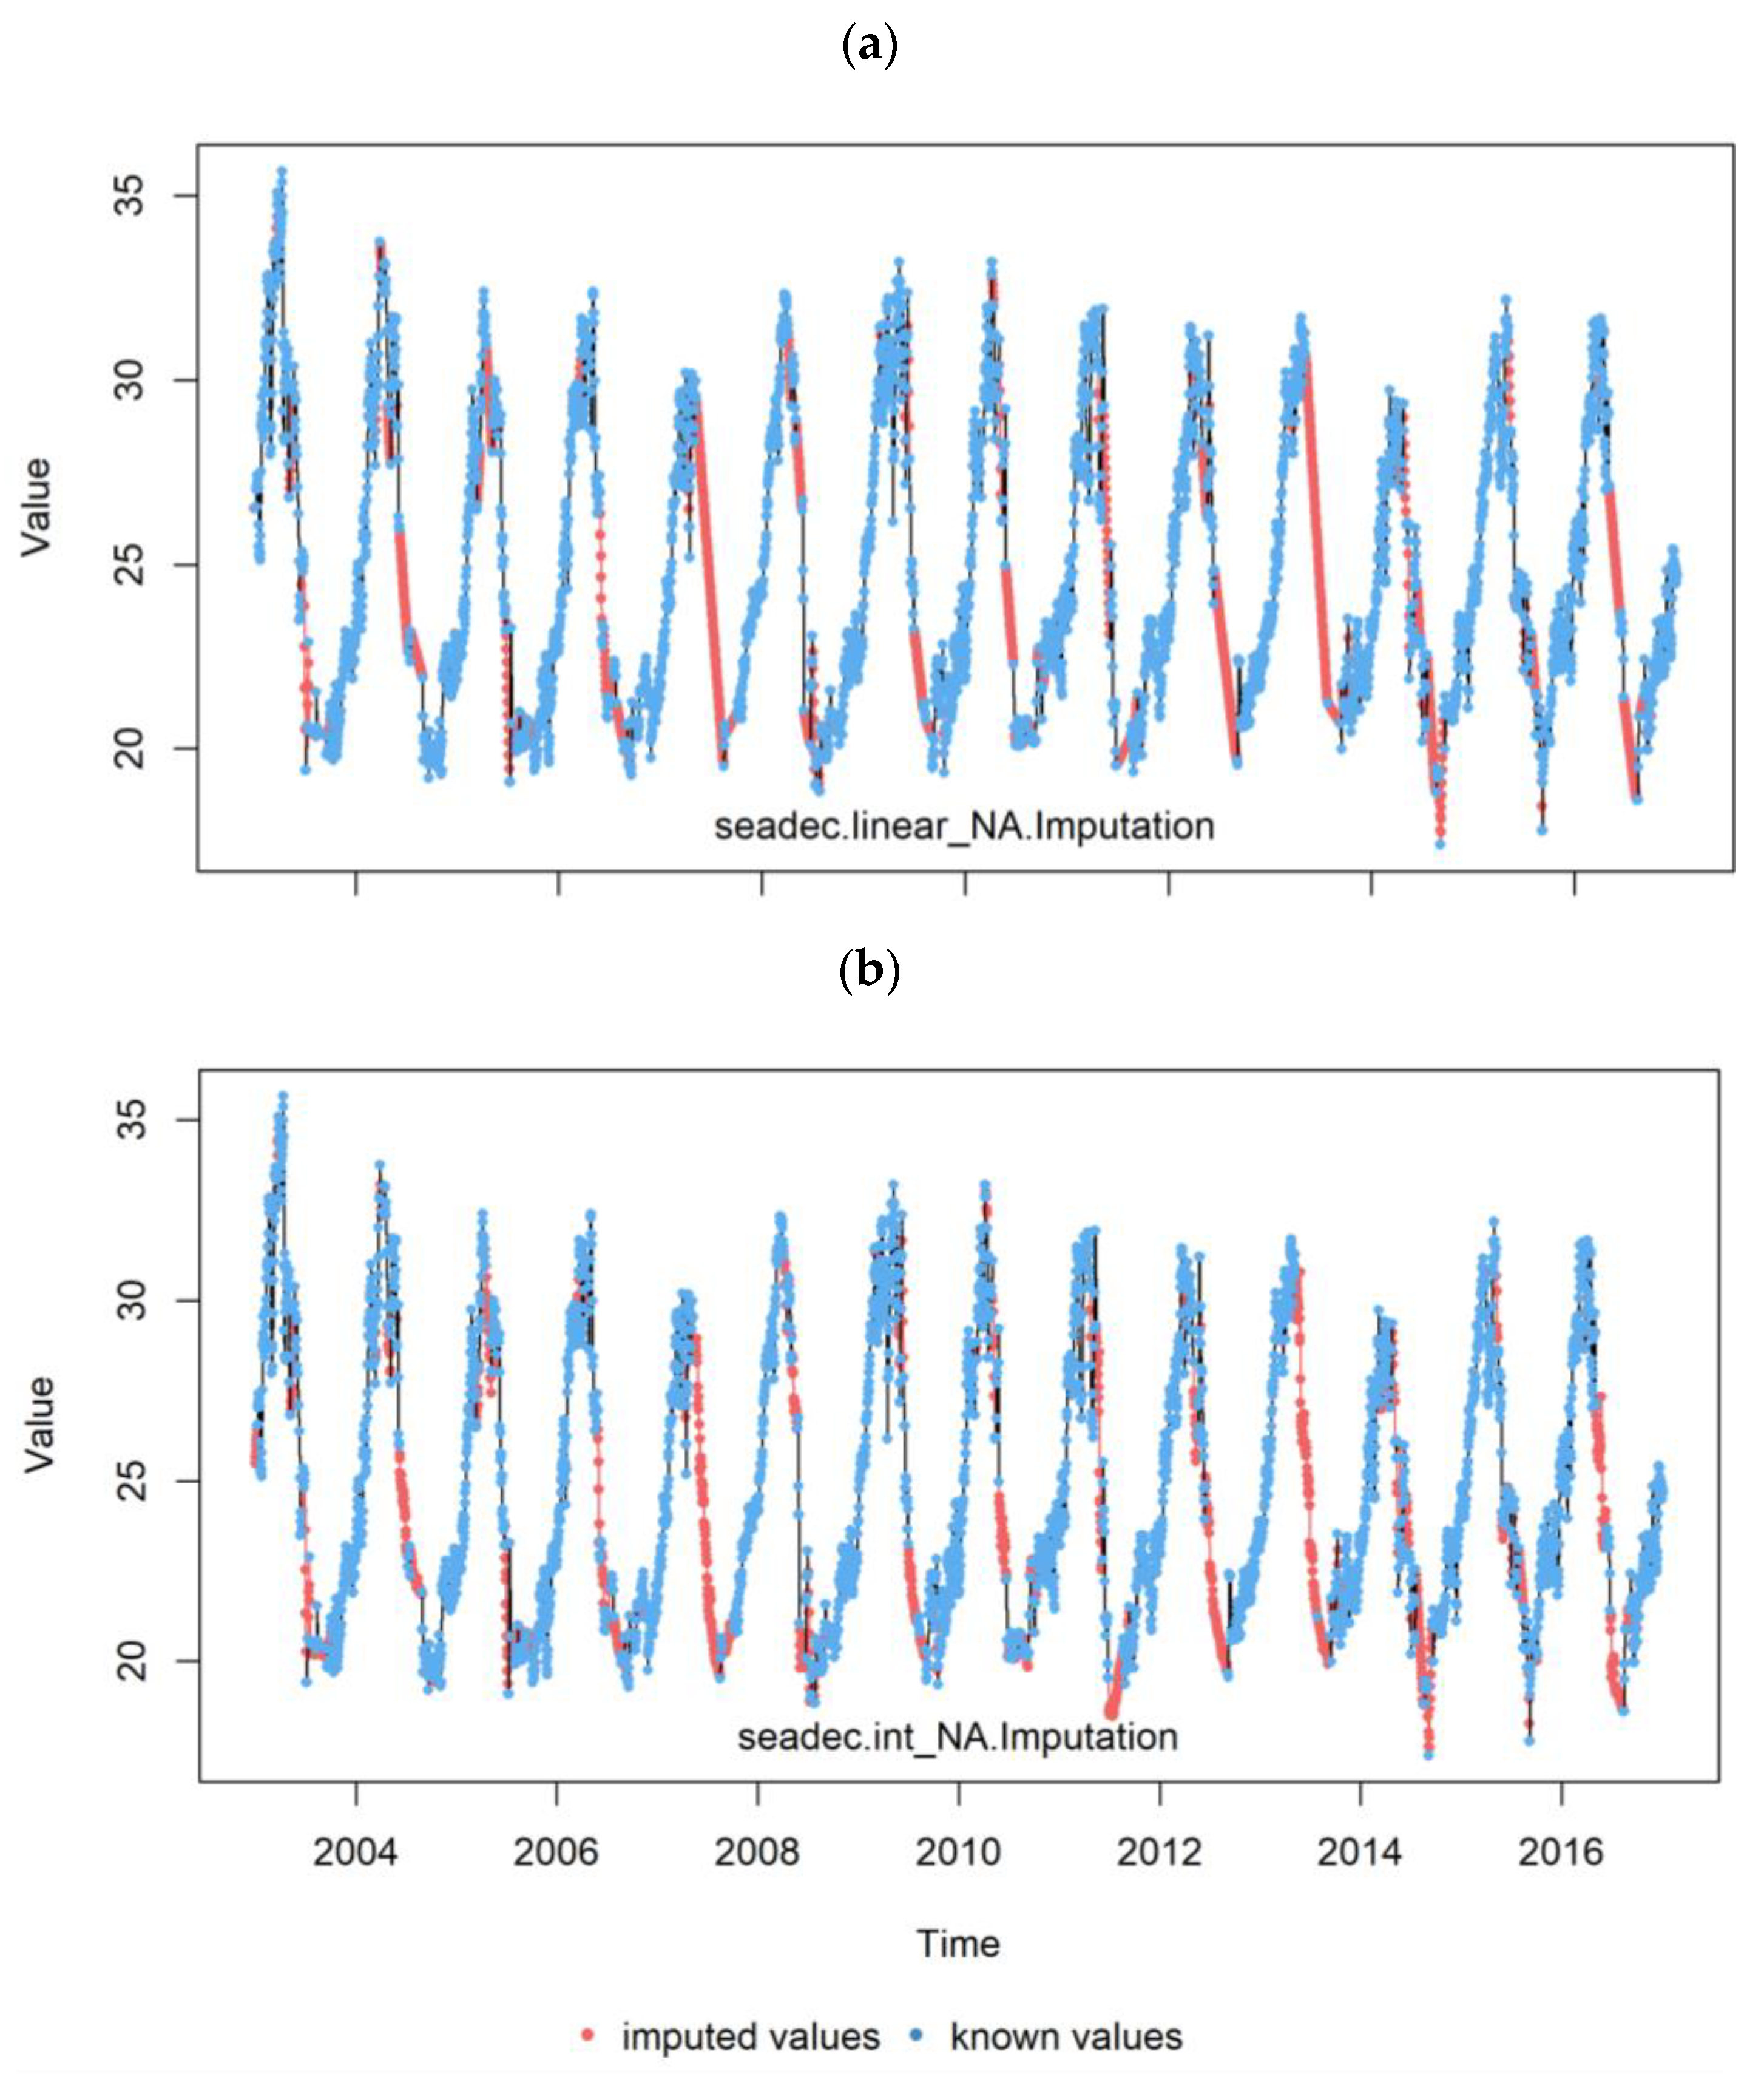
2.3. Methods
3. Results and Discussion
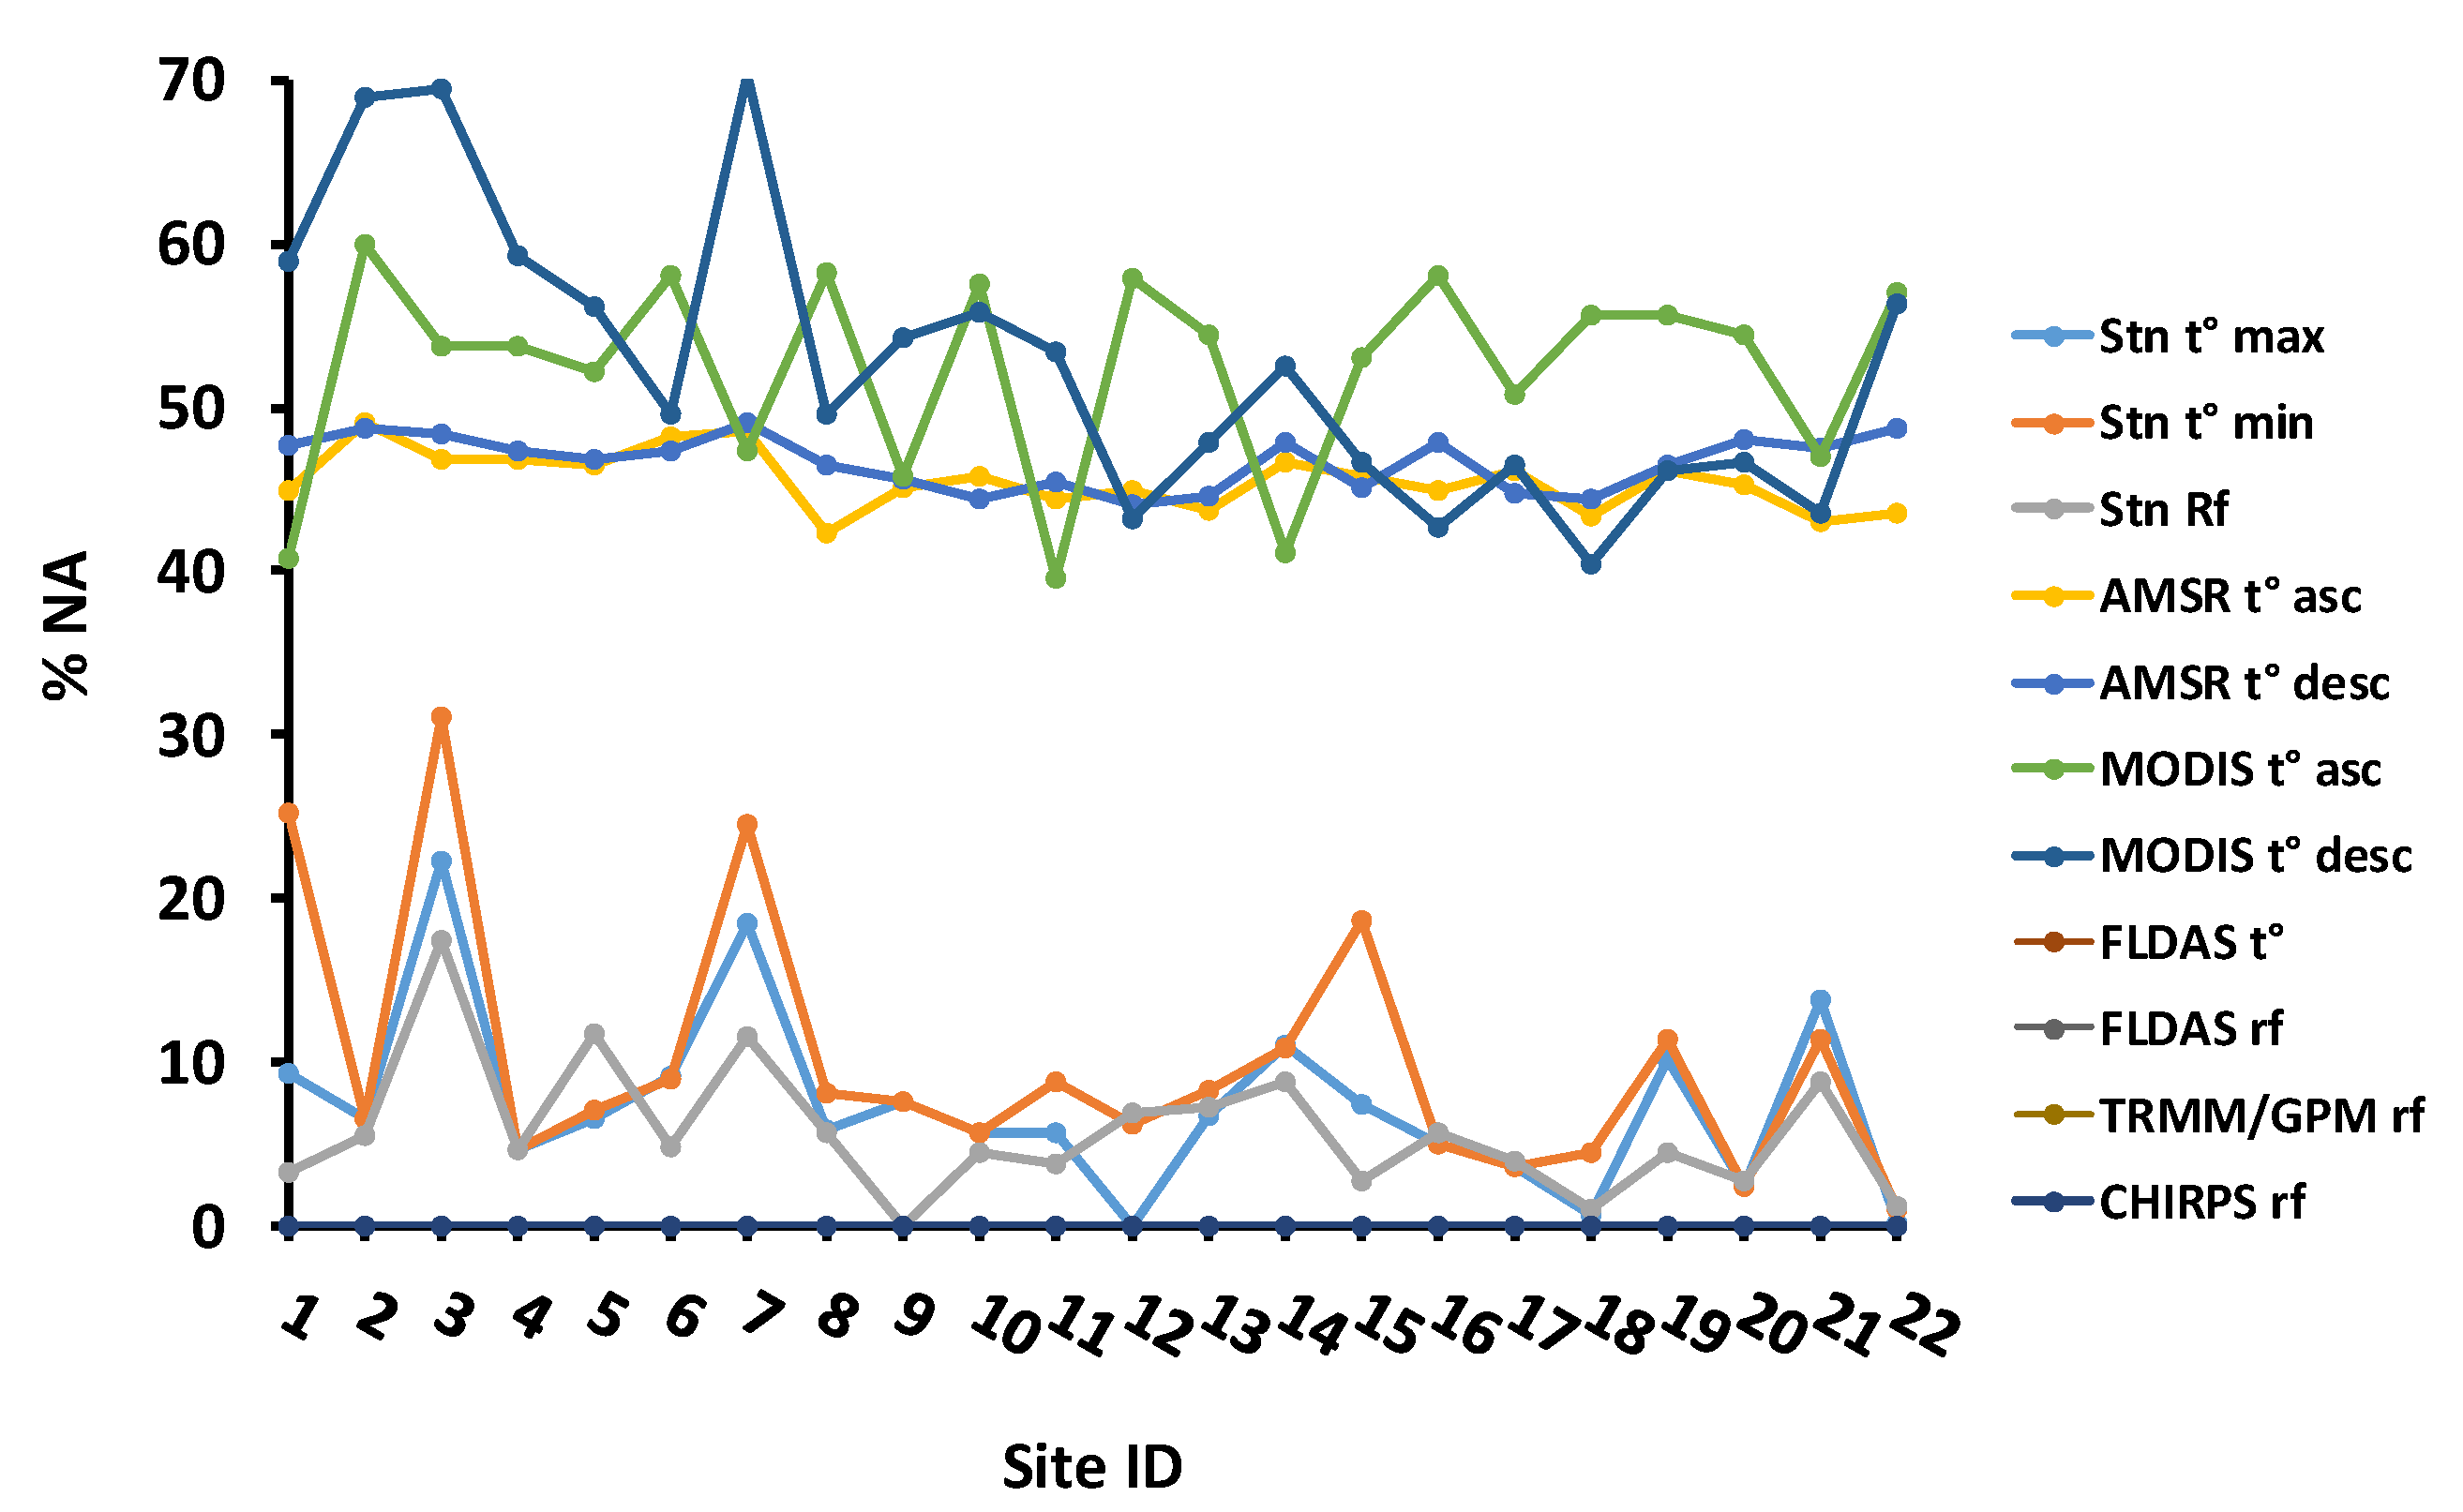
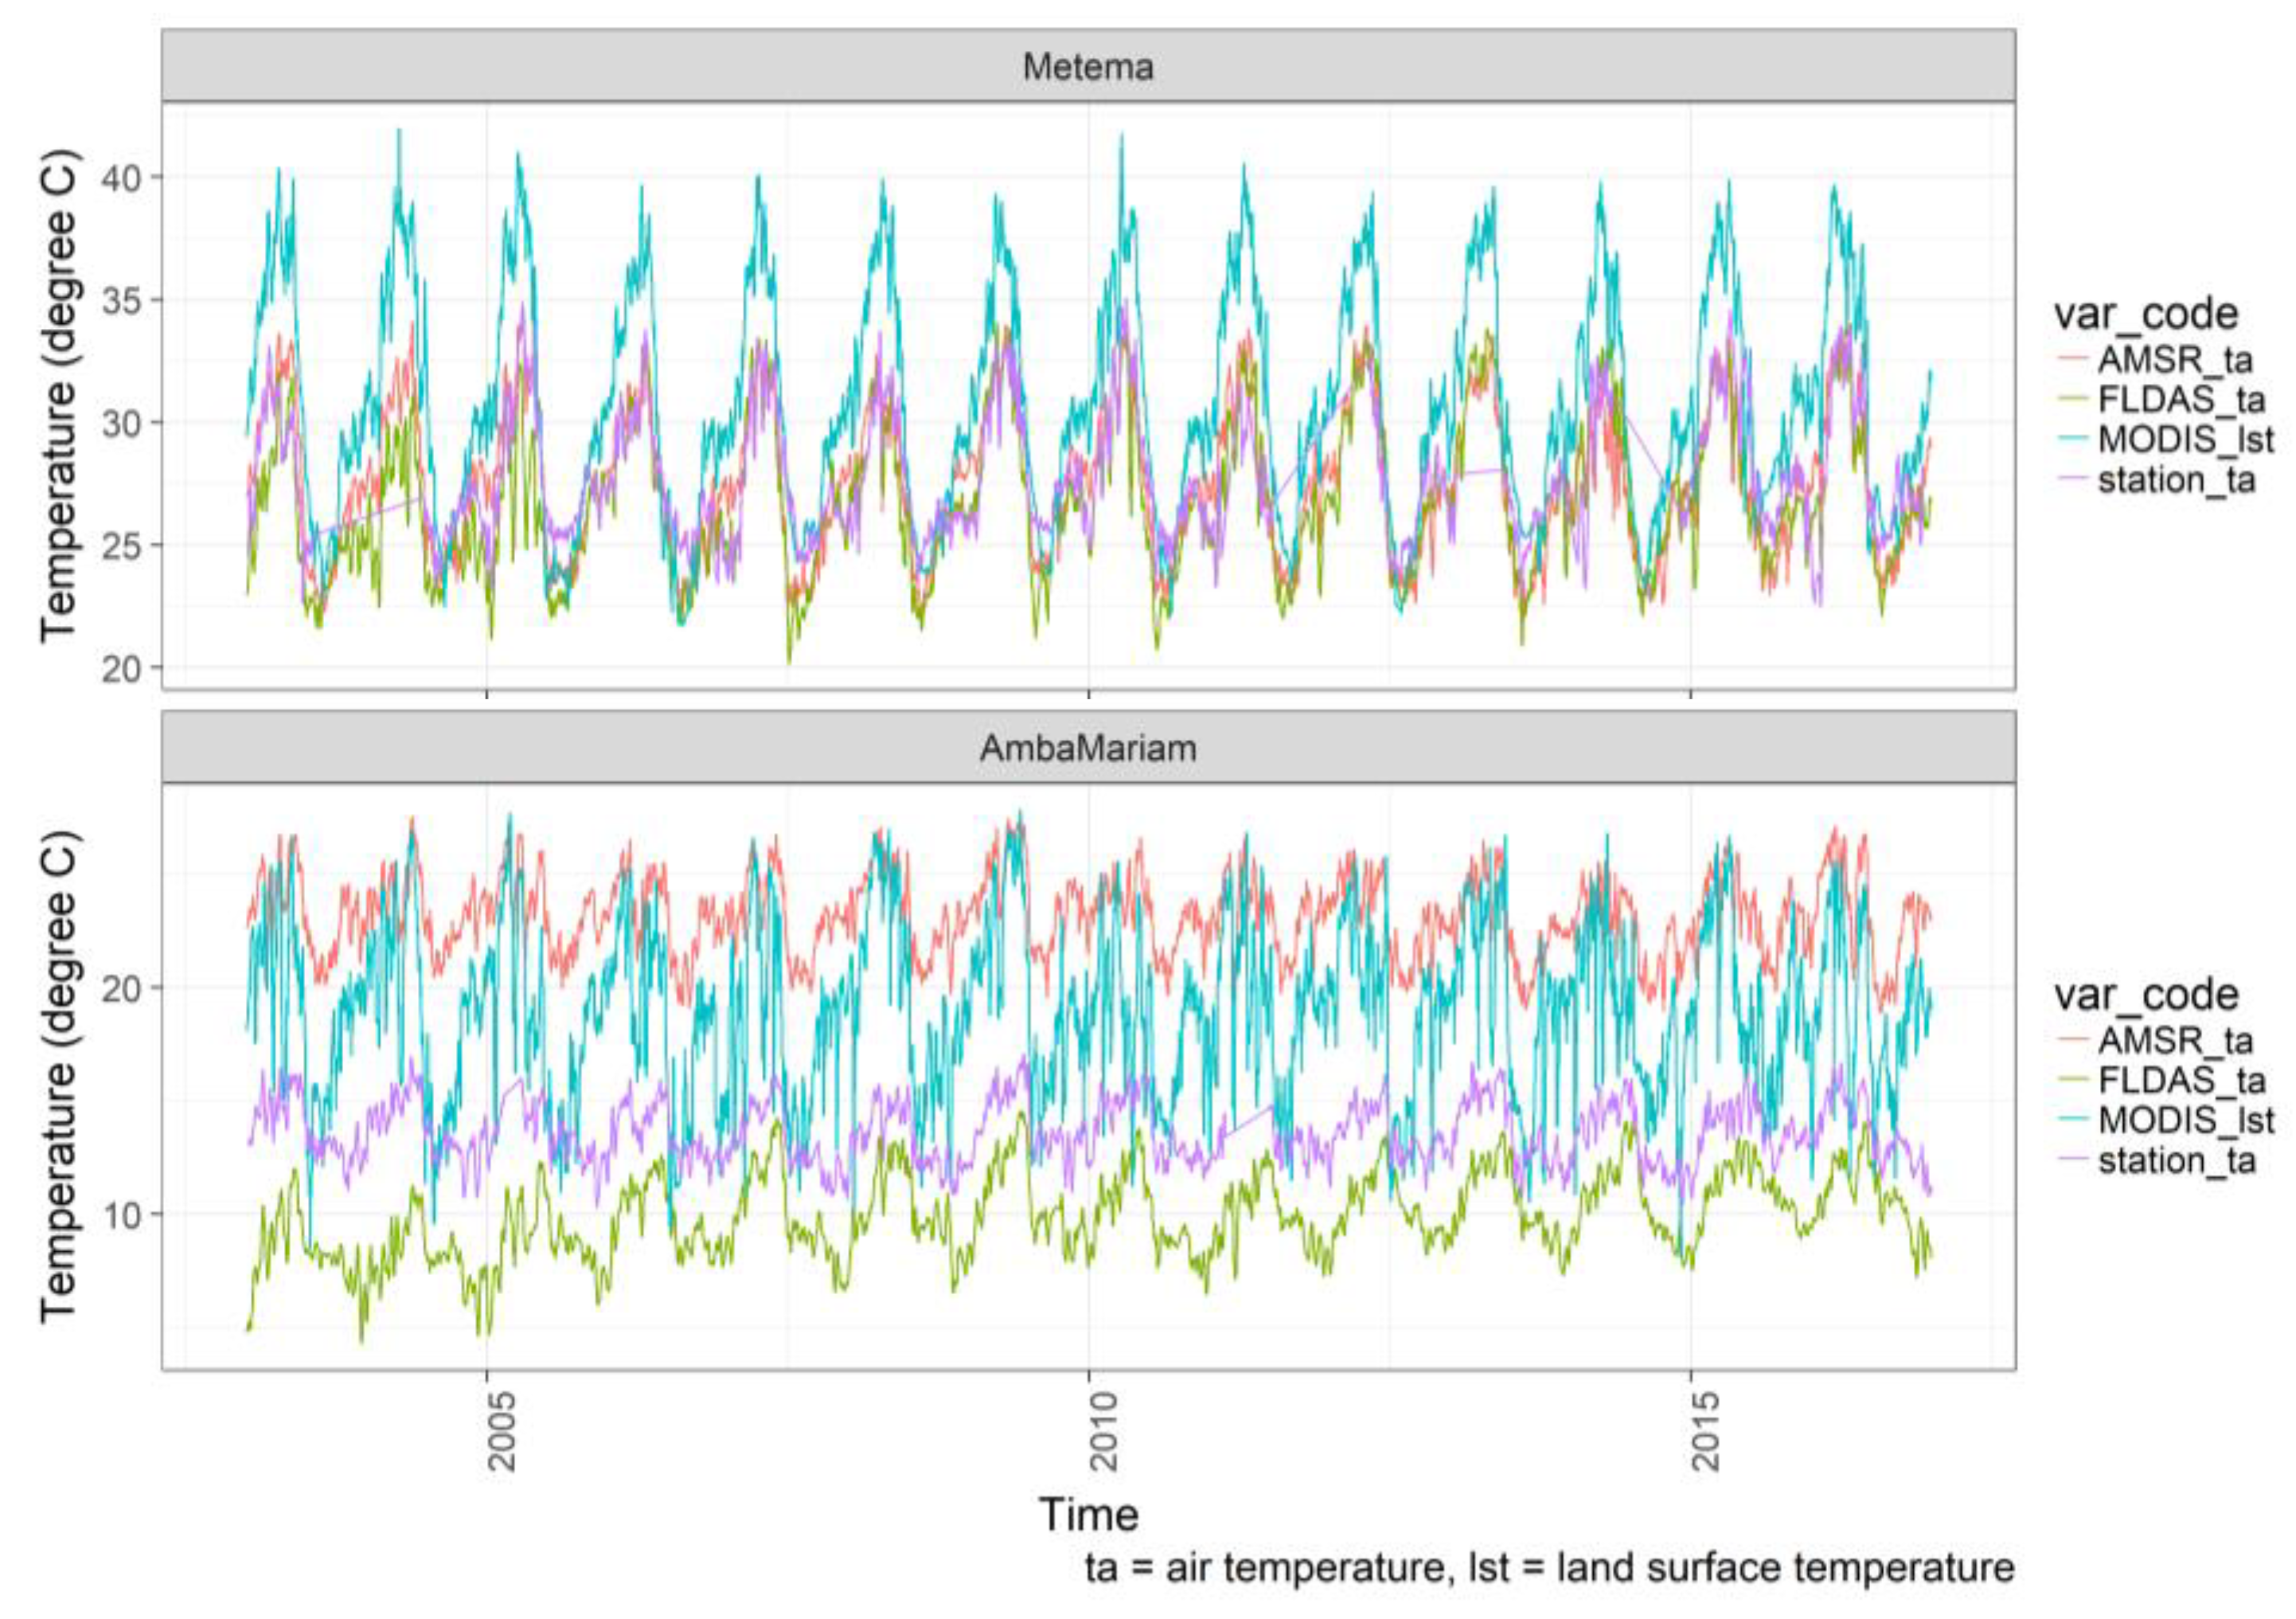
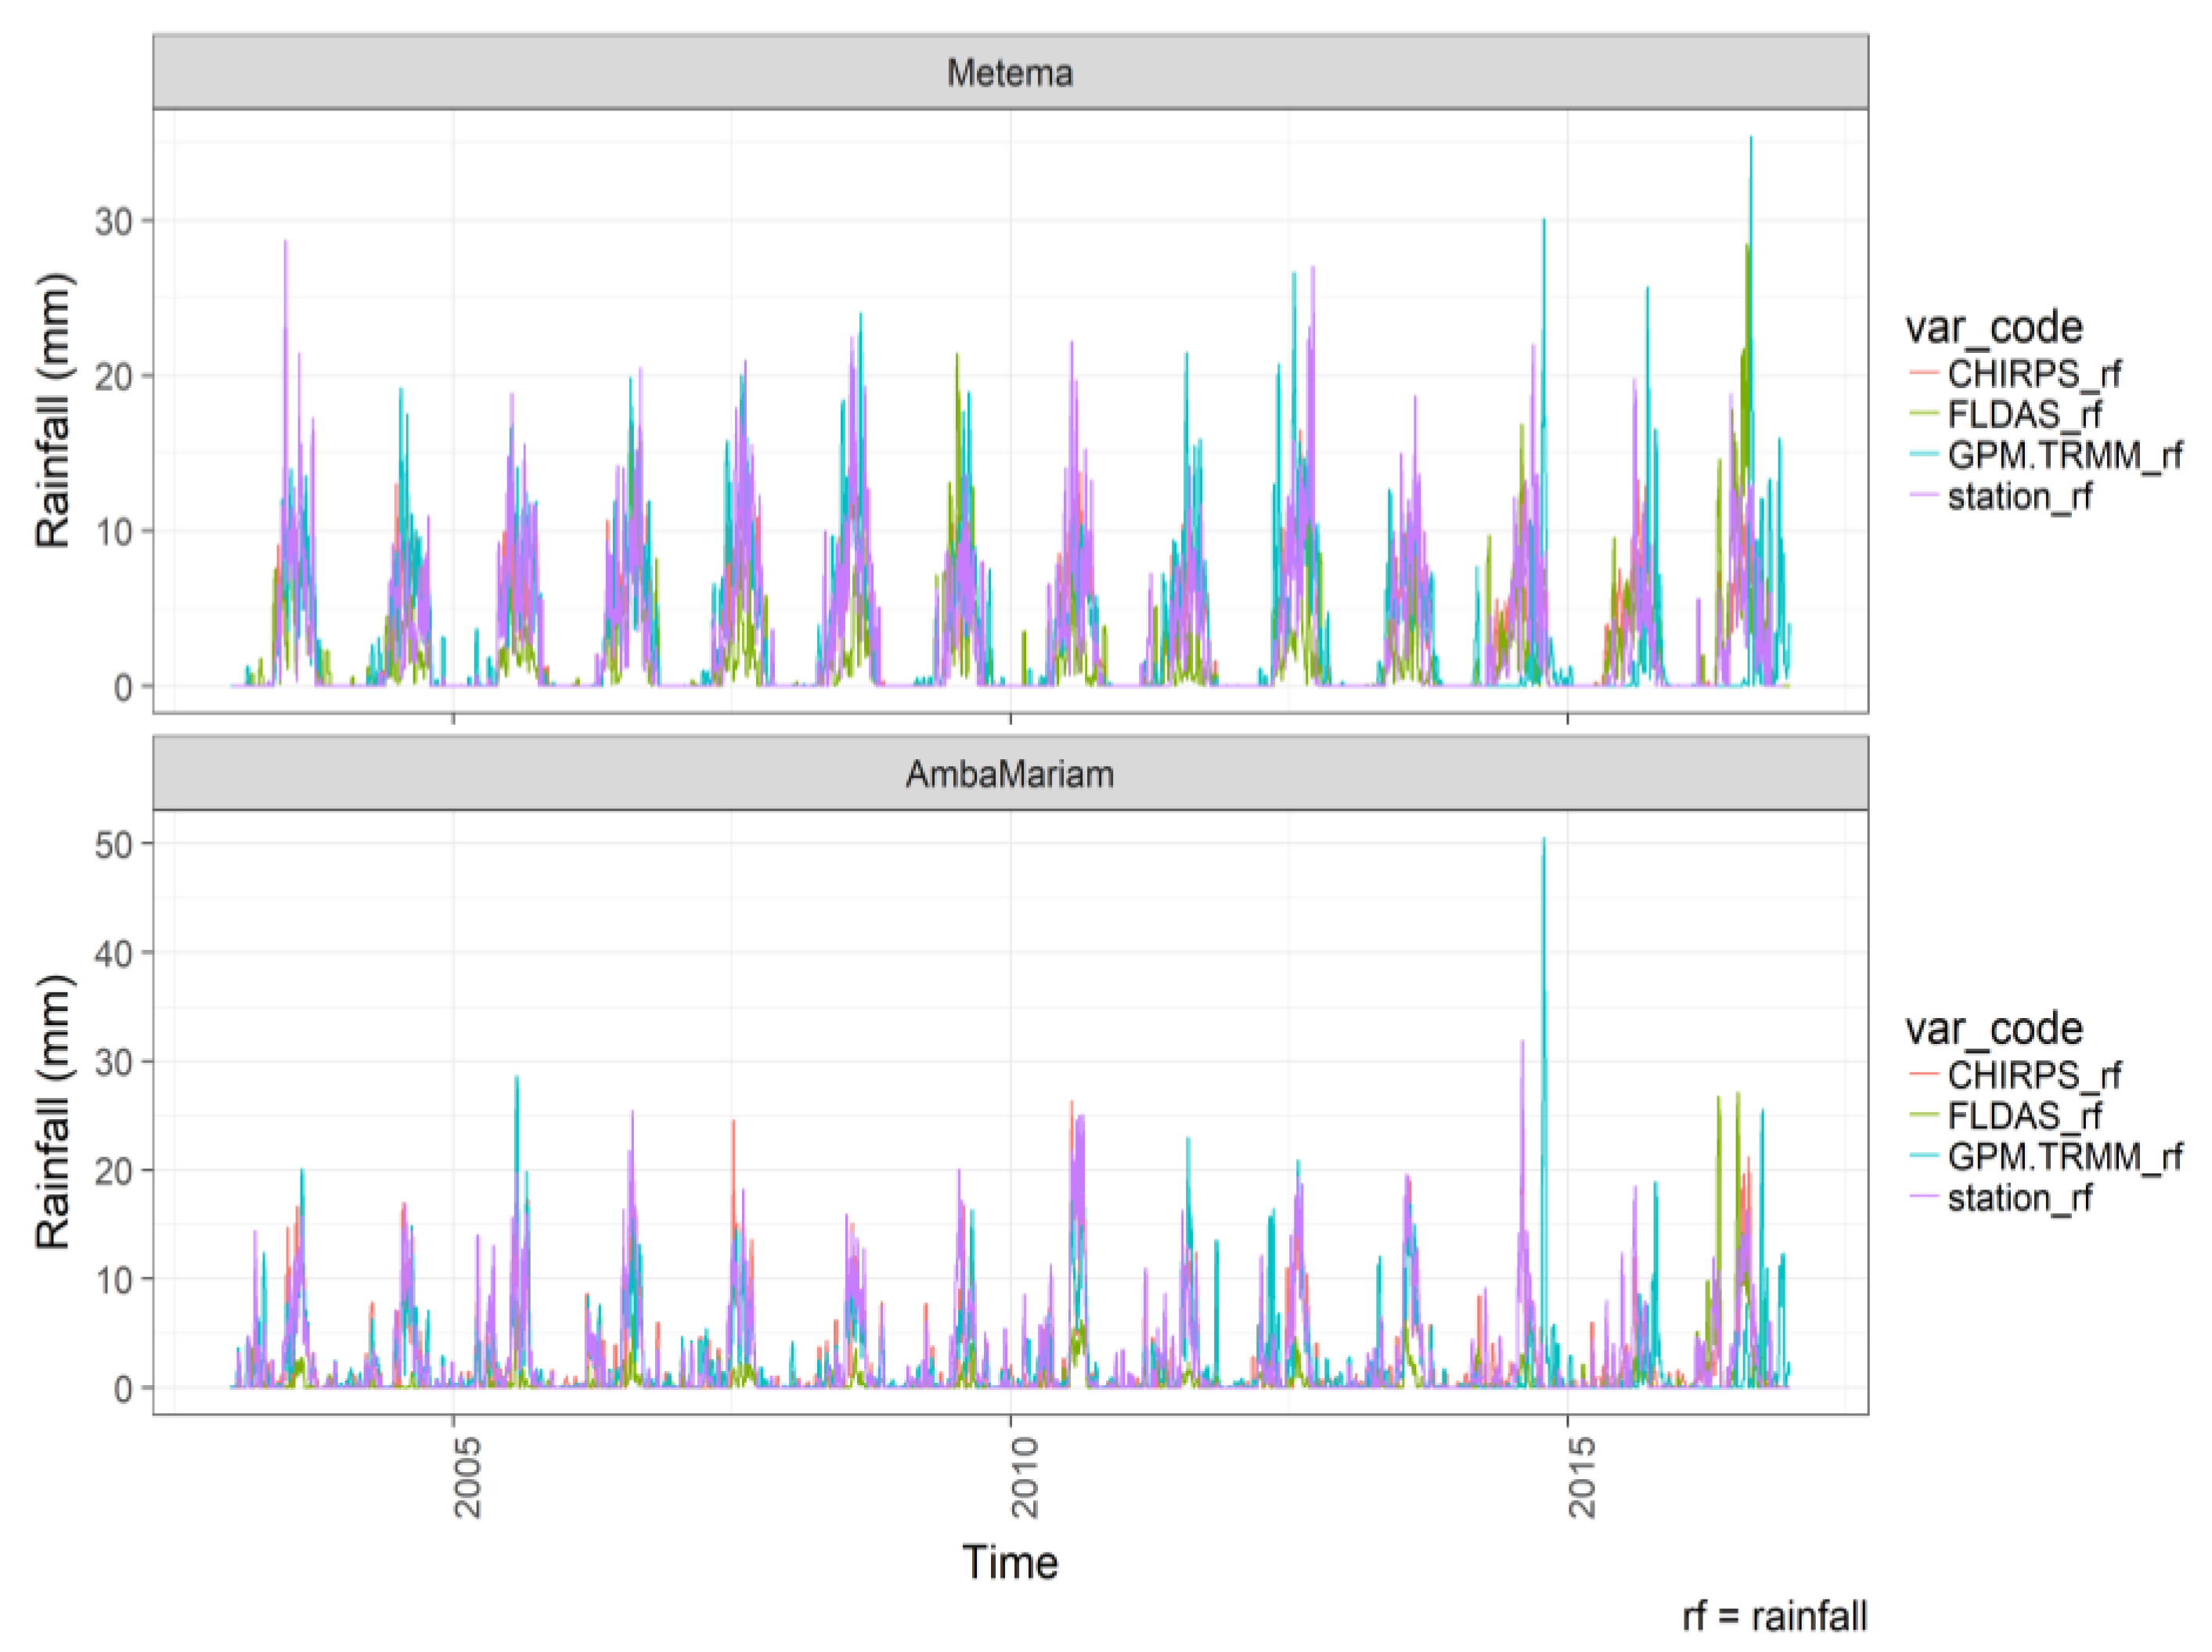
3.1. Temperature and Rainfall Time Series
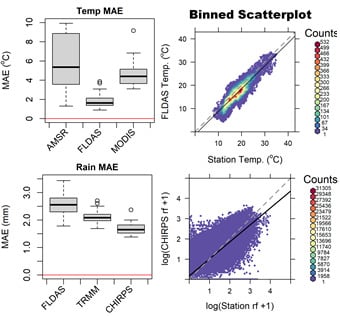
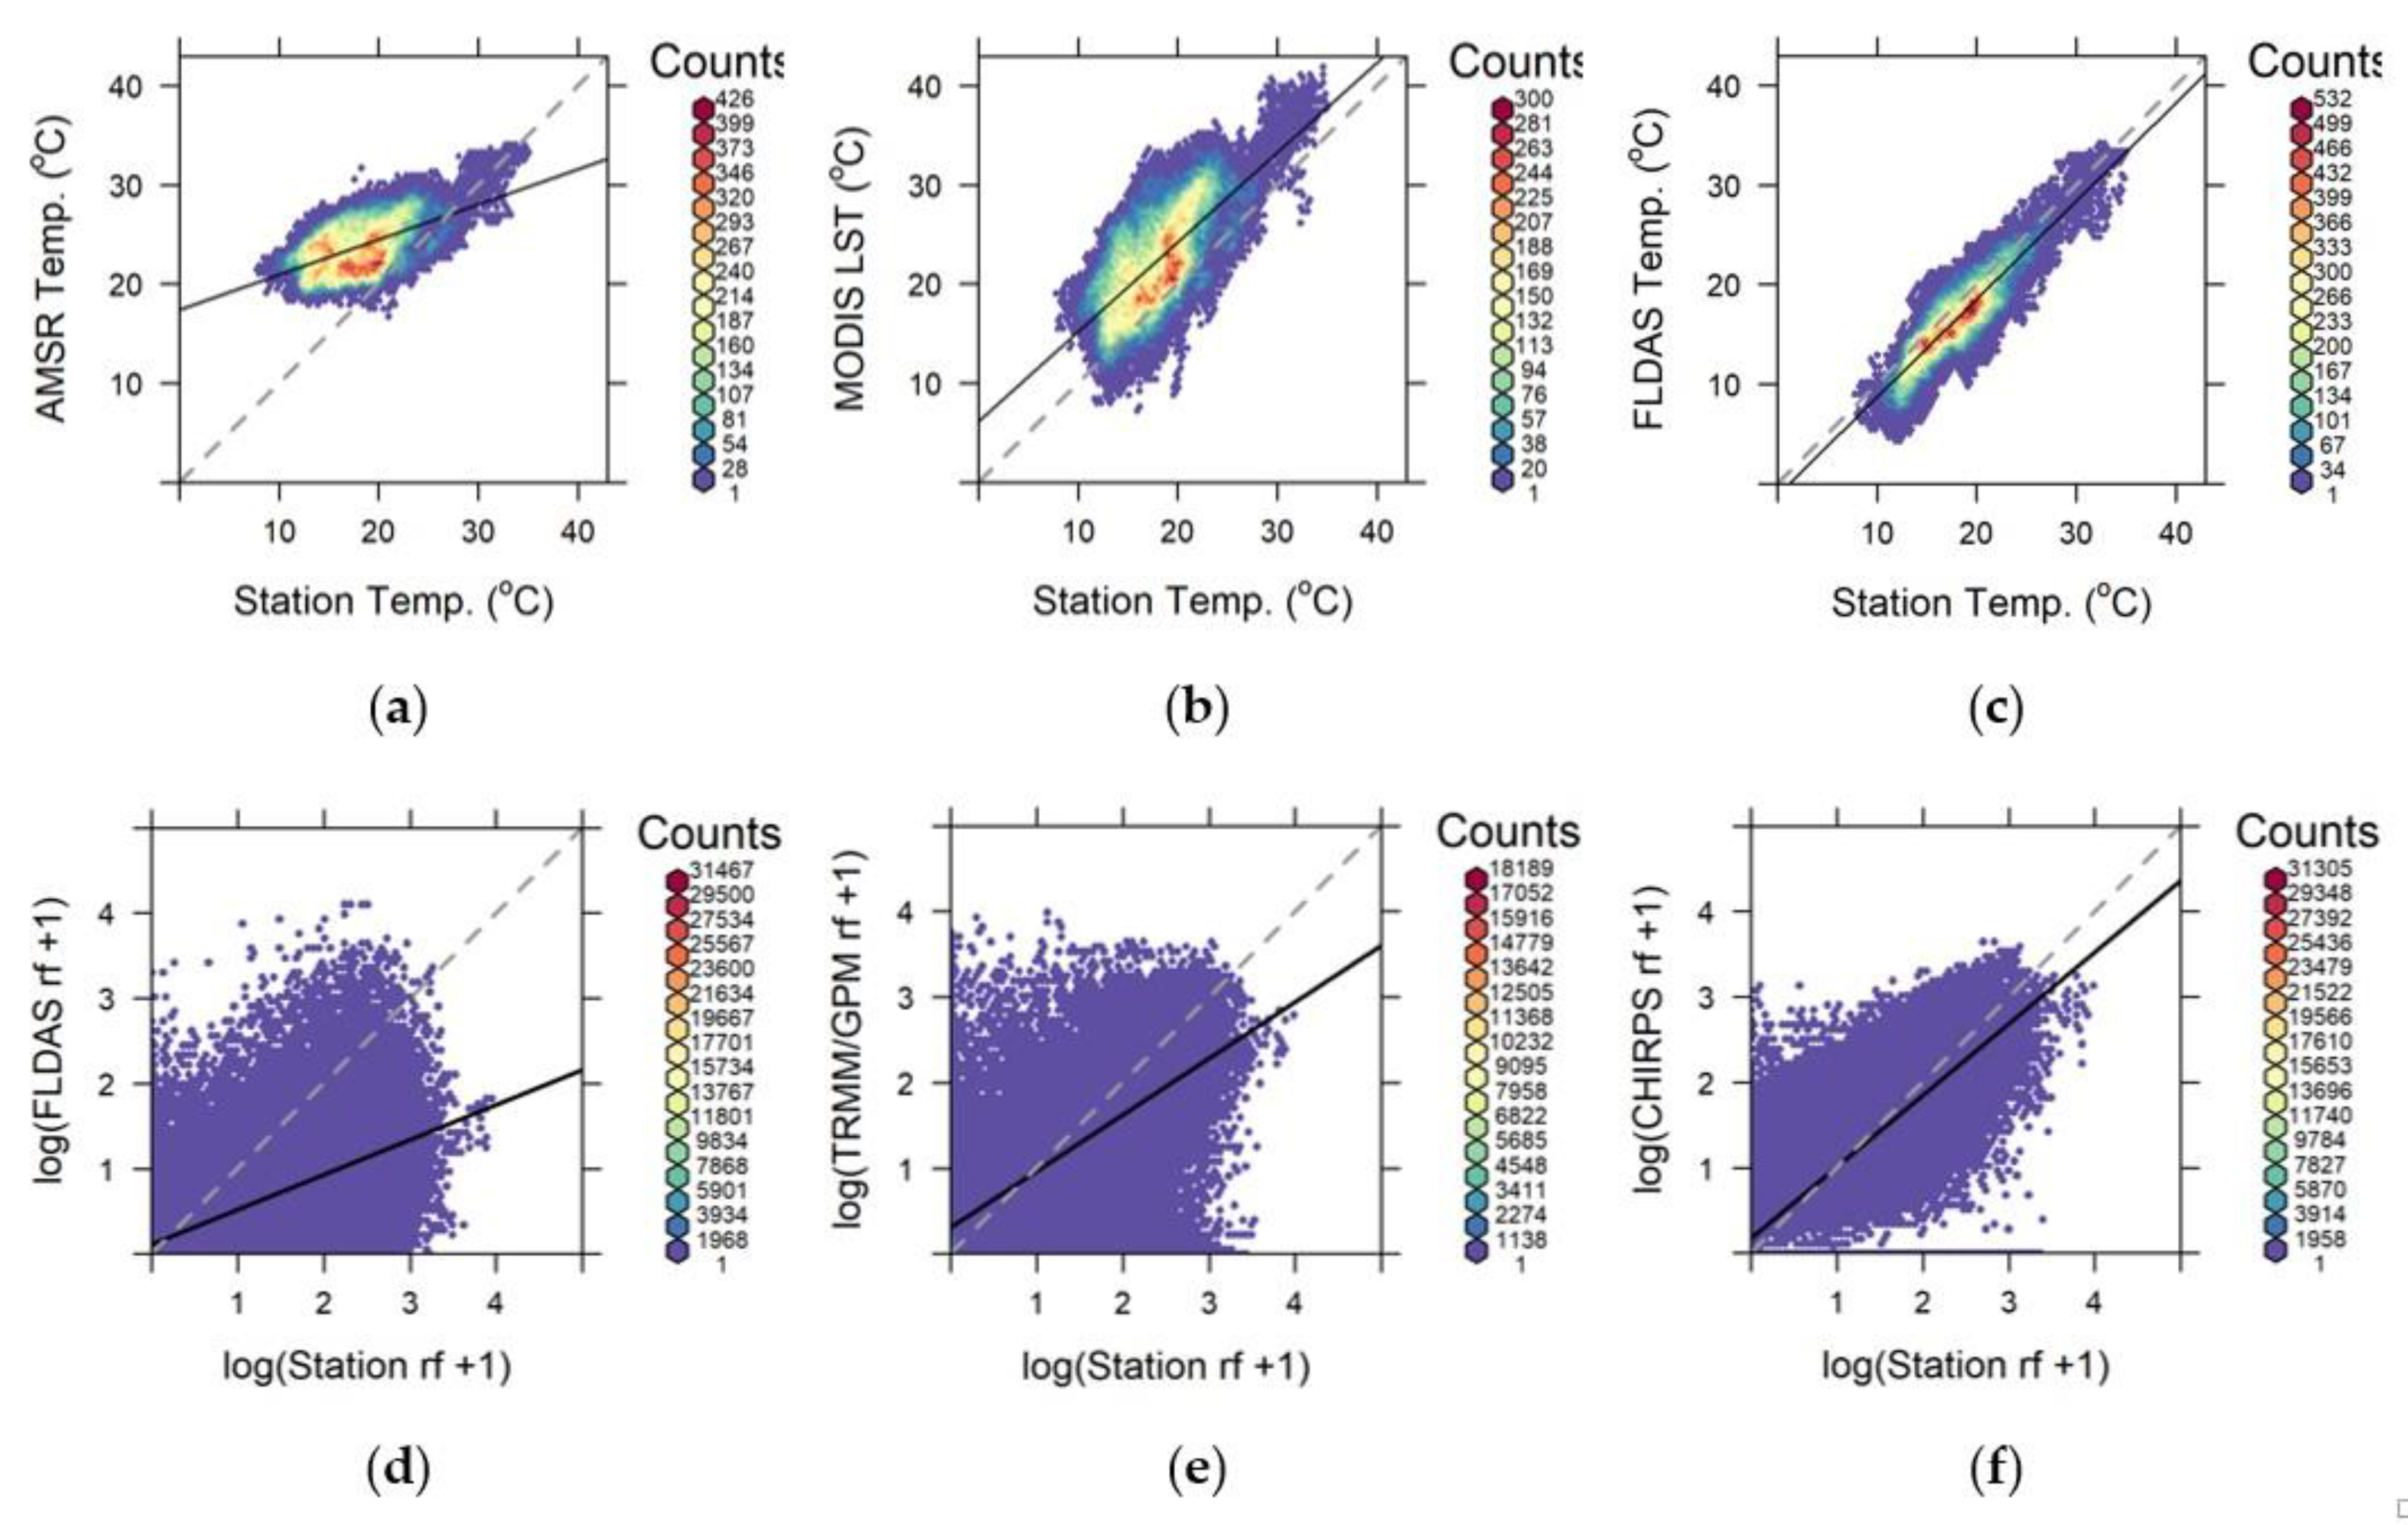
3.2. Station and Satellite/Reanalysis Datasets’ Binned Scatterplots
3.3. Accuracy Statistics
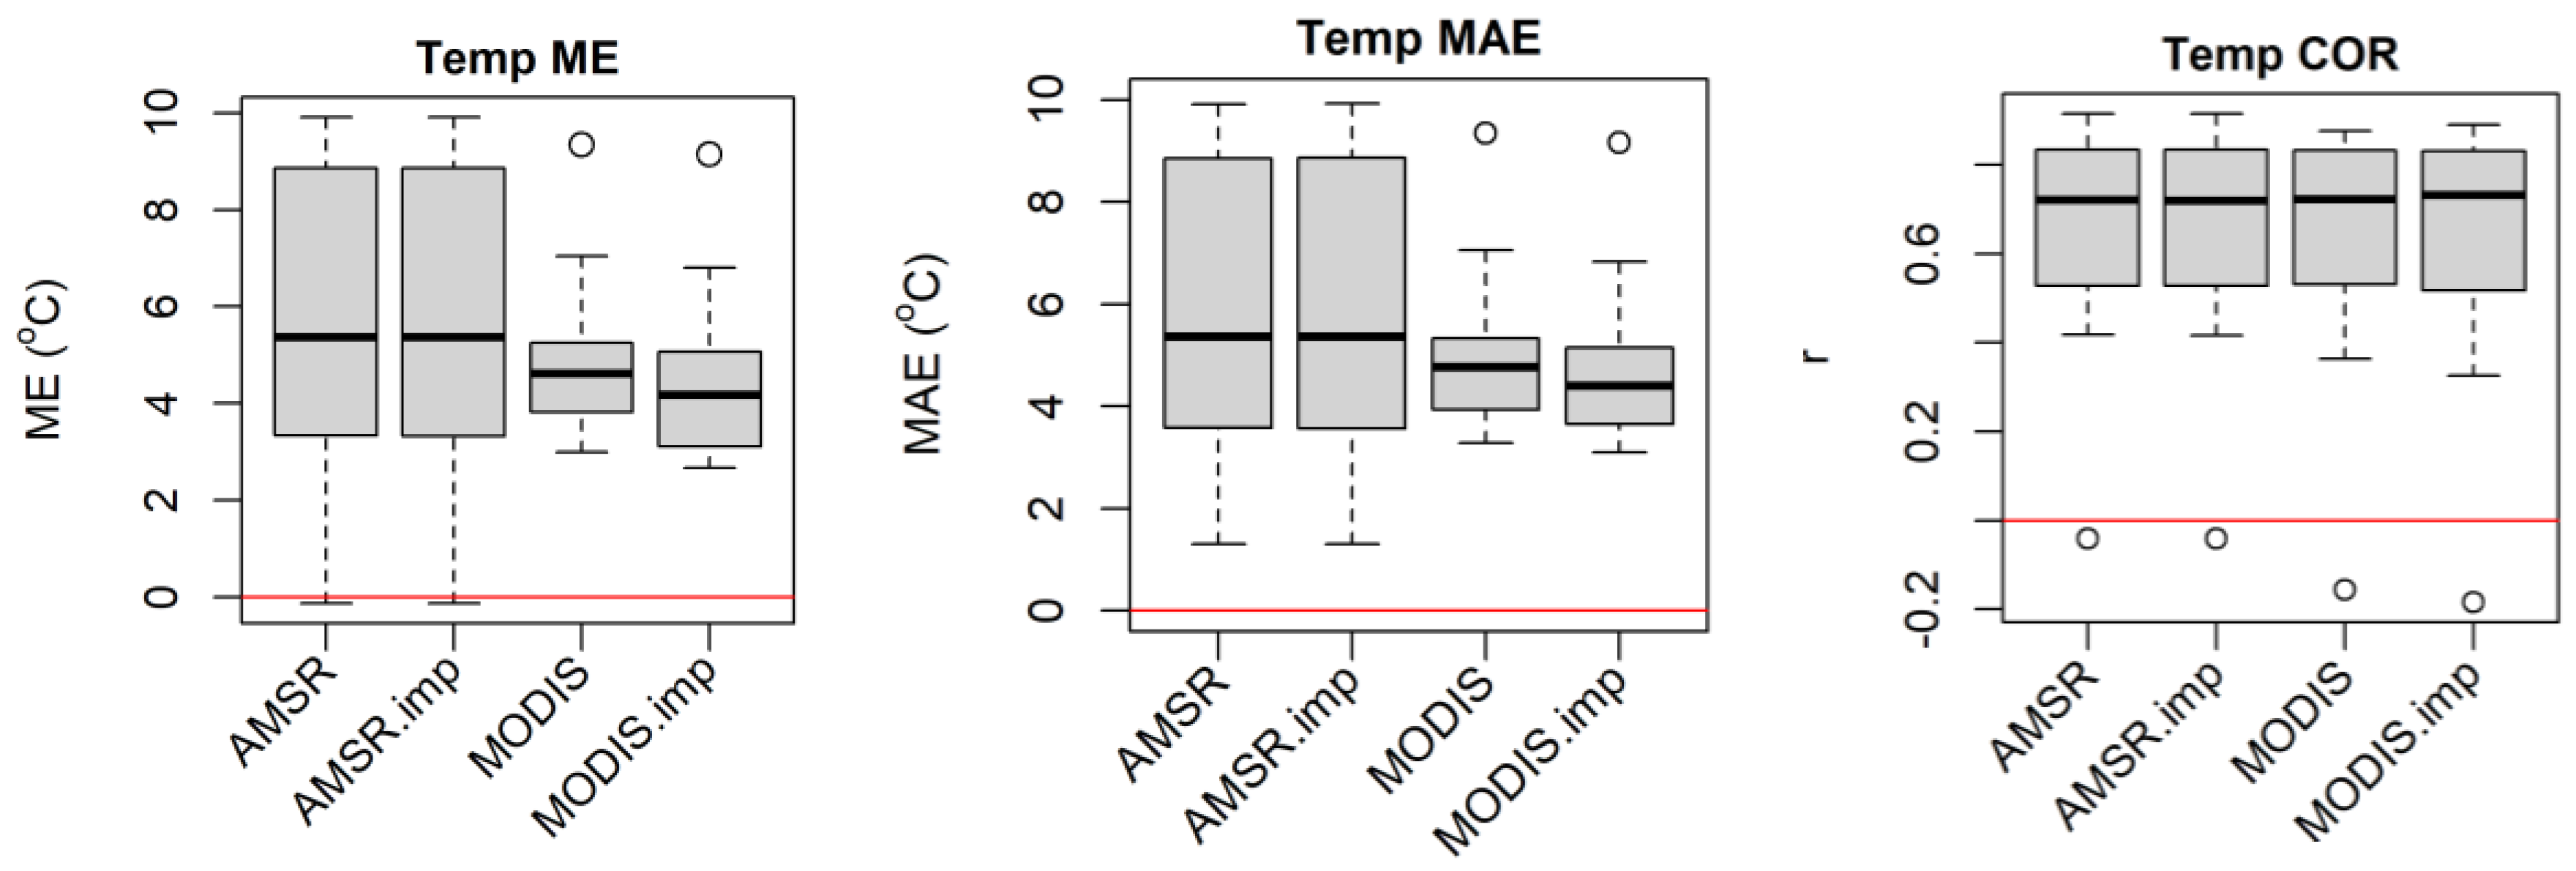
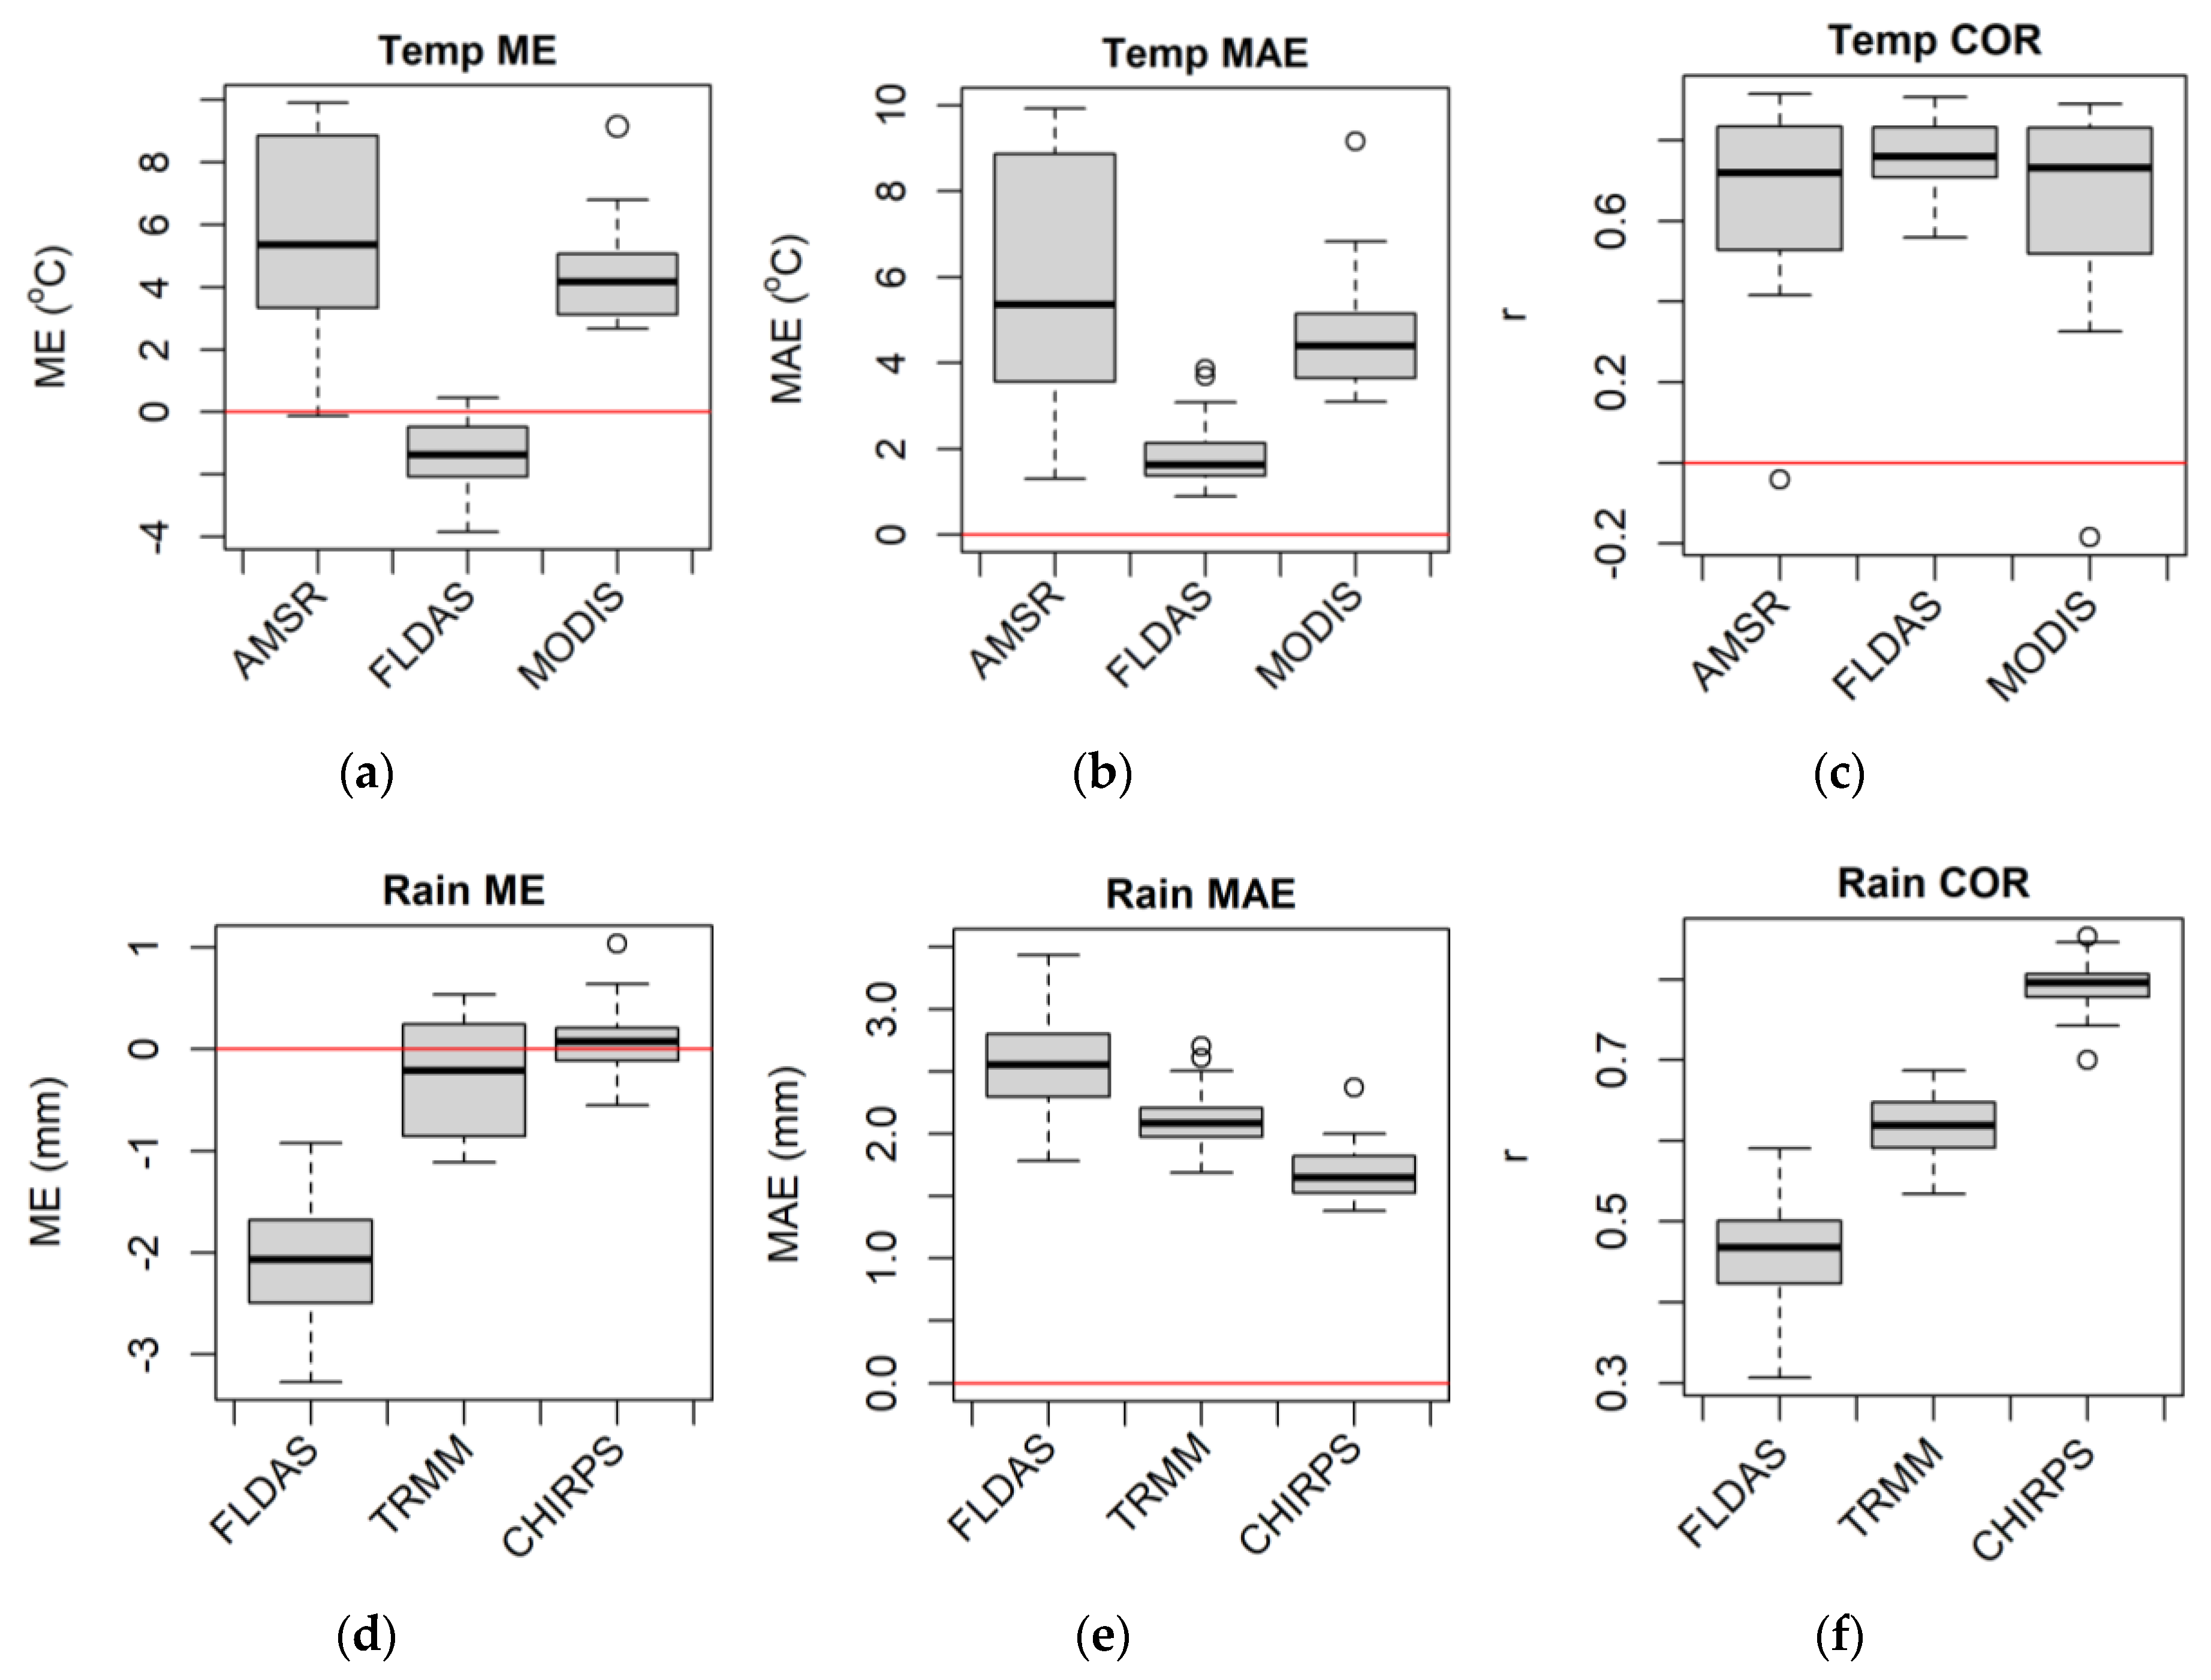
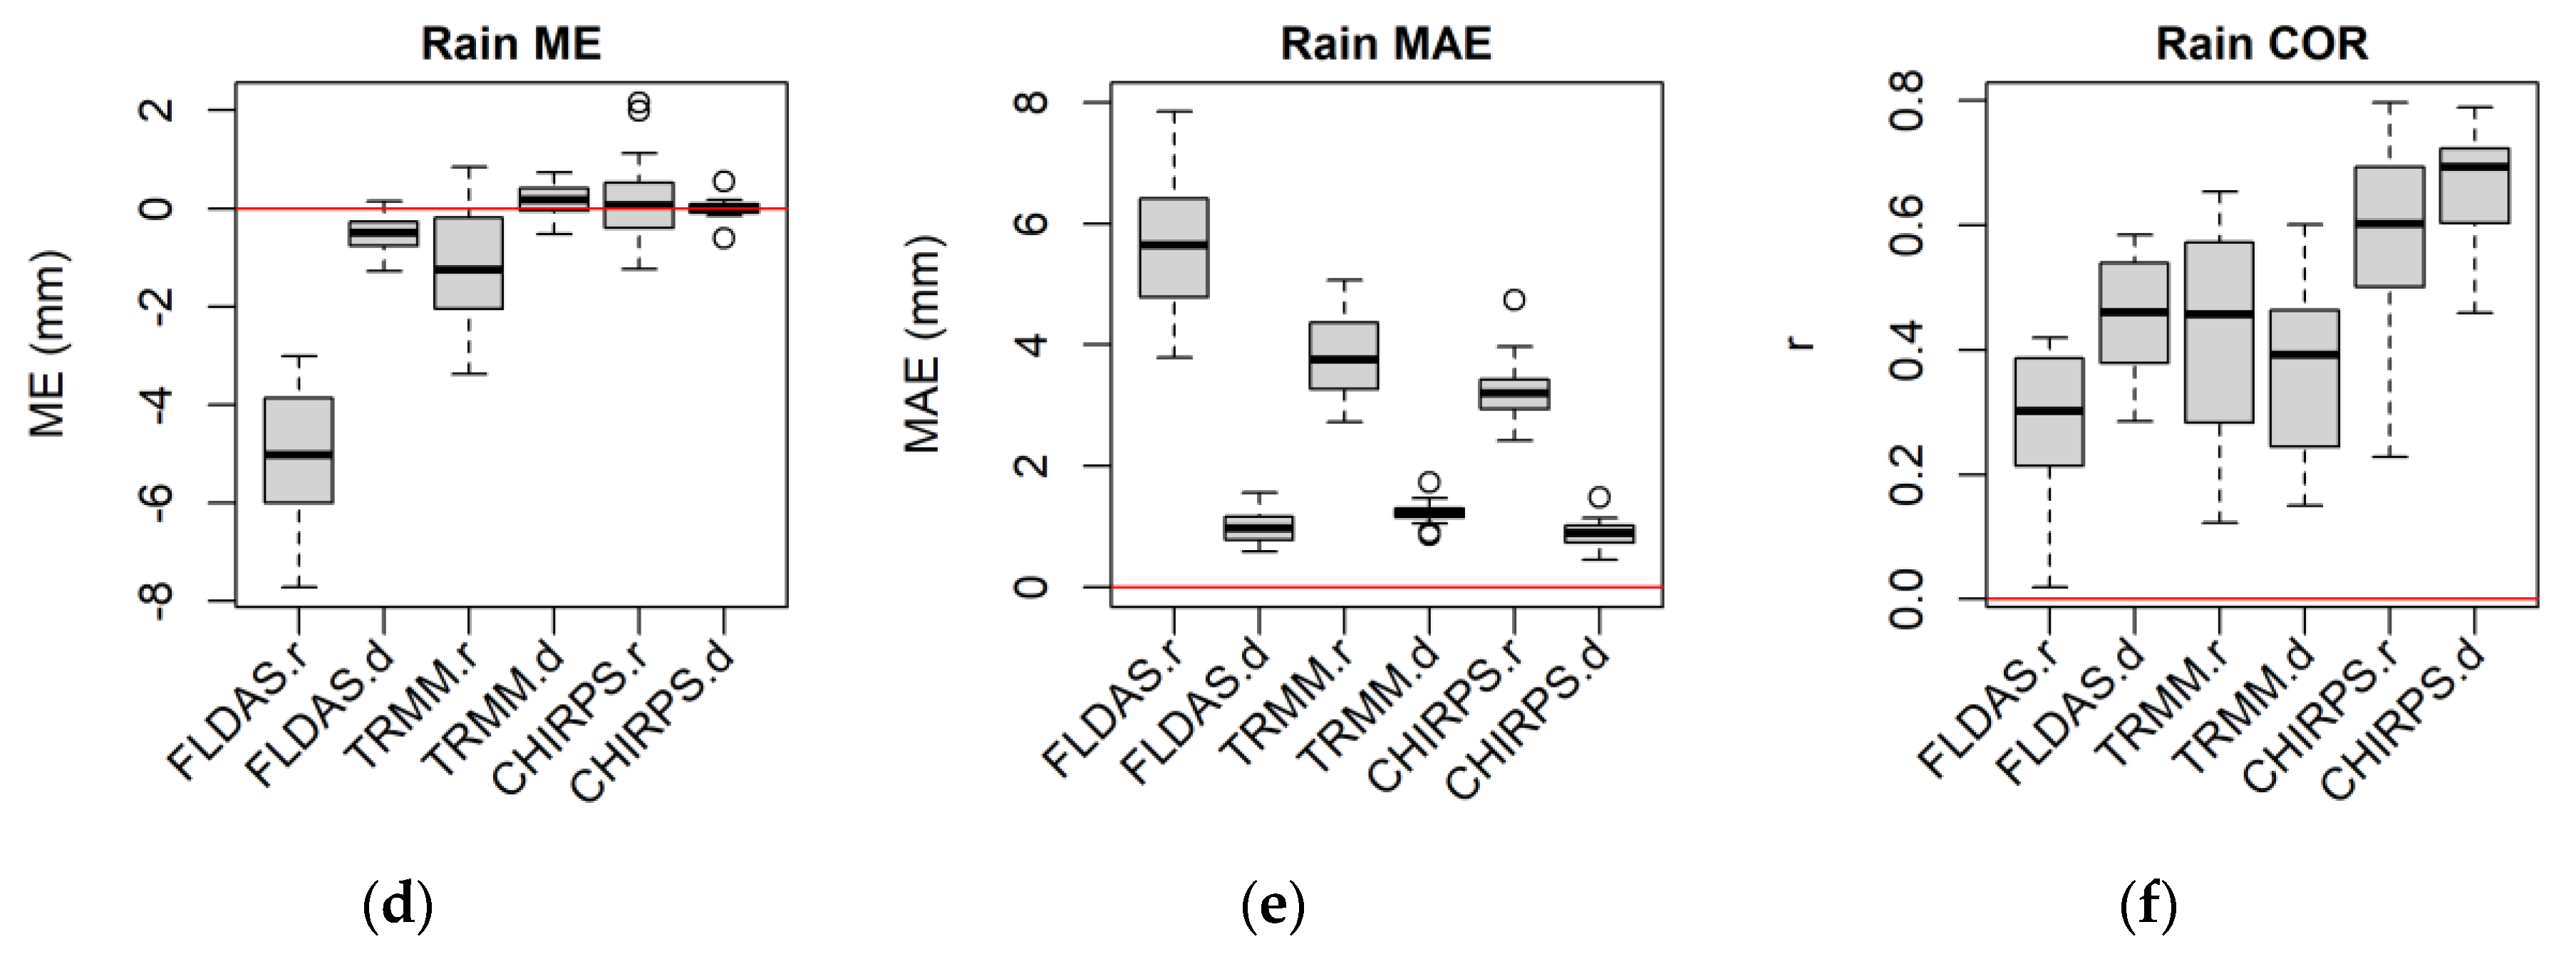
3.3.1. Box Plots
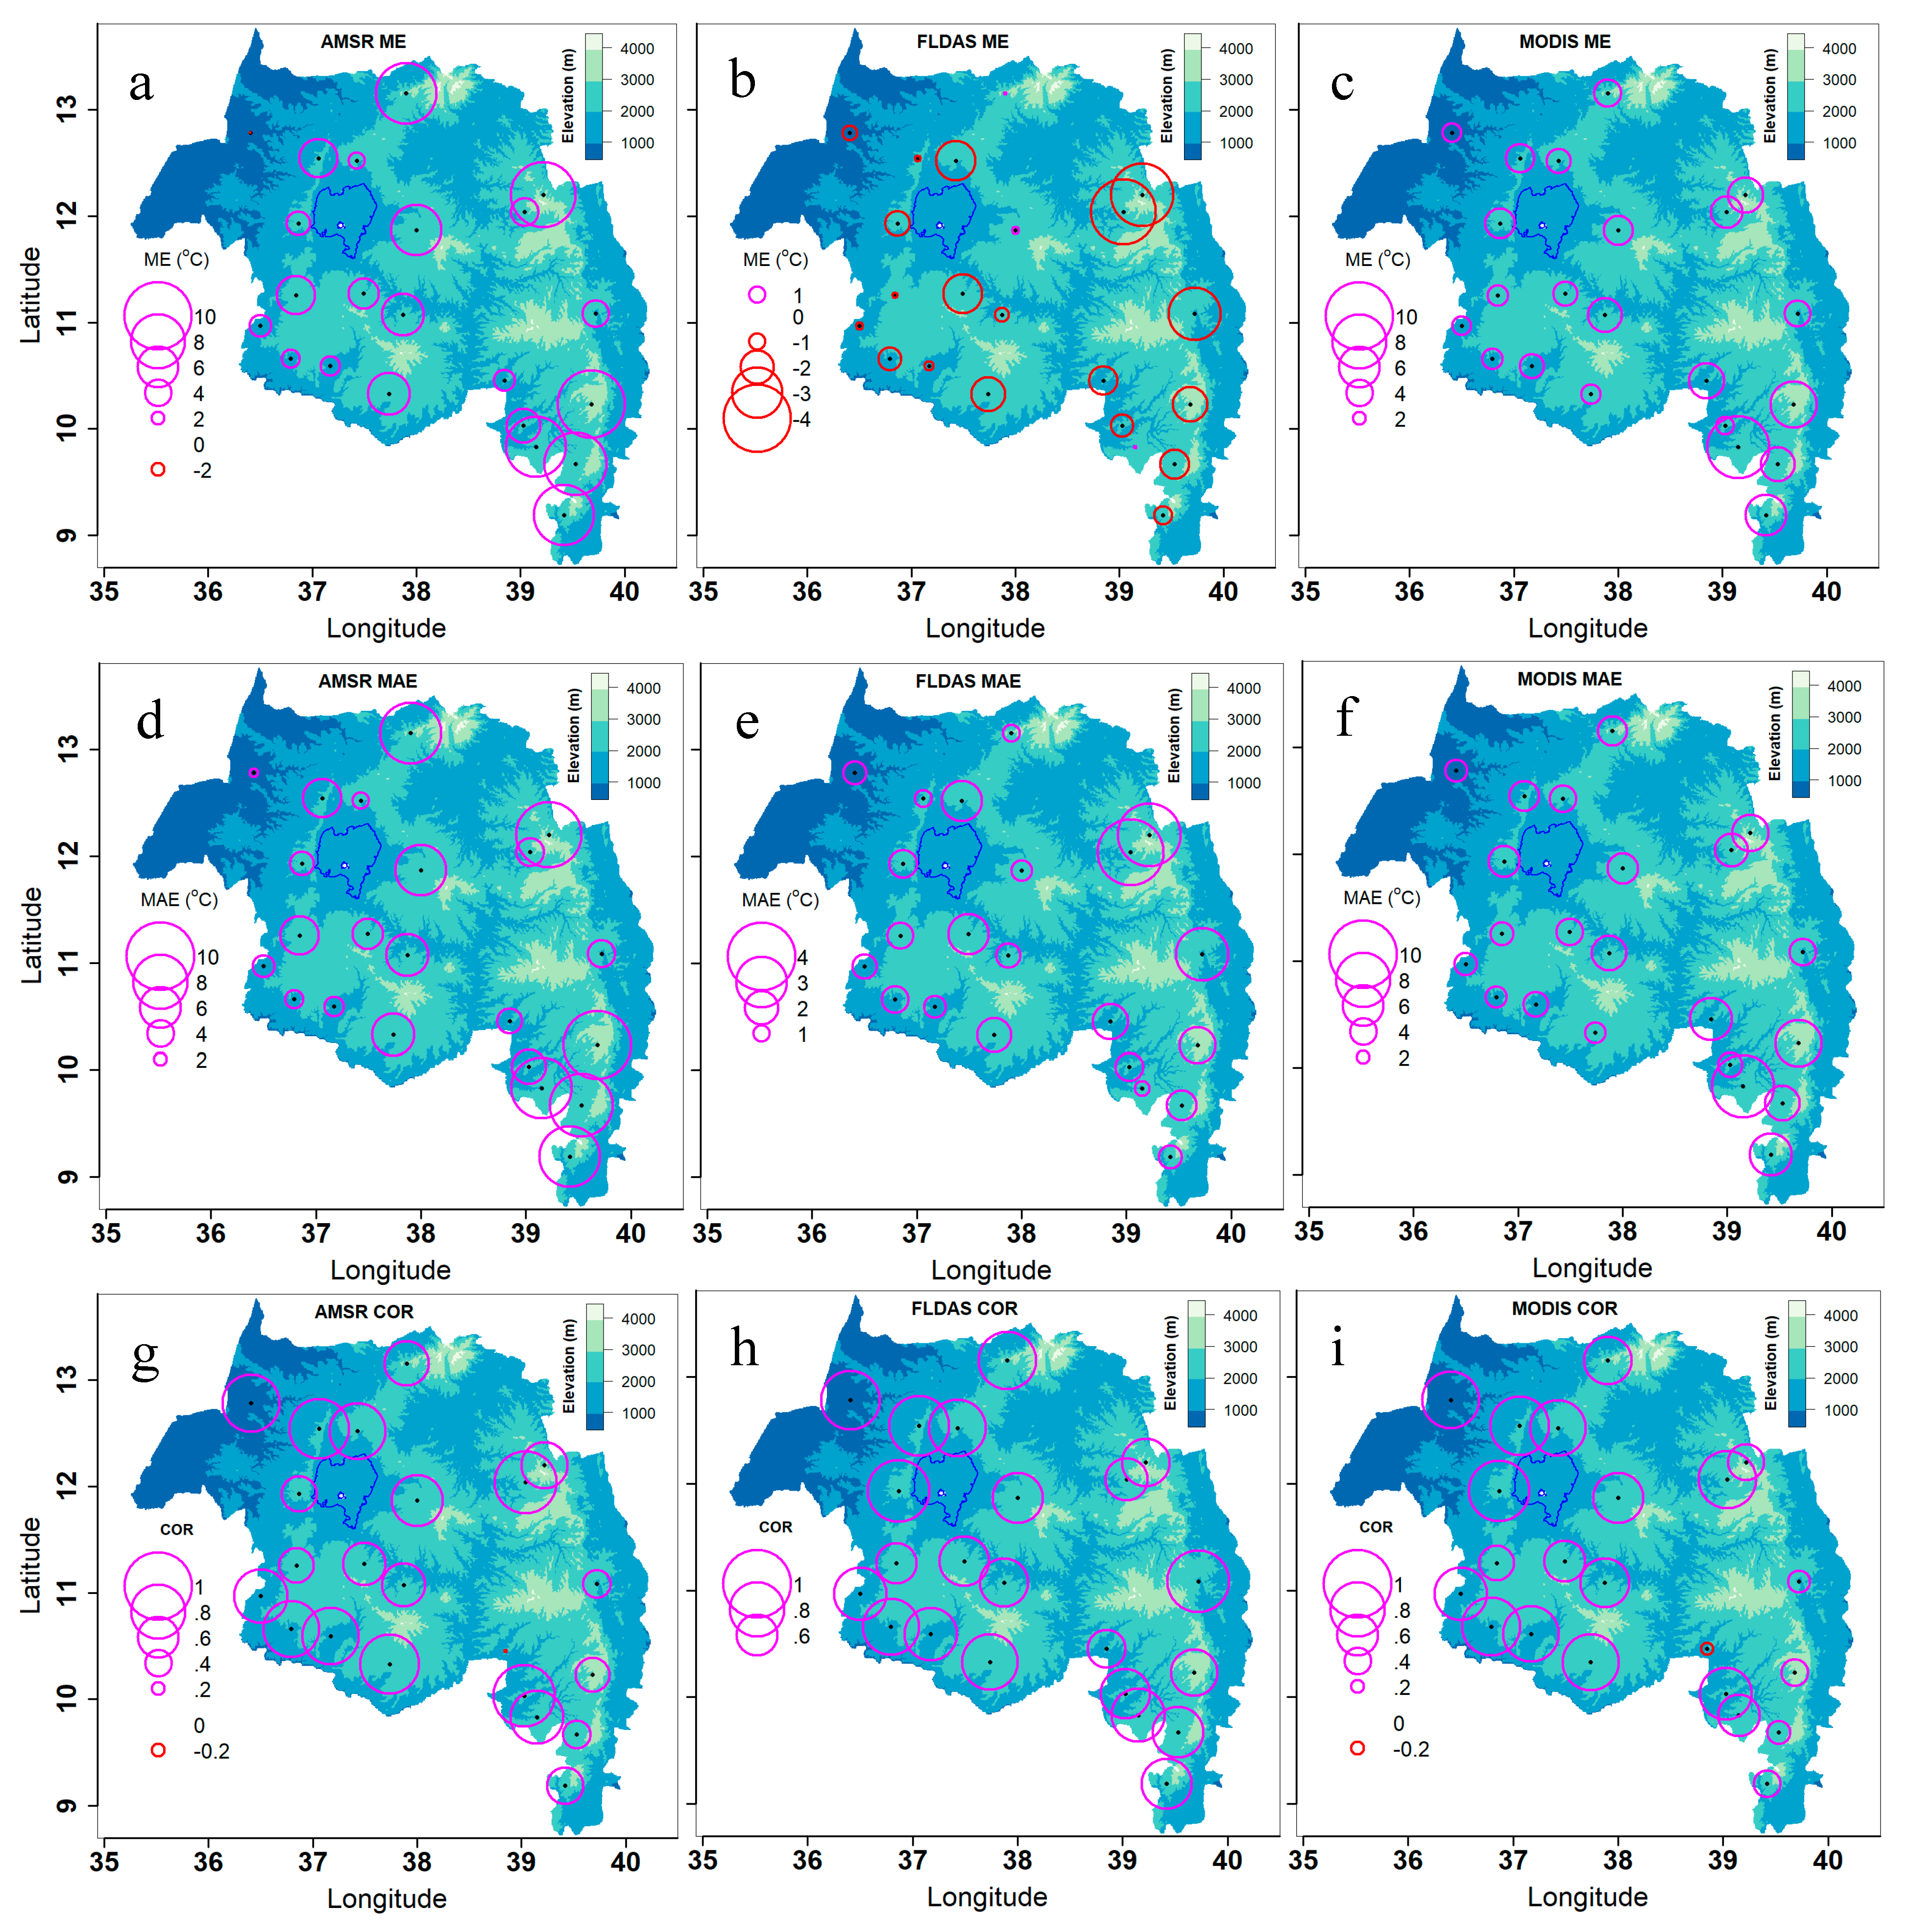
3.3.2. Spatial Distribution of Accuracy Statistics
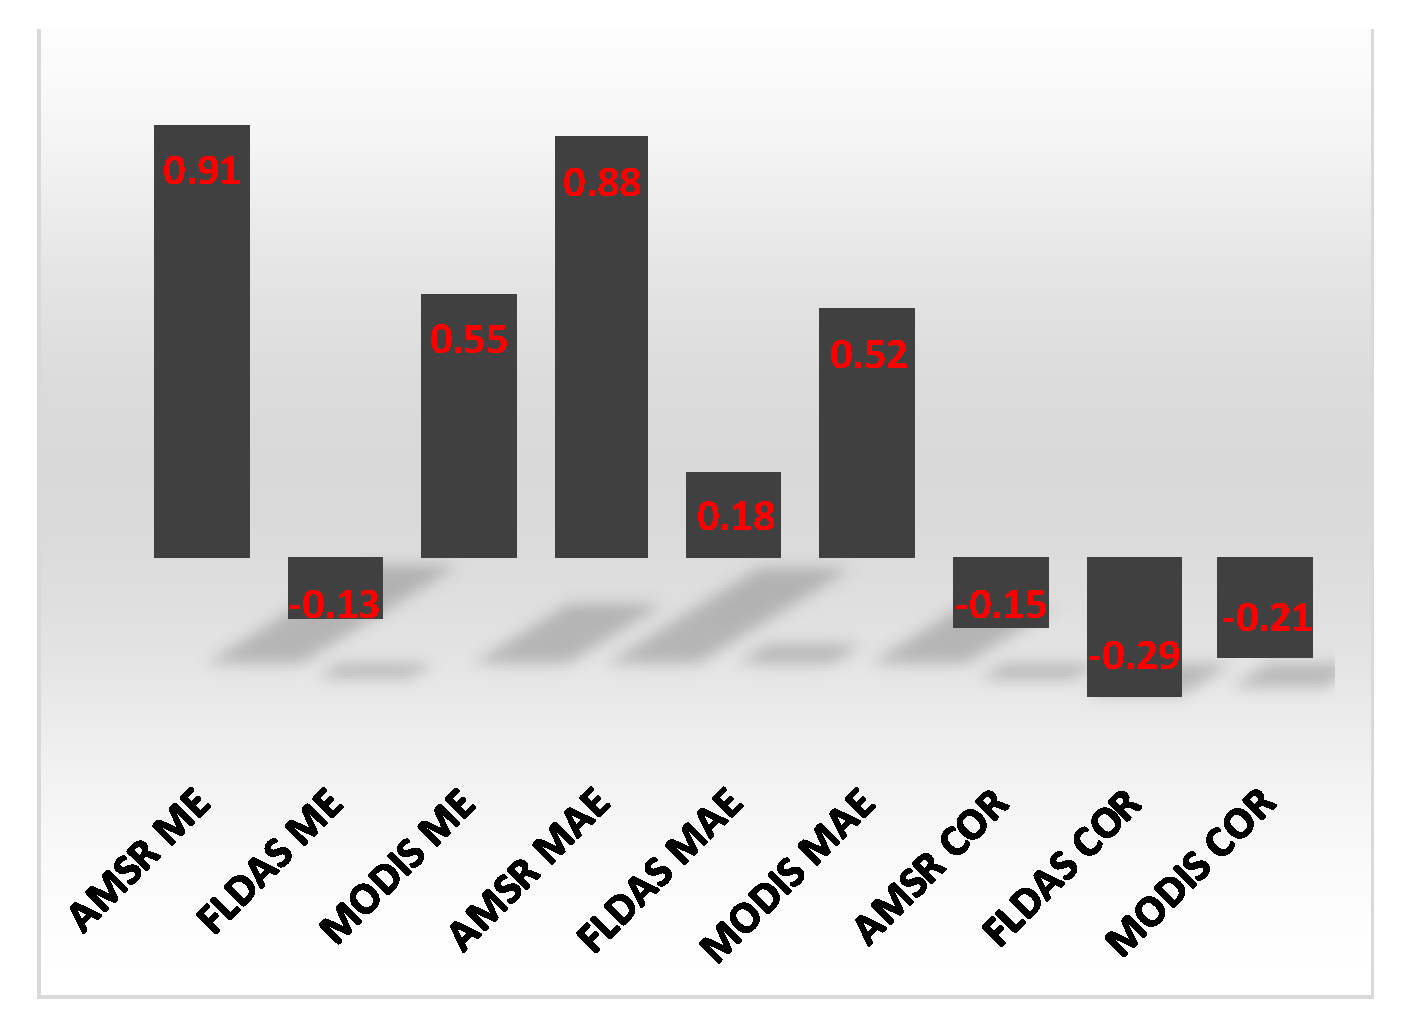
3.3.3. Accuracy Statistics Seasonal Distributions
4. Conclusions and Recommendations
Author Contributions
Funding
Conflicts of Interest
References
- Jima, D.; Getachew, A.; Bilak, H.; Steketee, R.W.; Emerson, P.M.; Graves, P.M. Malaria indicator survey 2007, Ethiopia: Coverage and use of major malaria prevention and control interventions. Malar. J. 2010, 9. [Google Scholar] [CrossRef]
- Ayele, D.G.; Zewotir, T.T.; Mwambi, H.G. Prevalence and risk factors of malaria in Ethiopia. Malar. J. 2012, 11, 195. [Google Scholar] [CrossRef]
- Midekisa, A.; Beyene, B.; Mihretie, A.; Bayabil, E.; Wimberly, M.C. Seasonal associations of climatic drivers and malaria in the highlands of Ethiopia. Parasit Vectors 2015, 8, 1. [Google Scholar] [CrossRef] [PubMed]
- Wimberly, M.C.; Midekisa, A.; Semuniguse, P.; Teka, H.; Henebry, G.M.; Chuang, T.W.; Senay, G.B. Spatial synchrony of malaria outbreaks in a highland region of Ethiopia. Trop. Med. Intl. Health 2012, 17, 1192–1201. [Google Scholar] [CrossRef] [PubMed]
- Abeku, T.A.; Hay, S.I.; Ochola, S.; Langi, P.; Beard, B.; de Vlas, S.J.; Cox, J. Malaria epidemic early warning and detection in African highlands. Trends Paratisol. 2004, 20, 400–405. [Google Scholar] [CrossRef] [PubMed]
- Ceccato, P.; Ghebremeskel, T.; Jaiteh, M.; Graves, P.M.; Levy, M.; Ghebreselassie, S.; Ogbamariam, A.; Barnston, A.G.; Bell, M.; del Corral, J.; et al. Malaria stratification, climate, and epidemic early warning in Eritrea. Am. J. Trop. Med. Hyg. 2007, 77, 61–68. [Google Scholar] [CrossRef] [PubMed]
- Midekisa, A.; Senay, G.; Henebry, G.M.; Semuniguse, P.; Wimberly, M.C. Remote sensing-based time series models for malaria early warning in the highlands of Ethiopia. Malar. J. 2012, 11, 165. [Google Scholar] [CrossRef] [PubMed]
- Mordecai, E.A.; Caldwell, J.M.; Grossman, M.K.; Lippi, C.A.; Johnson, L.R.; Neira, M.; Rohr, J.R.; Ryan, S.J.; Savage, V.; Shocket, M.S. Thermal biology of mosquito-borne disease. Ecol. Lett. 2019, 22, 1690–1708. [Google Scholar] [CrossRef] [PubMed]
- Lindsay, S.; Martens, W. Malaria in the African highlands: Past, present and future. Bull. World Health Organ. 1998, 76, 33. [Google Scholar]
- Lyon, B.; Dinku, T.; Raman, A.; Thomson, M.C. Temperature suitability for malaria climbing the Ethiopian Highlands. Environ. Res. Lett. 2017, 12, 064015. [Google Scholar] [CrossRef]
- Siraj, A.; Santos-Vega, M.; Bouma, M.; Yadeta, D.; Carrascal, D.R.; Pascual, M. Altitudinal changes in malaria incidence in highlands of Ethiopia and Colombia. Science 2014, 343, 1154–1158. [Google Scholar] [CrossRef] [PubMed]
- Teklehaimanot, H.D.; Lipsitch, M.; Teklehaimanot, A.; Schwartz, J. Weather-based prediction of Plasmodium falciparum malaria in epidemic-prone regions of Ethiopia I. Patterns of lagged weather effects reflect biological mechanisms. Malar. J. 2004, 3, 41. [Google Scholar] [CrossRef] [PubMed][Green Version]
- Smith, M.W.; Macklin, M.G.; Thomas, C.J. Hydrological and geomorphological controls of malaria transmission. Earth-Sci. Rev. 2013, 116, 109–127. [Google Scholar] [CrossRef]
- Paaijmans, K.P.; Wandago, M.O.; Githeko, A.K.; Takken, W. Unexpected High Losses of Anopheles gambiae Larvae Due to Rainfall. PLoS ONE 2007, 2. [Google Scholar] [CrossRef]
- Abeku, T.A.; De Vlas, S.J.; Borsboom, G.; Tadege, A.; Gebreyesus, Y.; Gebreyohannes, H.; Alamirew, D.; Seifu, A.; Nagelkerke, N.J.D.; Habbema, J.D.F. Effects of meteorological factors on epidemic malaria in Ethiopia: A statistical modelling approach based on theoretical reasoning. Parasitology 2004, 128, 585–593. [Google Scholar] [CrossRef]
- Zhou, G.; Minakawa, N.; Githeko, A.K.; Yan, G. Association between climate variability and malaria epidemics in the East African highlands. Proc. Natl. Acad. Sci. USA 2004, 101, 2375–2380. [Google Scholar] [CrossRef]
- Colston, J.M.; Ahmed, T.; Mahopo, C.; Kang, G.; Kosek, M.; de Sousa Junior, F.; Shrestha, P.S.; Svensen, E.; Turab, A.; Zaitchik, B. Evaluating meteorological data from weather stations, and from satellites and global models for a multi-site epidemiological study. Environ. Res. 2018, 165, 91–109. [Google Scholar] [CrossRef]
- Dinku, T.; Ceccato, P.; Grover-Kopec, E.; Lemma, M.; Connor, S.J.; Ropelewski, C.F. Validation of satellite rainfall products over East Africa’s complex topography. Int. J. Remote Sens. 2007, 28, 1503–1526. [Google Scholar] [CrossRef]
- Grover-Kopec, E.; Kawano, M.; Klaver, R.W.; Blumenthal, B.; Ceccato, P.; Connor, S.J. An online operational rainfall-monitoring resource for epidemic malaria early warning systems in Africa. Malar J 2005, 4, 6. [Google Scholar] [CrossRef]
- Vancutsem, C.; Ceccato, P.; Dinku, T.; Connor, S.J. Evaluation of MODIS land surface temperature data to estimate air temperature in different ecosystems over Africa. Remote Sens. Environ. 2010, 114, 449–465. [Google Scholar] [CrossRef]
- Thomson, M.; Connor, S.; Milligan, P.; Flasse, S. Mapping malaria risk in Africa: What can satellite data contribute? Parasitol. Today 1997, 13, 313–318. [Google Scholar] [CrossRef]
- Heaney, A.; Little, E.; Ng, S.; Shaman, J. Meteorological variability and infectious disease in Central Africa: A review of meteorological data quality. Ann. N. Y. Acad. Sci. 2016, 1382, 31. [Google Scholar] [CrossRef] [PubMed]
- Merkord, C.L.; Liu, Y.; Mihretie, A.; Gebrehiwot, T.; Awoke, W.; Bayabil, E.; Henebry, G.M.; Kassa, G.T.; Lake, M.; Wimberly, M.C. Integrating malaria surveillance with climate data for outbreak detection and forecasting: The EPIDEMIA system. Malar. J. 2017, 16, 89. [Google Scholar] [CrossRef] [PubMed]
- Liu, Y.; Hu, J.; Snell-Feikema, I.; VanBemmel, M.S.; Lamsal, A.; Wimberly, M.C. Software to facilitate remote sensing data access for disease early warning systems. Environ. Modell. Softw. 2015, 74, 247–257. [Google Scholar] [CrossRef]
- Davis, J.K.; Gebrehiwot, T.; Lake, M.; Awoke, W.; Mihretie, A.; Nekorchuk, D.; Wimberly, M.C. A genetic algorithm for identifying spatially-varying environmental drivers in a malaria time series model. Environ. Modell. Softw. 2019, 119, 275–284. [Google Scholar] [CrossRef]
- Hirpa, F.A.; Gebremichael, M.; Hopson, T. Evaluation of High-Resolution Satellite Precipitation Products over Very Complex Terrain in Ethiopia. J Appl Meteorol Climatol 2010, 49, 1044–1051. [Google Scholar] [CrossRef]
- Du, J.; Kimball, J.S.; Shi, J.; Jones, L.A.; Wu, S.; Sun, R.; Yang, H. Inter-Calibration of Satellite Passive Microwave Land Observations from AMSR-E and AMSR2 Using Overlapping FY3B-MWRI Sensor Measurements. Remote Sens. 2014, 6, 8594–8616. [Google Scholar] [CrossRef]
- Funk, C.; Peterson, P.; Landsfeld, M.; Pedreros, D.; Verdin, J.; Shukla, S.; Husak, G.; Rowland, J.; Harrison, L.; Hoell, A. The climate hazards infrared precipitation with stations—a new environmental record for monitoring extremes. Sci. Data 2015, 2, 1–21. [Google Scholar] [CrossRef]
- McNally, A.; Arsenault, K.; Kumar, S.; Shukla, S.; Peterson, P.; Wang, S.; Funk, C.; Peters-Lidard, C.D.; Verdin, J.P. A land data assimilation system for sub-Saharan Africa food and water security applications. Sci. Data 2017, 4, 170012. [Google Scholar] [CrossRef]
- Alemu, W.G.; Henebry, G.M. Characterizing Cropland Phenology in Major Grain Production Areas of Russia, Ukraine, and Kazakhstan by the Synergistic Use of Passive Microwave and Visible to Near Infrared Data. Remote Sens. 2016, 8, 1016. [Google Scholar] [CrossRef]
- Alemu, W.G.; Henebry, G.M. Land Surface Phenology and Seasonality Using Cool Earthlight in Croplands of Eastern Africa and the Linkages to Crop Production. Remote Sens. 2017, 9, 914. [Google Scholar] [CrossRef]
- Alemu, W.G.; Henebry, G.M. Comparing Passive Microwave with Visible-To-Near-Infrared Phenometrics in Croplands of Northern Eurasia. Remote Sens. 2017, 9, 613. [Google Scholar] [CrossRef]
- Rantou, C.E. Missing Data in Time Series and Imputation Methods. 2017. Available online: http://hellanicus.lib.aegean.gr/bitstream/handle/11610/17202/Missing_Data_in_Time_Series_and_Imputation_methods.pdf?sequence=1 (accessed on 20 February 2020).
- Moritz, S.; Bartz-Beielstein, T. imputeTS: Time series missing value imputation in R. R J. 2017, 9, 207–218. [Google Scholar] [CrossRef]
- Lewin-Koh, N. Hexagon binning: An overview, 2011. Available online: https://cran.r-project.org/web/packages/hexbin/vignettes/hexagon_binning.pdf (accessed on 20 February 2020).
- Carr, D.; Pebesma, M.E. Hexagonal Binning Routines, 2019. Available online: https://cran.r-project.org/web/packages/hexbin/index.html (accessed on 20 February 2020).
- Carr, D.B. Looking at Large Data Sets Using Binned Data Plots; Pacific Northwest Lab.: Richland, WA, USA, 1990.
- Wilkinson, L.; Anand, A.; Grossman, R. Graph-theoretic scagnostics. In Proceedings of the IEEE Symposium on Information Visualization, Minneapolis, MN, USA, 23–28 October 2005; pp. 157–164. [Google Scholar]
- Dinku, T.; Funk, C.; Peterson, P.; Maidment, R.; Tadesse, T.; Gadain, H.; Ceccato, P. Validation of the CHIRPS Satellite Rainfall Estimates over Eastern of Africa. Q. J. R. Meteorol. Soc. 2018, 144, 292–312. [Google Scholar] [CrossRef]
- Duan, Z.; Liu, J.; Tuo, Y.; Chiogna, G.; Disse, M. Evaluation of eight high spatial resolution gridded precipitation products in Adige Basin (Italy) at multiple temporal and spatial scales. Sci. Total Environ. 2016, 573, 1536–1553. [Google Scholar] [CrossRef]
- Bayissa, Y.; Tadesse, T.; Demisse, G.; Shiferaw, A. Evaluation of satellite-based rainfall estimates and application to monitor meteorological drought for the Upper Blue Nile Basin, Ethiopia. Remote Sens. 2017, 9, 669. [Google Scholar] [CrossRef]
- Sahlu, D.; Moges, S.A.; Nikolopoulos, E.I.; Anagnostou, E.N.; Hailu, D. Evaluation of high-resolution multisatellite and reanalysis rainfall products over East Africa. Adv. Meteorol. 2017, 2017, 4957960. [Google Scholar] [CrossRef]
- Romilly, T.G.; Gebremichael, M. Evaluation of satellite rainfall estimates over Ethiopian river basins. Hydrol. Earth Syst. Sci. 2011, 15, 1505–1514. [Google Scholar] [CrossRef]
- Awange, J.L.; Hu, K.X.; Khaki, M. The newly merged satellite remotely sensed, gauge and reanalysis-based Multi-Source Weighted-Ensemble Precipitation: Evaluation over Australia and Africa (1981–2016). Sci. Total Environ. 2019, 670, 448–465. [Google Scholar] [CrossRef]
- Mildrexler, D.J.; Zhao, M.; Running, S.W. A global comparison between station air temperatures and MODIS land surface temperatures reveals the cooling role of forests. J. Geophys. Res.: Biogeosci. 2011, 116. [Google Scholar] [CrossRef]
- Tang, Y.; Wen, X.; Sun, X.; Wang, H. Interannual variation of the Bowen ratio in a subtropical coniferous plantation in southeast China, 2003-2012. PLoS ONE 2014, 9, e88267. [Google Scholar] [CrossRef] [PubMed]
- Dinku, T.; Thomson, M.C.; Cousin, R.; del Corral, J.; Ceccato, P.; Hansen, J.; Connor, S.J. Enhancing National Climate Services (ENACTS) for development in Africa. Clim. Dev. 2018, 10, 664–672. [Google Scholar] [CrossRef]


| SN | Station Name | Long | Latitude | Elevation |
|---|---|---|---|---|
| 1 | Metema | 36.41 | 12.78 | 790 |
| 2 | Chagni | 36.50 | 10.97 | 1614 |
| 3 | Ayehu | 36.79 | 10.66 | 1771 |
| 4 | Dangila | 36.85 | 11.25 | 2116 |
| 5 | Shahura | 36.87 | 11.93 | 2205 |
| 6 | Aykel | 37.06 | 12.54 | 2254 |
| 7 | Lay Birr (SF) | 37.17 | 10.59 | 1707 |
| 8 | Gondar A.P. | 37.43 | 12.52 | 1973 |
| 9 | Adet | 37.49 | 11.27 | 2179 |
| 10 | Debre Markos | 37.74 | 10.33 | 2446 |
| 11 | Motta | 37.87 | 11.07 | 2417 |
| 12 | Debark | 37.90 | 13.16 | 2836 |
| 13 | Debre Tabor | 38.00 | 11.87 | 2612 |
| 14 | Majete | 38.85 | 10.45 | 2000 |
| 15 | Alem Ketema | 39.03 | 10.03 | 2280 |
| 16 | Lalibela | 39.04 | 12.04 | 2487 |
| 17 | Enewari | 39.15 | 9.83 | 2561 |
| 18 | Amba mariam | 39.22 | 12.2 | 2990 |
| 19 | Shola Gebeya | 39.42 | 9.19 | 2500 |
| 20 | Debre Berhan | 39.53 | 9.67 | 2750 |
| 21 | Mehal Meda (RS) | 39.68 | 10.23 | 3084 |
| 22 | Combolcha | 39.72 | 11.09 | 1857 |
| SN. | Dataset | Version | Spatial Resolution | Temporal Resolution | |
|---|---|---|---|---|---|
| Data | Data Variables | ||||
| 1 | AMSR ¹ | Air temperature (ta; ~2 m height) | 2.0 | 25 km | Daily (max and min) |
| 2 | FLDAS ² | Air Temperature (ta) | - | 10 km | Daily |
| Rainfall (rf) | - | 10 km | Daily | ||
| 3 | CHIRPS ³ | Rainfall | 2.0 | 5km | Daily |
| 4 | MODIS ⁴ | MYD11A1 (Land-Surface Temperature—LST) | Collection 6 | 1 km | Daily (max and min) |
| 5 | GPM ⁵ | Rainfall | 06 | 10 km | Daily |
| 6 | Met station | Temperature | - | - | Daily (max and min) |
| Rainfall | - | - | Daily | ||
| Statistical Metric | Equation | Range | Unit | Optimal Value |
|---|---|---|---|---|
| Mean error (ME) | −∞ to ∞ | °C or mm | 0 | |
| Mean absolute error (MAE) | 0 to ∞ | °C or mm | 0 | |
| Correlation coefficient (r) | −1 to 1 | None | 1 |
© 2020 by the authors. Licensee MDPI, Basel, Switzerland. This article is an open access article distributed under the terms and conditions of the Creative Commons Attribution (CC BY) license (http://creativecommons.org/licenses/by/4.0/).
Share and Cite
Alemu, W.G.; Wimberly, M.C. Evaluation of Remotely Sensed and Interpolated Environmental Datasets for Vector-Borne Disease Monitoring Using In Situ Observations over the Amhara Region, Ethiopia. Sensors 2020, 20, 1316. https://doi.org/10.3390/s20051316
Alemu WG, Wimberly MC. Evaluation of Remotely Sensed and Interpolated Environmental Datasets for Vector-Borne Disease Monitoring Using In Situ Observations over the Amhara Region, Ethiopia. Sensors. 2020; 20(5):1316. https://doi.org/10.3390/s20051316
Chicago/Turabian StyleAlemu, Woubet G., and Michael C. Wimberly. 2020. "Evaluation of Remotely Sensed and Interpolated Environmental Datasets for Vector-Borne Disease Monitoring Using In Situ Observations over the Amhara Region, Ethiopia" Sensors 20, no. 5: 1316. https://doi.org/10.3390/s20051316
APA StyleAlemu, W. G., & Wimberly, M. C. (2020). Evaluation of Remotely Sensed and Interpolated Environmental Datasets for Vector-Borne Disease Monitoring Using In Situ Observations over the Amhara Region, Ethiopia. Sensors, 20(5), 1316. https://doi.org/10.3390/s20051316