Emphasis Learning, Features Repetition in Width Instead of Length to Improve Classification Performance: Case Study—Alzheimer’s Disease Diagnosis


Abstract
1. Introduction
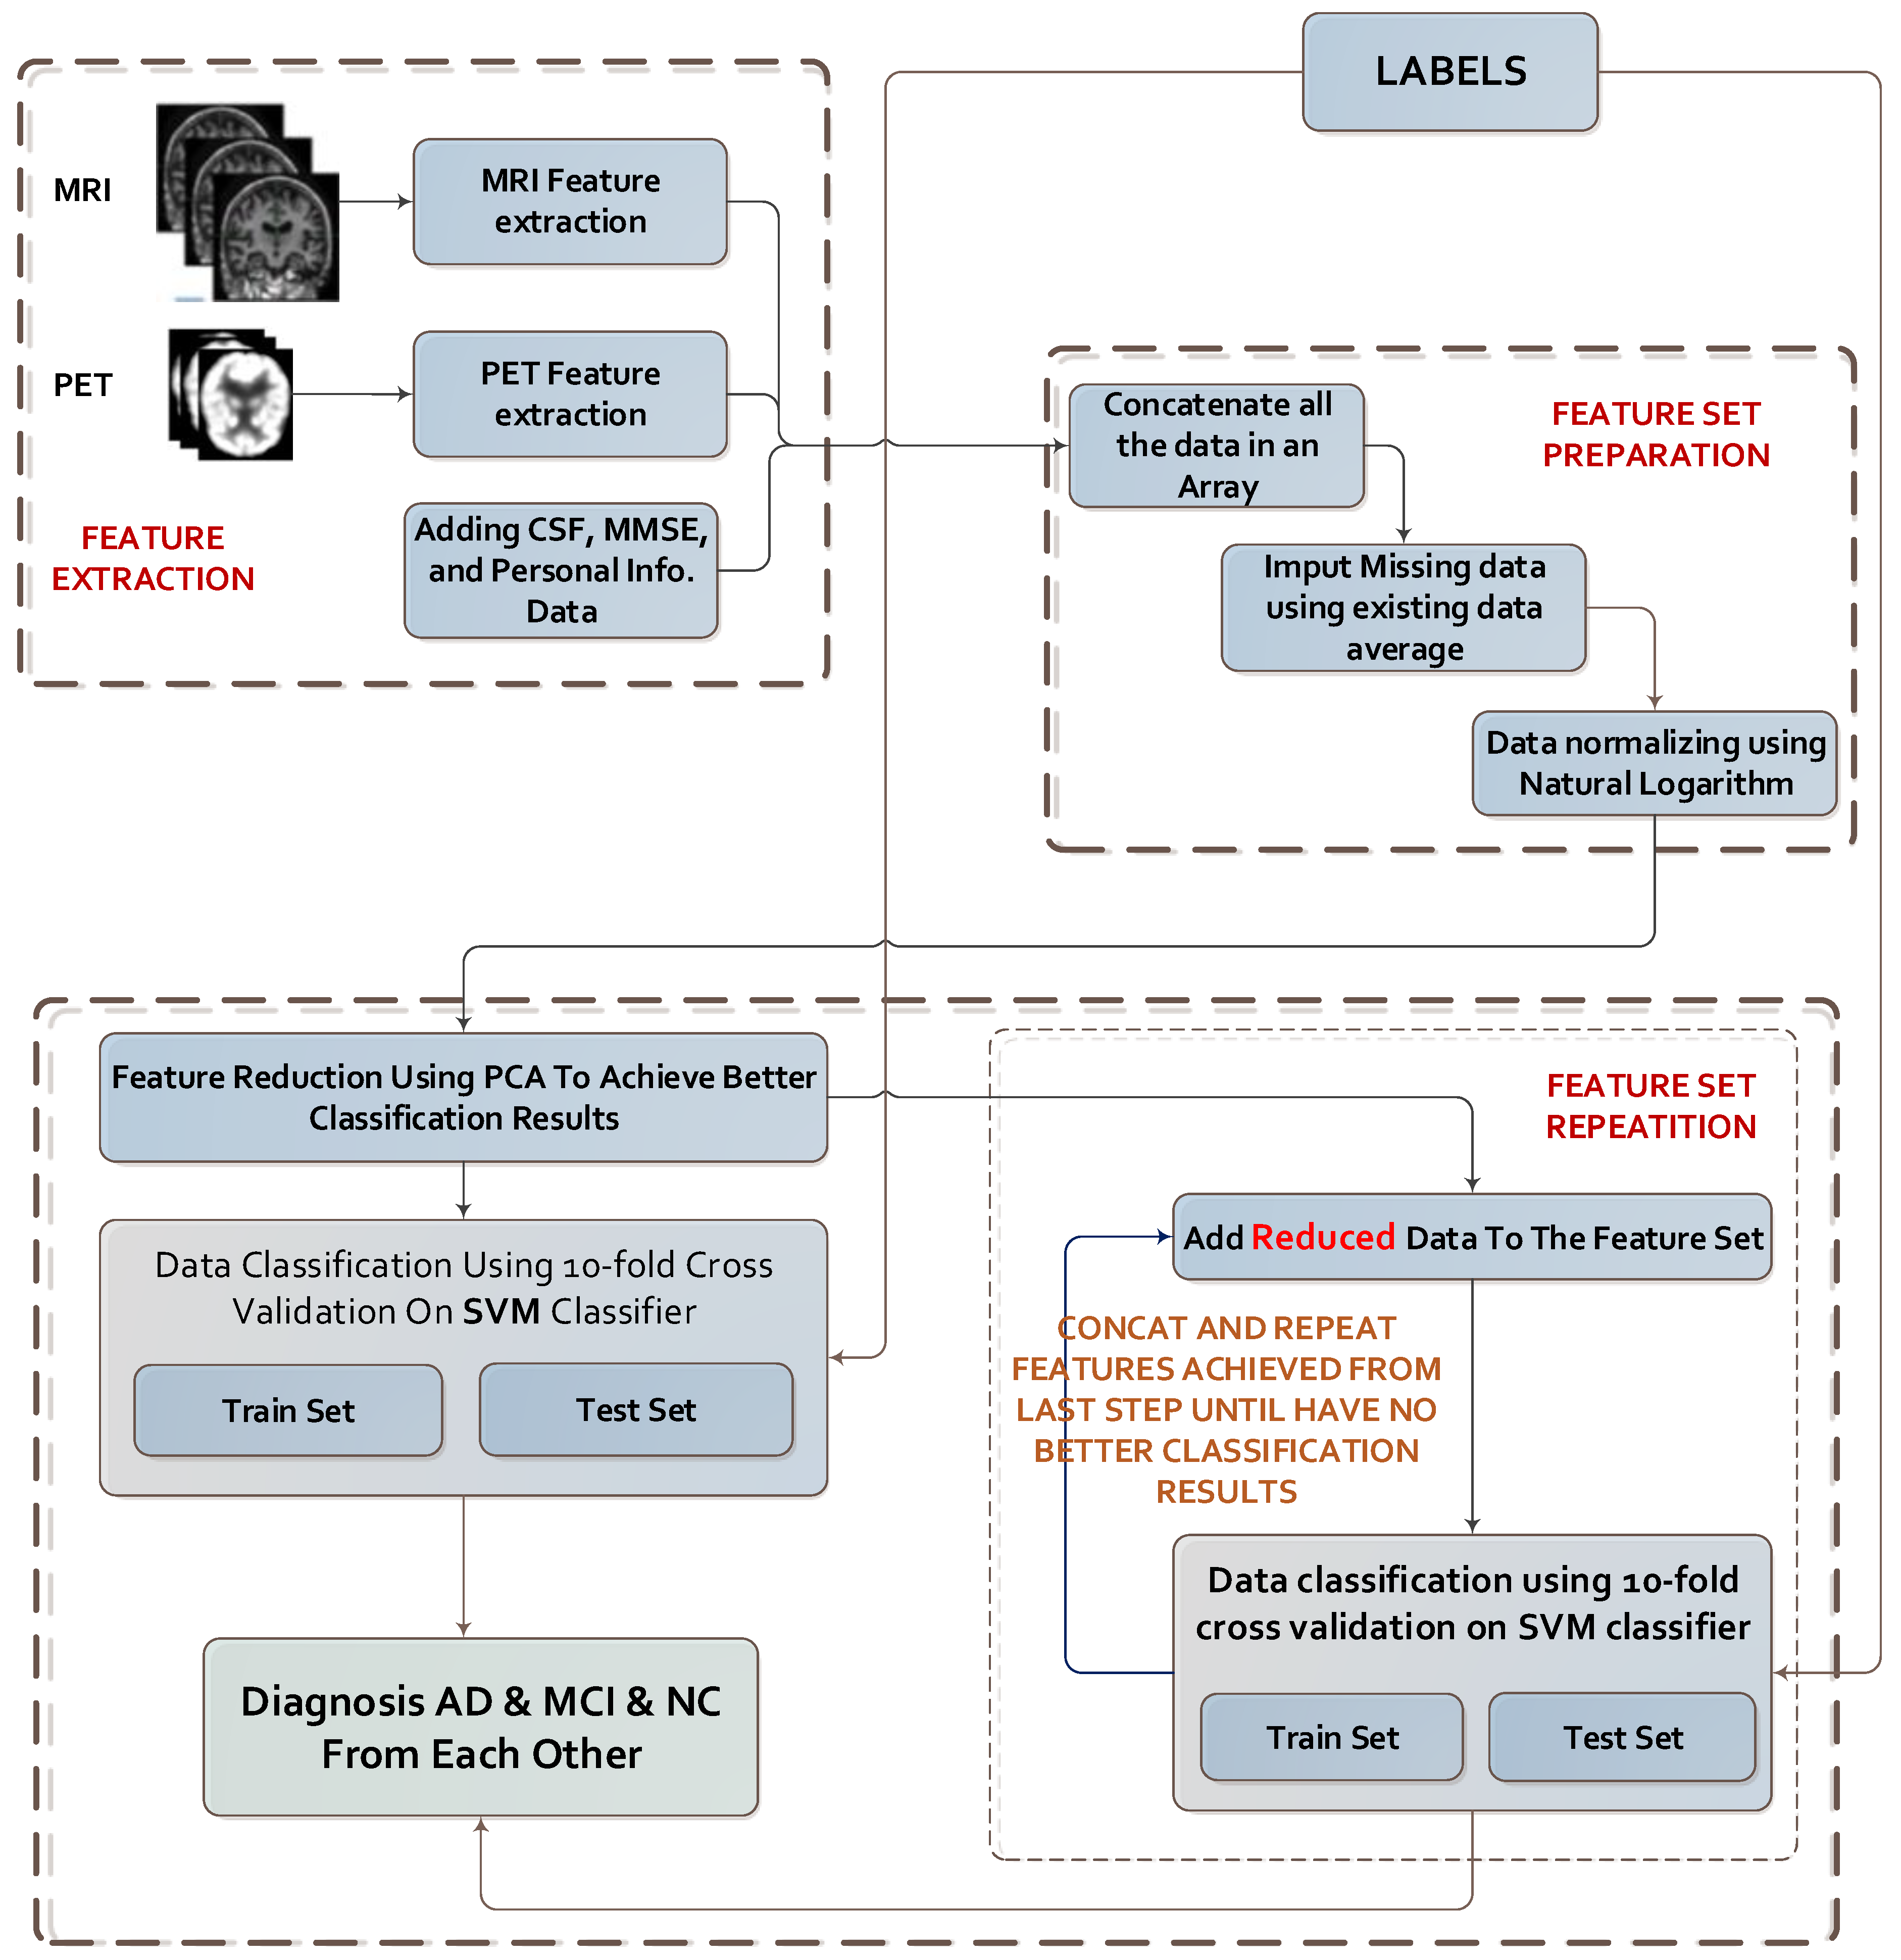
- (1)
- Feature extraction from MRI images and other data sources (from the ADNI dataset).
- (2)
- Concatenation of all the features.
- (3)
- Preparation of data sets and refining the data.
- (4)
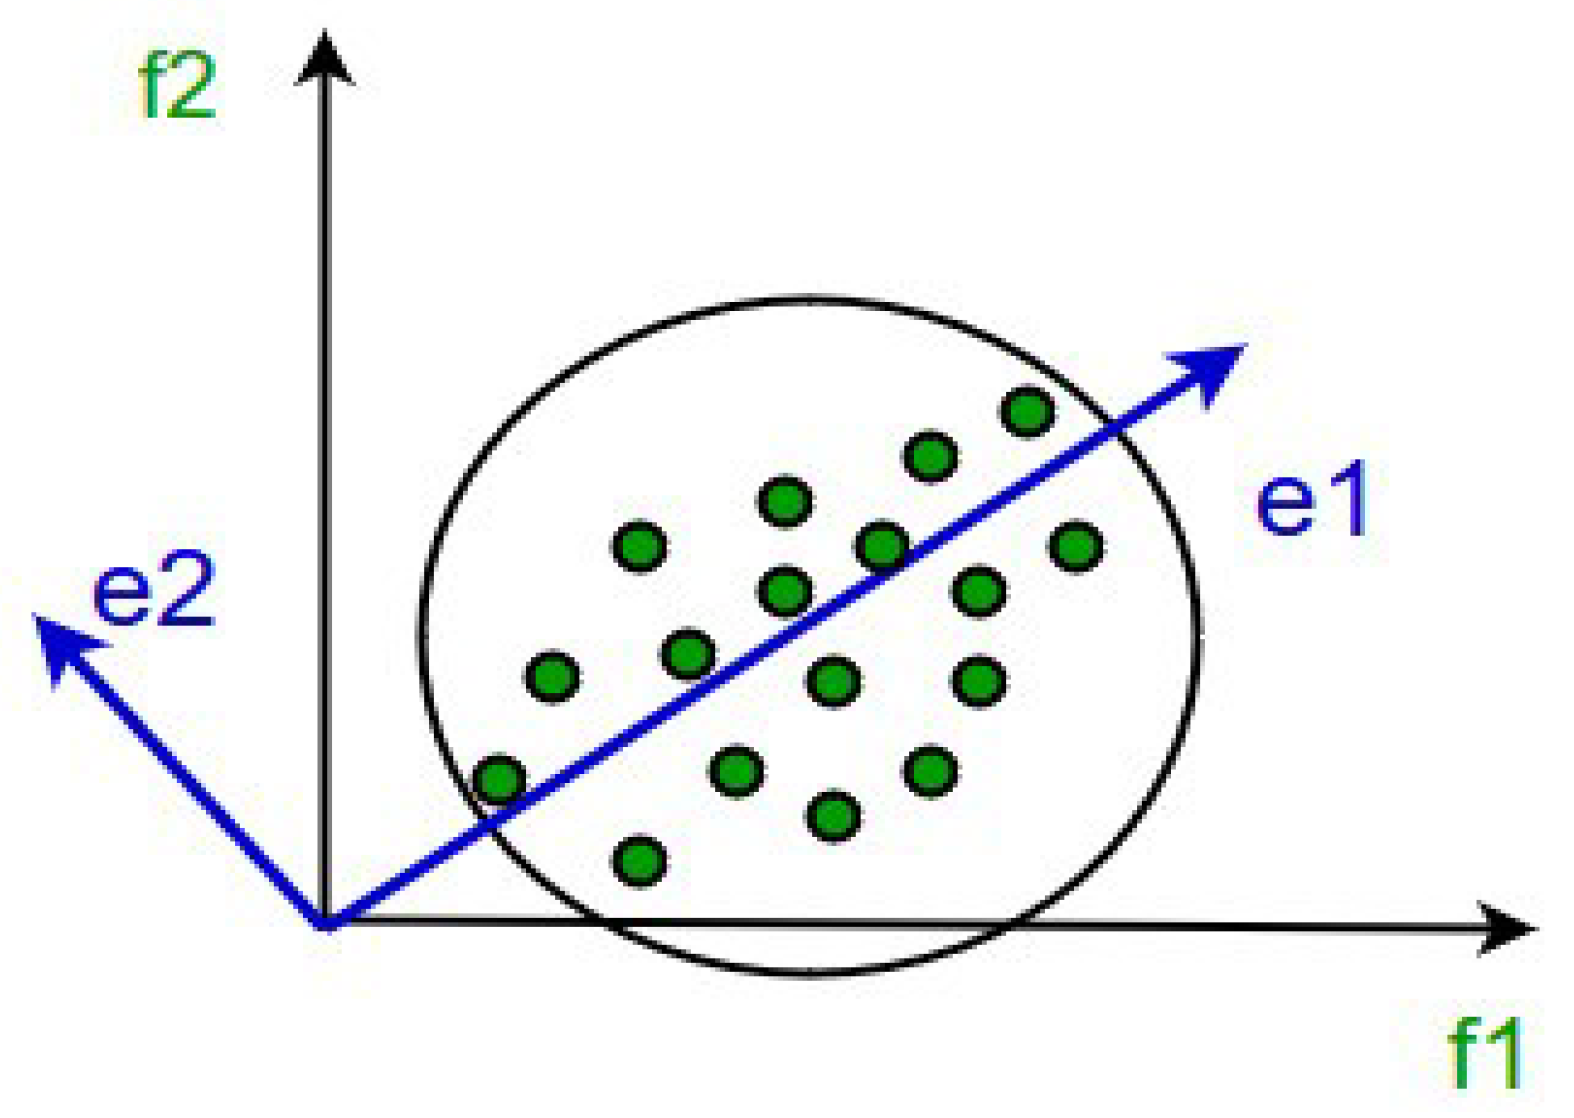
- Dimension reduction using PCA.
- (5)
- Repeating data in vectors of step 4 until achieving the highest classification performance.
- A novel method named Emphasis Learning is proposed for improving classification performance.
- The proposed method is successfully adapted for the diagnosis and prognosis of AD patients and distinguishing them from normal subjects.
2. Materials and Methods
2.1. Characteristics of Subjects
2.2. MRI and PET Images and CSF Data
2.2.1. MRI Acquisition Parameters
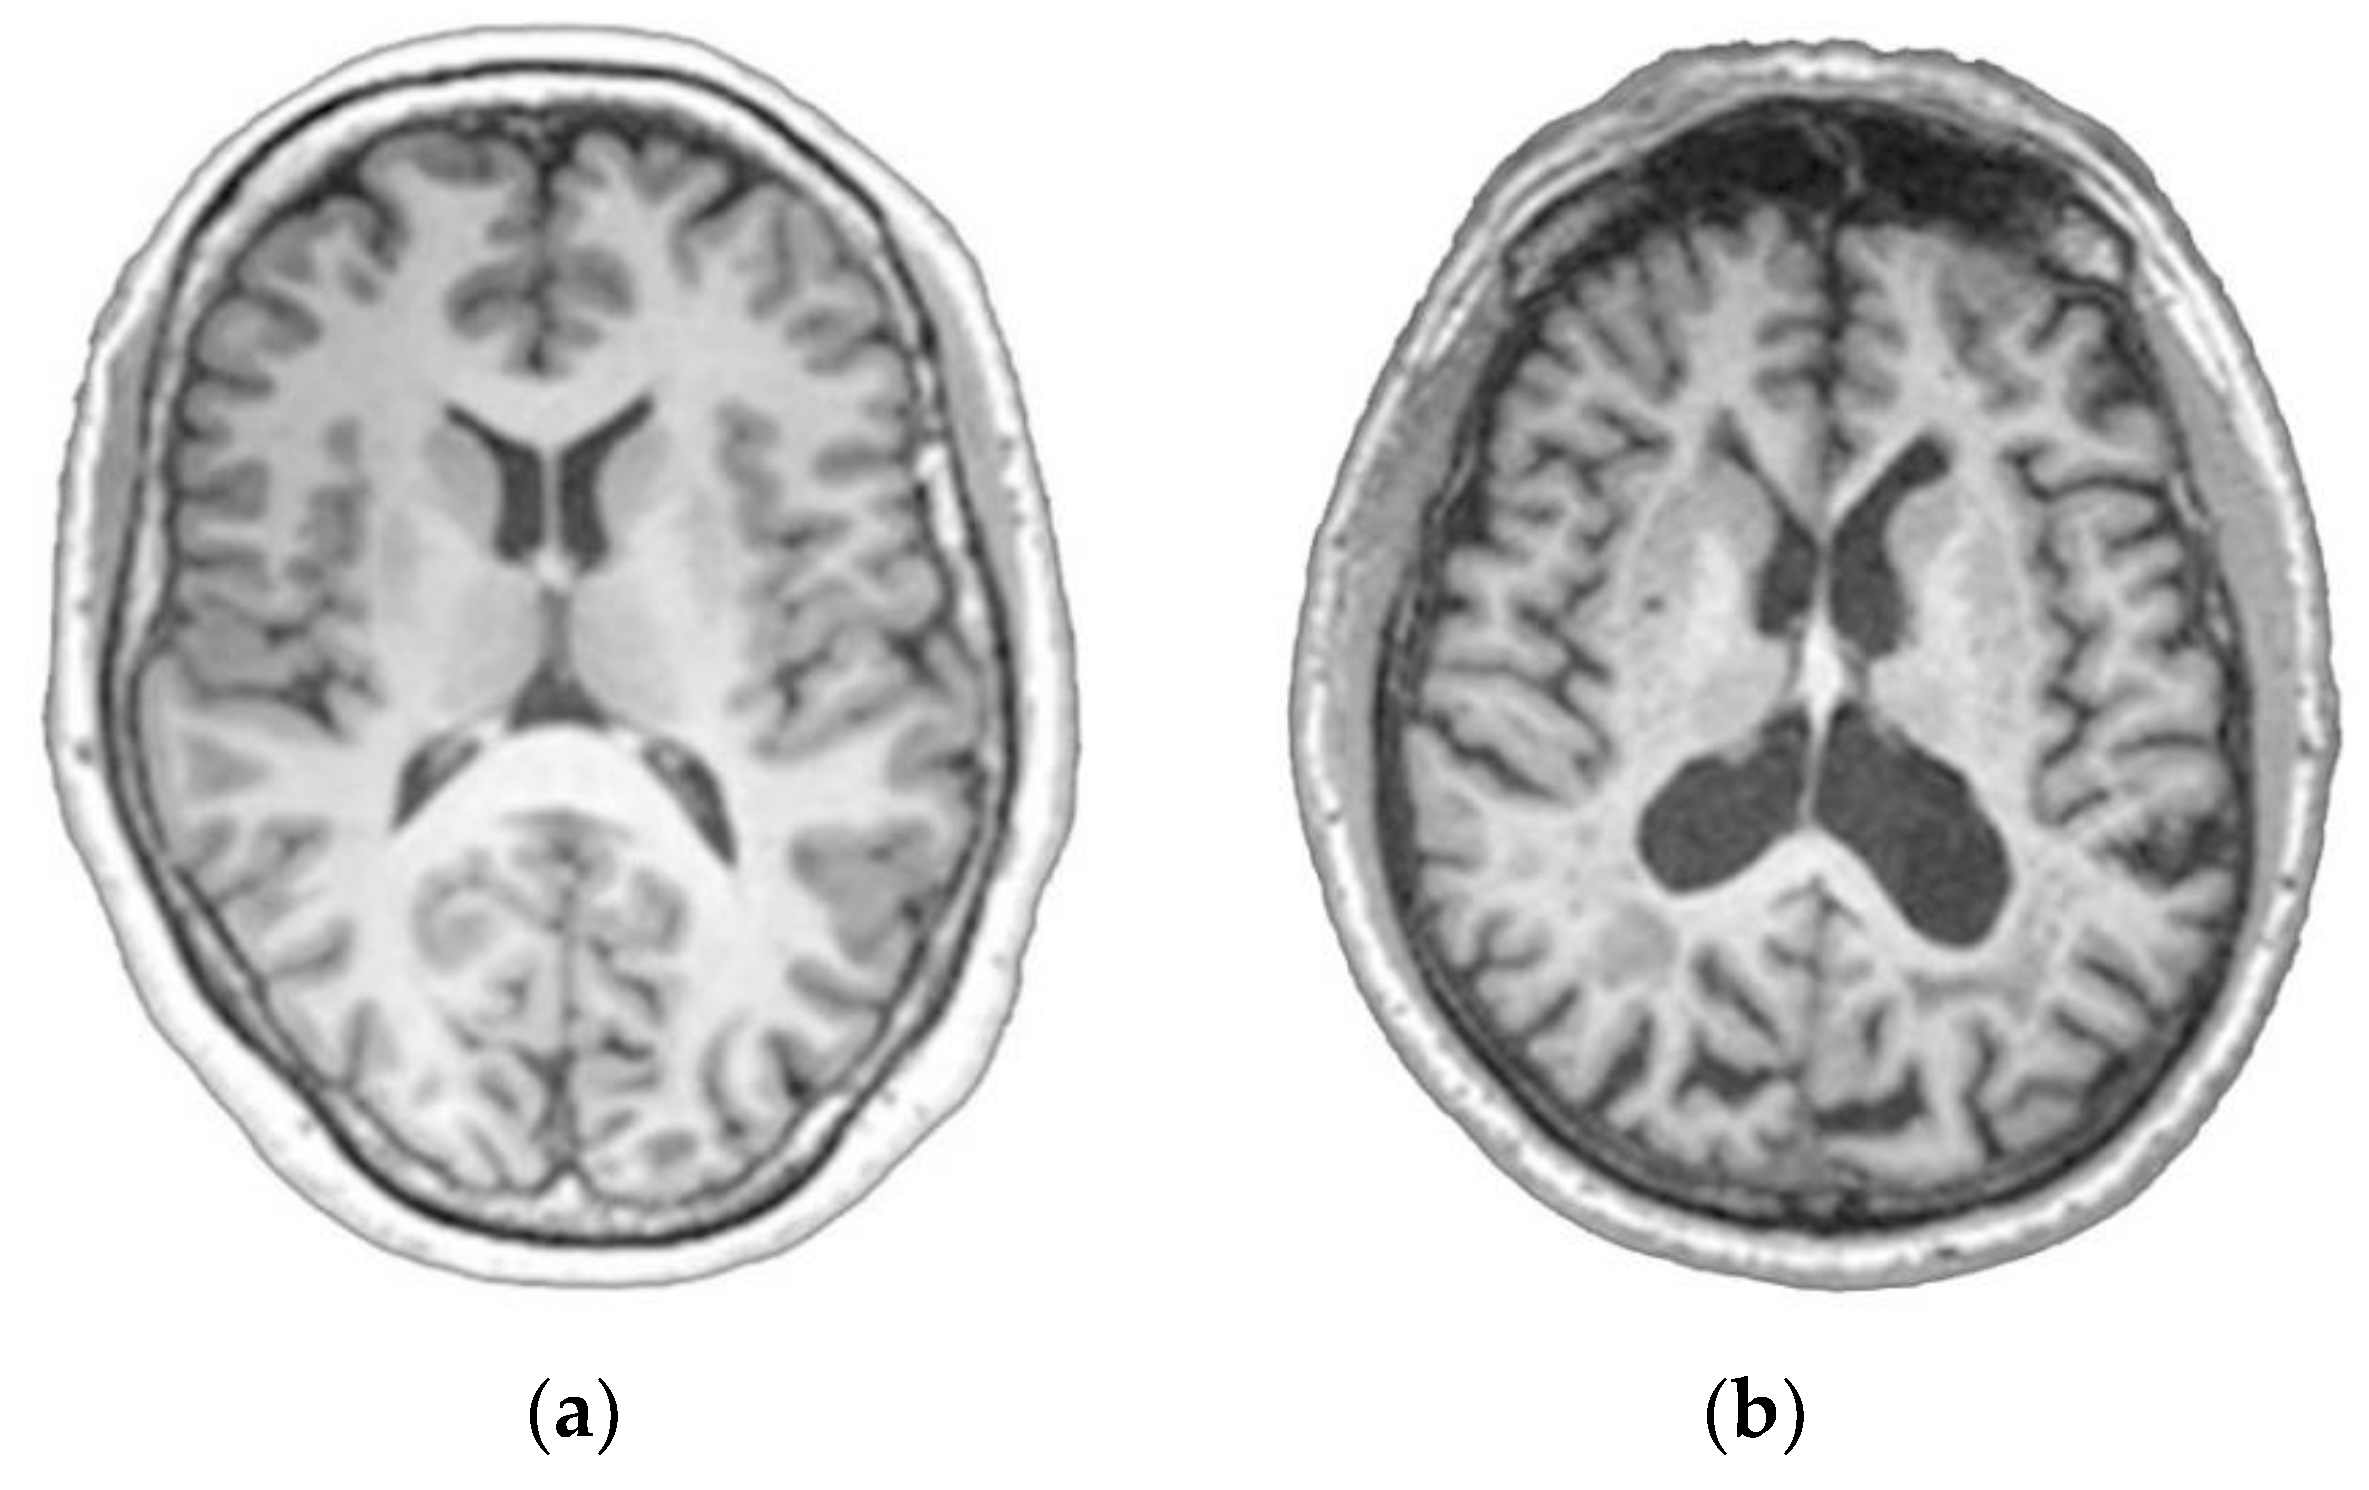
2.2.2. Pre-Processing of MRI Images
- Check that image format is in a suitable condition using SPM tools.
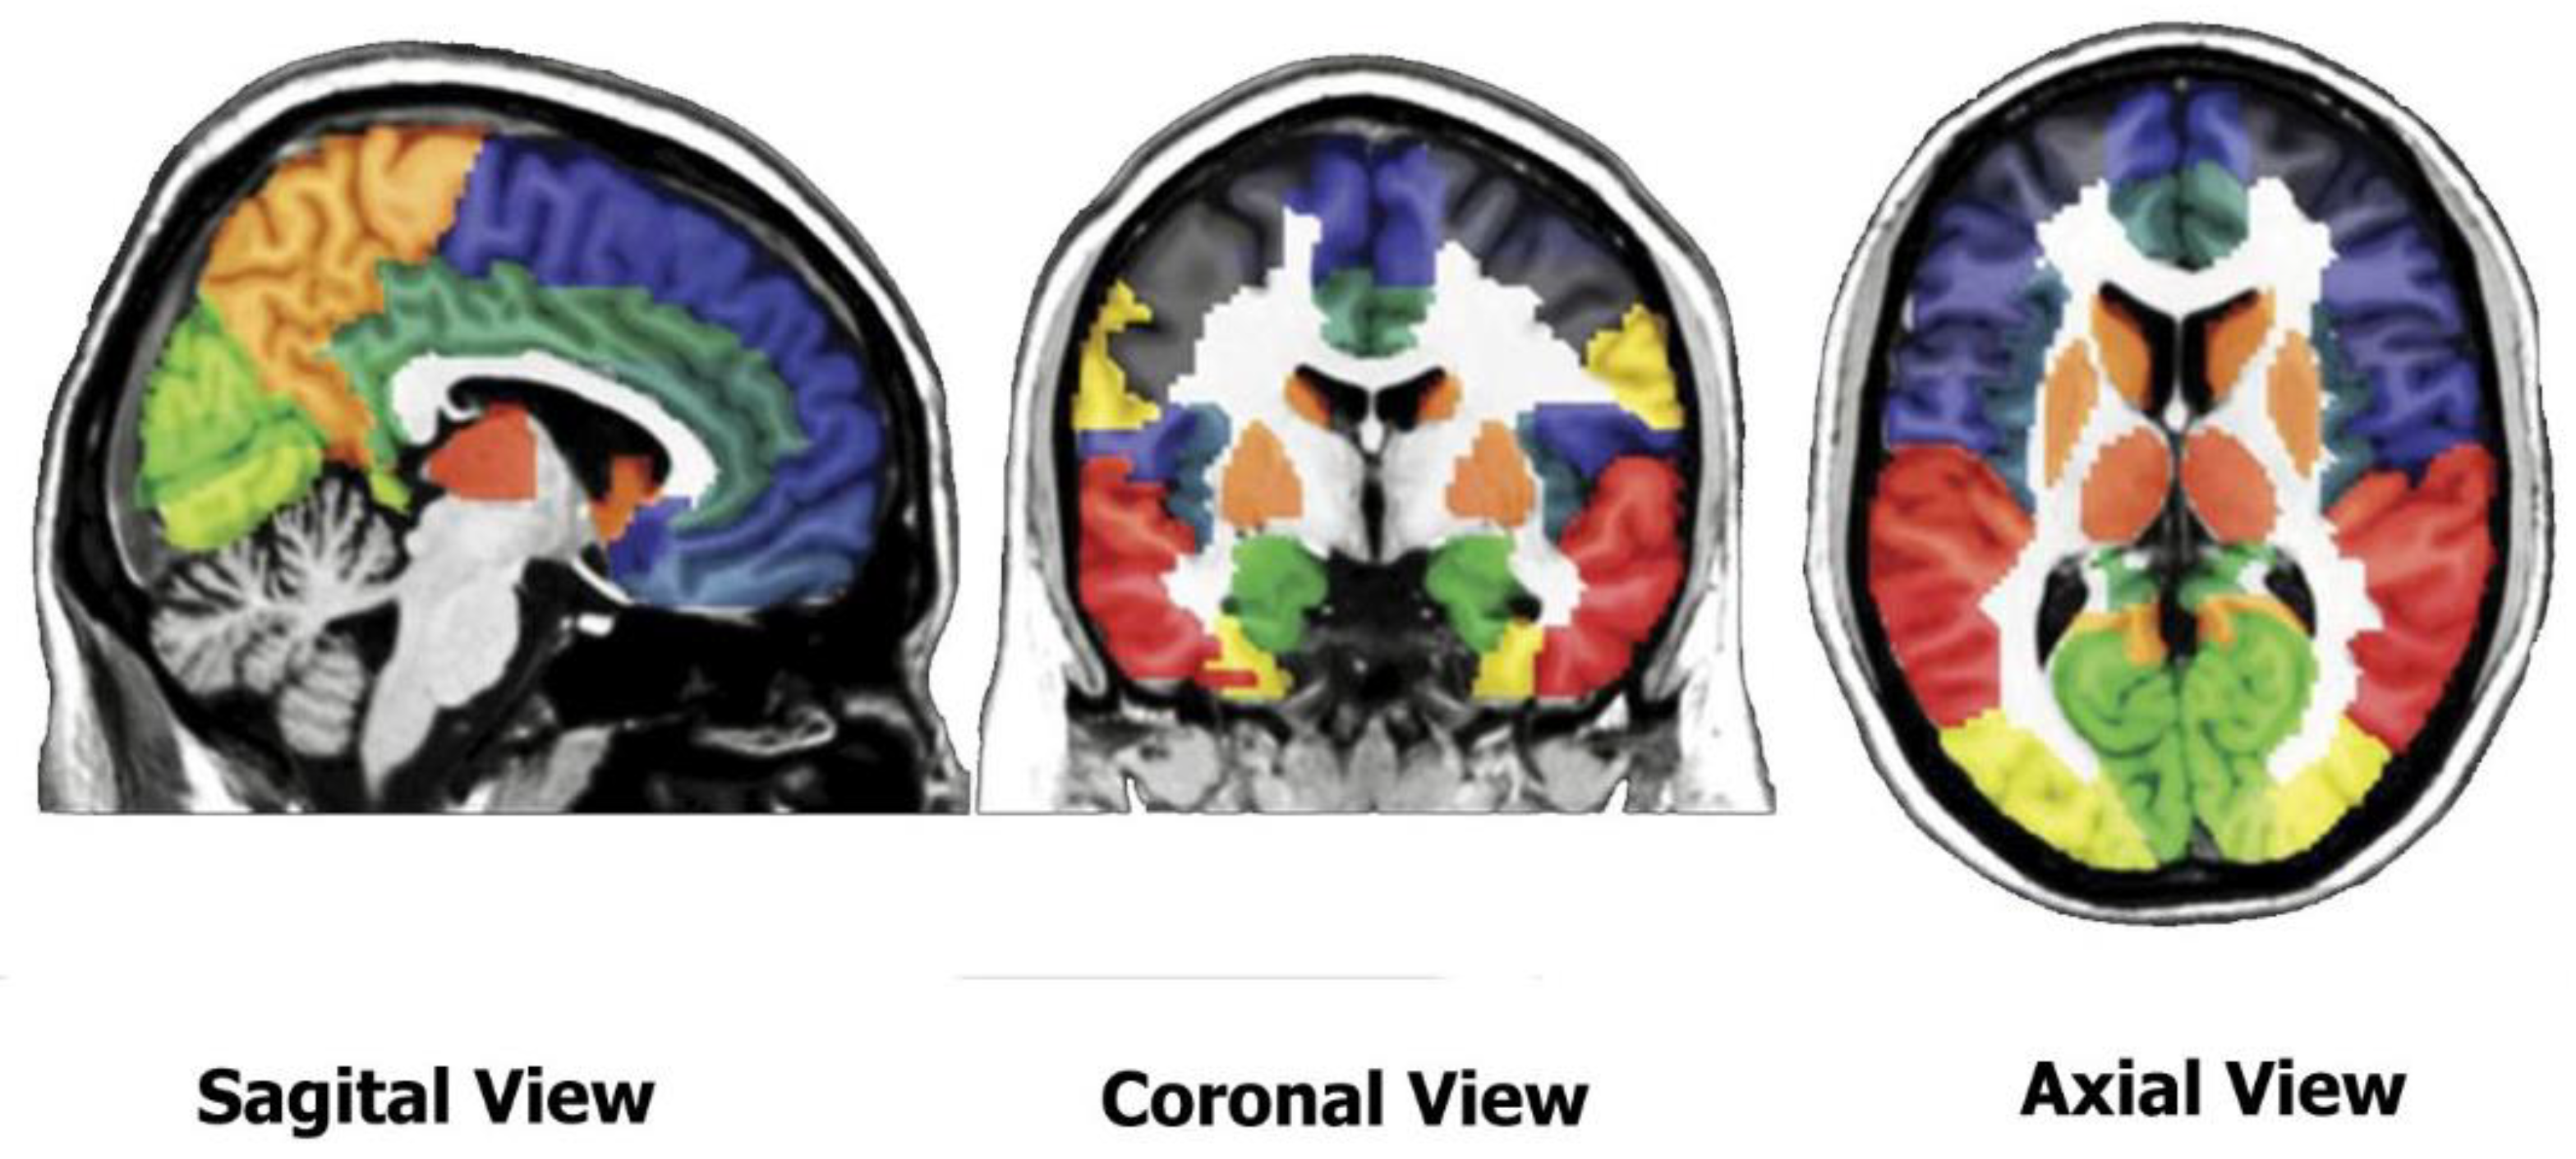
- Segment the images to identify gray matter and white matter (WM) and wrap GM to the segmented image to Montreal Neurological Institute (MNI) space using the SPM tools.
- Estimate deformations to best align the images to each other and create templates by registering the imported images with their average, iteratively using DARTEL tools of SPM.
- Generate spatially normalized and smoothed GM images normalized to MNI space. Using the estimated deformations by the DARTEL tools of SPM, generate smoothed/modulated wrapped GM and WM images.
2.3. Feature Extraction
3. Classification Methods
3.1. Feature Reduction Method
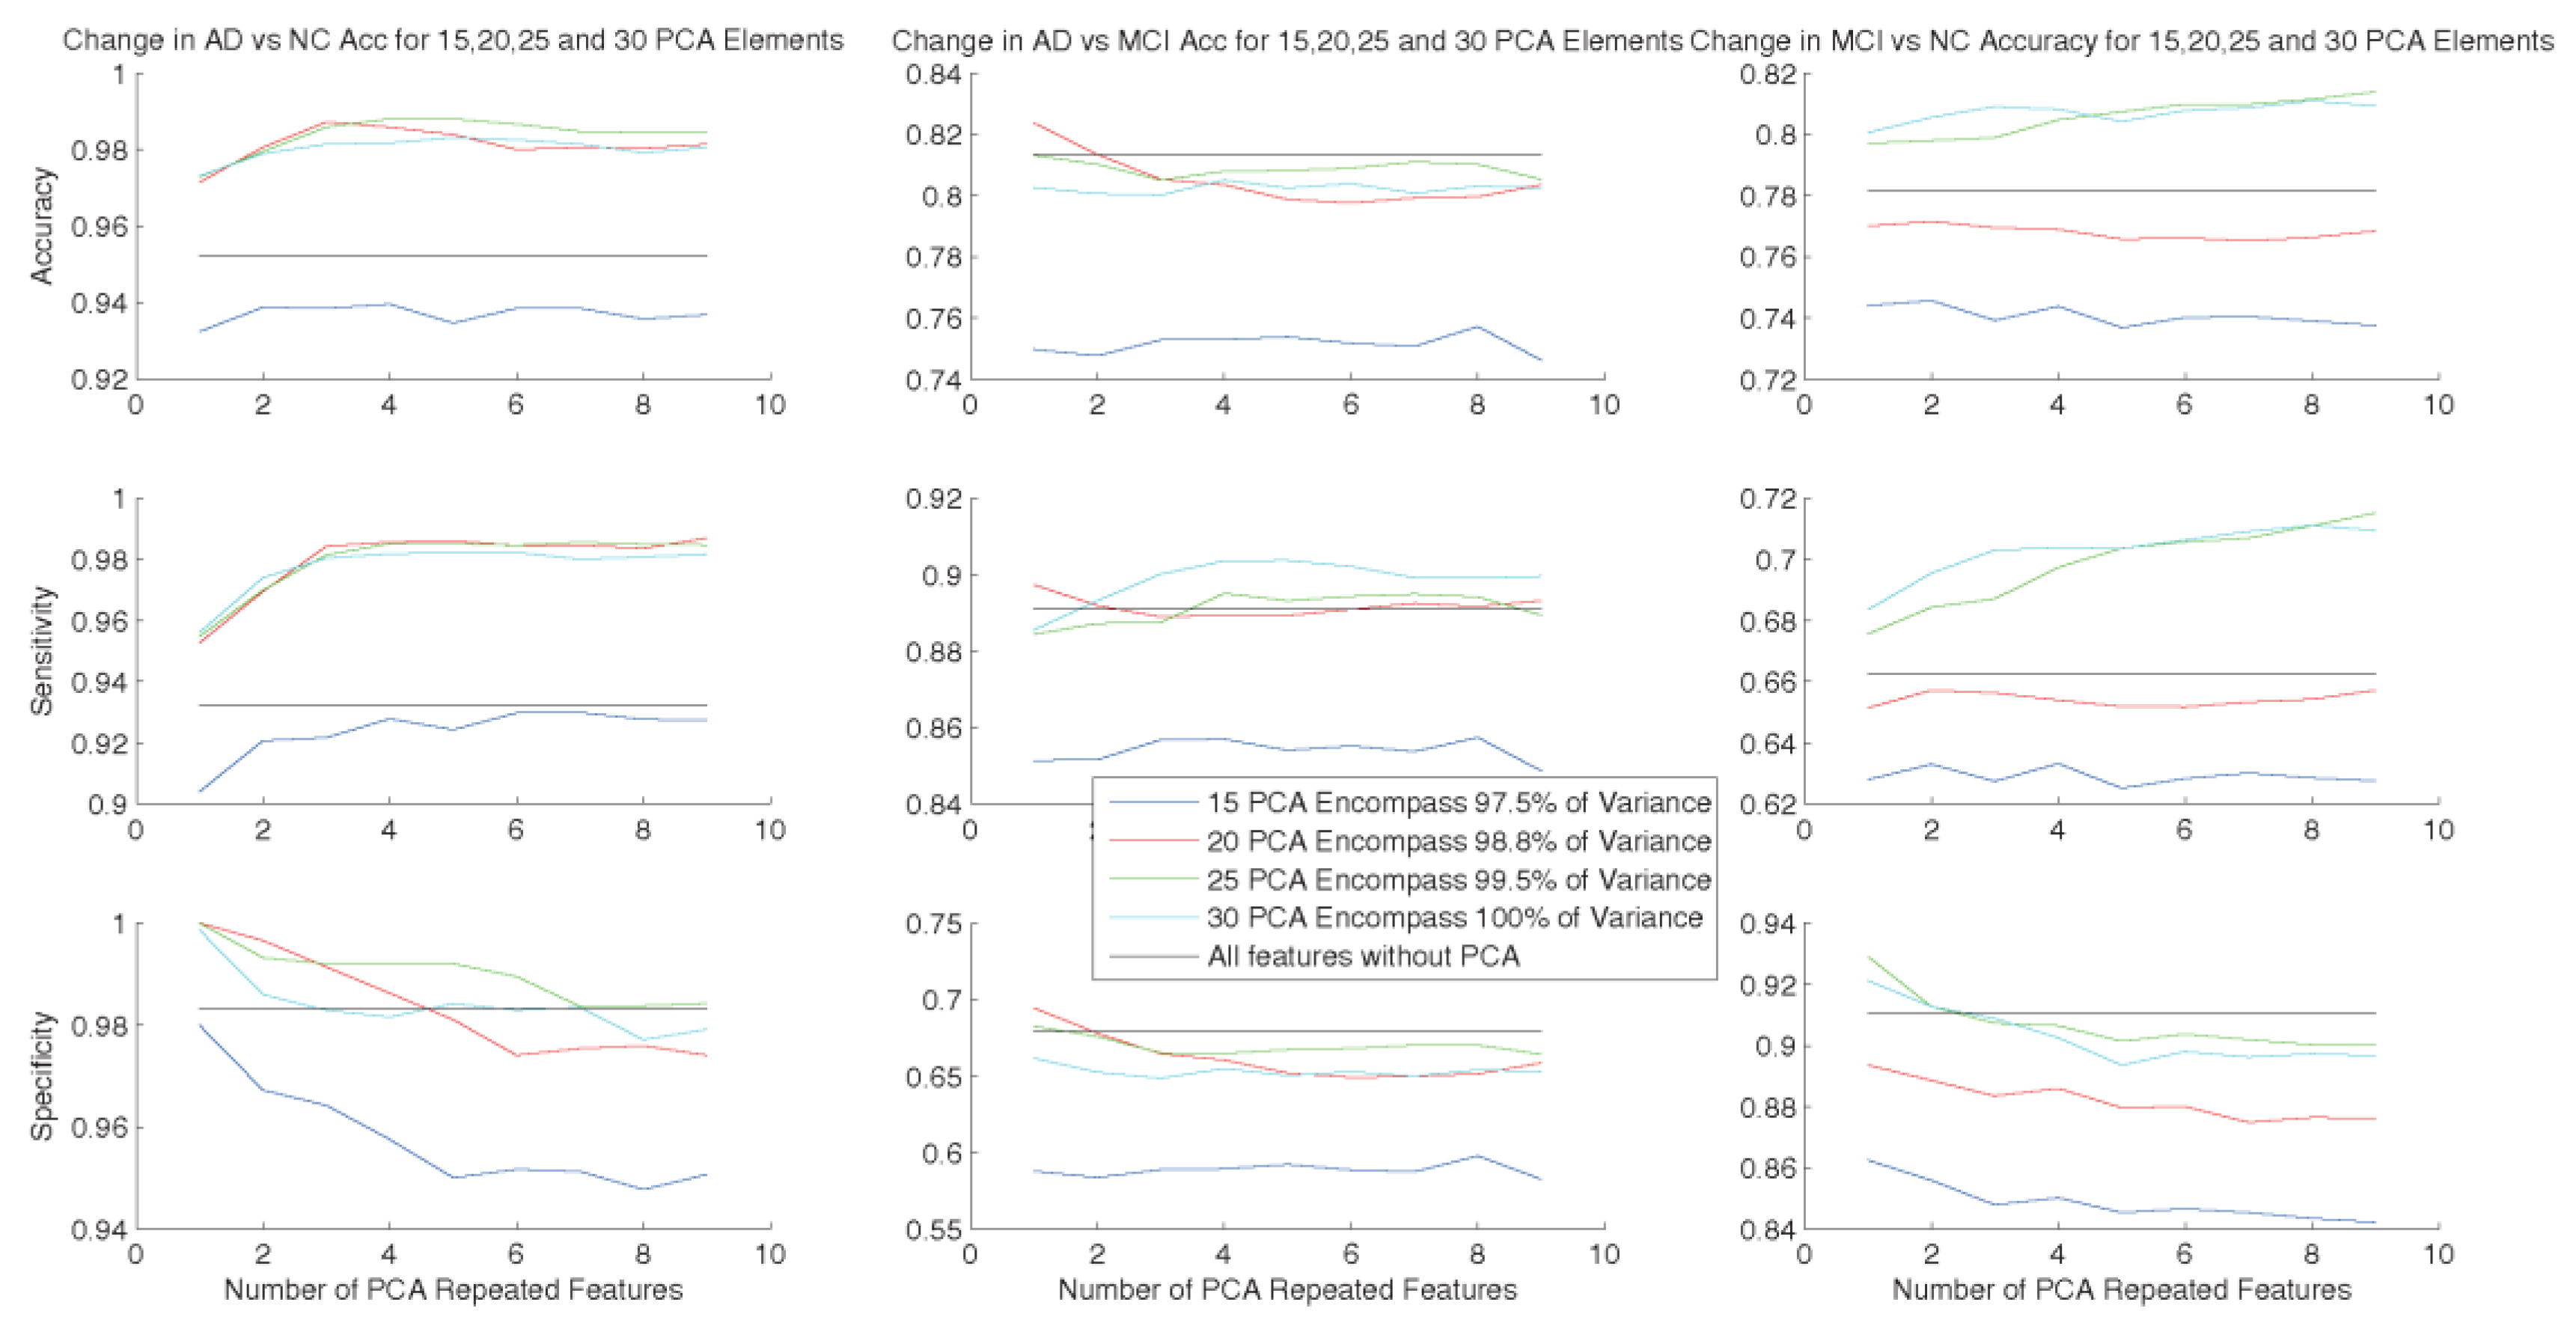
3.2. Increasing Dimensions of Data to Achieve Better Classification Results
3.3. SVM
3.4. Data Normalization vs. Data Standardization
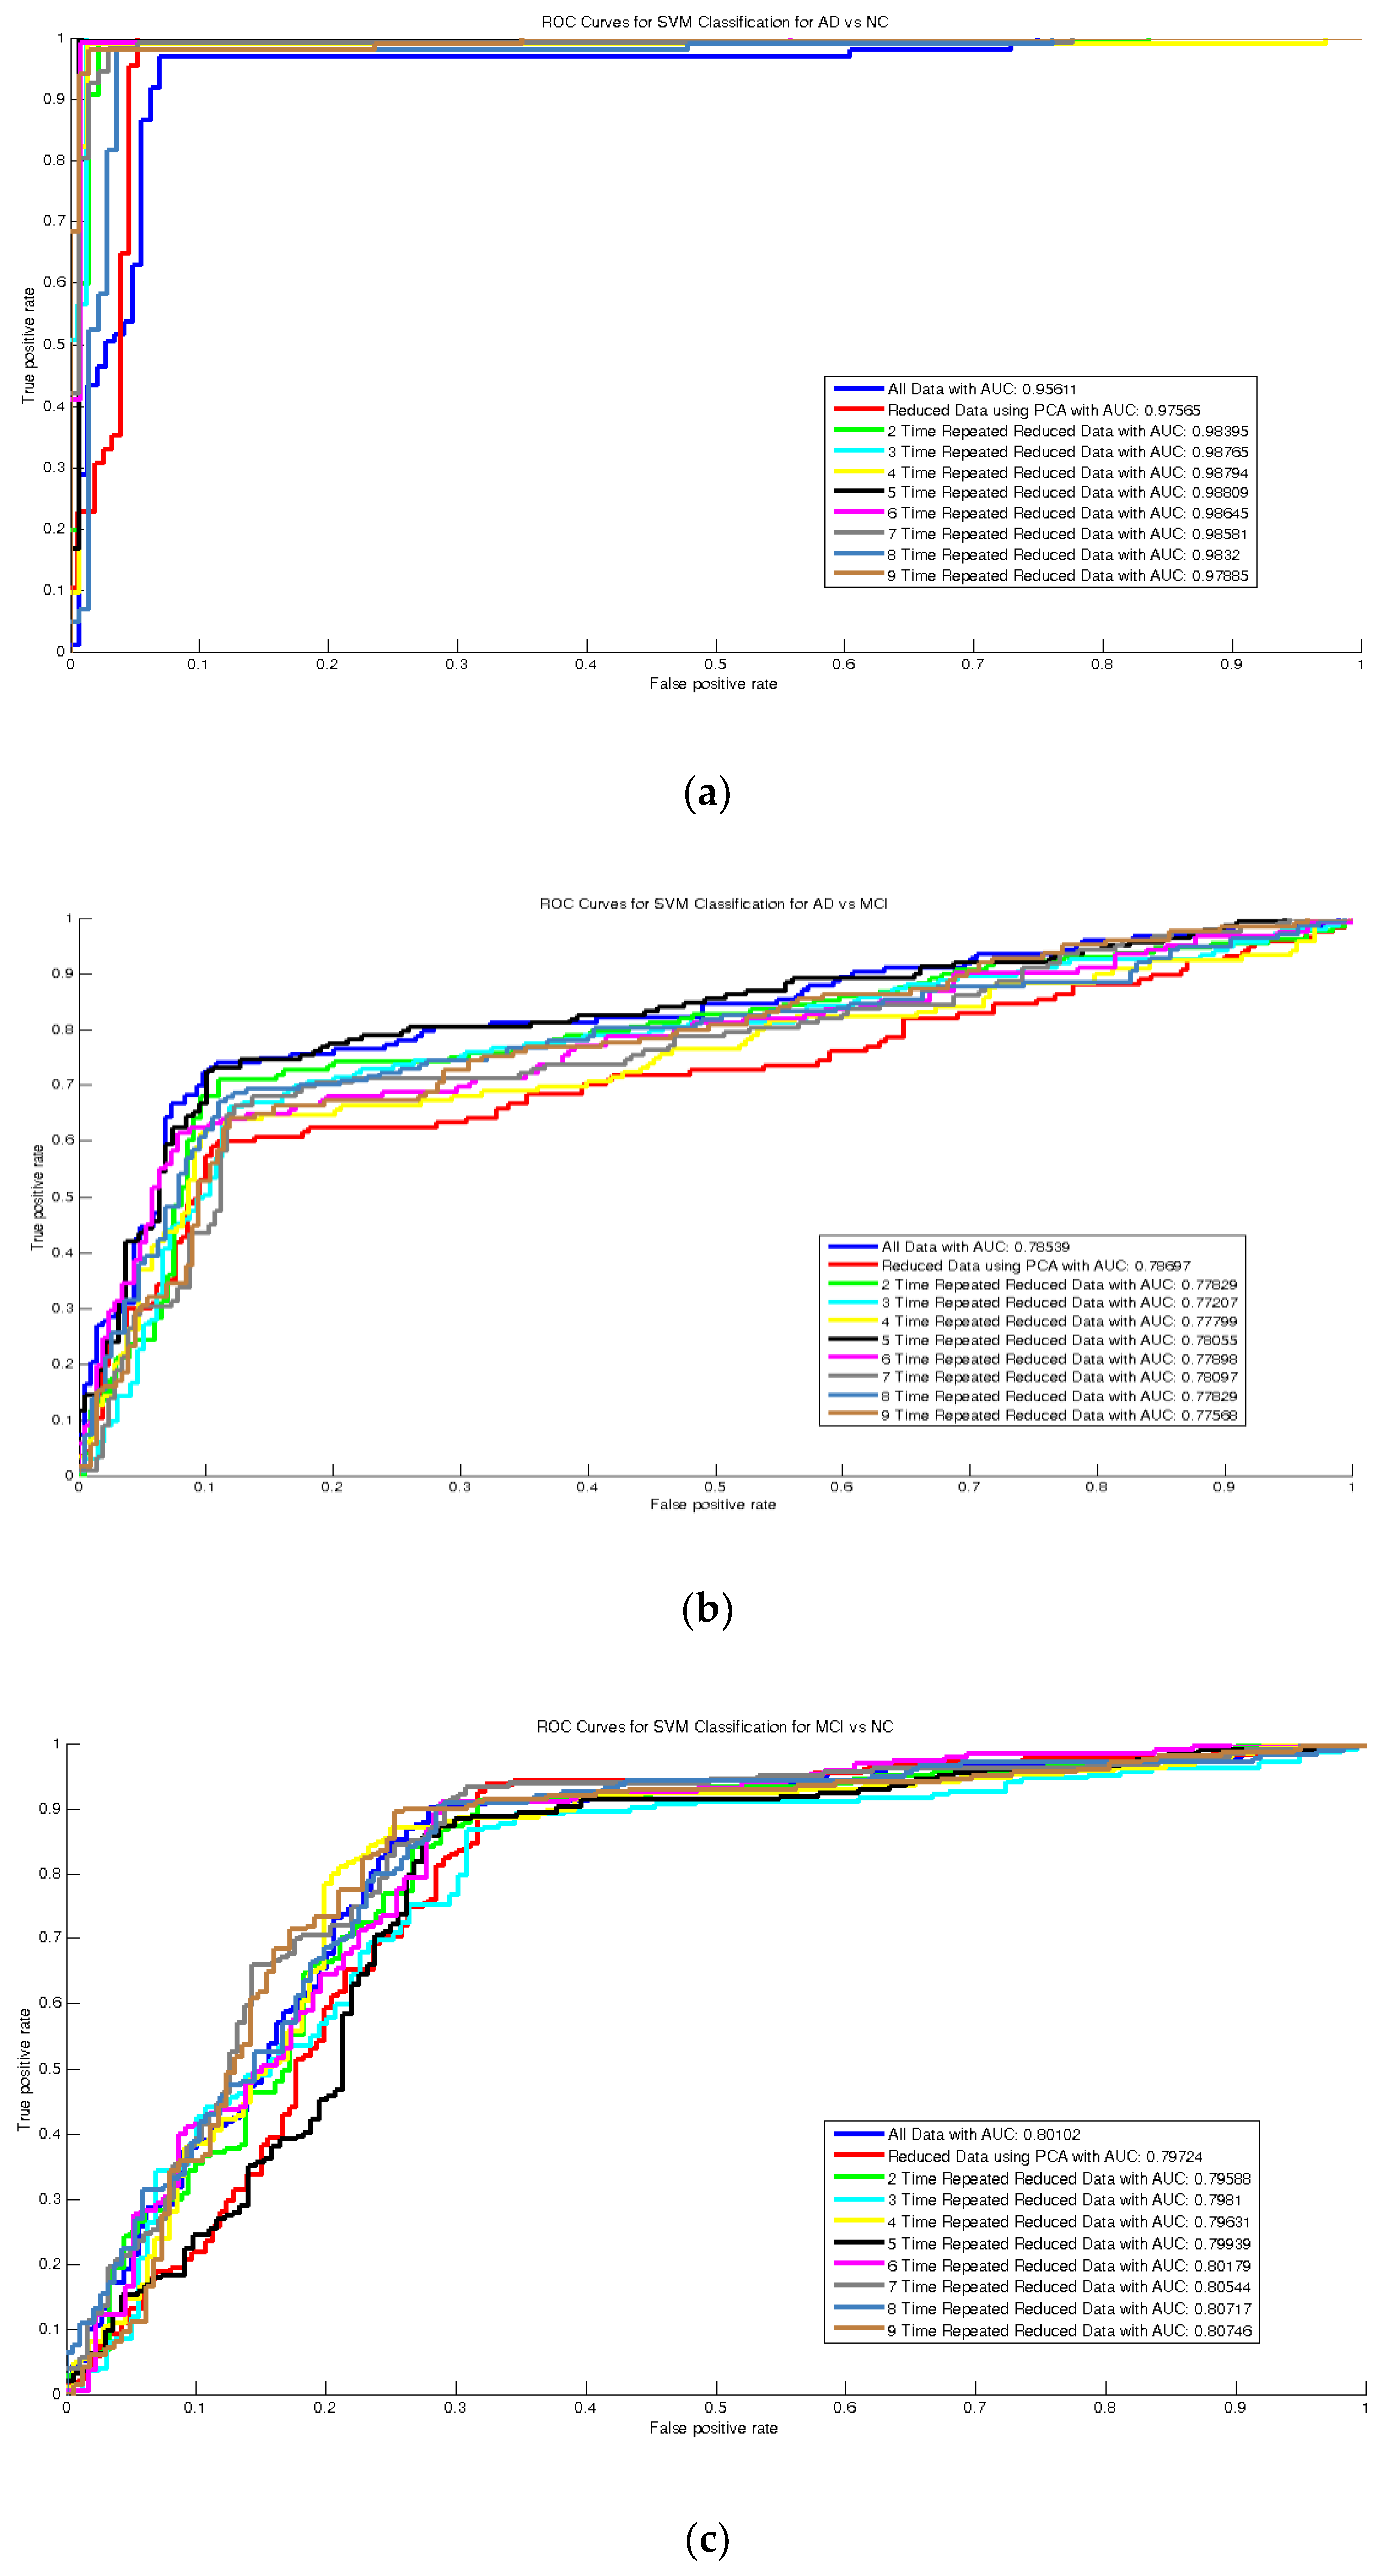
3.5. Evaluation Criteria
| Algorithm 1. The steps of the algorithm of the method. |
|
4. Experimental Results
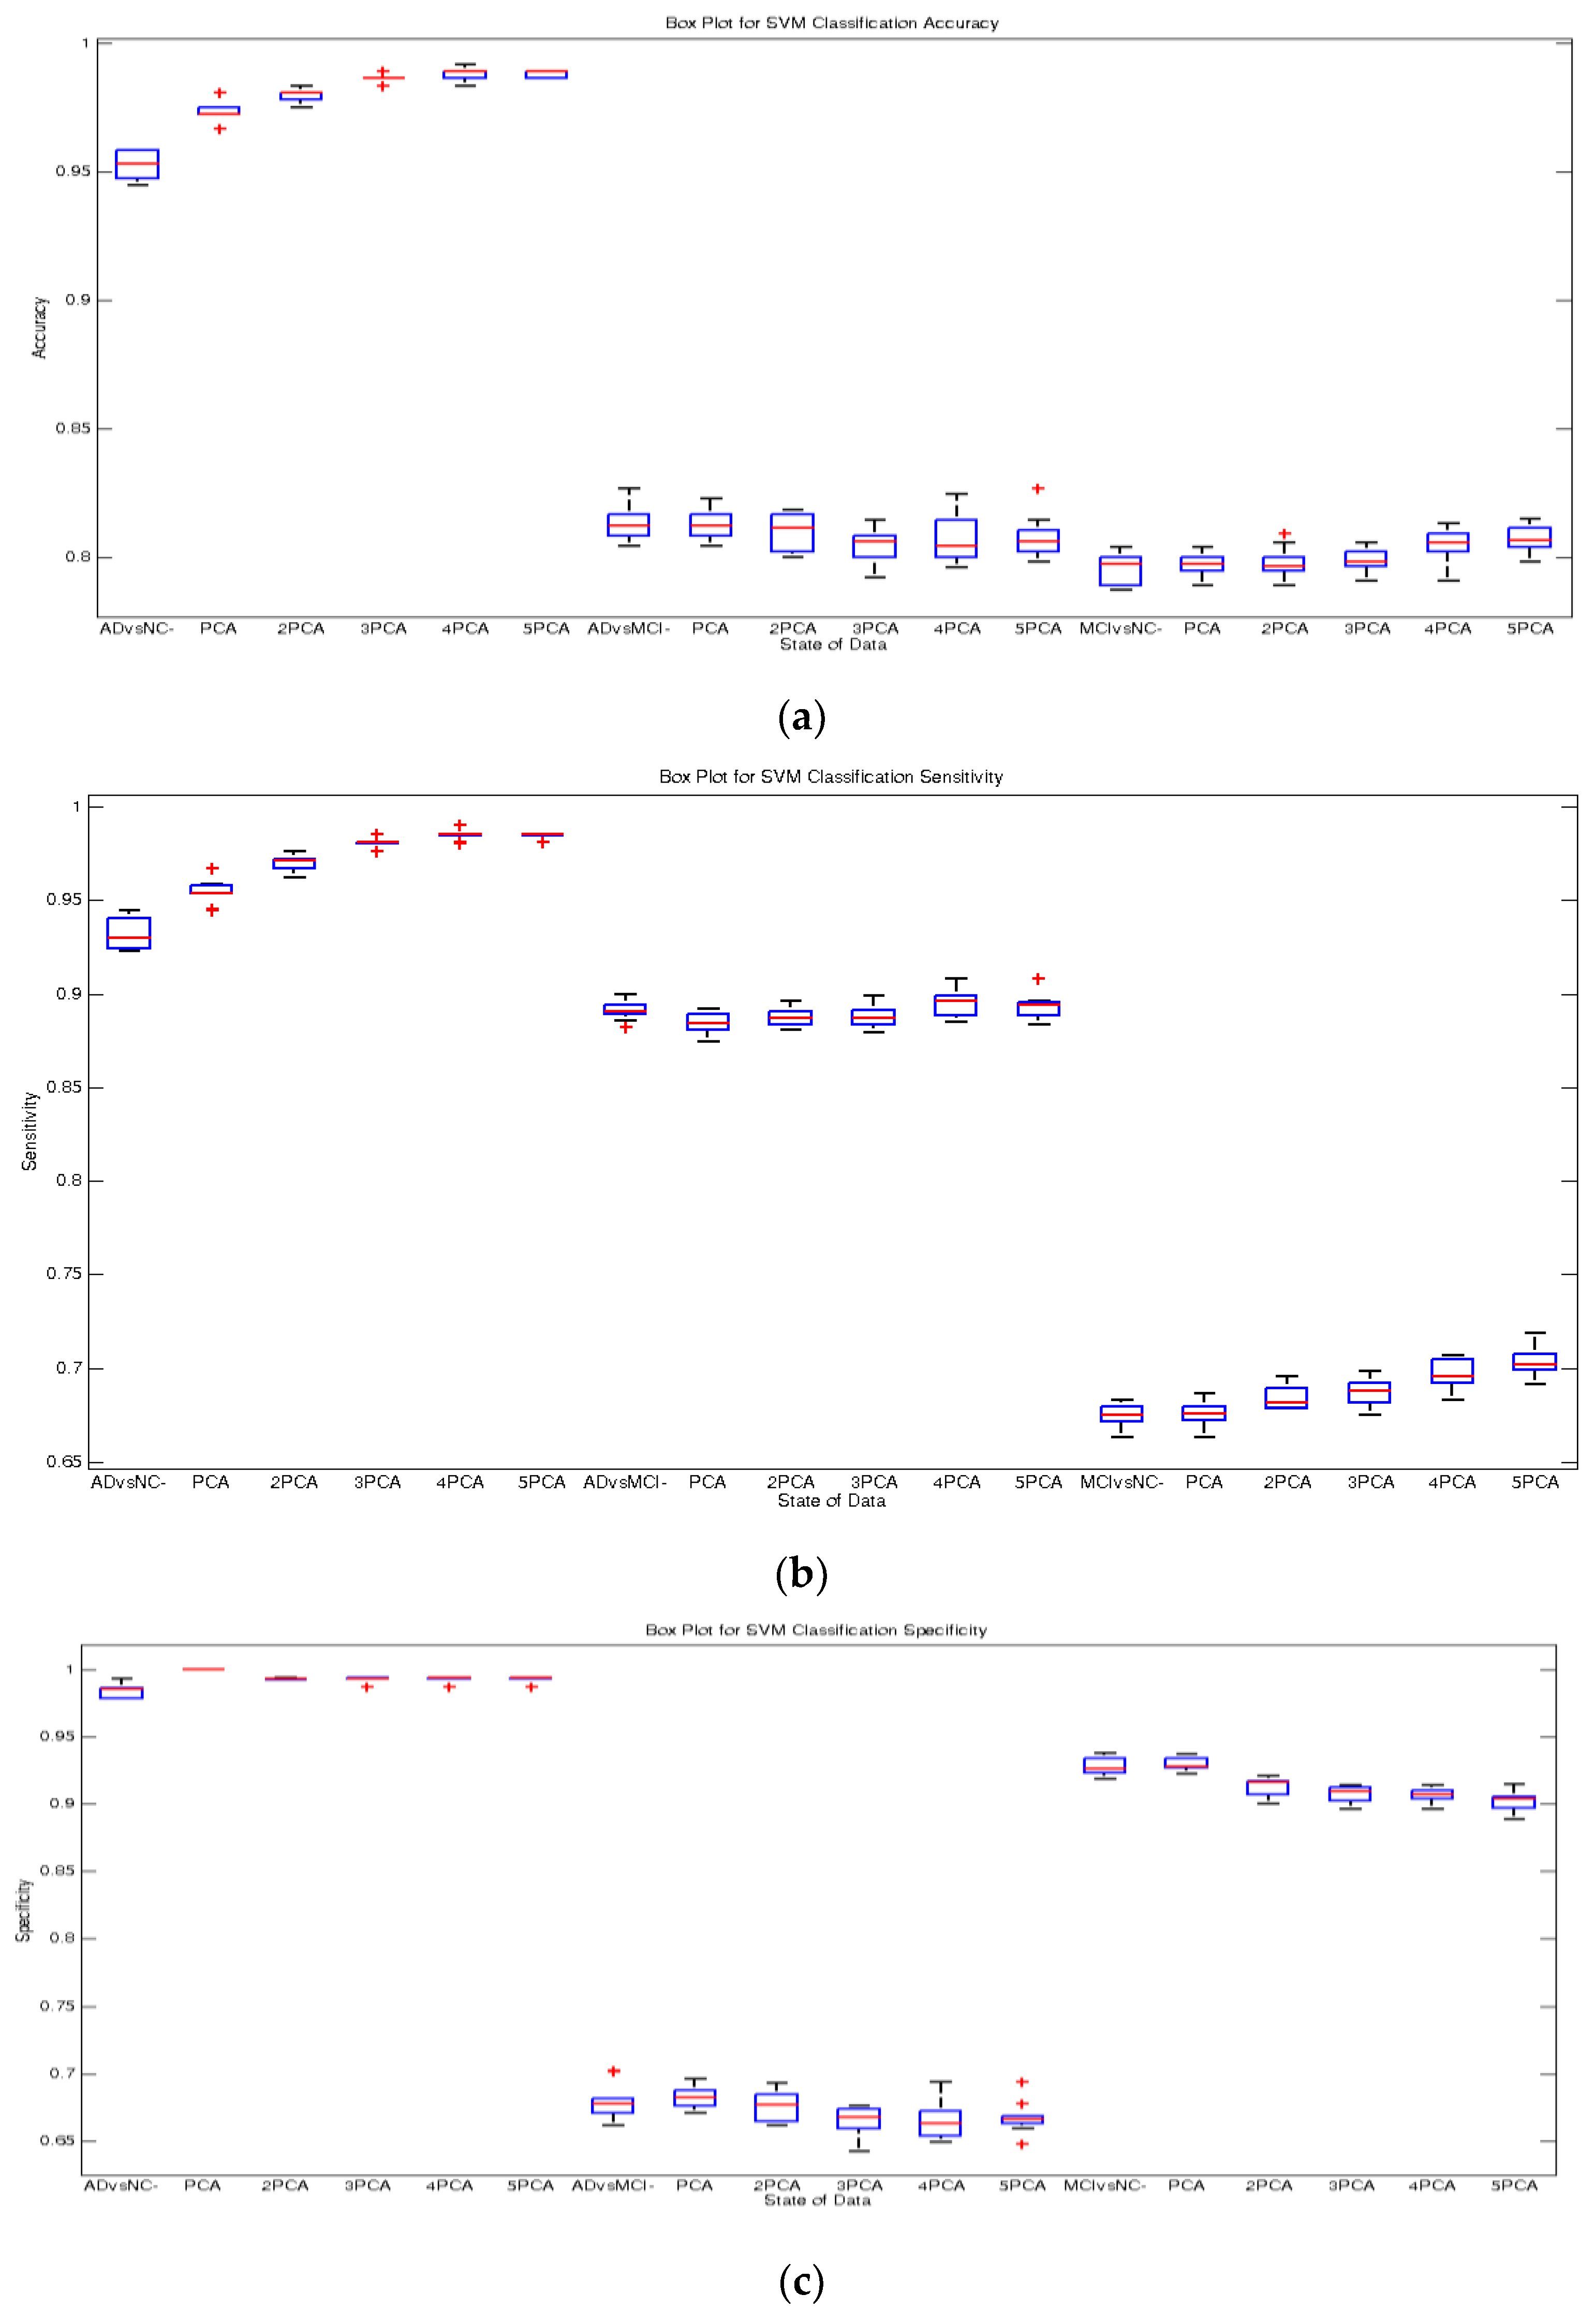
Classification Results
5. Discussion
5.1. Feature Representation
5.2. Feature Reduction and Increasing—Feasibility of the Proposed Method
5.3. Classification Algorithm
5.4. Comparison with the State-of-the-Art Methods
5.5. Limitations of the Work
6. Conclusions
Supplementary Materials
Author Contributions
Funding
Acknowledgments
Conflicts of Interest
References
- Thies, W.; Bleiler, L. 2012 Alzheimer’s disease facts and figures. Alzheimer’s Dement. J. Alzheimer’s Assoc. 2012, 8, 131–168. [Google Scholar] [CrossRef]
- Davatzikos, C.; Fan, Y.; Wu, X.; Shen, D.; Resnick, S.M. Detection of prodromal Alzheimer’s disease via pattern classification of magnetic resonance imaging. Neurobiol. Aging 2008, 29, 514–523. [Google Scholar]
- Kloppel, S.; Stonnington, C.M.; Chu, C.; Draganski, B.; Scahill, R.I.; Rohrer, J.D.; Fox, N.C.; Jack, C.R., Jr.; Ashburner, J.; Frackowiak, R.S. Automatic classification of mr scans in Alzheimer’s disease. Brain 2008, 131, 681–689. [Google Scholar] [CrossRef] [PubMed]
- Cuingnet, R.; Gerardin, E.; Tessieras, J.; Auzias, G.; Lehericy, S.; Habert, M.O.; Chupin, M.; Benali, H.; Colliot, O. Automatic classification of patients with alzheimer’s disease from structural mri: A comparison of ten methods using the adni database. Neuroimage 2011, 56, 766–781. [Google Scholar] [CrossRef] [PubMed]
- Foster, N.L.; Heidebrink, J.L.; Clark, C.M.; Jagust, W.J.; Arnold, S.E.; Barbas, N.R.; DeCarli, C.S.; Turner, R.S.; Koeppe, R.A.; Higdon, R.; et al. Fdg-pet improves accuracy in distinguishing frontotemporal dementia and alzheimer’s disease. Brain 2007, 130, 2616–2635. [Google Scholar] [CrossRef]
- Nordberg, A.; Rinne, J.O.; Kadir, A.; Langstrom, B. The use of pet in Alzheimer disease. Nat. Rev. Neurol. 2010, 6, 78–87. [Google Scholar] [CrossRef]
- Dubois, B.; Feldman, H.H.; Jacova, C.; DeKosky, S.T.; Barberger-Gateau, P.; Cummings, J.; Delacourte, A.; Galasko, D.; Gauthier, S.; Jicha, G.; et al. Research criteria for the diagnosis of Alzheimer’s disease: Revising the nincds–adrda criteria. Lancet Neurol. 2007, 6, 734–746. [Google Scholar] [CrossRef]
- Hajian-Tilaki, K. Receiver operating characteristic (roc) curve analysis for medical diagnostic test evaluation. Casp. J. Intern Med. 2013, 4, 627–635. [Google Scholar]
- Killiany, R.J.; Gomez-Isla, T.; Moss, M.; Kikinis, R.; Sandor, T.; Jolesz, F.; Tanzi, R.; Jones, K.; Hyman, B.T.; Albert, M.S. Use of structural magnetic resonance imaging to predict who will get alzheimer’s disease. Ann. Neurol. 2000, 47, 430–439. [Google Scholar] [CrossRef]
- Dickerson, B.C.; Goncharova, I.; Sullivan, M.P.; Forchetti, C.; Wilson, R.S.; Bennett, D.A.; Beckett, L.A.; deToledo-Morrell, L. Mri-derived entorhinal and hippocampal atrophy in incipient and very mild alzheimer’s disease. Neurobiol. Aging 2001, 22, 747–754. [Google Scholar] [CrossRef]
- Convit, A.; Asis, J.D.; Leon, M.J.D.; Tarshish, C.Y.; Santi, S.D.; Rusinek, H. Atrophy of the medial occipitotemporal, and middle temporal gyri in non-demented elderly predict decline to Alzheimer’s disease. Neurobiol. Aging 2000, 21, 19–26. [Google Scholar] [CrossRef]
- Chételat, G.; Desgranges, B.; Sayette, V.D.L.; Viader, F.; Eustache, F.; Baron, J. Mapping gray matter loss with voxel-based morphometry in mild cognitive impairment. Neuroreport 2002, 13, 1939–1943. [Google Scholar] [CrossRef] [PubMed]
- Duin, R.P.W. Classifiers in almost empty spaces. In Proceedings of the 15th International Conference on Pattern Recognition, Barcelona, Spain, 3–7 September 2000; pp. 1–7. [Google Scholar]
- Juottonen, K.; Laakso, M.P.; Partanen, K.; Soininen, H. Comparative mr analysis of the entorhinal cortex and hippocampus in diagnosing alzheimer disease. Am. J. Neuroradiol. 1999, 20, 139–144. [Google Scholar] [PubMed]
- Morra, J.H.; Tu, Z.; Apostolova, L.G.; Green, A.E.; Avedissian, C.; Madsen, S.K.; Parikshak, N.; Toga, A.W.; Jack, C.R., Jr.; Schuff, N.; et al. Automated mapping of hippocampal atrophy in 1-year repeat mri data from 490 subjects with Alzheimer’s disease, mild cognitive impairment, and elderly controls. Neuroimage 2009, 45, S3–S15. [Google Scholar] [CrossRef]
- Colliot, O.; Chetelat, G.; Chupin, M.; Desgranges, B.; Magnin, B.; Benali, H.; Dubois, B.; Garnero, L.; Eustache, F.; Lehericy, S. Discrimination between alzheimer disease, mild cognitive impairment, and normal aging by using automated segmentation of the hippocampus. Radiology 2008, 248, 194–201. [Google Scholar] [CrossRef]
- Kantarci, K. Magnetic resonance markers for early diagnosis and progression of Alzheimer’s disease. Expert Rev. Neurother. 2005, 5, 663–670. [Google Scholar] [CrossRef]
- Maqsood, M.; Nazir, F.; Khan, U.; Aadil, F. Transfer Learning Assisted Classification and Detection of Alzheimer’s Disease Stages Using 3D MRI Scans. Sensors 2019, 19, 2645. [Google Scholar] [CrossRef]
- Islam, K.; Damiati, S.; Sethi, J.; Suhail, A.; Pan, G. Development of a Label-Free Immunosensor for Clusterin Detection as an Alzheimer’s Biomarker. Sensors 2018, 18, 308. [Google Scholar] [CrossRef]
- Toro, C.A.O.; Gonzalo Martin, C. Supervoxels-Based Histon as a New Alzheimer’s Disease Imaging Biomarker. Sensors 2018, 18, 1752. [Google Scholar] [CrossRef]
- Garyfallou, G.Z.; Ketebu, O.; Sahin, S.; Mukaetova-Ladinska, E.B.; Catt, M.; Yu, E.H. Electrochemical Detection of Plasma Immunoglobulin as a Biomarker for Alzheimer’s Disease. Sensors 2017, 17, 2464. [Google Scholar] [CrossRef]
- Lahmiri, S. Image characterization by fractal descriptors in variational mode decomposition domain: Application to brain magnetic resonance. Phys. A Stat. Mech. Its Appl. 2016, 456, 235–243. [Google Scholar] [CrossRef]
- Lahmiri, S.; Shmuel, A. Performance of machine learning methods applied to structural MRI and ADAS cognitive scores in diagnosing Alzheimer’s disease. Biomed. Signal Process. Control 2019, 52, 414–419. [Google Scholar] [CrossRef]
- Beheshti, I.; Demirel, H.; Matsuda, H. Classification of Alzheimer’s disease and prediction of mild cognitive impairment-to-Alzheimer’s conversion from structural magnetic resource imaging using feature ranking and a genetic algorithm. Comput. Biol. Med. 2017, 83, 109–119. [Google Scholar] [CrossRef] [PubMed]
- Spasov, S.; Passamonti, L.; Duggento, A.; Liò, P.; Toschi, N.; Initiative, A.S.D.N. A parameter-efficient deep learning approach to predict conversion from mild cognitive impairment to Alzheimer’s disease. Neuroimage 2019, 189, 276–287. [Google Scholar] [CrossRef]
- Catana, C.; Drzezga, A.; Heiss, W.D.; Rosen, B.R. Pet/mri for neurologic applications. J. Nucl. Med. 2012, 53, 1916–1925. [Google Scholar] [CrossRef]
- Jack, C.R., Jr.; Bernstein, M.A.; Fox, N.C.; Thompson, P.; Alexander, G.; Harvey, D.; Weiner, M.W. The Alzheimer’s Disease Neuroimaging Initiative (ADNI): MRI methods. J. Magn. Reson. Imaging 2008, 27, 685–691. [Google Scholar] [CrossRef]
- Ashburner, J.; Ridgway, G.R. Symmetric diffeomorphic modeling of longitudinal structural MRI. Front. Neurosci. 2013, 6, 197. [Google Scholar] [CrossRef]
- Farokhian, F.; Beheshti, I.; Sone, D.; Matsuda, H. Comparing CAT12 and VBM8 for detecting brain morphological abnormalities in temporal lobe epilepsy. Front. Neurol. 2017, 8, 428. [Google Scholar] [CrossRef]
- Guo, X.; Wang, Z.; Li, K.; Li, Z.; Qi, Z.; Jin, Z.; Yao, L.; Chen, K. Voxel-based assessment of gray and white matter volumes in Alzheimer’s disease. Neurosci. Lett. 2010, 468, 146–150. [Google Scholar] [CrossRef]
- Davatzikos, C.; Bhatt, P.; Shaw, L.M.; Batmanghelich, K.N.; Trojanowski, J.Q. Prediction of mci to ad conversion, via mri, csf biomarkers, and pattern classification. Neurobiol. Aging 2011, 32, 19–27. [Google Scholar] [CrossRef]
- Hinrichs, C.; Singh, V.; Xu, G.; Johnson, S.C. Predictive markers for ad in a multimodality framework: An analysis of mci progression in the adni population. Neuroimage 2011, 55, 574–589. [Google Scholar] [CrossRef] [PubMed]
- Zhang, D.; Shen, D. Multi-modal multi-task learning for joint prediction of multiple regression and classification variables in Alzheimer’s disease. Neuroimage 2012, 59, 895–907. [Google Scholar] [CrossRef] [PubMed]
- Liu, F.; Suk, H.I.; Wee, C.Y.; Chen, H.; Shen, D. High-order graph matching based feature selection for alzheimer’s disease identification. In International Conference on Medical Image Computing and Computer-Assisted Intervention; Springer-Verlag: Berlin, Germany, 2013. [Google Scholar]
- Tzourio-Mazoyer, N.; Landeau, B.; Papathanassiou, D.; Crivello, F.; Etard, O.; Delcroix, N.; Mazoyer, B.; Joliot, M. Automated anatomical labeling of activations in spm using a macroscopic anatomical parcellation of the mni mri single-subject brain. Neuroimage 2002, 15, 273–289. [Google Scholar] [CrossRef] [PubMed]
- Pearson, K. LIII. On lines and planes of closest fit to systems of points in space. Lond. Edinb. Dublin Philos. Mag. J. Sci. 1901, 2, 559–572. [Google Scholar] [CrossRef]
- Fan, Y.; Resnick, S.M.; Wu, X.; Davatzikos, C. Structural and functional biomarkers of prodromal alzheimer’s disease: A high-dimensional pattern classification study. Neuroimage 2008, 41, 277–285. [Google Scholar] [CrossRef]
- Mourao-Miranda, J.; Bokde, A.L.; Born, C.; Hampel, H.; Stetter, M. Classifying brain states and determining the discriminating activation patterns: Support Vector Machine on functional MRI data. Neuroimage 2005, 28, 980–995. [Google Scholar] [CrossRef]
- Dashtban, M.; Li, W. Deep learning for predicting non-attendance in hospital outpatient appointments. In Proceedings of the 52nd Annual Hawaii International Conference on System Sciences (HICSS), Maui, HI, USA, 8–11 January 2019; pp. 3731–3740. [Google Scholar]
- Dashtban, M.; Balafar, M. Gene selection for microarray cancer classification using a new evolutionary method employing artificial intelligence concepts. Genomics 2017, 109, 91–107. [Google Scholar] [CrossRef]
- Dashtban, M.; Balafar, M.; Suravajhala, P. Gene selection for tumor classification using a novel bio-inspired multi-objective approach. Genomics 2018, 110, 10–17. [Google Scholar] [CrossRef]
- Burges, C.J.C. A tutorial on support vector machines for pattern recognition. Data Min. Knowl. Discov. 1998, 2, 121–167. [Google Scholar] [CrossRef]
- Shawe-Taylor, J.; Cristianini, N. Support Vector Machines and Other Kernel-Based, Learning Methods; Cambridge University Press: Cambridge, UK, 2000. [Google Scholar]
- Little, R.J.; Rubin, D.B. Statistical Analysis with Missing Data; John Wiley & Sons: New York, NY, USA, 2019. [Google Scholar]
- Zhang, D.; Wang, Y.; Zhou, L.; Yuan, H.; Shen, D. Multimodal classification of Alzheimer’s disease and mild cognitive impairment. Neuroimage 2011, 55, 856–867. [Google Scholar] [CrossRef]
- Dai, D.; He, H.; Vogelstein, J.T.; Hou, Z. Accurate prediction of AD patients using cortical thickness networks. Mach. Vis. Appl. 2013, 24, 1445–1457. [Google Scholar] [CrossRef]
- Liu, J.; Li, M.; Lan, W.; Wu, F.-X.; Pan, Y.; Wang, J. Classification of Alzheimer’s disease using whole brain hierarchical network. IEEE/ACM Trans. Comput. Biol. Bioinform. 2016, 15, 624–632. [Google Scholar] [CrossRef] [PubMed]
- Mishra, S.; Beheshti, I.; Khanna, P.; Alzheimer’s Disease Neuroimaging Initiative. A statistical region selection and randomized volumetric features selection framework for early detection of Alzheimer’s disease. Int. J. Imaging Syst. Technol. 2018, 28, 302–314. [Google Scholar] [CrossRef]
- Khedher, L.; Ramírez, J.; Górriz, J.M.; Brahim, A.; Segovia, F. Early diagnosis of Alzheimer’s disease based on partial least squares, principal component analysis and support vector machine using segmented MRI images. Neurocomputing 2015, 151, 139–150. [Google Scholar] [CrossRef]
- Lian, C.; Liu, M.; Zhang, J.; Shen, D. Hierarchical Fully Convolutional Network for Joint Atrophy Localization and Alzheimer’s Disease Diagnosis using Structural MRI. IEEE Trans. Pattern Anal. Mach. Intell. 2019. [Google Scholar] [CrossRef] [PubMed]
- Ben Ahmed, O.; Benois-Pineau, J.; Allard, M.; Ben Amar, C.; Catheline, G. Classification of Alzheimer’s disease subjects from MRI using hippocampal visual features. Multimed. Tools Appl. 2014, 74, 1249–1266. [Google Scholar] [CrossRef]
- Zhou, K.; He, W.; Xu, Y.; Xiong, G.; Cai, J. Feature selection and transfer learning for alzheimer’s disease clinical diagnosis. Appl. Sci. 2018, 8, 1372. [Google Scholar] [CrossRef]
- Suk, H.-I.; Lee, S.-W.; Shen, D.; Alzheimer’s Disease Neuroimaging Initiative. Hierarchical feature representation and multimodal fusion with deep learning for AD/MCI diagnosis. Neuroimage 2014, 101, 569–582. [Google Scholar] [CrossRef]
- Aston, J.A.; Cunningham, V.J.; Asselin, M.C.; Hammers, A.; Evans, A.C.; Gunn, R.N. Positron emission tomography partial volume correction: Estimation and algorithms. J. Cereb. Blood Flow Metab. 2002, 22, 1019–1034. [Google Scholar] [CrossRef]


| Count | Male | Female | Married | Widowed | Divorced | Never Married | Average Age | Average MMSE | |
|---|---|---|---|---|---|---|---|---|---|
| AD | 156 | 76 | 80 | 127 | 18 | 8 | 3 | 74.89 | 23.32 |
| NC | 211 | 110 | 101 | 142 | 38 | 17 | 14 | 75.91 | 29.13 |
| MCI | 338 | 215 | 123 | 269 | 39 | 24 | 6 | 74.51 | 27.05 |
| Total | 705 | 401 | 304 | 538 | 95 | 49 | 23 | 75.01 | 26.85 |
| Data | Classes | ACC (%) | SEN (%) | SPE (%) | PPV (%) | NPV (%) | AUC |
|---|---|---|---|---|---|---|---|
| All Data | AD–NC | 95.54 | 93.74 | 98.32 | 98.84 | 91.09 | 0.9577 |
| AD–MCI | 81.41 | 89.02 | 68.09 | 82.99 | 78.00 | 0.7835 | |
| MCI–NC | 79.41 | 67.48 | 92.37 | 90.56 | 72.34 | 0.7993 | |
| Reduced Data Using PCA | AD–NC | 97.20 | 95.46 | 99.86 | 99.90 | 93.53 | 0.9768 |
| AD–MCI | 81.61 | 88.45 | 69.02 | 84.03 | 76.39 | 0.7846 | |
| MCI–NC | 79.45 | 67.20 | 92.96 | 91.33 | 71.97 | 0.8011 | |
| 2 × Reduced Data | AD–NC | 98.03 | 97.18 | 99.26 | 99.47 | 96.09 | 0.9831 |
| AD–MCI | 80.37 | 88.57 | 66.38 | 81.80 | 77.28 | 0.7766 | |
| MCI–NC | 79.94 | 68.49 | 91.64 | 89.31 | 74.03 | 0.7991 | |
| 3 × Reduced Data | AD–NC | 98.61 | 98.15 | 99.27 | 99.47 | 97.46 | 0.9863 |
| AD–MCI | 80.47 | 88.90 | 66.26 | 81.62 | 77.98 | 0.7767 | |
| MCI–NC | 79.93 | 68.70 | 90.80 | 87.85 | 74.98 | 0.7980 | |
| 4 × Reduced Data | AD–NC | 98.67 | 98.24 | 99.27 | 99.47 | 97.59 | 0.9876 |
| AD–MCI | 80.61 | 88.92 | 66.59 | 81.81 | 78.02 | 0.7784 | |
| MCI–NC | 80.55 | 69.84 | 90.62 | 87.47 | 76.20 | 0.7998 | |
| 5 × Reduced Data | AD–NC | 98.81 | 98.52 | 99.21 | 99.42 | 97.98 | 0.9875 |
| AD–MCI | 80.69 | 89.46 | 66.37 | 81.29 | 79.39 | 0.7803 | |
| MCI–NC | 80.92 | 70.64 | 90.17 | 86.60 | 77.36 | 0.8016 | |
| 6 × Reduced Data | AD–NC | 98.59 | 98.51 | 98.69 | 99.03 | 97.98 | 0.9866 |
| AD–MCI | 80.81 | 89.47 | 66.65 | 81.46 | 79.43 | 0.7793 | |
| MCI–NC | 80.67 | 70.26 | 90.05 | 86.43 | 77.05 | 0.8045 | |
| 7 × Reduced Data | AD–NC | 98.50 | 98.61 | 98.37 | 98.80 | 98.11 | 0.9852 |
| AD–MCI | 80.71 | 89.07 | 66.66 | 81.82 | 78.32 | 0.7778 | |
| MCI–NC | 81.44 | 71.28 | 90.54 | 87.09 | 77.89 | 0.8056 | |
| 8 × Reduced Data | AD–NC | 98.34 | 98.56 | 98.04 | 98.56 | 98.04 | 0.9835 |
| AD–MCI | 80.84 | 89.55 | 66.57 | 81.45 | 79.52 | 0.7789 | |
| MCI–NC | 81.42 | 71.51 | 90.30 | 86.84 | 77.98 | 0.8075 | |
| 9 × Reduced Data | AD–NC | 98.31 | 98.41 | 98.18 | 98.65 | 97.85 | 0.9822 |
| AD–MCI | 80.51 | 88.91 | 66.43 | 81.62 | 78.13 | 0.7767 | |
| MCI–NC | 81.40 | 71.22 | 90.54 | 87.09 | 77.82 | 0.808 |
| Method | Data type(s) (n, Dataset) | AD vs. NC | AD vs. MCI | MCI vs. NC | |||||||||
|---|---|---|---|---|---|---|---|---|---|---|---|---|---|
| Acc% | Sen% | Spec% | AUC | Acc% | Sen% | Spec% | AUC | Acc% | Sen% | Spec% | AUC | ||
| Zhang et al., 2011 [45] | MRI, PET, CSF, MMSE, ADAS-Cog (202, ADNI) | 93.20 | 93.00 | 93.30 | 0.98 | - | - | - | - | 76.40 | 81.80 | 66.00 | 0.81 |
| Dai et al., 2013 [46] | MRI (83, OASIS) | 90.81 | 92.59 | 90.33 | 0.94 | 85.92 | 82.46 | 87.59 | 0.87 | 81.92 | 78.51 | 88.34 | 0.81 |
| J. Liu et al., 2016 [47] | MRI, PET (710, ADNI) | 94.65 | 95.03 | 91.76 | 0.95 | 88.63 | 91.55 | 86.25 | 0.91 | 84.79 | 88.91 | 80.34 | 0.83 |
| Beheshti et al., 2017 [24] | MRI (186, ADNI) | 93.01 | 89.13 | 96.80 | 0.935 | - | - | - | - | - | - | - | - |
| Mishra et al., 2018 [48] | MRI (417, ADNI) | 89.15 | 85.06 | 92.53 | 0.93 | - | - | - | - | - | - | - | - |
| Khedher et al., 2015 [49] | MRI (818, ADNI) | 88.96 | 92.35 | 86.24 | 0.93 | 84.59 | 88.75 | 83.07 | 0.89 | 82.41 | 84.12 | 80.48 | 0.81 |
| Lian et al., 2019 [50] | MRI (1457, ADNI) | 90.00 | 82.00 | 97.00 | 0.95 | - | - | - | - | - | - | - | - |
| Ben Ahmed et al., 2014 [51] | MRI (218, ADNI) | 87.00 | 75.50 | 100 | 0.85 | 72.23 | 75.00 | 70.00 | 0.76 | 78.22 | 70.73 | 83.34 | 0.77 |
| Zhou et al., 2018 [52] | MRI (507, ADNI) | 93.75 | 87.5 | 100 | - | - | - | - | - | - | - | - | - |
| Suk et al., 2014 [53] | MRI, PET, CSF, MMSE, ADAS-Cog (202, ADNI) | 93.05 | 90.86 | 94.57 | 0.95 | 88.98 | 82.11 | 90.65 | 0.90 | 83.67 | 96.79 | 57.28 | 0.82 |
| Maqsood et al., [18] | MRI (392, OASIS) | 89.66 | 100 | 82 | - | - | - | - | - | - | - | - | - |
| Proposed Method (EL) | MRI, PET, CSF, MMSE (705, ADNI) | 98.81 | 98.52 | 99.21 | 0.987 | 81.61 | 88.45 | 69.02 | 0.785 | 81.40 | 71.22 | 90.54 | 0.81 |
| Data | Classes | SVM Training Time—Linear Kernel (s) | SVM Training Time—RBF Kernel (s) | Linear—RBF (S) |
|---|---|---|---|---|
| All Data | AD–NC | 5.5170 | 5.7599 | −0.2429 |
| AD–MCI | 6.7963 | 9.6903 | −2.8941 | |
| MCI–NC | 6.8982 | 9.0480 | −2.1498 | |
| Reduced Data Using PCA | AD–NC | 4.5012 | 5.2301 | −0.7289 |
| AD–MCI | 5.7727 | 6.6944 | −0.9217 | |
| MCI–NC | 7.3574 | 9.5005 | −2.1432 | |
| 3 × Reduced Data | AD–NC | 5.0067 | 7.8505 | −2.8437 |
| AD–MCI | 6.3709 | 9.9687 | −3.5978 | |
| MCI–NC | 8.1439 | 12.9038 | −4.7599 | |
| 5 × Reduced Data | AD–NC | 5.9490 | 9.6567 | −3.7077 |
| AD–MCI | 7.3554 | 12.8005 | −5.4451 | |
| MCI–NC | 11.9281 | 18.2044 | −6.2763 | |
| 9 × Reduced Data | AD–NC | 8.7938 | 12.0661 | −3.2722 |
| AD–MCI | 10.0609 | 16.9106 | −6.8497 | |
| MCI–NC | 14.0926 | 23.2651 | −9.1726 |
| CLASSES | AD–NC ACC% | AD–MCI ACC% | MCI–NC ACC% |
|---|---|---|---|
| Personal Information | 0.609 | 0.595 | 0.553 |
| MMSE Data | 0.919 | 0.785 | 0.703 |
| MRI Data | 0.868 | 0.684 | 0.697 |
| CSF Data | 0.594 | 0.524 | 0.643 |
| PET Data | 0.625 | 0.667 | 0.574 |
© 2020 by the authors. Licensee MDPI, Basel, Switzerland. This article is an open access article distributed under the terms and conditions of the Creative Commons Attribution (CC BY) license (http://creativecommons.org/licenses/by/4.0/).
Share and Cite
Akramifard, H.; Balafar, M.; Razavi, S.; Ramli, A.R. Emphasis Learning, Features Repetition in Width Instead of Length to Improve Classification Performance: Case Study—Alzheimer’s Disease Diagnosis. Sensors 2020, 20, 941. https://doi.org/10.3390/s20030941
Akramifard H, Balafar M, Razavi S, Ramli AR. Emphasis Learning, Features Repetition in Width Instead of Length to Improve Classification Performance: Case Study—Alzheimer’s Disease Diagnosis. Sensors. 2020; 20(3):941. https://doi.org/10.3390/s20030941
Chicago/Turabian StyleAkramifard, Hamid, MohammadAli Balafar, SeyedNaser Razavi, and Abd Rahman Ramli. 2020. "Emphasis Learning, Features Repetition in Width Instead of Length to Improve Classification Performance: Case Study—Alzheimer’s Disease Diagnosis" Sensors 20, no. 3: 941. https://doi.org/10.3390/s20030941
APA StyleAkramifard, H., Balafar, M., Razavi, S., & Ramli, A. R. (2020). Emphasis Learning, Features Repetition in Width Instead of Length to Improve Classification Performance: Case Study—Alzheimer’s Disease Diagnosis. Sensors, 20(3), 941. https://doi.org/10.3390/s20030941