Development of a Low-Cost UV-Vis Spectrophotometer and Its Application for the Detection of Mercuric Ions Assisted by Chemosensors


 and
and 
Abstract

1. Introduction
2. Materials and Methods
2.1. Reagents
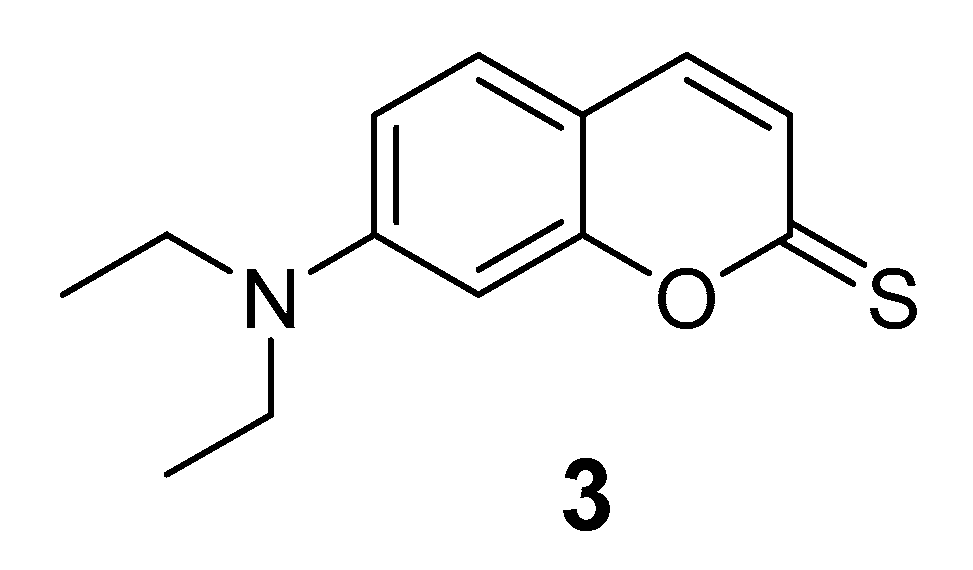
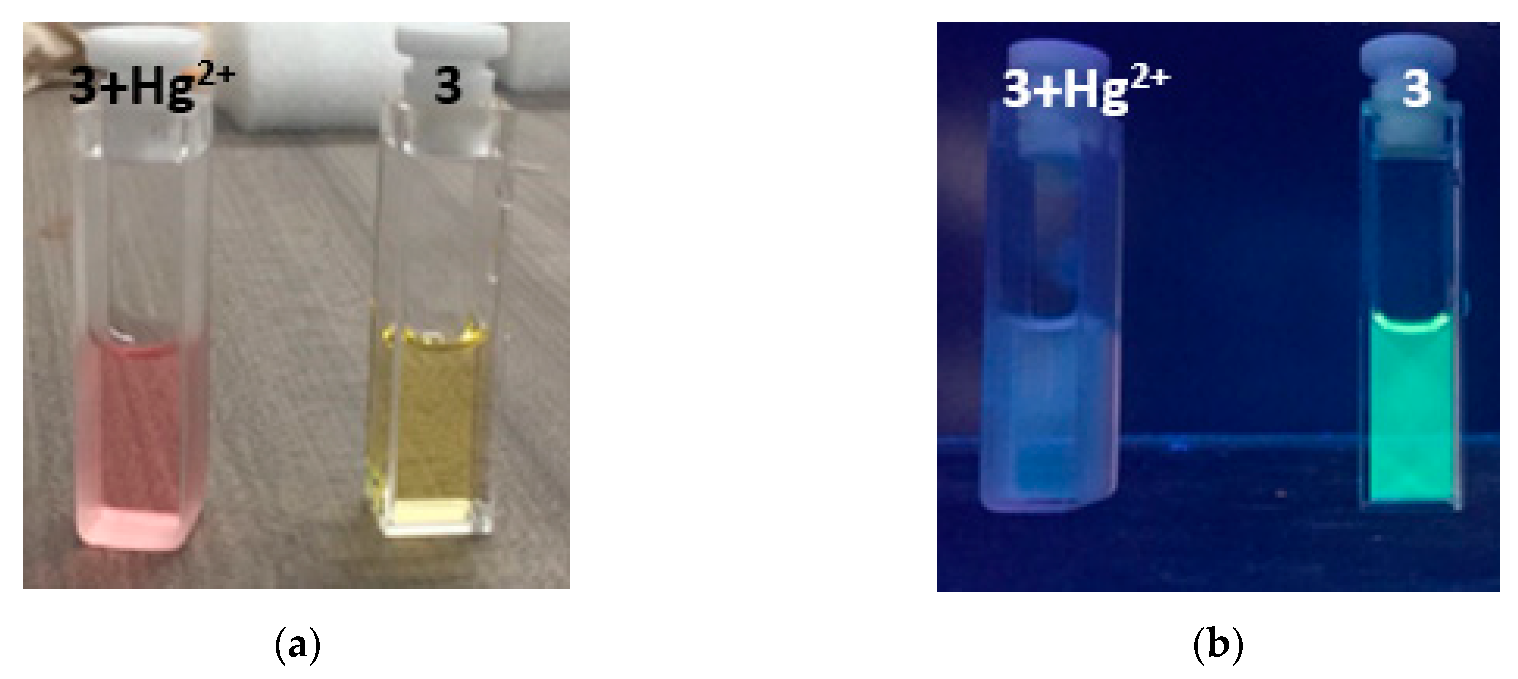
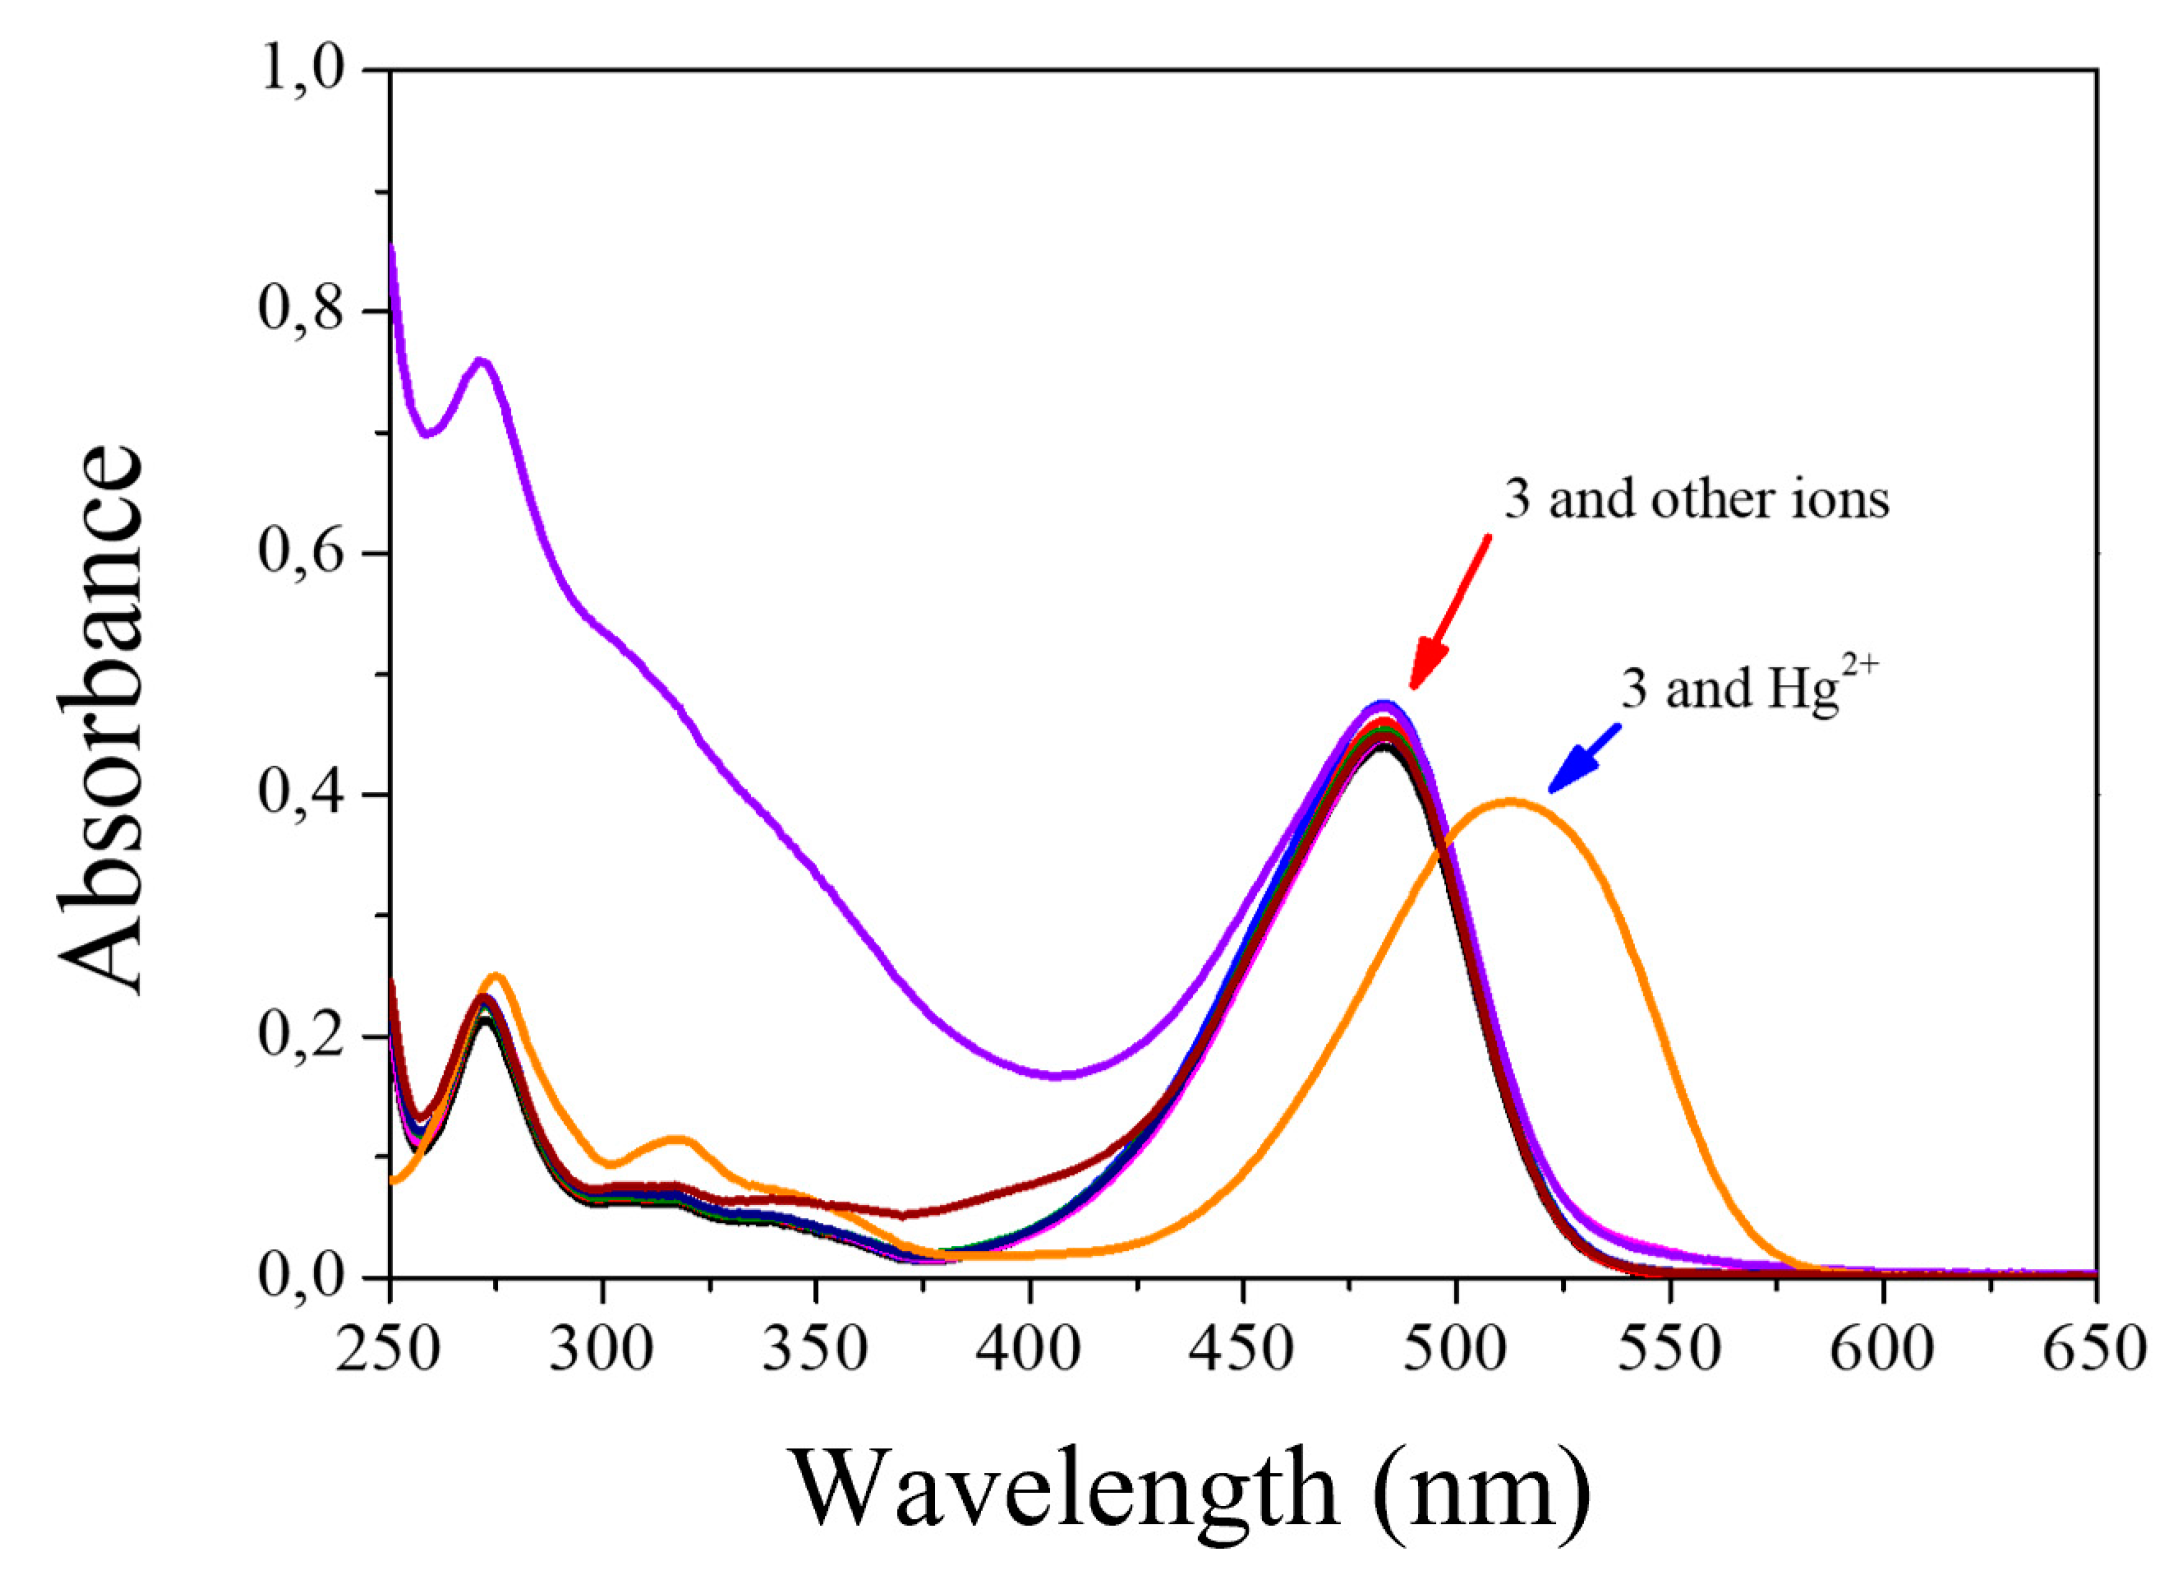
2.2. Chemosensor Development
2.3. Determining the Quantum Yield of Emission
2.4. Detection Limit
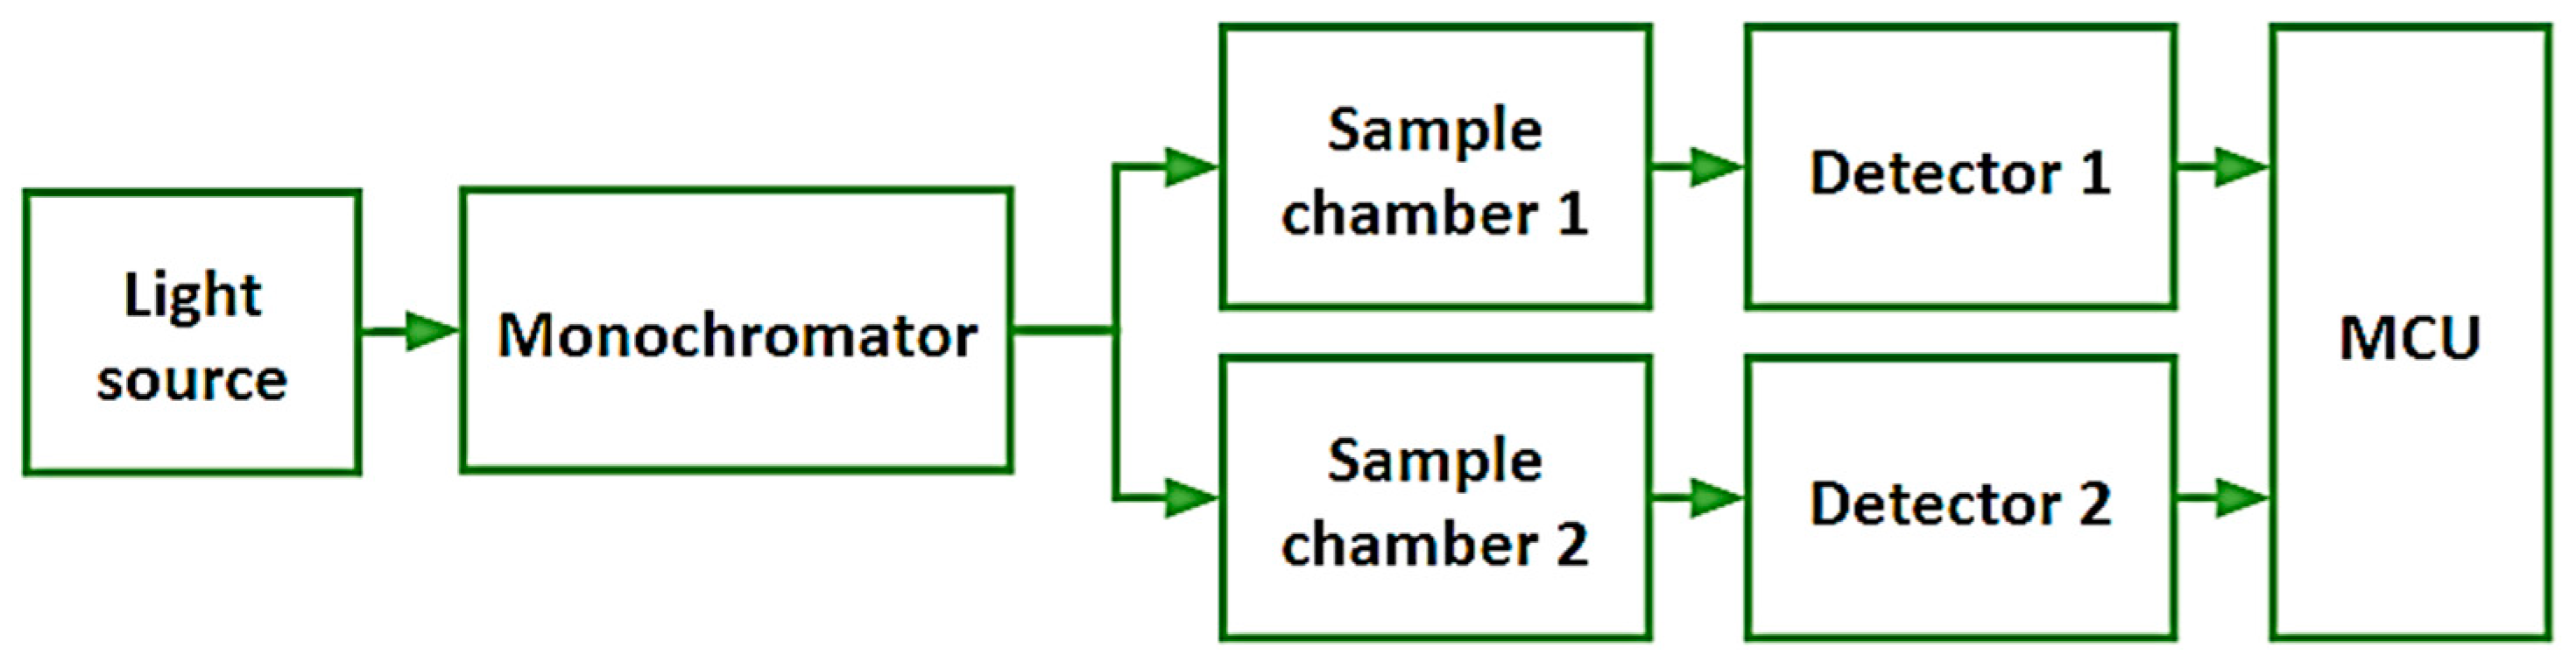
2.5. Electronic Components
2.5.1. Light Source
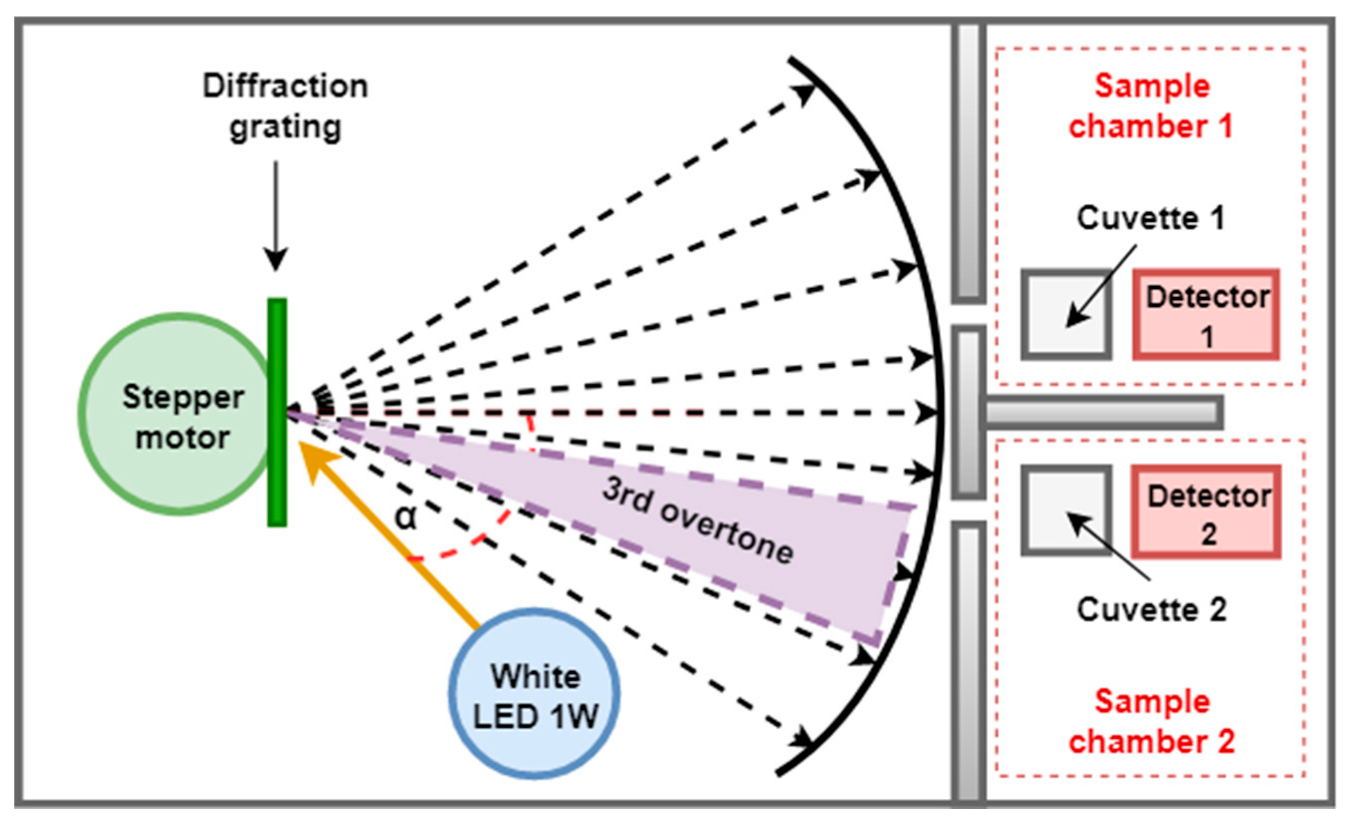
2.5.2. Monochromator
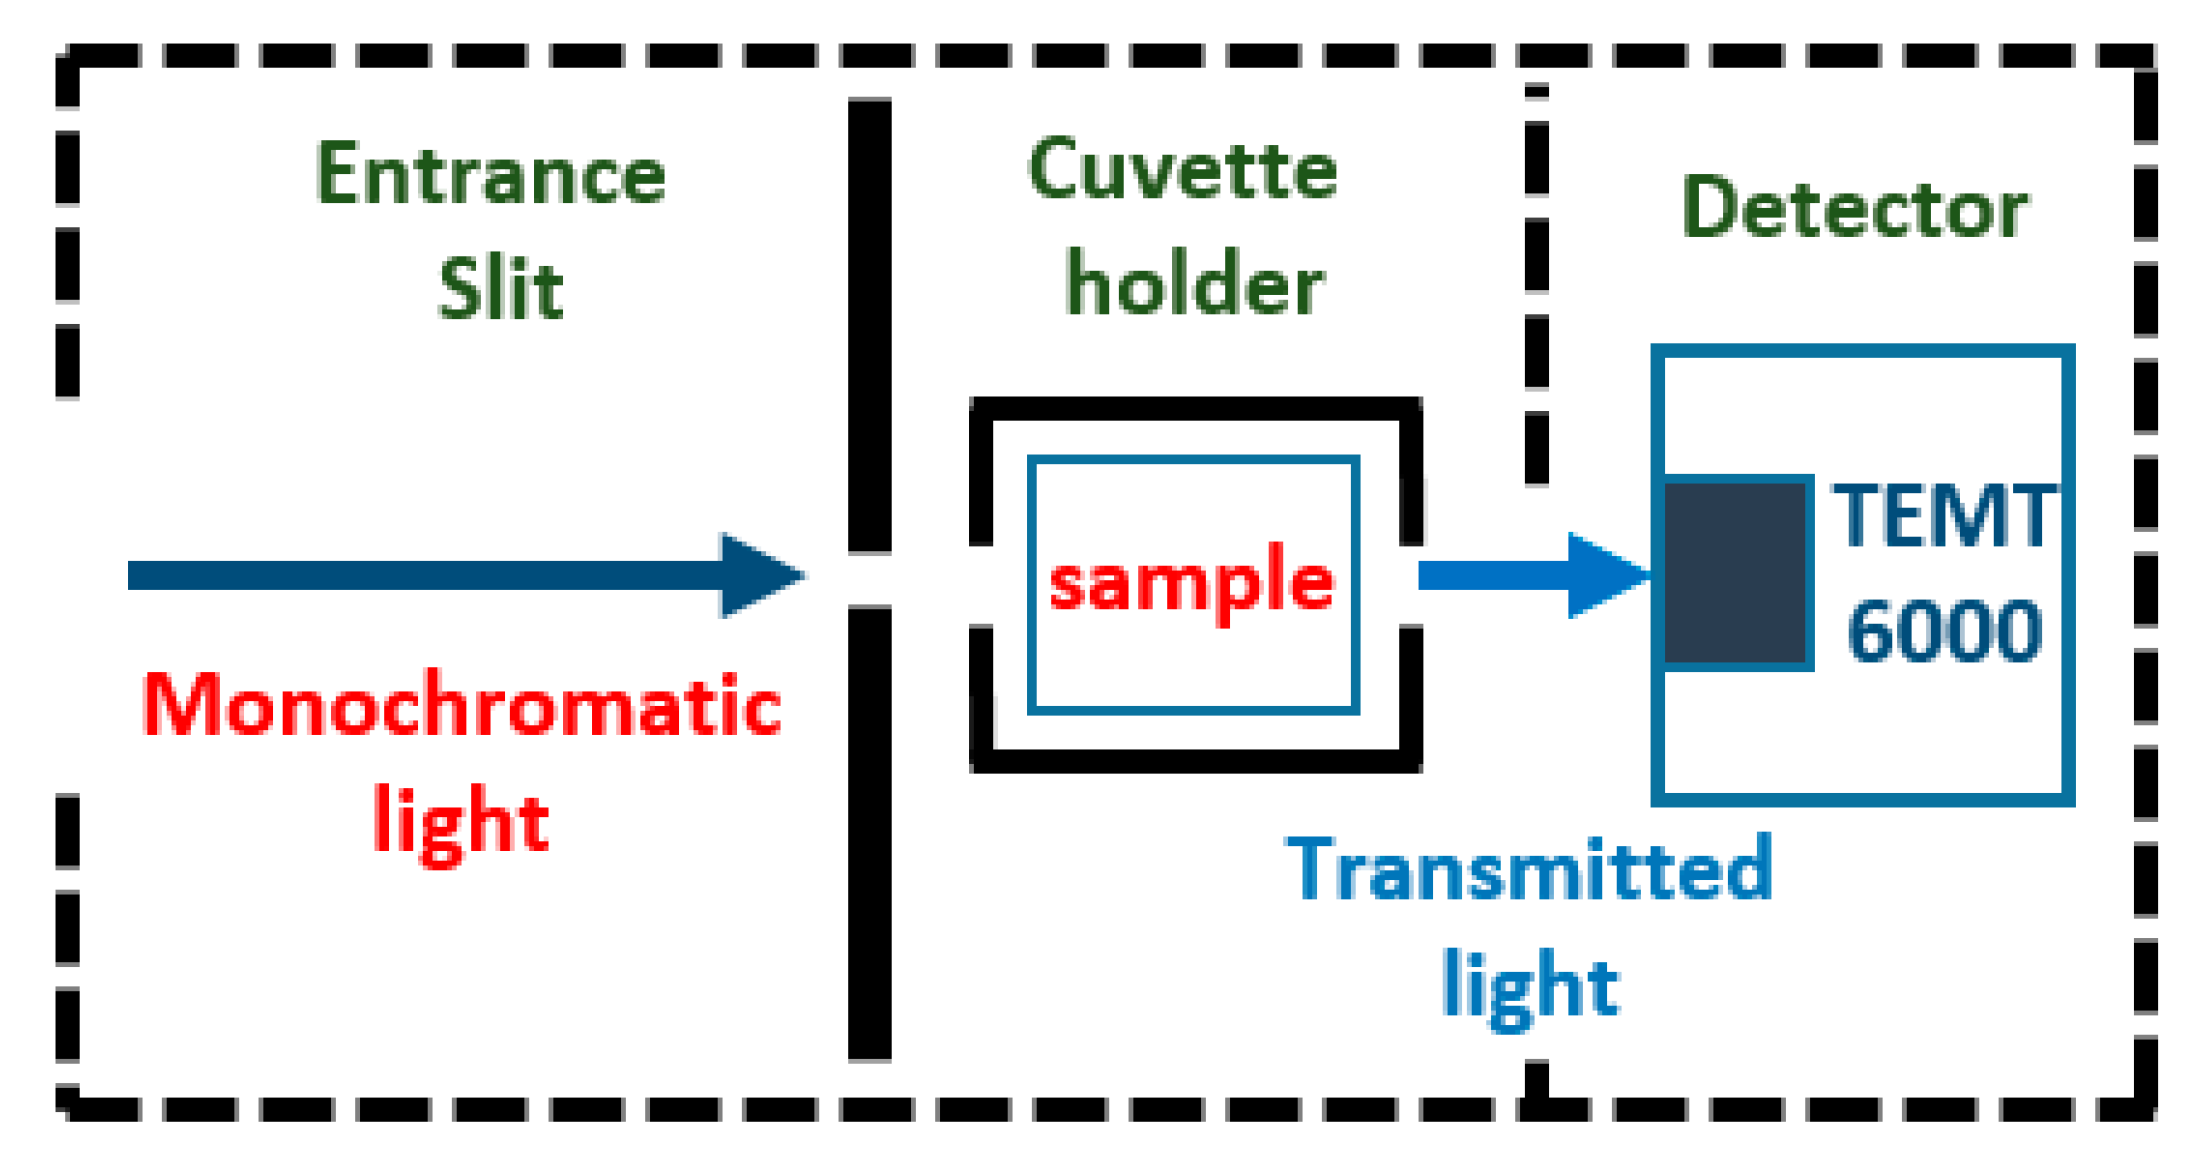
2.5.3. Detector
2.5.4. Microcontroller and Control Algorithms
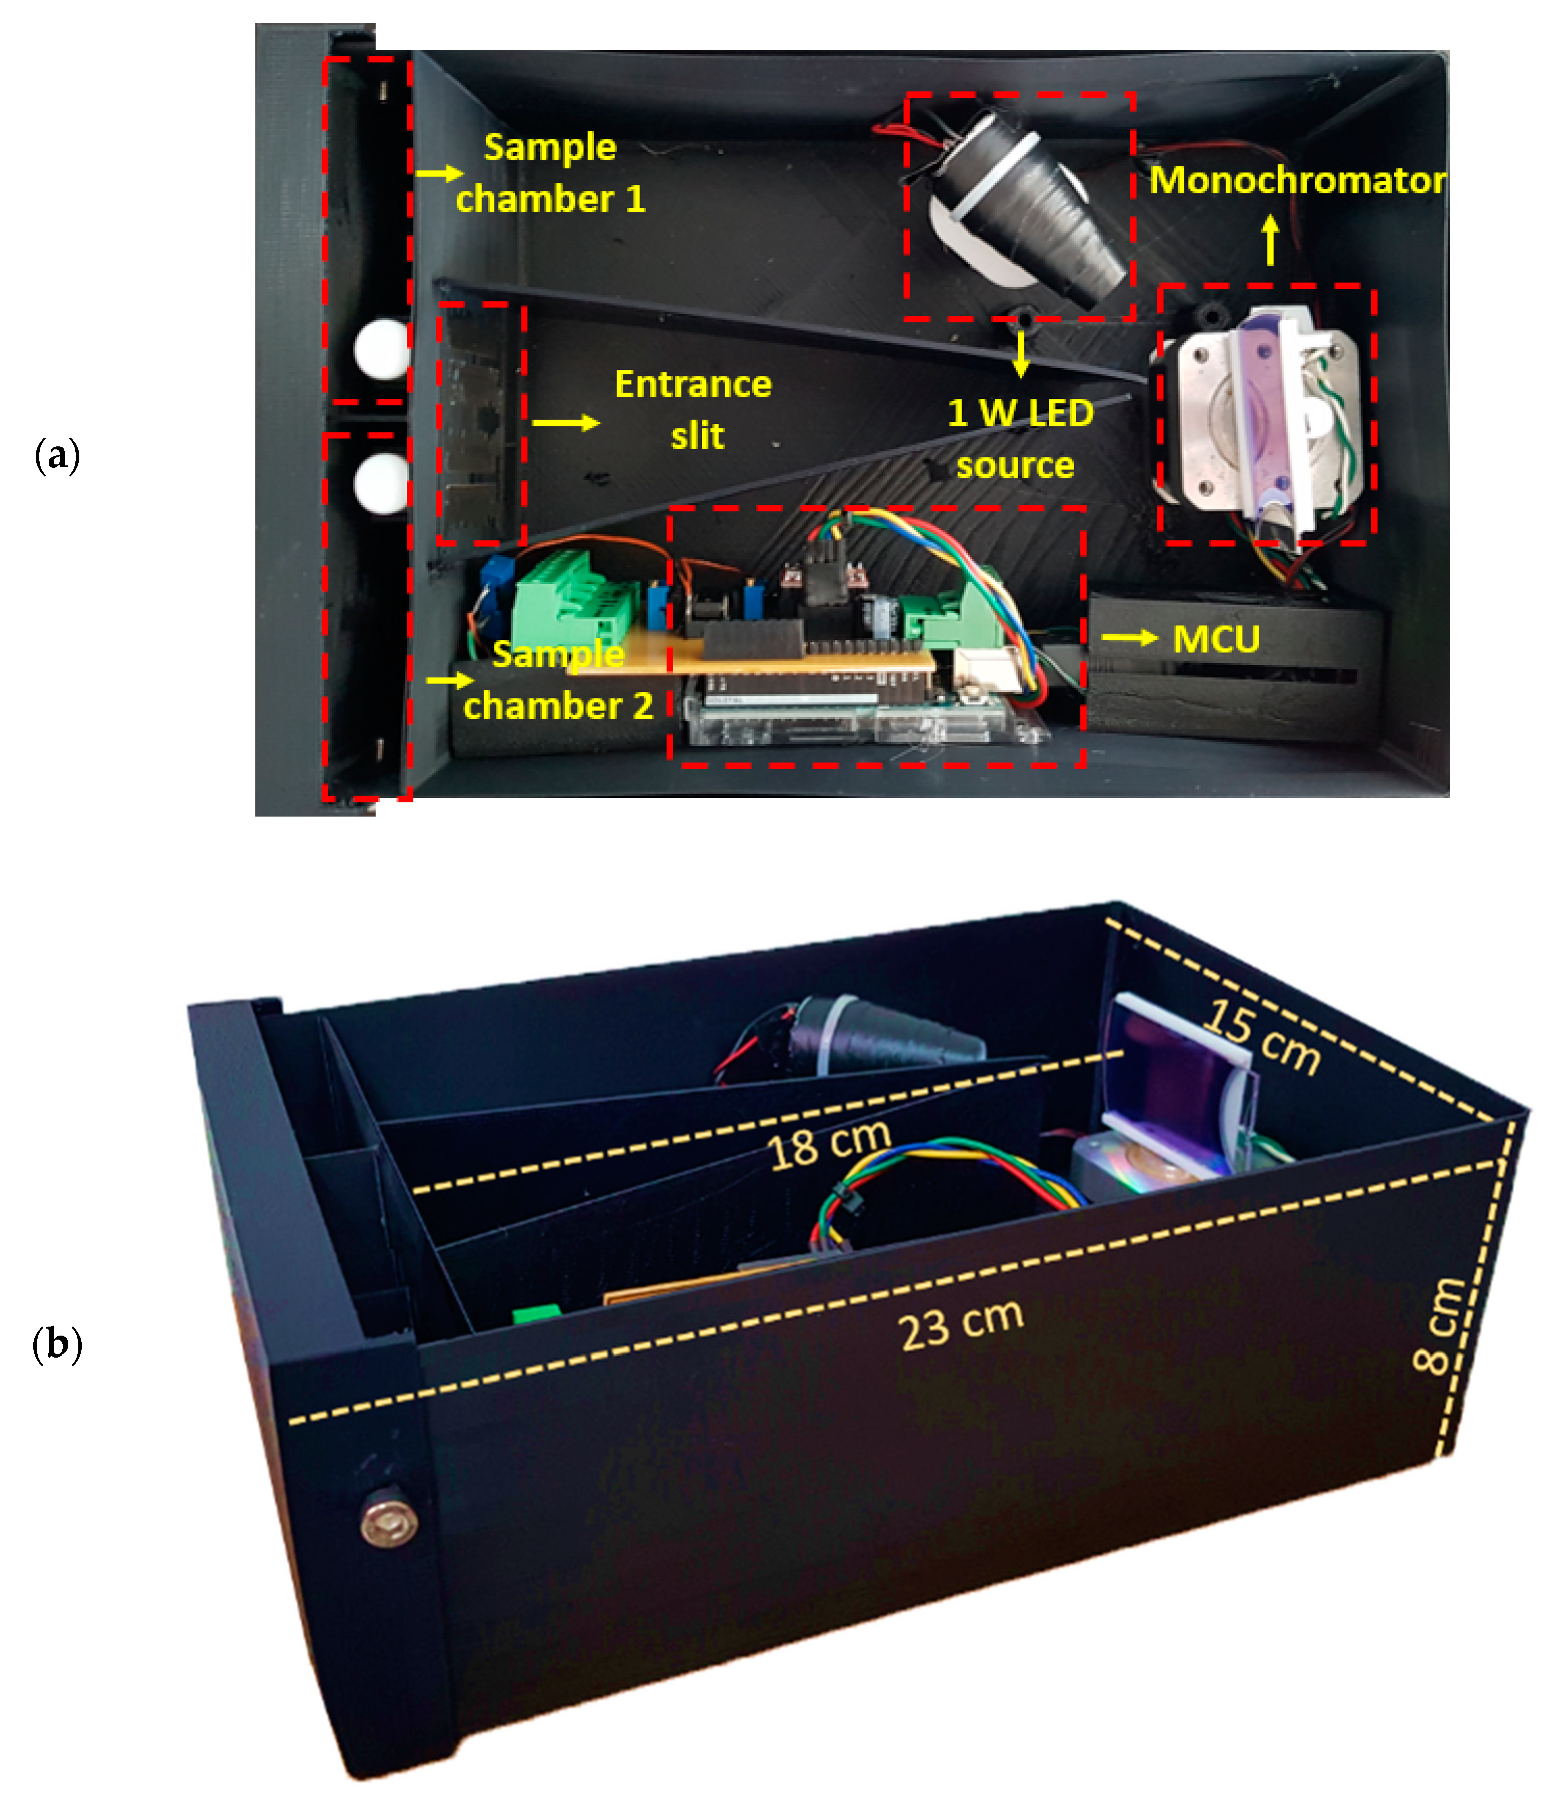
2.5.5. Detailed Hardware Setup
2.5.6. Tests Applied to the Developed System
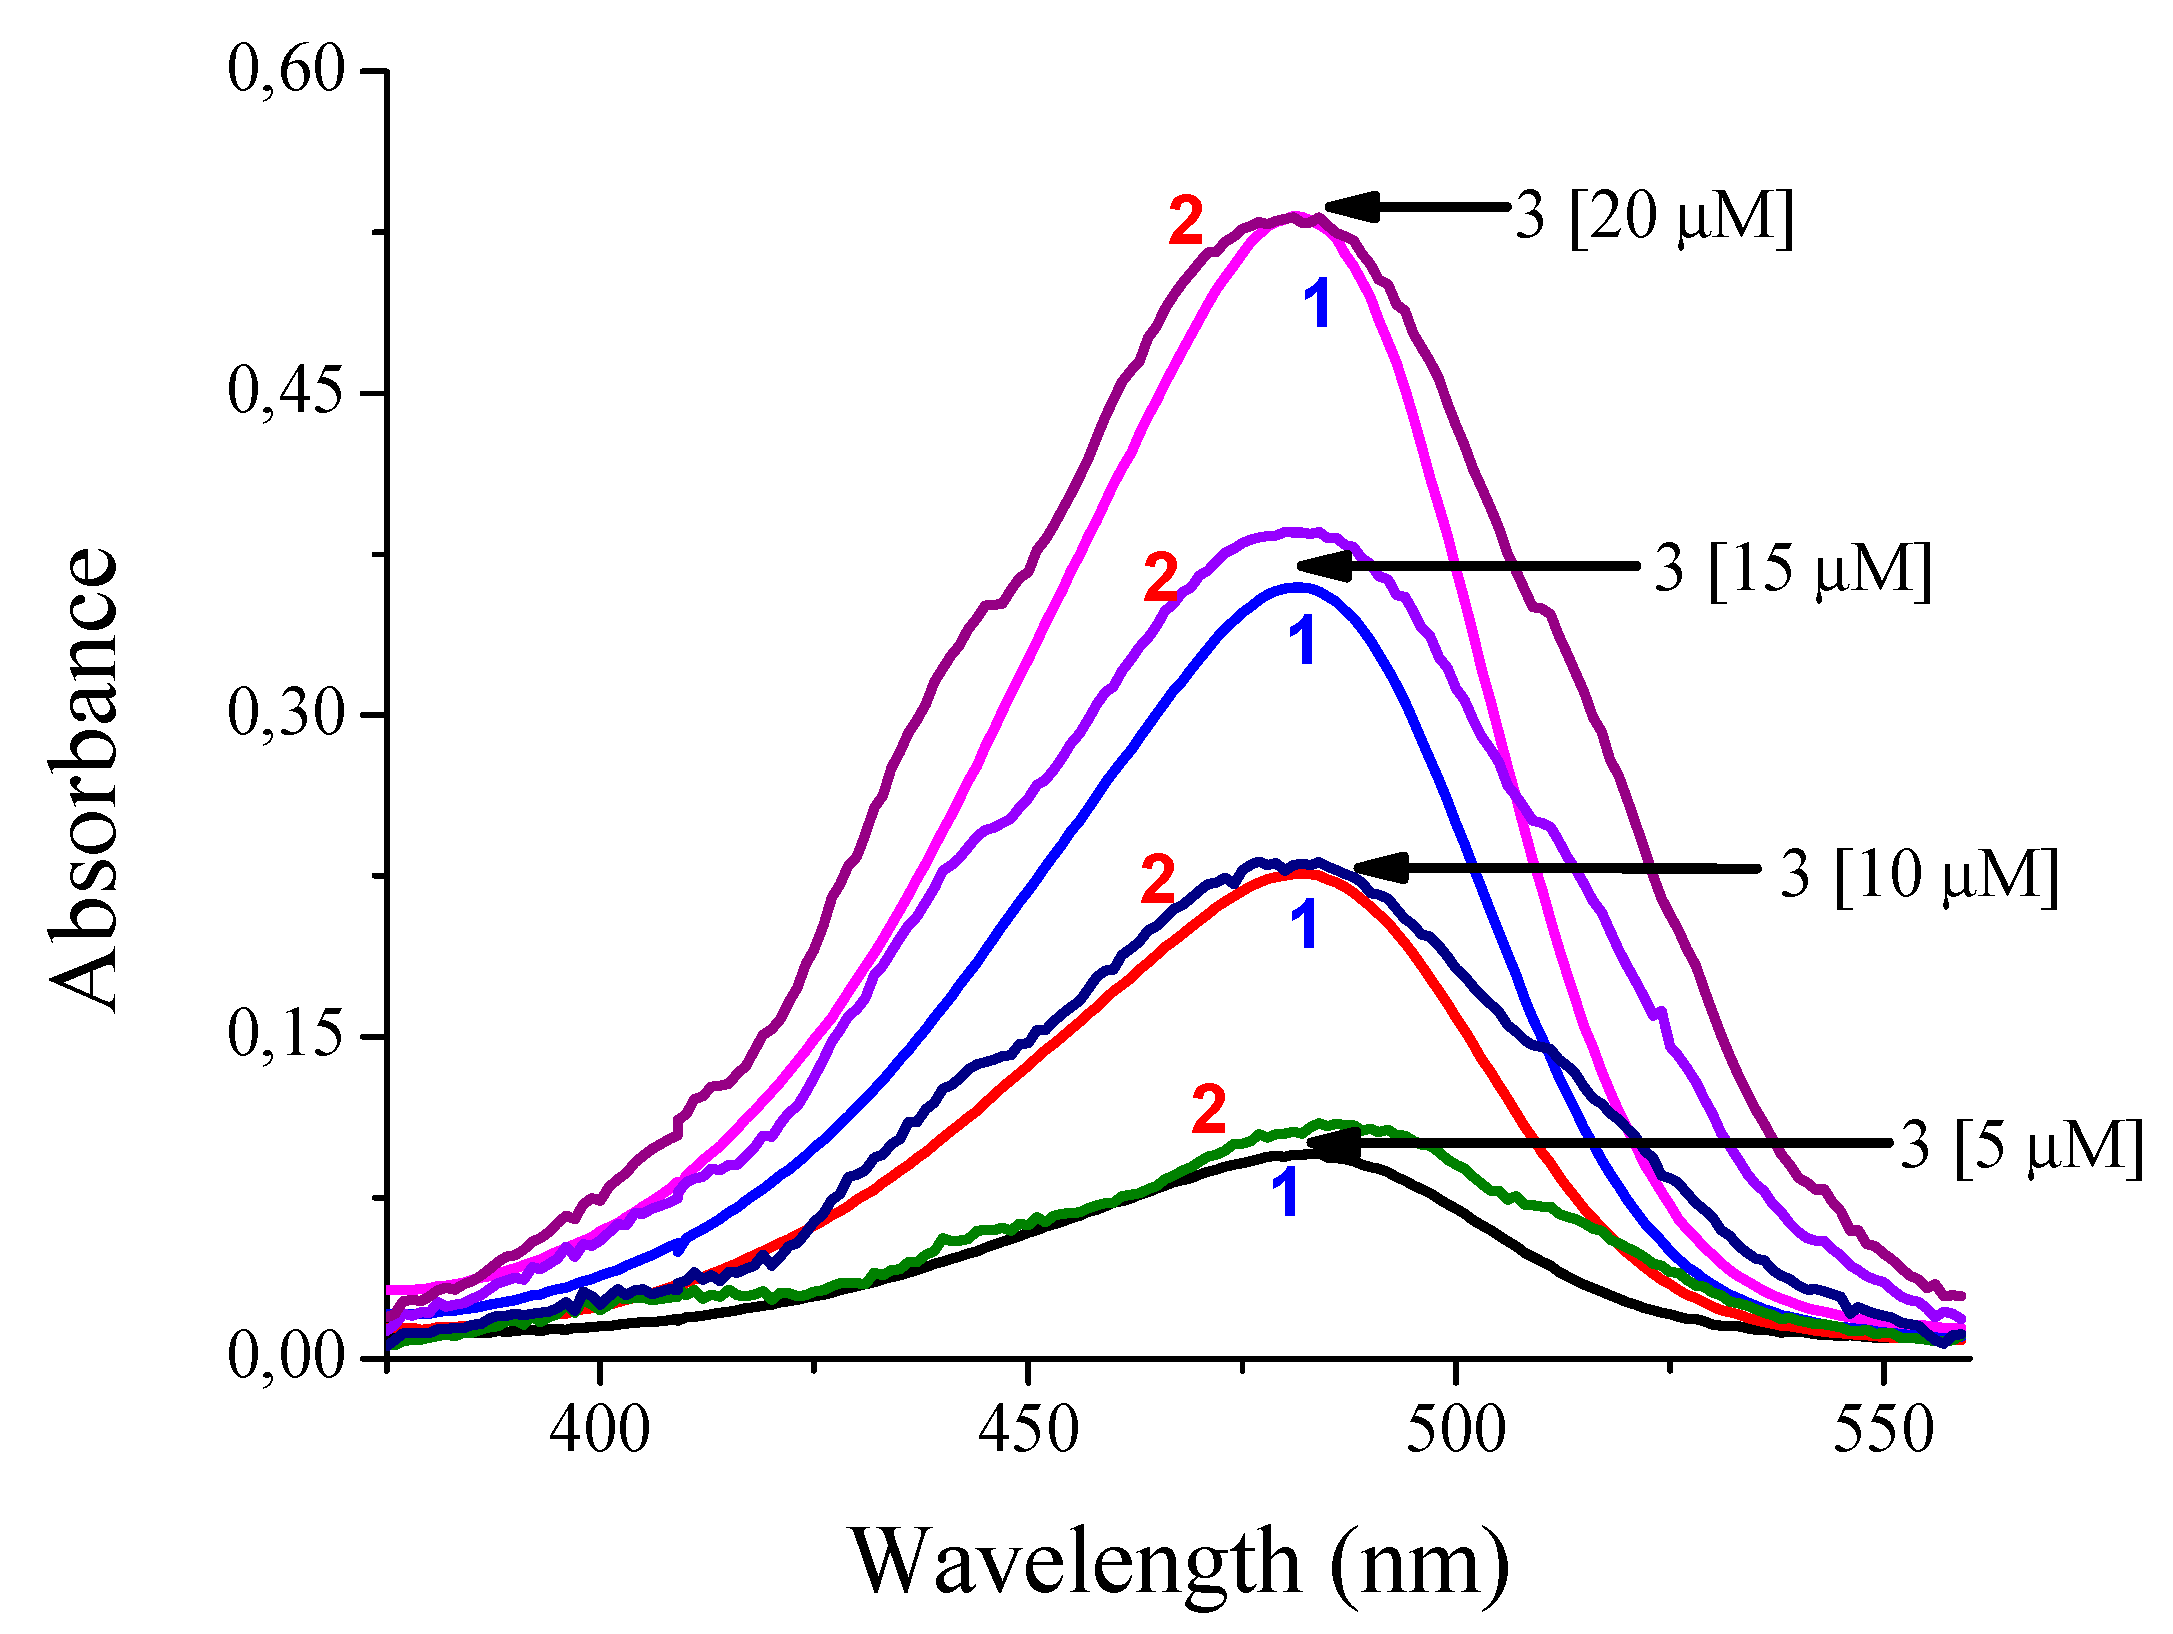
3. Results and Discussion
4. Conclusions
Supplementary Materials
Author Contributions
Funding
Acknowledgments
Conflicts of Interest
References
- Thomas, O.; Burgees, C. UV-Visible Spectrophotometry of Water and Wastewater, 2nd ed.; Elsevier Science: London, UK, 2017; p. 2. [Google Scholar]
- Cazes, J. Analytical Instrumentation Handbook, 3rd ed.; CRC Press: Boca Raton, FL, USA, 2004; p. 127. [Google Scholar]
- Perkampus, H.-H. UV-VIS Spectroscopy and Its Applications; Springer Science and Business Media LLC: Berlin, Germany, 1992; p. 12. [Google Scholar]
- Worsfold, P.; Zagatto, E. Spectrophotometry—Overview. In Encyclopedia of Analytical Science, 3rd ed.; Worsfold, P., Poole, C., Townshend, A., Miró, M., Eds.; Academic Press: Oxford, UK, 2019; pp. 244–248. [Google Scholar]
- Noui, L.; Hill, J.; Keay, P.J.; Wang, R.Y.; Smith, T.; Yeung, K.; Habib, G.; Hoare, M. Development of a high resolution UV spectrophotometer for at-line monitoring of bioprocesses. Chem. Eng. Process. Process. Intensif. 2002, 41, 107–114. [Google Scholar] [CrossRef]
- Gonzaga, F.B.; Pasquini, C. A low cost short wave near infrared spectrophotometer: Application for determination of quality parameters of diesel fuel. Anal. Chim. Acta 2010, 670, 92–97. [Google Scholar] [CrossRef] [PubMed]
- O’Toole, M.; Diamond, D. Absorbance Based Light Emitting Diode Optical Sensors and Sensing Devices. Sensors 2008, 8, 2453–2479. [Google Scholar] [CrossRef] [PubMed]
- Chuen, W.; Khoo, B.; Abdullah, A.F. A simple, low-cost and portable LED-based multi-wavelentgth light source for forensic application. Proc. Int. Soc. Opt. Photonics (SPIE) 2012, 8560, 18–27. [Google Scholar]
- Chaianantakul, N.; Wutthi, K.; Kamput, N.; Pramanpol, N.; Janphuang, P.; Pummara, W.; Phimon, K.; Phatthanakun, R. Development of mini-spectrophotometer for determination of plasma glucose. Spectrochim. Acta Part A Mol. Biomol. Spectrosc. 2018, 204, 670–676. [Google Scholar] [CrossRef]
- Yeh, T.S.; Tseng, S.S. A Low Cost LED Based Spectrometer. J. Chin. Chem. Soc. 2013, 53, 1067–1072. [Google Scholar] [CrossRef]
- Hardie, K.; Agne, S.; Kuntz, K.B.; Jennewein, T. Inexpensive LED-based spectrophotometer for analyzing optical coatings. Instrum. Detect. 2016, 1–19. [Google Scholar]
- Masi, A.J.; Sesselmann, M.; Rodrigues, D.L. A Compact System for Measurement of Absorbance of Light. In Proceedings of the Society for Experimental Mechanics Series; Springer Science and Business Media LLC: Berlin, Germany, 2011; Volume 6, pp. 773–780. [Google Scholar]
- Visconti, P.; Lay-Ekuakille, A.; Primiceri, P.; Ciccarese, G.; De Fazio, R. Hardware Design and Software Development for a White LED-Based Experimental Spectrophotometer Managed by a PIC-Based Control System. IEEE Sens. J. 2017, 17, 2507–2515. [Google Scholar] [CrossRef]
- Albert, D.R.; Todt, M.A.; Davis, H.F. A Low-Cost Quantitative Absorption Spectrophotometer. J. Chem. Educ. 2012, 89, 1432–1435. [Google Scholar] [CrossRef]
- Alam, A.E.; Islam, R.; Faria, I.J. Development and validation of a low-cost visible light spectrophotometer. In Proceedings of the 2017 4th International Conference on Advances in Electrical Engineering (ICAEE), Dhaka, Bangladesh, 28–30 September 2017; pp. 653–657. [Google Scholar]
- Kittipanyangam, S.; Abe, K.; Eguchi, K. Design of a measurement device explaining the relationship between the concentration of solution and the light absorbance for chemical education. In Proceedings of the 2016 13th International Conference on Electrical Engineering/Electronics, Computer, Telecommunications and Information Technology (ECTI-CON), Chiang Mai, Thailand, 28 June–1 July 2016; pp. 1–6. [Google Scholar]
- Liu, S.-M. The Development of a Portable Spectrophotometer for Noncontact Color Measurement. IEEE Trans. Instrum. Meas. 2004, 53, 155–162. [Google Scholar] [CrossRef]
- Bano, S.; Altaf, T.; Akbar, S. Microcontrolled based spectrophotometer using compact disc as diffraction grid. Asia Commun. Photonics Conf. Exhib. 2010, 332–336. [Google Scholar]
- Veras, G.; Silva, E.C.; Lyra, W.S.; Soares, S.F.C.; Guerreiro, T.B.; Santos, S.R.B.; Neto, J.G.V. A portable, inexpensive and microcontrolled spectrophotometer based on white LED as light source and CD media as diffraction grid. Talanta 2009, 77, 1155–1159. [Google Scholar] [CrossRef] [PubMed]
- Zhang, X.; Fang, Y.; Zhao, Y. A Portable Spectrophotometer for Water Quality Analysis. Sens. Transducers 2013, 148, 47–51. [Google Scholar]
- Chen, P.-J.; Wang, H.-T.; Lin, L.-Y.; Hsu, B.-D.; Liu, D.-R.; Hwang, C.-H.; Wu, W.-H. A Practical Portable Photometer using LEDs as Inspection light source. In Proceedings of the 2017 IEEE International Instrumentation and Measurement Technology Conference (I2MTC), Turin, Italy, 22–25 May 2017; pp. 1–6. [Google Scholar]
- Cary 60 UV-Vis Spectrophotometer. Available online: https://www.agilent.com/en/products/uv-vis-uv-vis-nir/uv-vis-uv-vis-nir-systems/cary-60-uv-vis (accessed on 12 June 2018).
- DR-1900 Portable Spectrophotometer. Available online: https://www.hach.com/dr1900-portable-spectrophotometer/product?id=18915675456 (accessed on 12 June 2018).
- García-Beltrán, O.; Mena, N.; Berríos, T.A.; Castro, E.A.; Cassels, B.K.; Núñez, M.T.; Aliaga, M.E. A selective fluorescent probe for the detection of mercury (II) in aqueous media and its applications in living cells. Tetrahedron Lett. 2012, 53, 6598–6601. [Google Scholar] [CrossRef]
- Cordy, P.; Veiga, M.M.; Salih, I.; Al-Saadi, S.; Console, S.; Garcia, O.; Mesa, L.A.; Velásquez-López, P.C.; Roeser, M. Mercury contamination from artisanal gold mining in Antioquia, Colombia: The world’s highest per capita mercury pollution. Sci. Total. Environ. 2011, 410, 154–160. [Google Scholar] [CrossRef] [PubMed]
- Palacios-Torres, Y.; Caballero-Gallardo, K.; Olivero-Verbel, J. Mercury pollution by gold mining in a global biodiversity hotspot, the Choco biogeographic region, Colombia. Chemosphere 2018, 193, 421–430. [Google Scholar] [CrossRef] [PubMed]
- García-Beltrán, O.; Rodriguez, A.; Trujillo, A.; Cañete, A.; Aguirre, P.; Gallego-Quintero, S.; Núñez, M.T.; Aliaga, M.E. Synthesis and characterization of a novel fluorescent and colorimetric probe for the detection of mercury (II) even in the presence of relevant biothiols. Tetrahedron Lett. 2015, 56, 5761–5766. [Google Scholar] [CrossRef]
- Wang, Y.; Gao, M.; Liao, C.; Yu, F.; Chen, L. A sulfydryl-based near-infrared ratiometic fluorescent probe for assessment of acute/chronic mercury exposure via associated determination of superoxide anion and mercury ion in cells and in vivo. Sens. Actuators B Chem. 2019, 301, 127038. [Google Scholar] [CrossRef]
- He, Q.; Zhang, Q.; Cao, W.; Yin, T.; Zhao, S.; Yin, X.; Zhao, H.; Tao, W. Detecting trace of mercury ions in water using photoacoustic method enhanced by gold nanospheres. Microchem. J. 2019, 150, 104058. [Google Scholar] [CrossRef]
- Korbas, M.; O’Donoghue, J.L.; Watson, G.E.; Pickering, I.J.; Singh, S.P.; Myers, G.J.; Clarkson, T.W.; George, G.N. The Chemical Nature of Mercury in Human Brain Following Poisoning or Environmental Exposure. ACS Chem. Neurosci. 2010, 1, 810–818. [Google Scholar] [CrossRef]
- Zhou, Y.; Vaidya, V.S.; Brown, R.P.; Zhang, J.; Rosenzweig, B.A.; Thompson, K.L.; Miller, T.J.; Bonventre, J.V.; Goering, P.L. Comparison of kidney injury molecule-1 and other nephrotoxicity biomarkers in urine and kidney following acute exposure to gentamicin, mercury, and chromium. Toxicol. Sci. 2007, 101, 159–170. [Google Scholar] [CrossRef] [PubMed]
- Milioni, A.L.V.; Nagy, B.V.; Moura, A.L.A.; Zachi, E.C.; Barboni, M.T.; Ventura, D.F. Neurotoxic impact of mercury on the central nervous system evaluated by neuropsychological tests and on the autonomic nervous system evaluated by dynamic pupillometry. NeuroToxicology 2017, 59, 263–269. [Google Scholar] [CrossRef] [PubMed]
- Das, K.; Siebert, U.; Gillet, A.; Dupont, A.; Di-Poï, C.; Fonfara, S.; Mazzucchelli, G.; De Pauw, E.; De Pauw-Gillet, M.-C. Mercury immune toxicity in harbour seals: Links to in vitro toxicity. Environ. Health 2008, 7, 52. [Google Scholar] [CrossRef] [PubMed]
- Tan, S.W.; Meiller, J.C.; Mahaffey, K.R. The endocrine effects of mercury in humans and wildlife. Crit. Rev. Toxicol. 2009, 39, 228–269. [Google Scholar] [CrossRef] [PubMed]
- Aliaga, M.; Gazitua, M.; Rojas-Bolaños, A.; Fuentes-Estrada, M.; Durango, D.; García-Beltrán, O. A selective thioxothiazolidin-coumarin probe for Hg2+ based on its desulfurization reaction. Exploring its potential for live cell imaging. Spectrochim. Acta Part A Mol. Biomol. Spectrosc. 2020, 224, 117372. [Google Scholar] [CrossRef] [PubMed]
- Hanna, C.P.; Tyson, J.F.; McIntosh, S. Determination of total mercury in waters and urine by flow injection atomic absorption spectrometry procedures involving on- and off-line oxidation of organomercury species. Anal. Chem. 1993, 65, 653–656. [Google Scholar] [CrossRef]
- Darbha, G.K.; Singh, A.K.; Rai, U.S.; Yu, E.; Yu, H.; Ray, P.C. Selective Detection of Mercury (II) Ion Using Nonlinear Optical Properties of Gold Nanoparticles. J. Am. Chem. Soc. 2008, 130, 8038–8043. [Google Scholar] [CrossRef]
- Leermakers, M.; Baeyens, W.; Quevauviller, P.; Horvat, M. Mercury in environmental samples: Speciation, artifacts and validation. TrAC Trends Anal. Chem. 2005, 24, 383–393. [Google Scholar] [CrossRef]
- Zhang, Y.; Chen, H.; Chen, D.; Wu, D.; Chen, Z.; Zhang, J.; Chen, X.; Liu, S.; Yin, J. A colorimetric and ratiometric fluorescent probe for mercury (II) in lysosome. Sens. Actuators B Chem. 2016, 224, 907–914. [Google Scholar] [CrossRef]
- Zhang, W.-B.; Sun, C.-X.; Yang, X.-A. Magnetic solid-phase extraction combined with in situ slurry cold vapor generation atomic fluorescence spectrometry for preconcentration and determination of ultratrace mercury. Anal. Methods 2014, 6, 2876–2882. [Google Scholar] [CrossRef]
- Wang, L.; Zhou, J.-B.; Wang, X.; Wang, Z.-H.; Zhao, R.-S. Simultaneous determination of copper, cobalt, and mercury ions in water samples by solid-phase extraction using carbon nanotube sponges as adsorbent after chelating with sodium diethyldithiocarbamate prior to high performance liquid chromatograph. Anal. Bioanal. Chem. 2016, 408, 4445–4453. [Google Scholar] [CrossRef] [PubMed]
- Wang, N.; Lin, M.; Dai, H.; Ma, H. Functionalized gold nanoparticles/reduced graphene oxide nanocomposites for ultrasensitive electrochemical sensing of mercury ions based on thymineemercuryethymine structure. Biosens. Bioelectron. 2016, 79, 320–326. [Google Scholar] [CrossRef] [PubMed]
- Wang, Y.; Jiang, L.; Leng, Q.; Wu, Y.; He, X.; Wang, K. Electrochemical sensor for glutathione detection based on mercury ion triggered hybridization chain reaction signal amplification. Biosens. Bioelectron. 2016, 77, 914–920. [Google Scholar] [CrossRef] [PubMed]
- Bui, M.-P.N.; Brockgreitens, J.; Ahmed, S.; Abbas, A. Dual detection of nitrate and mercury in water using disposable electrochemical sensors. Biosens. Bioelectron. 2016, 85, 280–286. [Google Scholar] [CrossRef] [PubMed]
- Aliaga, M.E.; García-Río, L.; Pessêgo, M.; Montecinos, R.; Fuentealba, D.; Uribe, I.; Martín-Pastor, M.; García-Beltrán, O. Host–guest interaction of coumarin-derivative dyes and cucurbit[7]uril: Leading to the formation of supramolecular ternary complexes with mercuric ions. New J. Chem. 2015, 39, 3084–3092. [Google Scholar] [CrossRef]
- Qin, S.; Chen, B.; Huang, J.; Han, Y. A Thiocoumarin-Based Colorimetric and Ratiometric Fluorescent Probe for Hg2+ in Aqueous Solution and Its Application in Live-Cell Imaging. New J. Chem. 2018, 42, 12766–12772. [Google Scholar] [CrossRef]
- Bui, D.A.; Hauser, P.C. Analytical devices based on light-emitting diodes—A review of the state-of-the-art. Anal. Chim. Acta 2015, 853, 46–58. [Google Scholar] [CrossRef]
- Shivok, T. Diffraction Gratings; US Naval Academy Annapolis: Annapolis, MD, USA, 2014. [Google Scholar]
- Passos, M.L.; Saraiva, M.L.M. Detection in UV-visible spectrophotometry: Detectors, detection systems, and detection strategies. Measurement 2019, 135, 896–904. [Google Scholar] [CrossRef]
- Gonzalez-Morales, D.F.; Lopez-Santos, O.; Garcia-Beltran, O. Low-Cost Spectrophotometer for In-Situ Detection of Mercury in Water. In Proceedings of the 2018 IEEE SENSORS, New Delhi, India, 28–31 October 2018; pp. 1–4. [Google Scholar]


| Grating | Lines (inch) | Lines (mm) | Grating Separation (nm) |
|---|---|---|---|
| CD | 15,875 | 625 | 1600 |
| DVD | 34,300 | 1350 | 740 |
| Lab grade diffraction grating | 34,300 | 1000 | 1000 |
| Color | Wavelength (nm) | Deflection Angle (°) |
|---|---|---|
| red | 650 | 61 |
| orange | 600 | 54 |
| yellow | 575 | 51 |
| green | 550 | 48 |
| blue-green | 500 | 42.5 |
| blue | 450 | 37.5 |
| violet | 400 | 32.7 |
| Wavelength | Absorbed Color | Solution Color |
|---|---|---|
| 380–435 | Violet | Green-yellow |
| 435–480 | Blue | Yellow |
| 480–490 | Blue-green | Orange |
| 490–500 | Green-blue | Red |
| 500–560 | Green | Violet |
| 560–580 | Green-yellow | Violet |
| 580–595 | Yellow | Blue |
| 595–650 | Orange | Blue-green |
| 650–780 | Red | Green-blue |
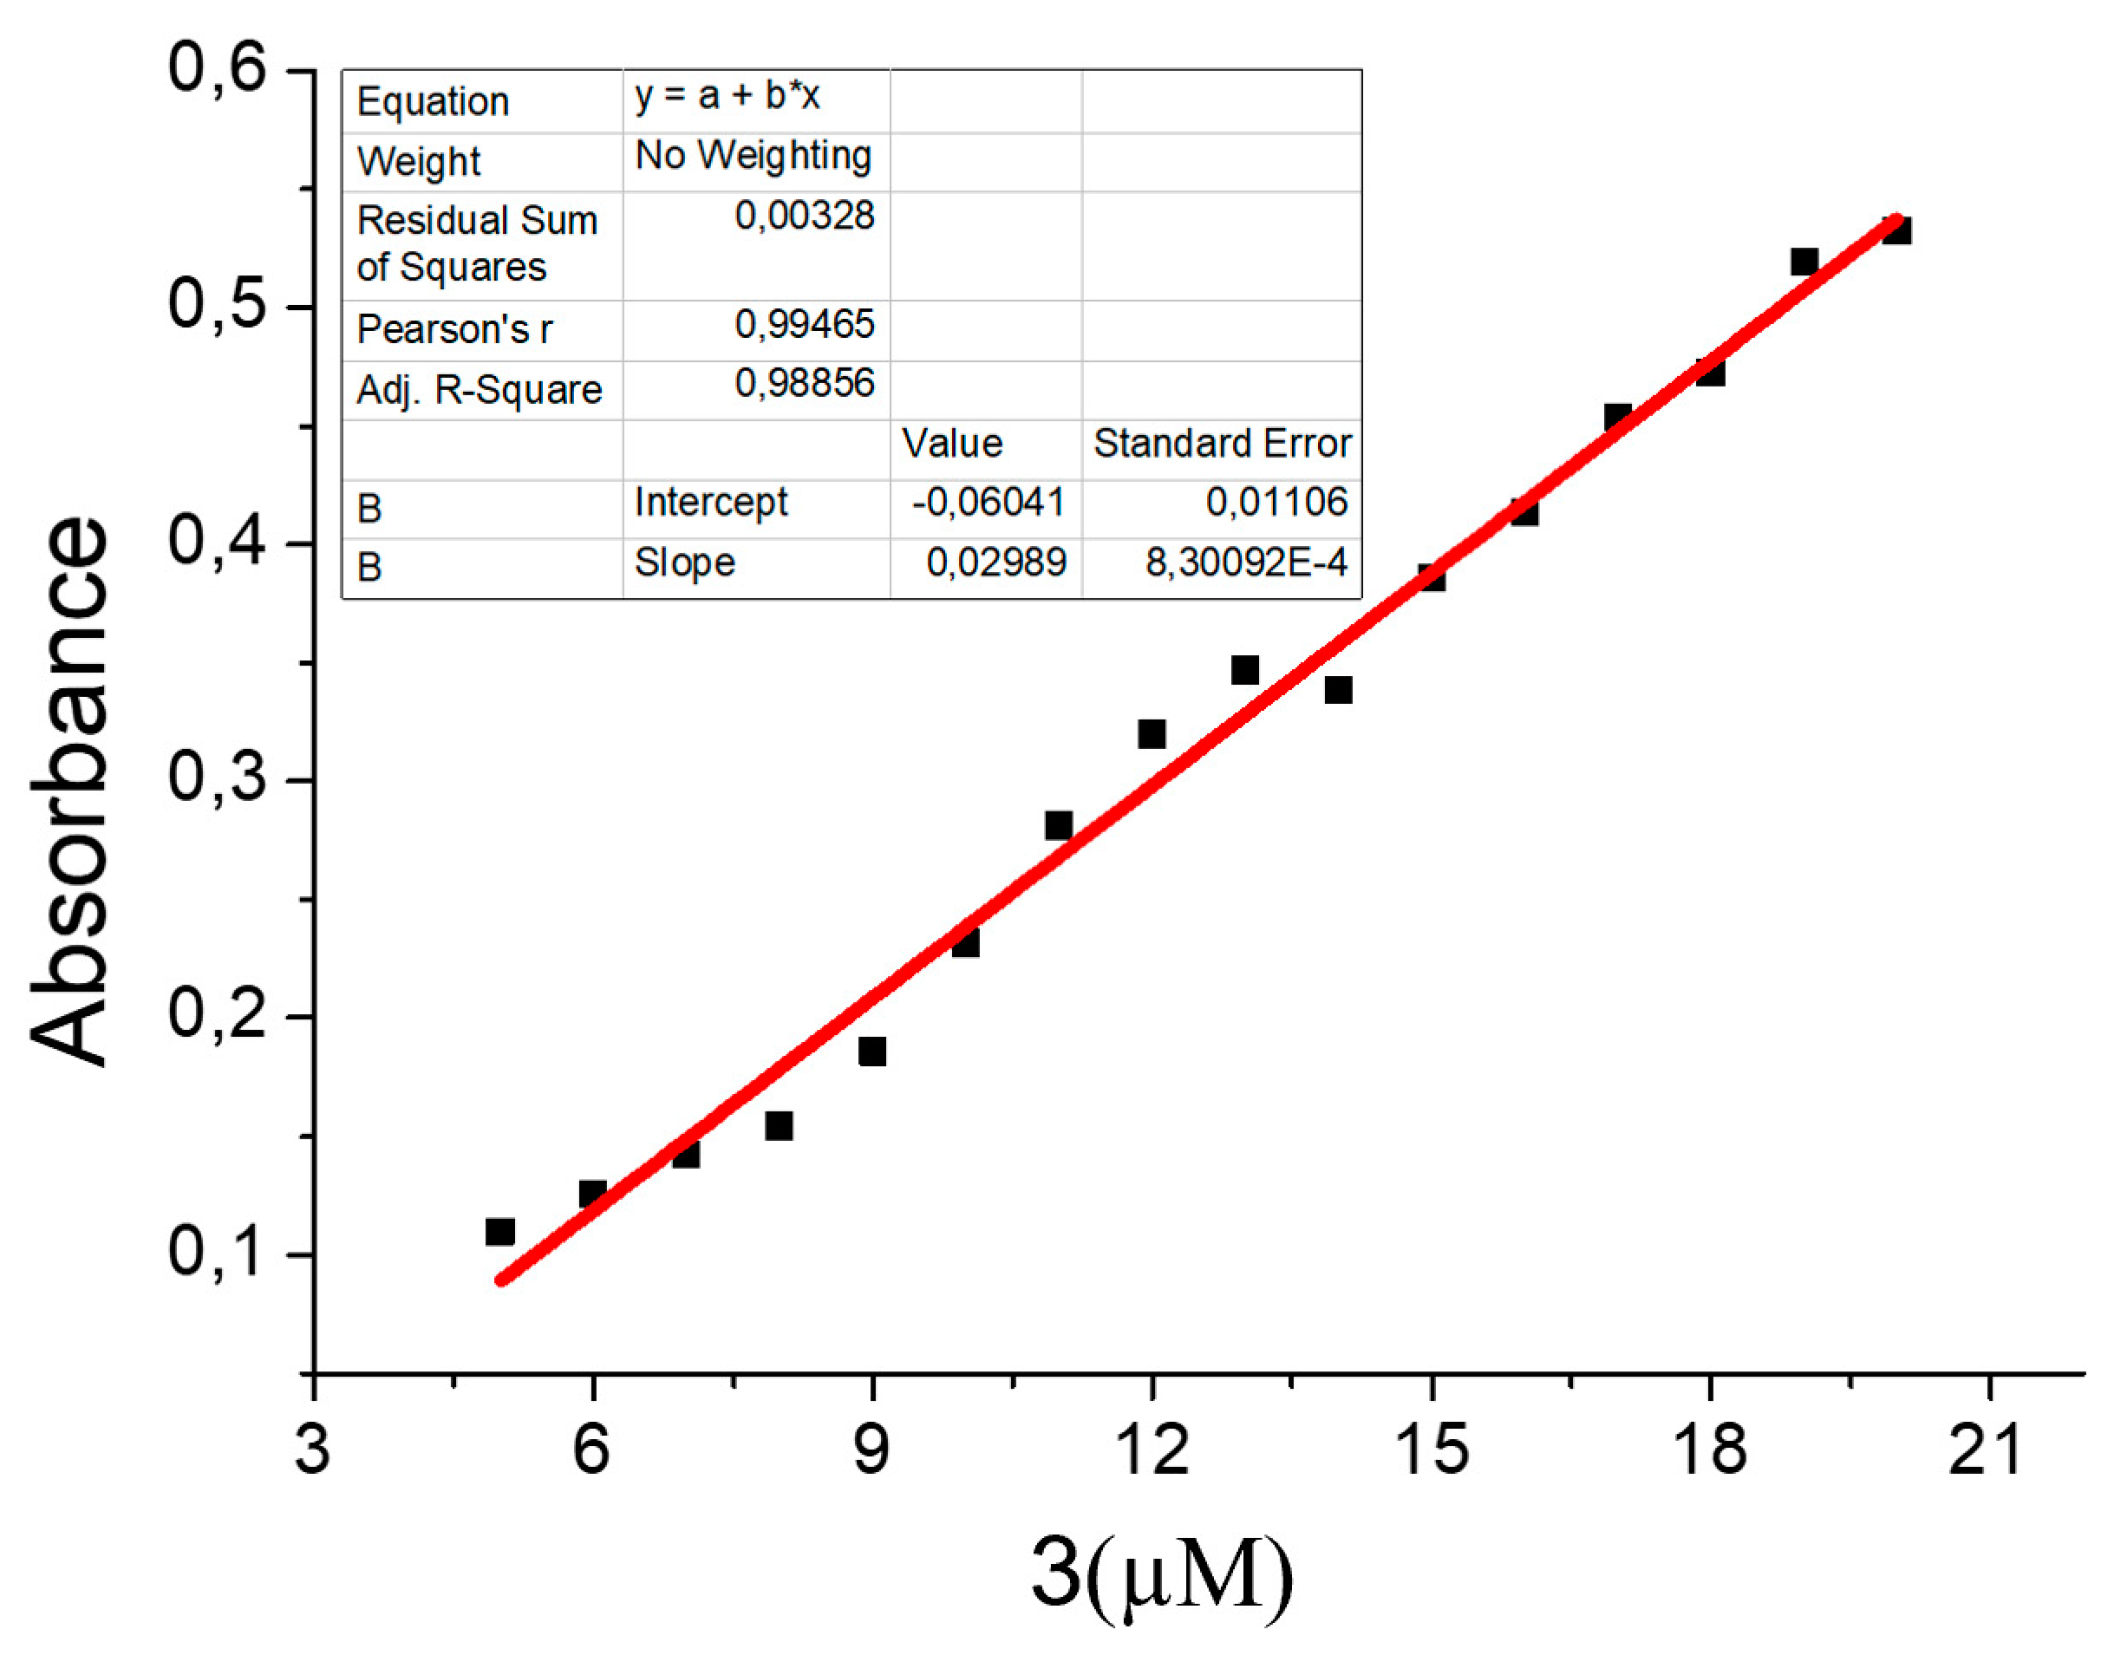
| Concentration | Absorbance Prototype | Absorbance Cary 60 | Measurement Difference | Error Percentage (%) |
|---|---|---|---|---|
| 5 µM | 0.109 | 0.095 | 0.014 | 12.84 |
| 10 µM | 0.232 | 0.226 | 0.006 | 2.65 |
| 15 µM | 0.385 | 0.360 | 0.025 | 6.94 |
| 20 µM | 0.532 | 0.532 | 0.000 | 0.0 |
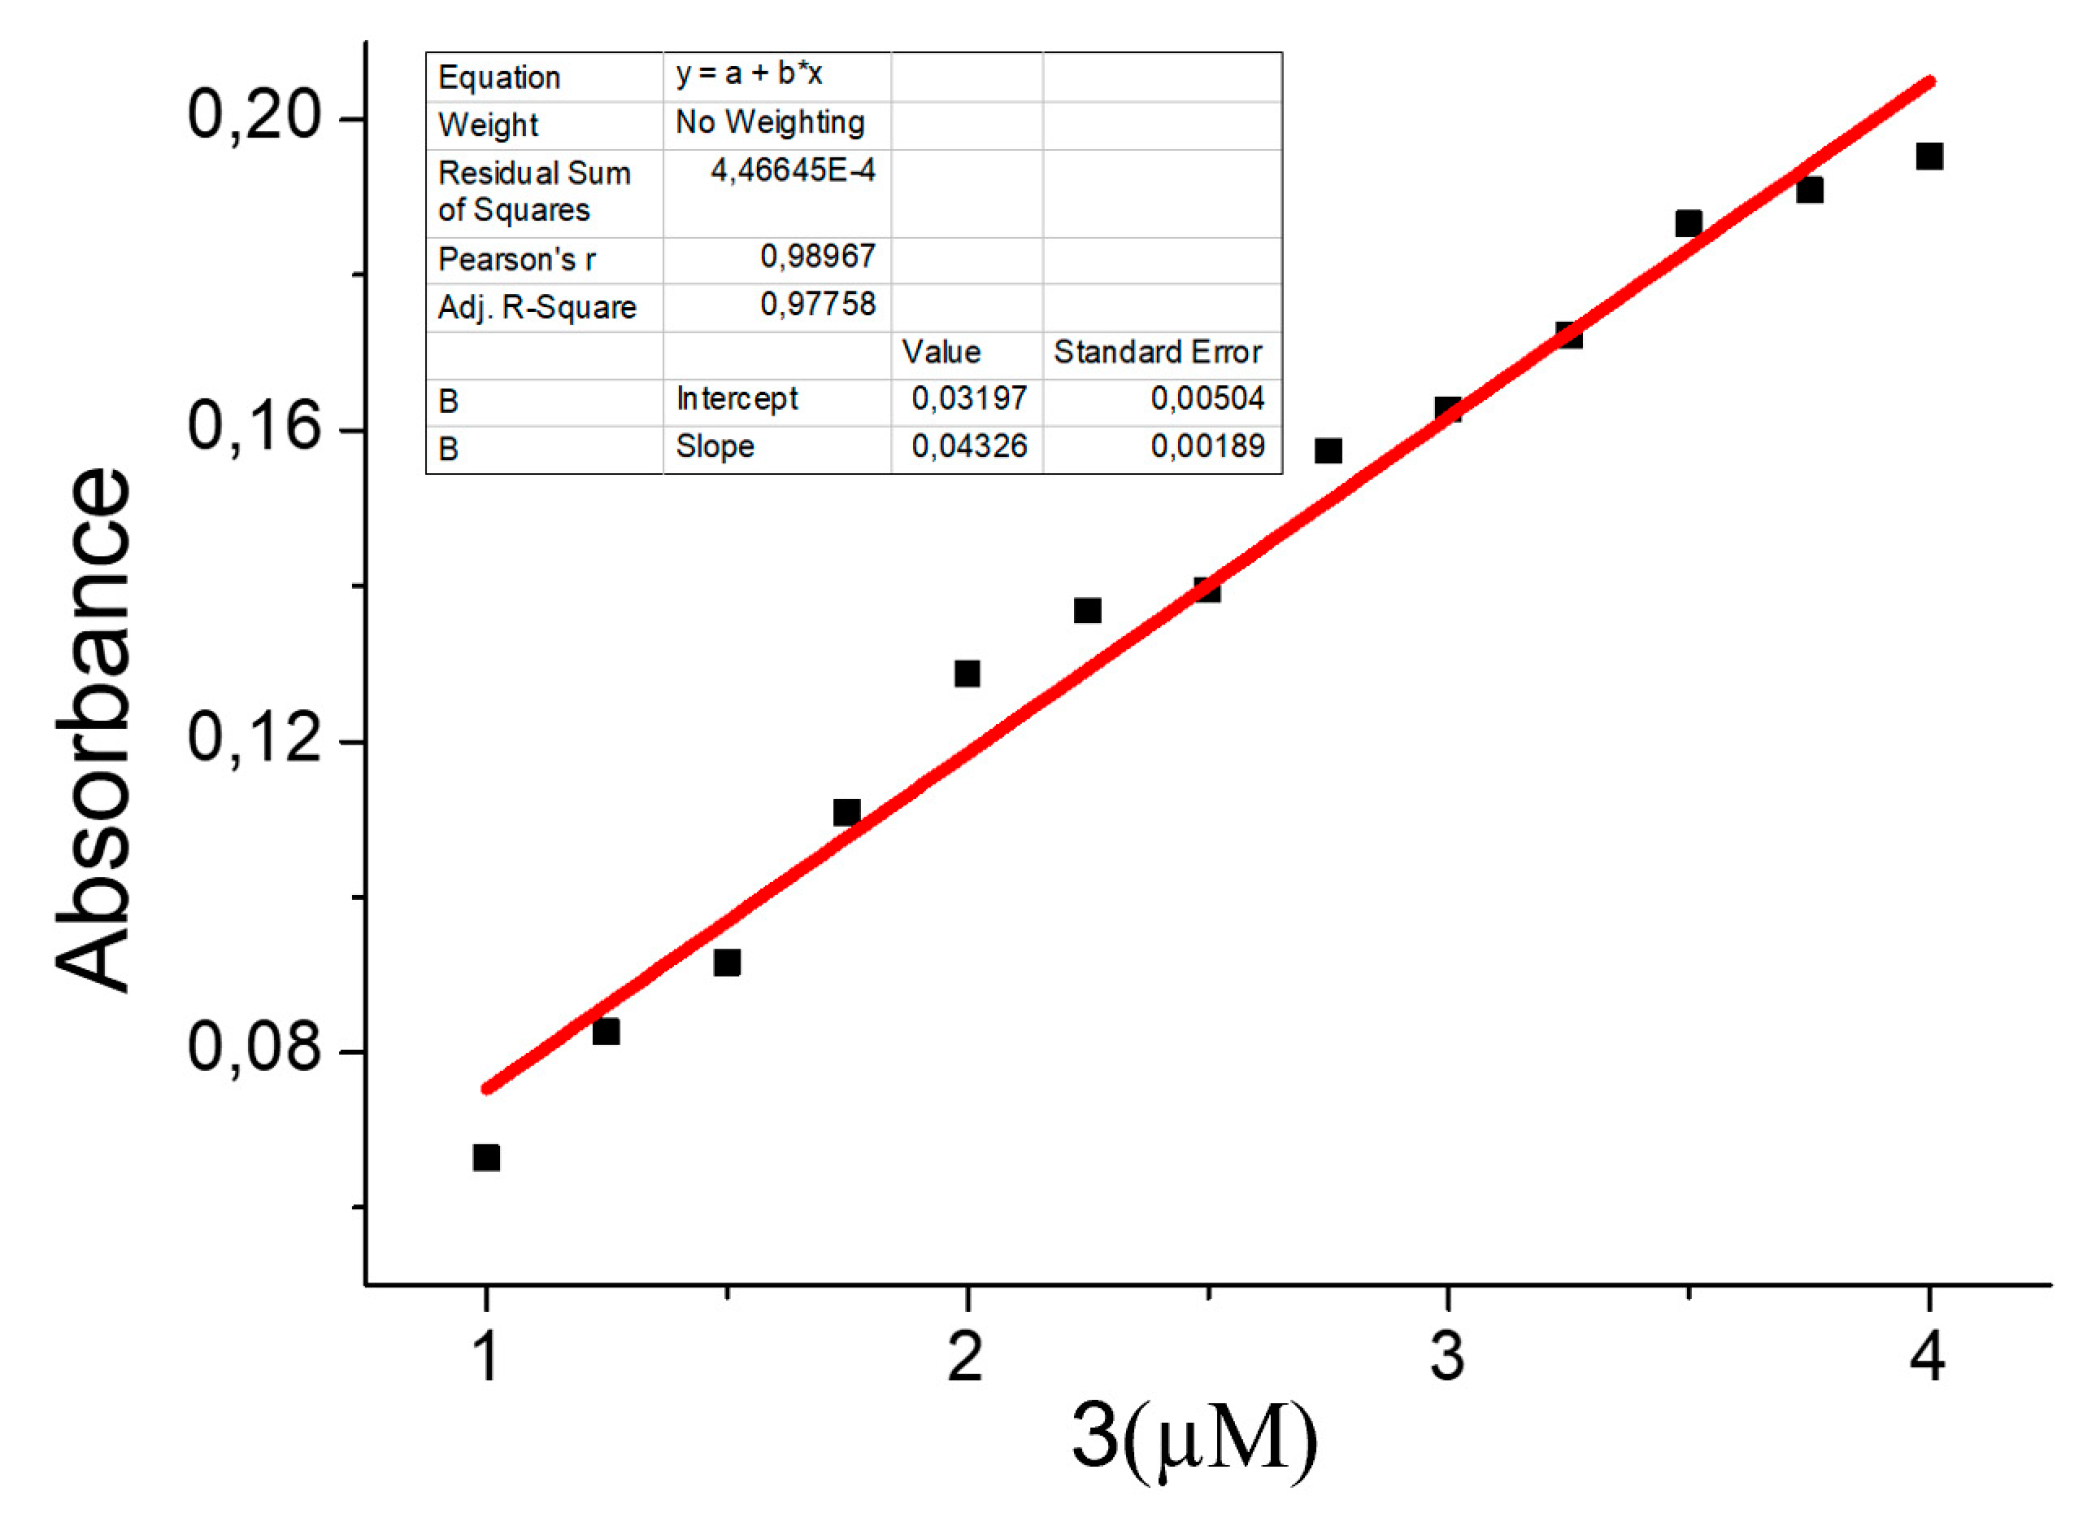
| Concentration | Absorbance Prototype | Absorbance Cary 60 | Measurement Difference | Error Percentage (%) |
|---|---|---|---|---|
| 1 µM | 0.066 | 0.065 | 0.001 | 1.54 |
| 2 µM | 0.128 | 0.132 | 0.004 | 3.03 |
| 3 µM | 0.162 | 0.169 | 0.007 | 4.14 |
| 4 µM | 0.195 | 0.194 | 0.001 | 0.52 |
| Component | Cost (USD) |
|---|---|
| Light source | 2 |
| Stepper motor | 14 |
| Arduino UNO | 21 |
| Stepper driver | 4 |
| Light detectors | 10 |
| Black Box | 20 |
| Additional elements | 15 |
| Total | 86 |
© 2020 by the authors. Licensee MDPI, Basel, Switzerland. This article is an open access article distributed under the terms and conditions of the Creative Commons Attribution (CC BY) license (http://creativecommons.org/licenses/by/4.0/).
Share and Cite
González-Morales, D.; Valencia, A.; Díaz-Nuñez, A.; Fuentes-Estrada, M.; López-Santos, O.; García-Beltrán, O. Development of a Low-Cost UV-Vis Spectrophotometer and Its Application for the Detection of Mercuric Ions Assisted by Chemosensors. Sensors 2020, 20, 906. https://doi.org/10.3390/s20030906
González-Morales D, Valencia A, Díaz-Nuñez A, Fuentes-Estrada M, López-Santos O, García-Beltrán O. Development of a Low-Cost UV-Vis Spectrophotometer and Its Application for the Detection of Mercuric Ions Assisted by Chemosensors. Sensors. 2020; 20(3):906. https://doi.org/10.3390/s20030906
Chicago/Turabian StyleGonzález-Morales, David, Asmilly Valencia, Astrid Díaz-Nuñez, Marcial Fuentes-Estrada, Oswaldo López-Santos, and Olimpo García-Beltrán. 2020. "Development of a Low-Cost UV-Vis Spectrophotometer and Its Application for the Detection of Mercuric Ions Assisted by Chemosensors" Sensors 20, no. 3: 906. https://doi.org/10.3390/s20030906
APA StyleGonzález-Morales, D., Valencia, A., Díaz-Nuñez, A., Fuentes-Estrada, M., López-Santos, O., & García-Beltrán, O. (2020). Development of a Low-Cost UV-Vis Spectrophotometer and Its Application for the Detection of Mercuric Ions Assisted by Chemosensors. Sensors, 20(3), 906. https://doi.org/10.3390/s20030906