Application-Specific Evaluation of a Weed-Detection Algorithm for Plant-Specific Spraying

Abstract
1. Introduction
2. Materials and Methods
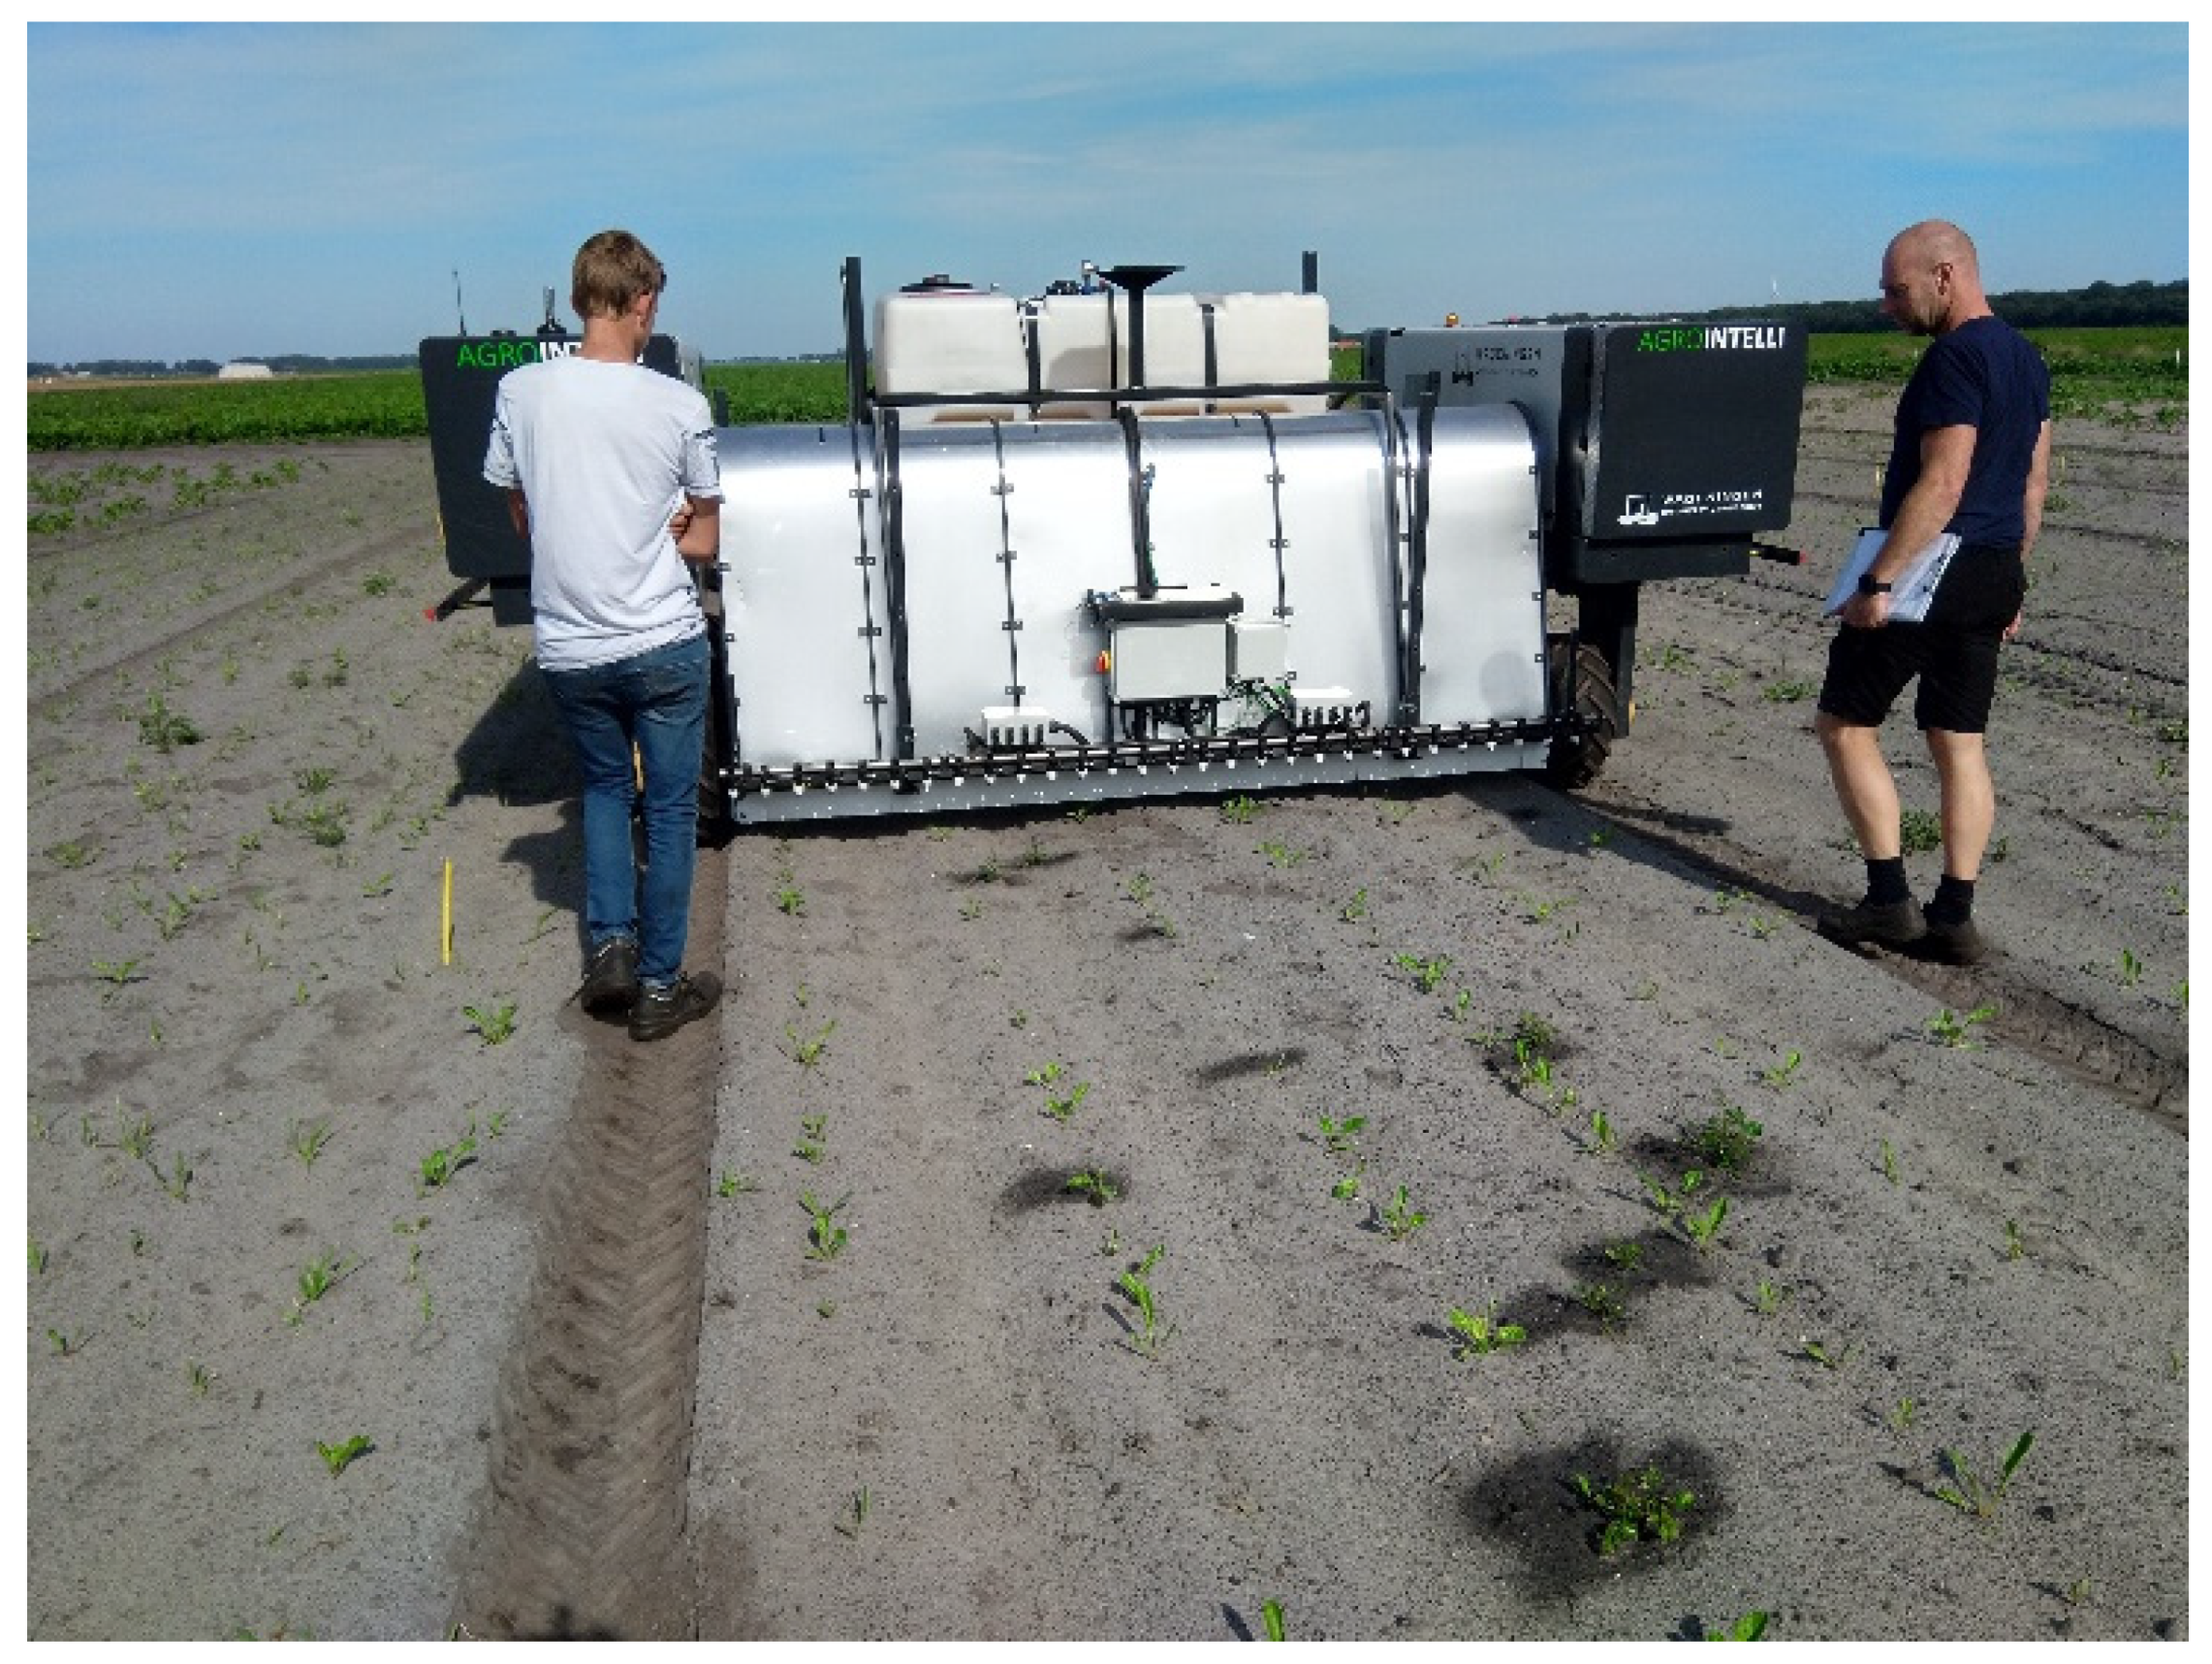
2.1. Autonomous Spraying Robot
2.1.1. Mobile Platform
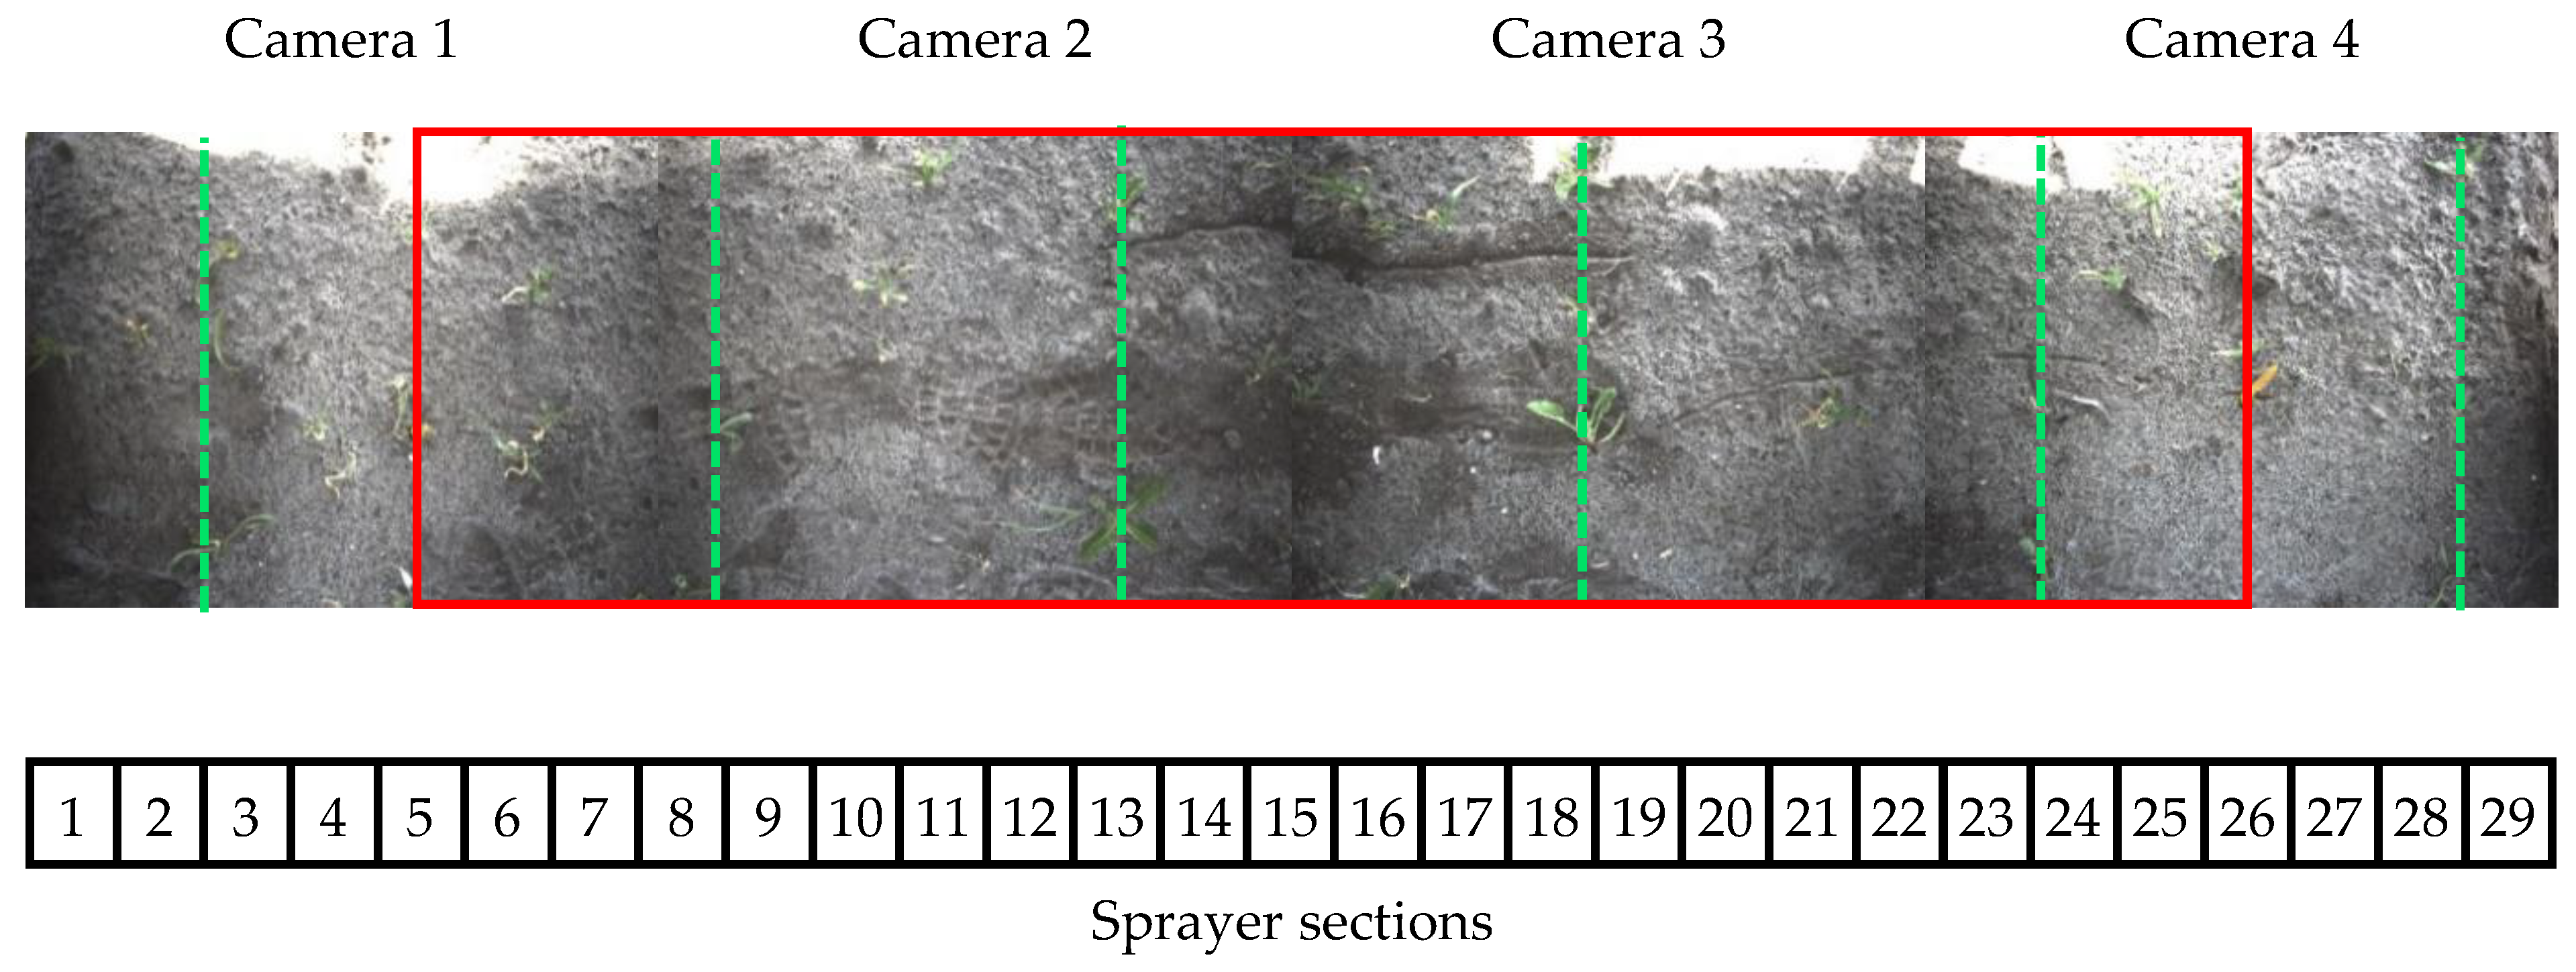
2.1.2. Image Acquisition System
2.1.3. Image Processing Server
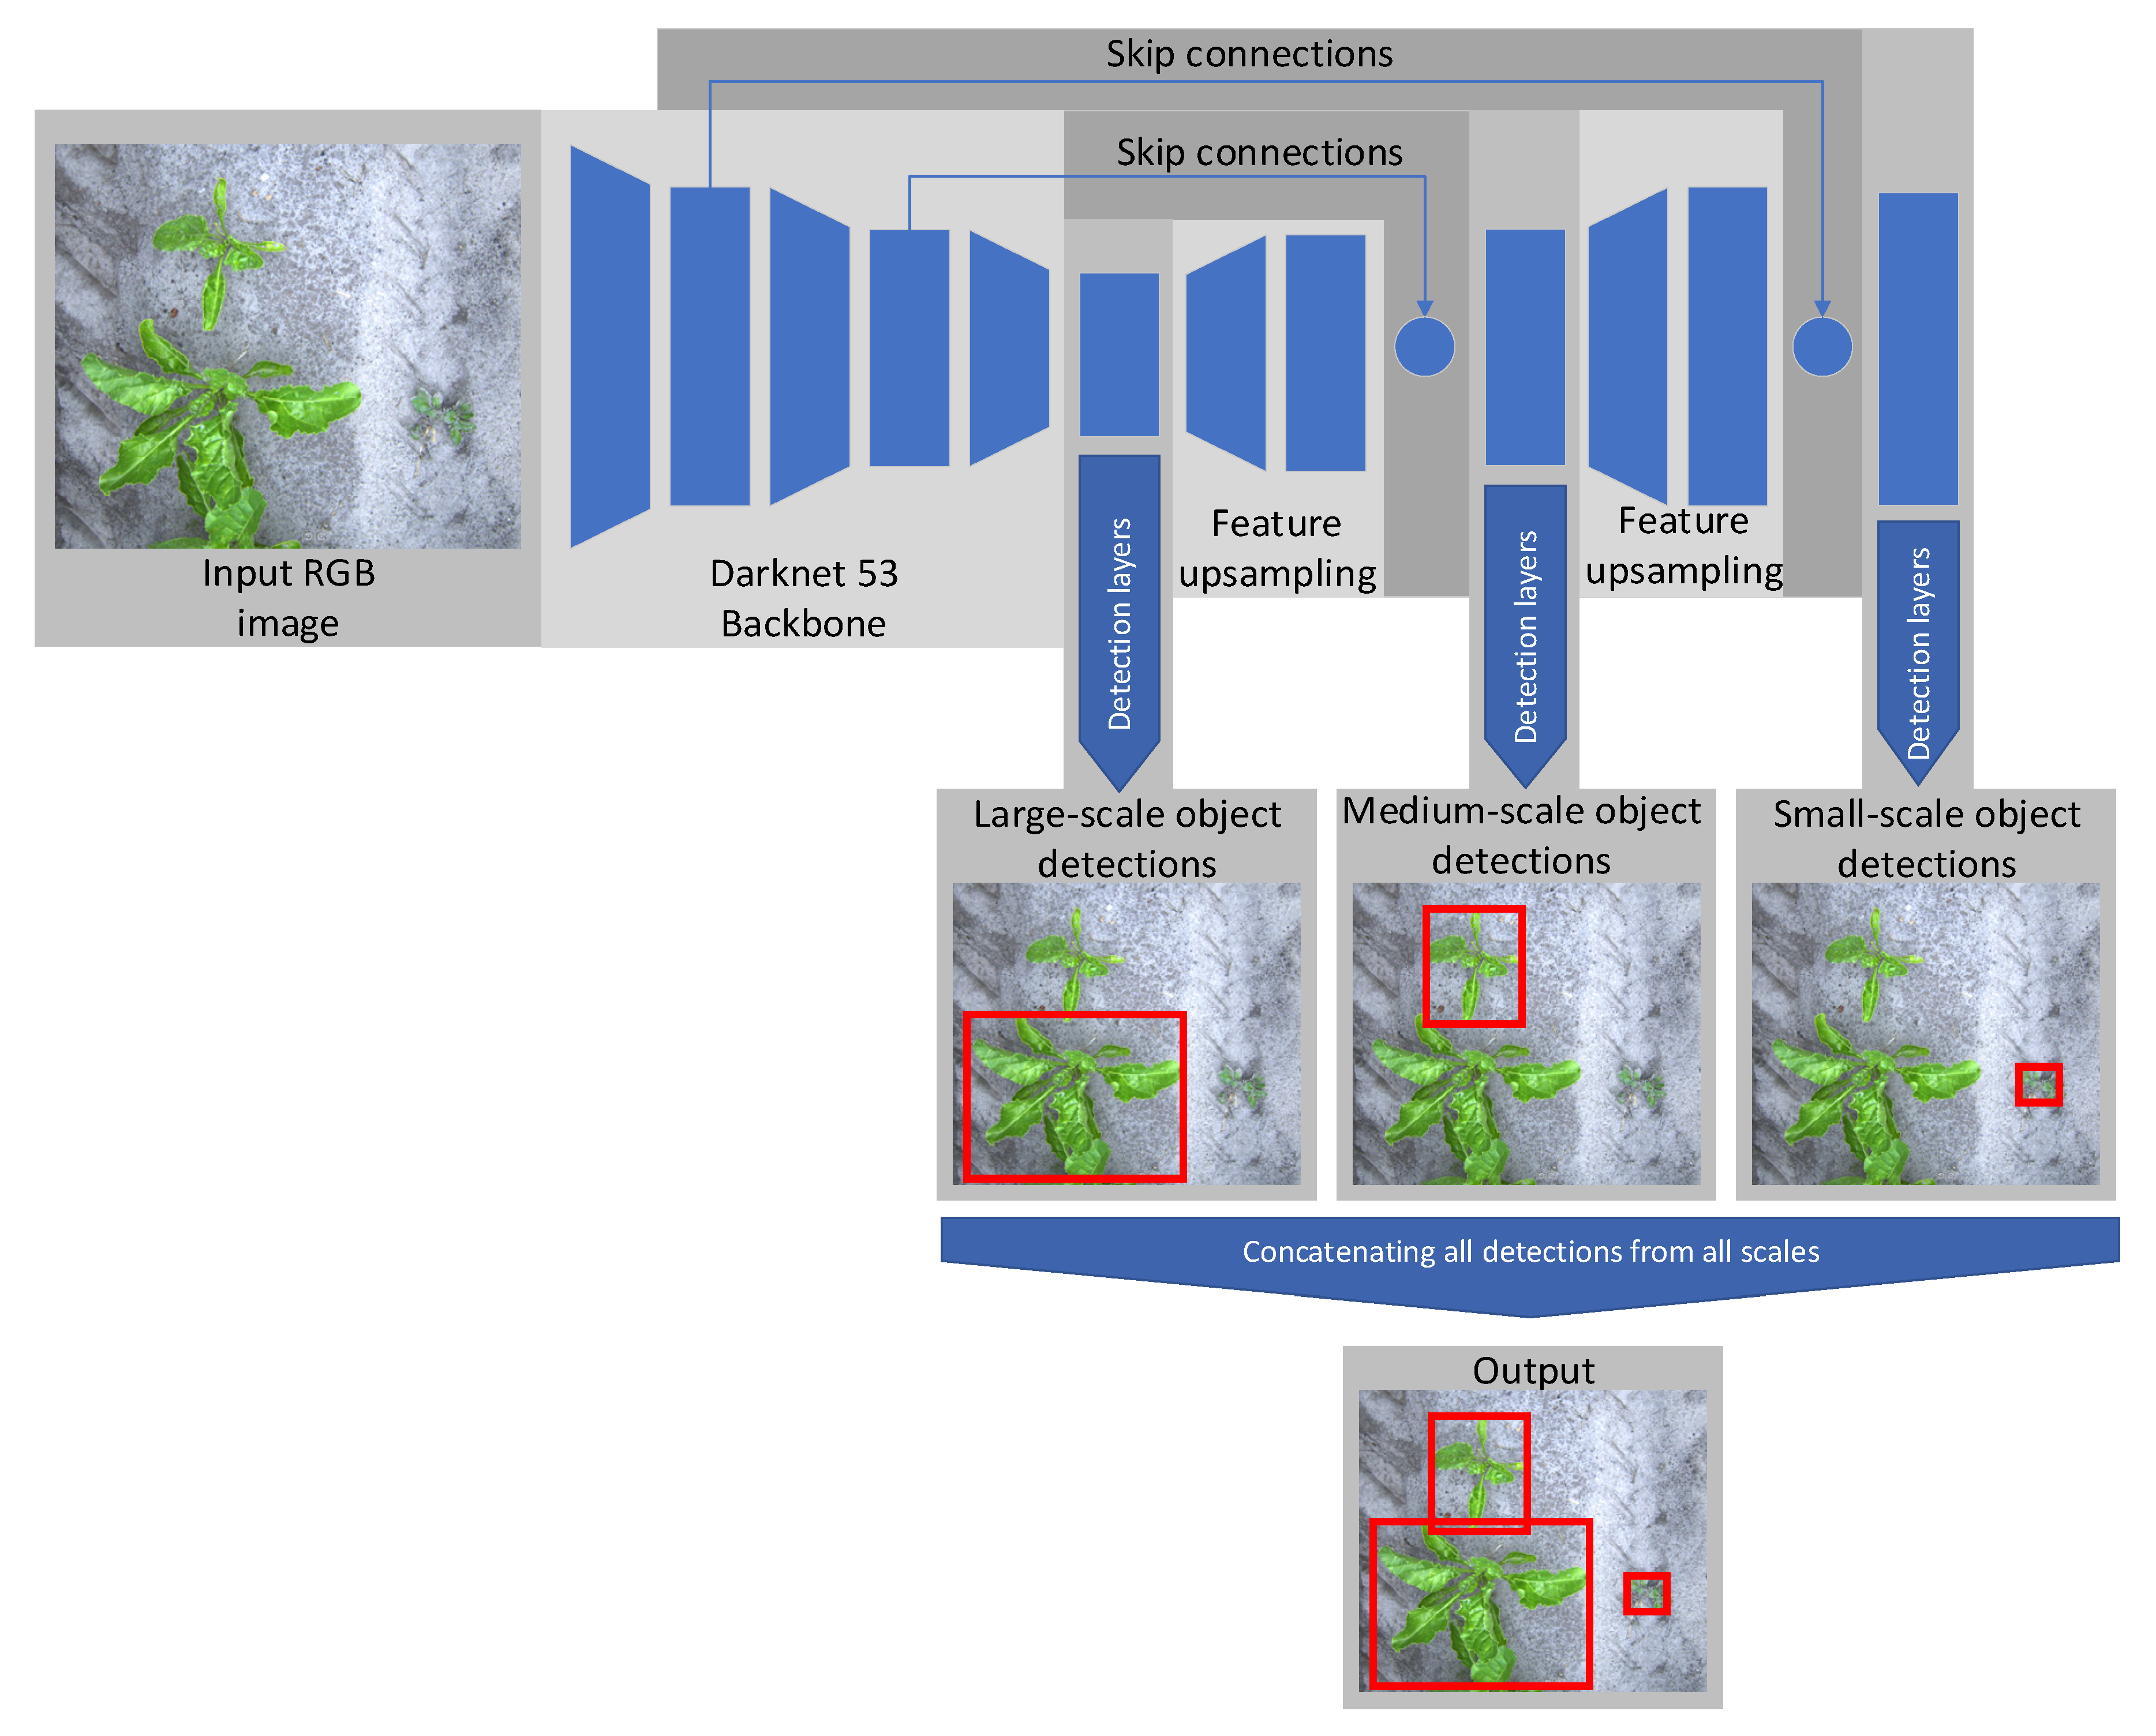
2.1.4. Weed Detection Algorithm
Algorithm Architecture
Training Procedure
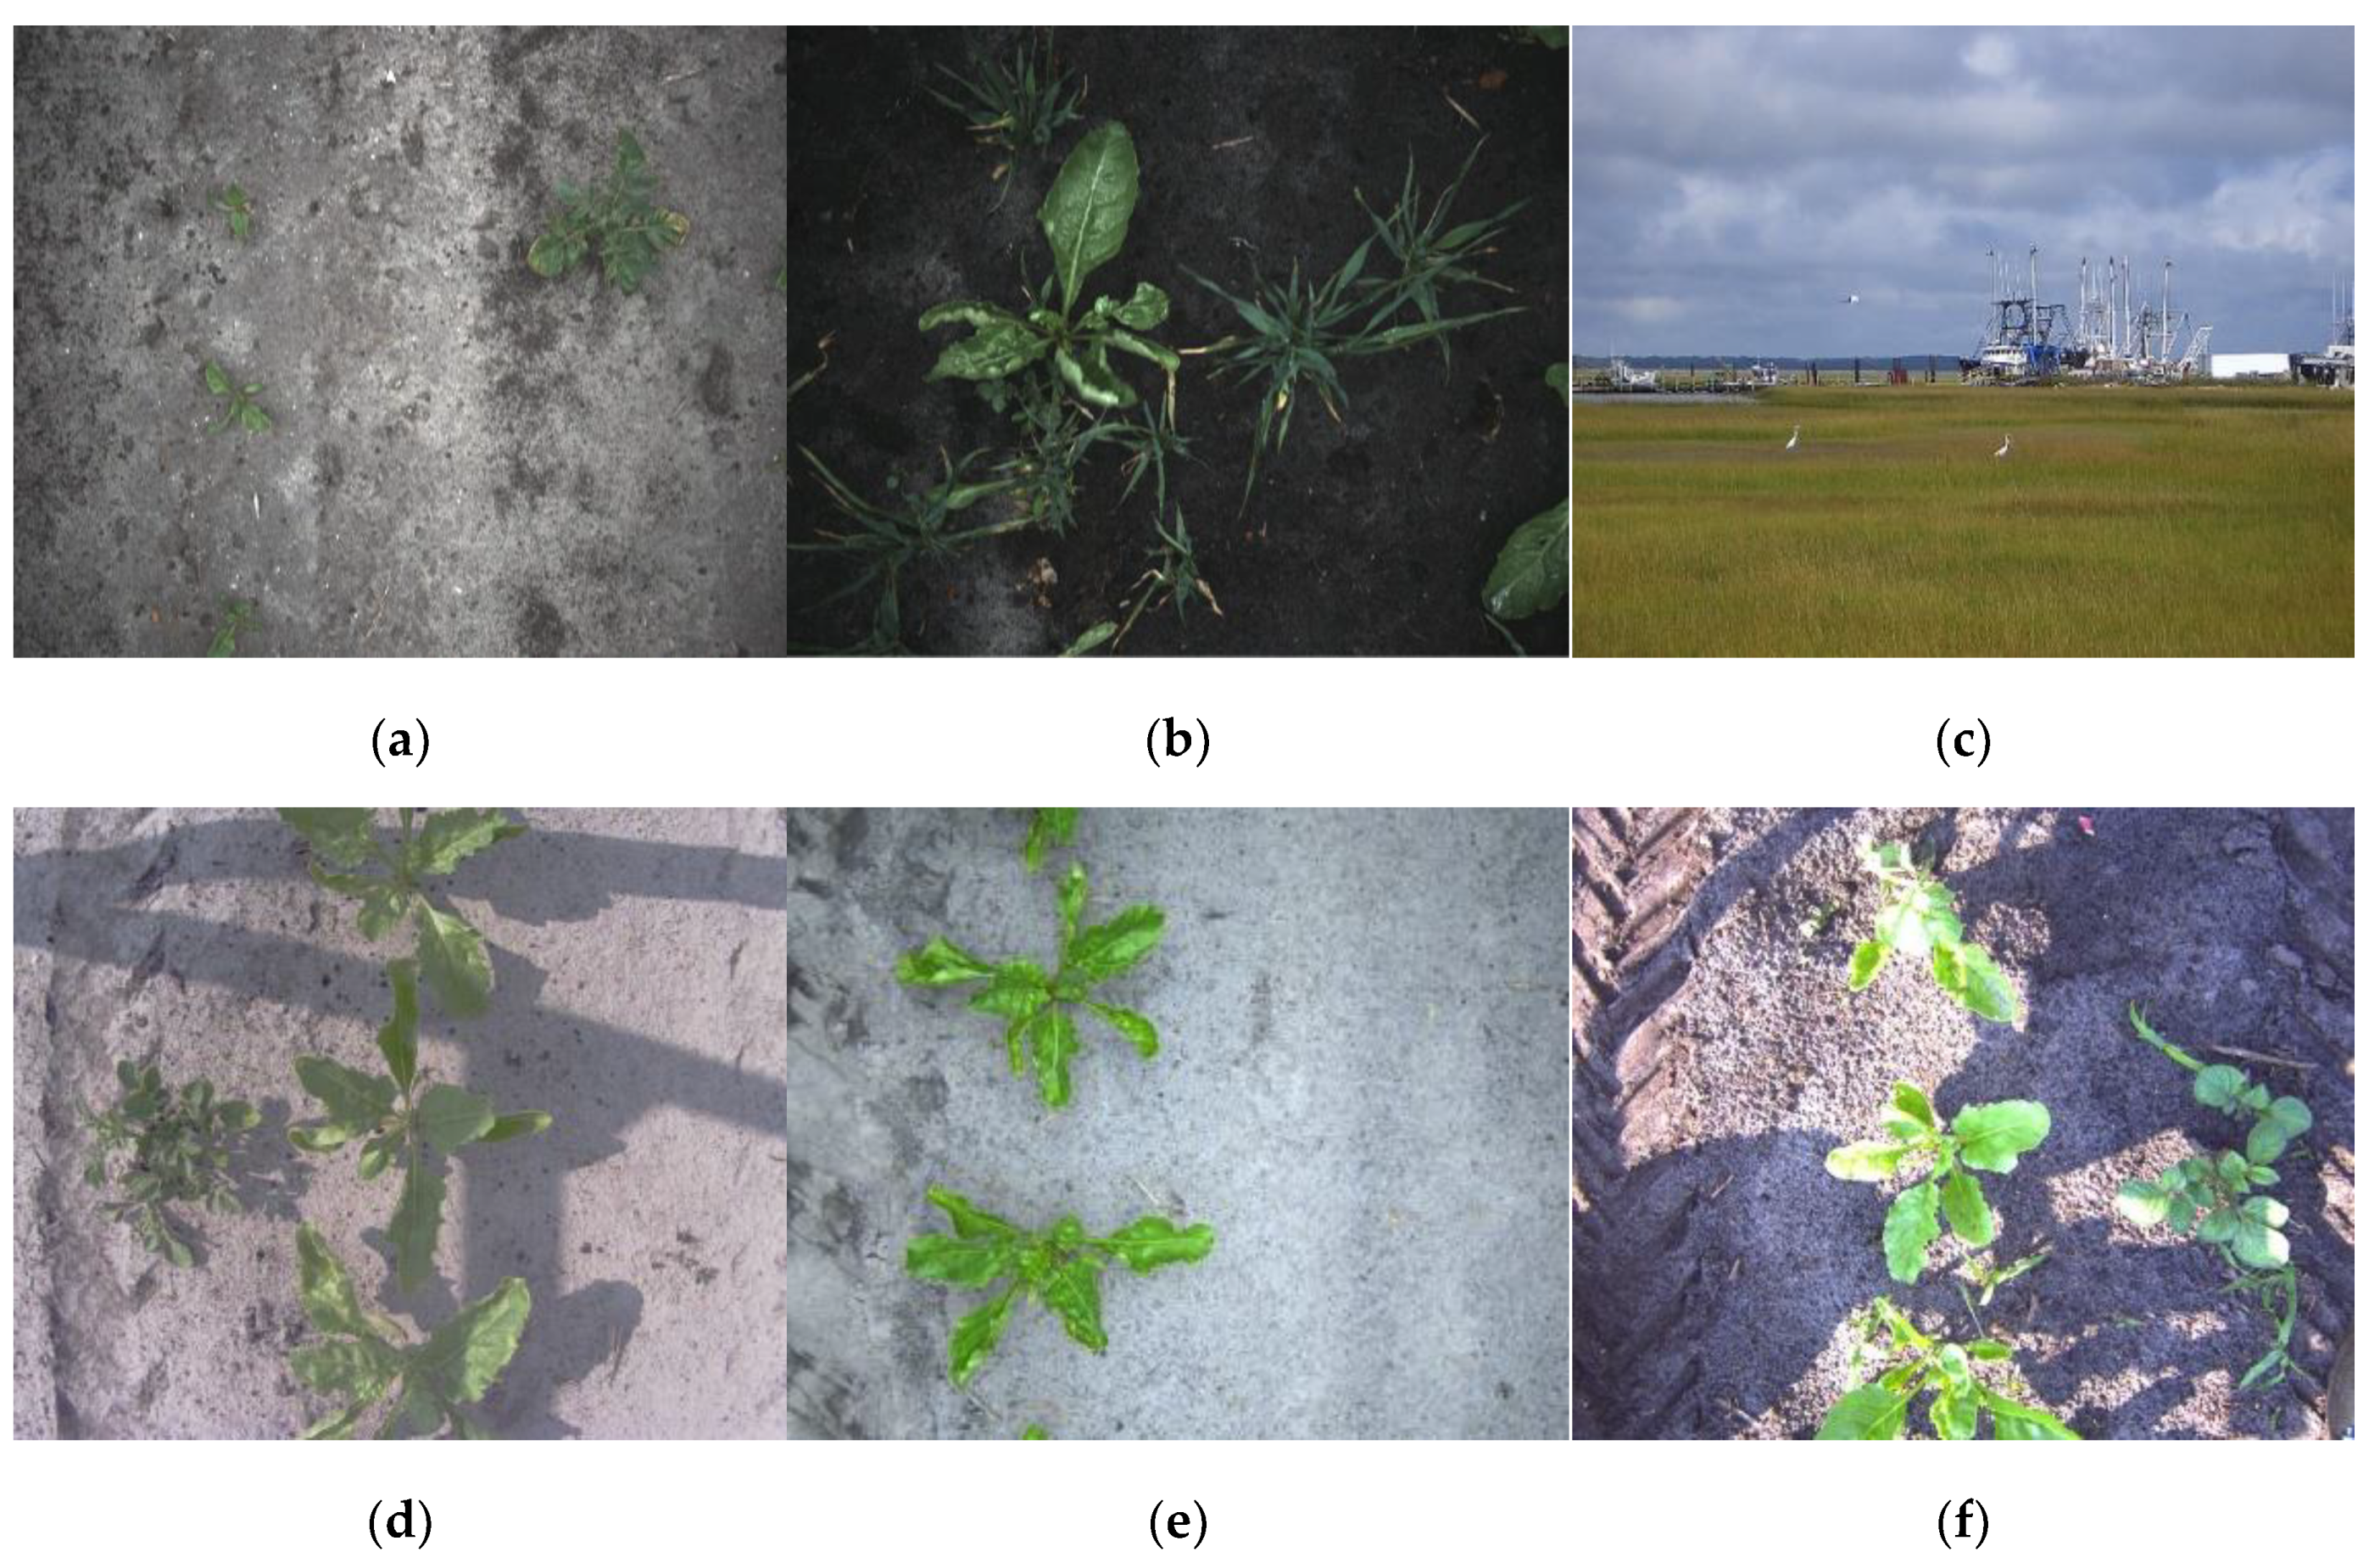
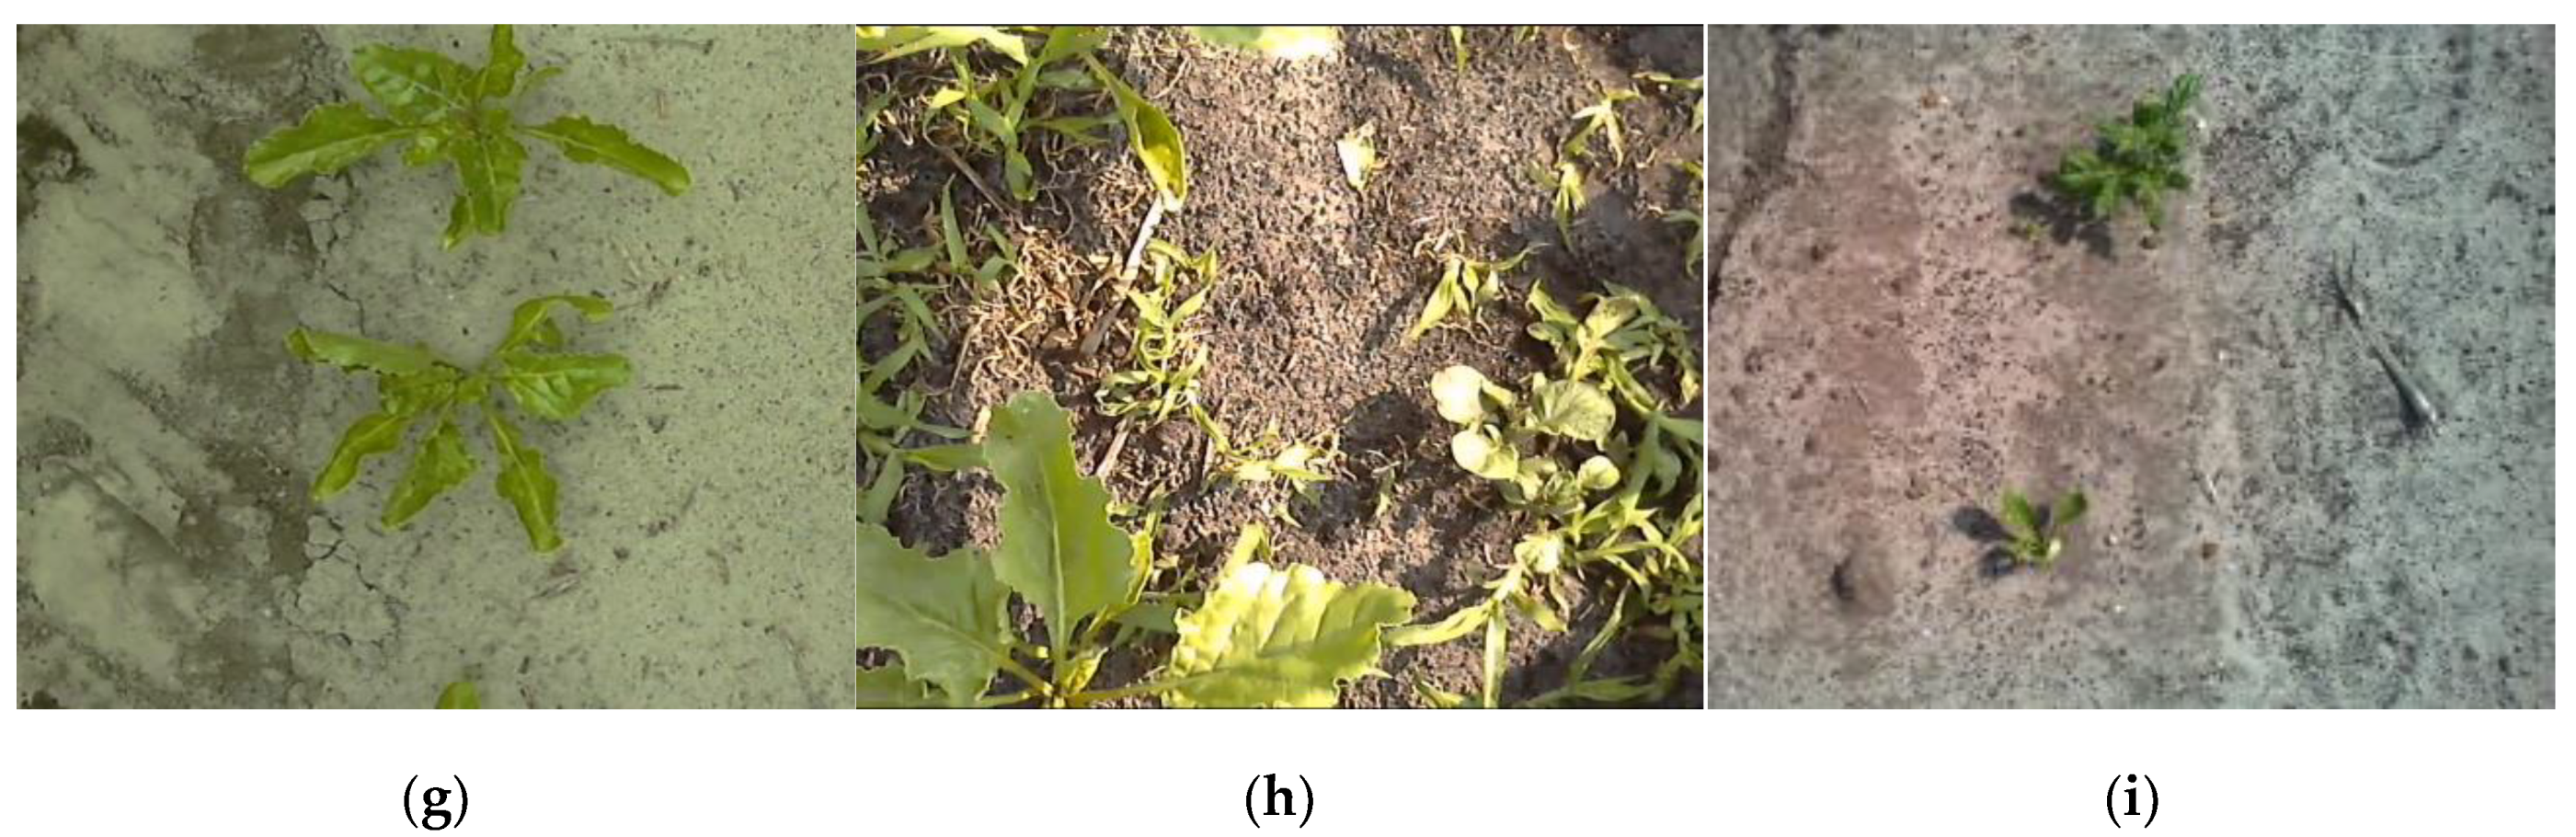
Training Data
2.1.5. Sprayer System
2.2. Data Collection
2.3. Evaluation Methods
2.3.1. Image-Level Evaluation
2.3.2. Application-Level Evaluation
- Each plant counts as one detection, be it a TP, FP, or FN, even though it can be seen in multiple images.
- If a potato plant is at least once correctly detected, it is counted as a TP, because this will result in a correct spraying action.
- If a sugar beet is at least once wrongly detected as a potato, it is counted as a FP, because this will result in an incorrect spraying action, terminating the sugar beet.
- If a background object, such as soil or a rock, is detected as a potato, it is counted as a FP, because this will result in an incorrect spraying action, wasting spraying chemicals.
- If a potato detection covers multiple potato plants, each of these potato plants is a TP, as it will result in correctly spraying the potato plants.
- If a potato detection overlaps with one or multiple sugar-beet plants, each of these sugar-beet plants is counted as a FP, as it will result in spraying and terminating the sugar-beet plants.
- If a potato plant is detected as multiple smaller potato plants, it is only counted as one TP, because the resulting spraying action will only kill one potato plant.
- If a sugar beet plant is detected as one or multiple potato plants, it is only counted as one FP, because the resulting spraying action will only kill one sugar beet plant.
2.3.3. Field-Level Evaluation
3. Results
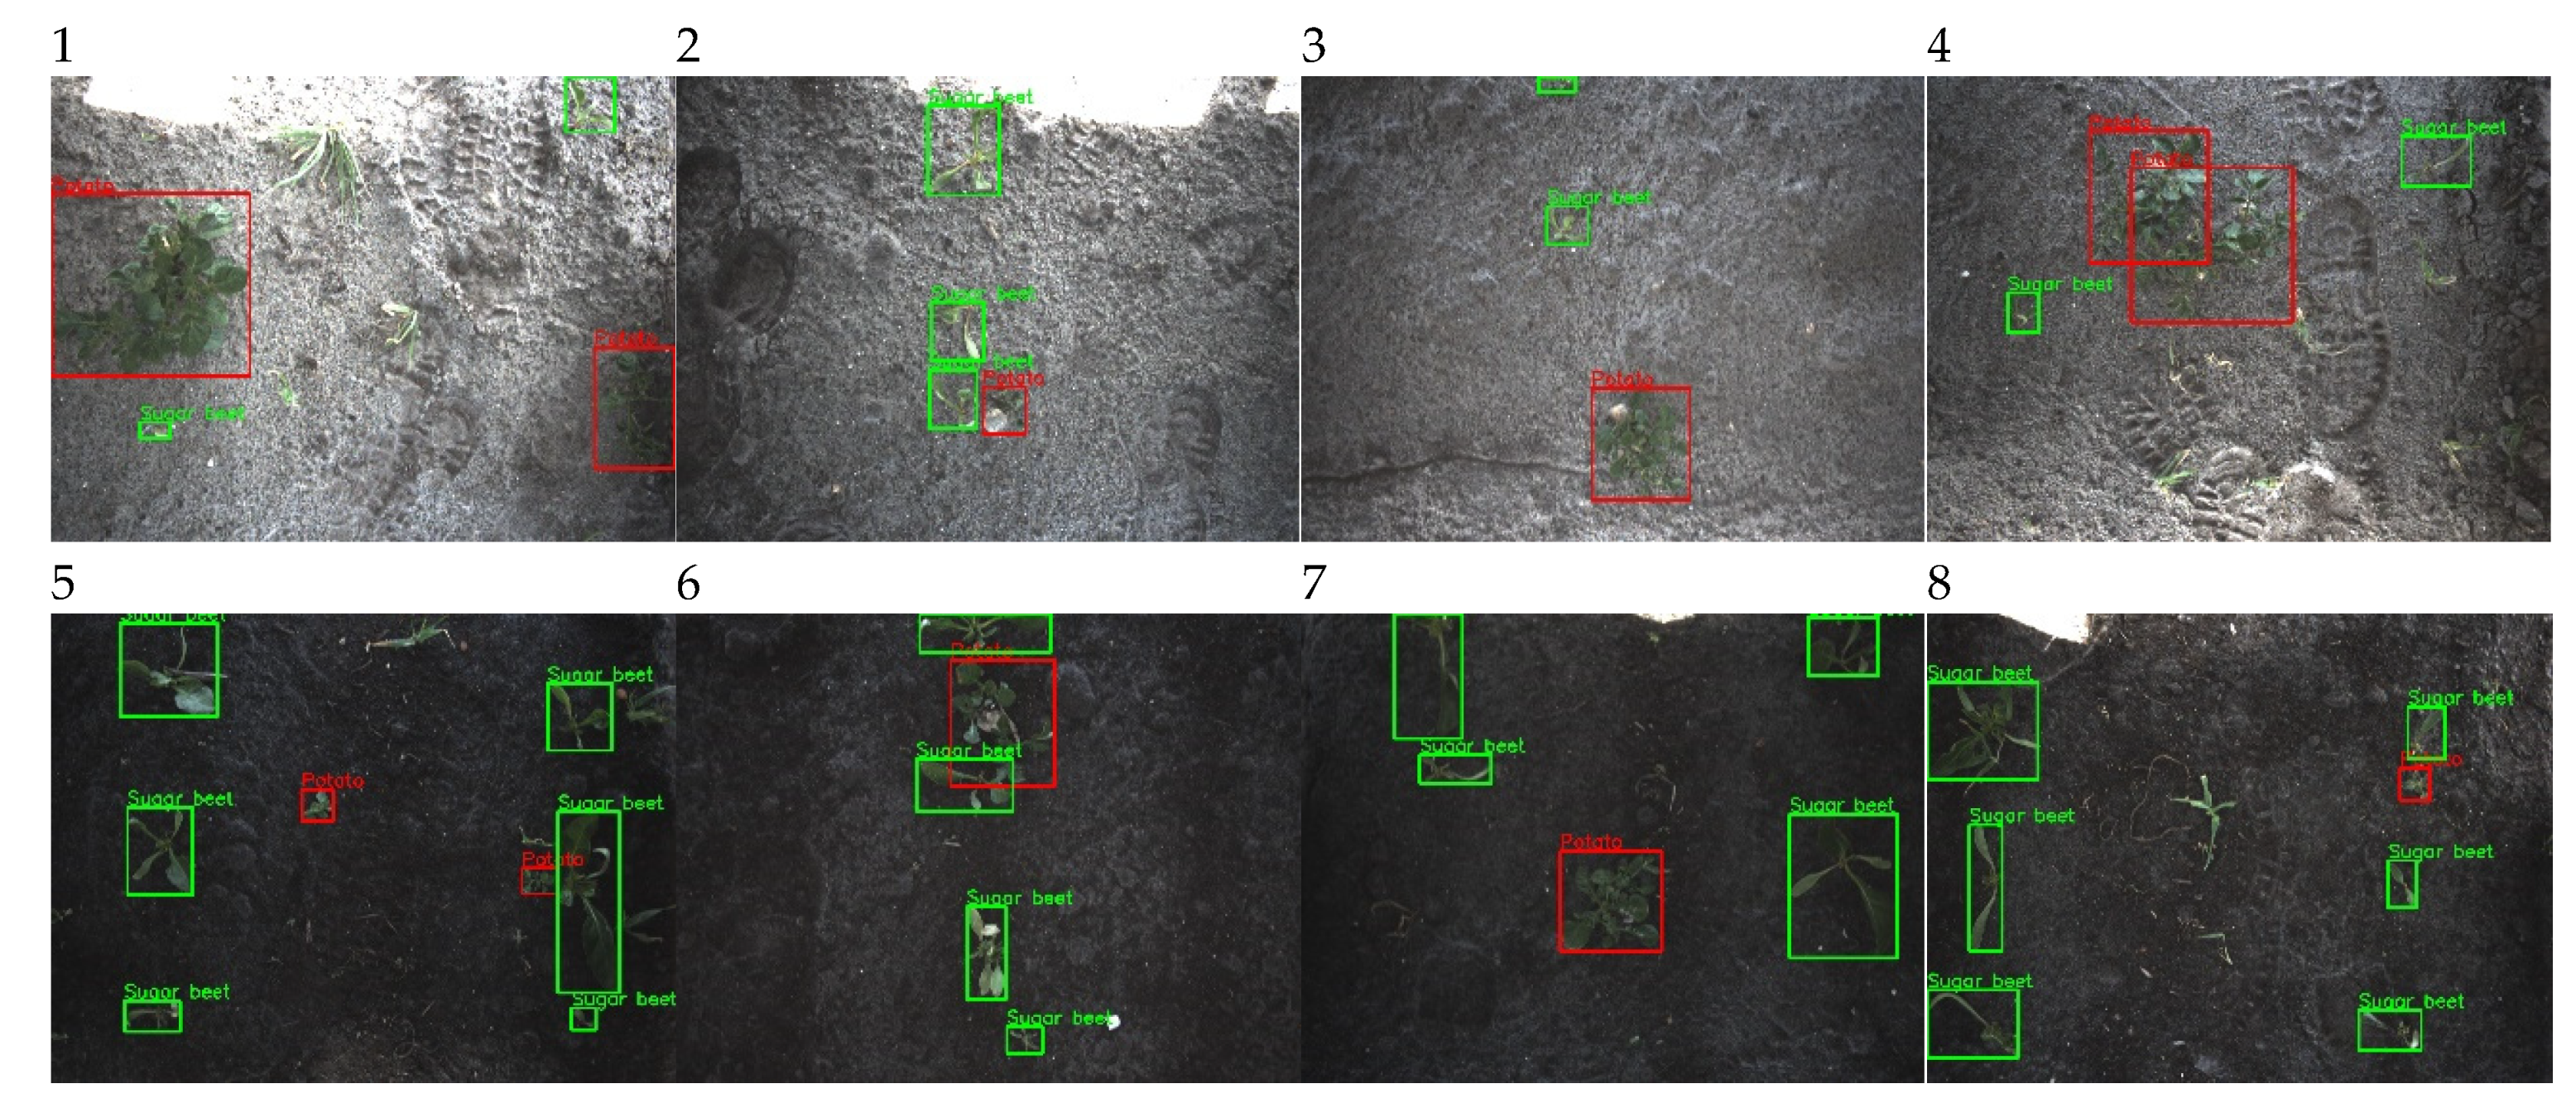
3.1. Image-Level Evaluation
3.2. Application-Level Evaluation
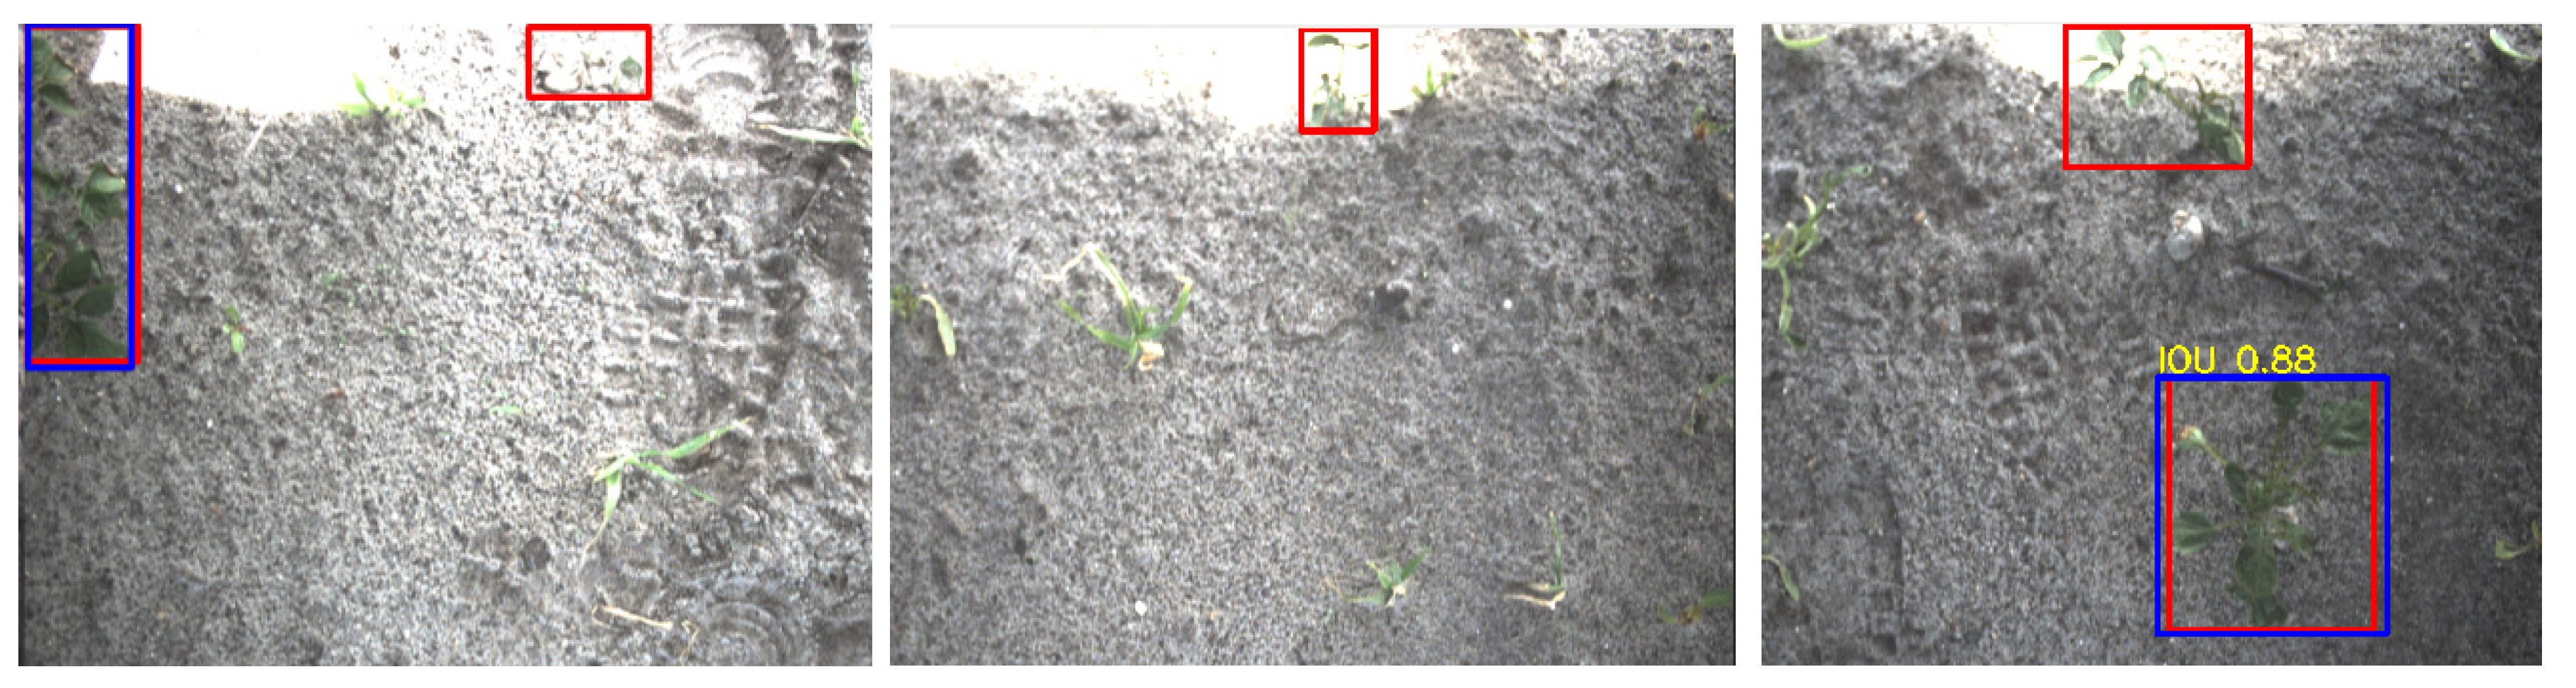
- Case 1.
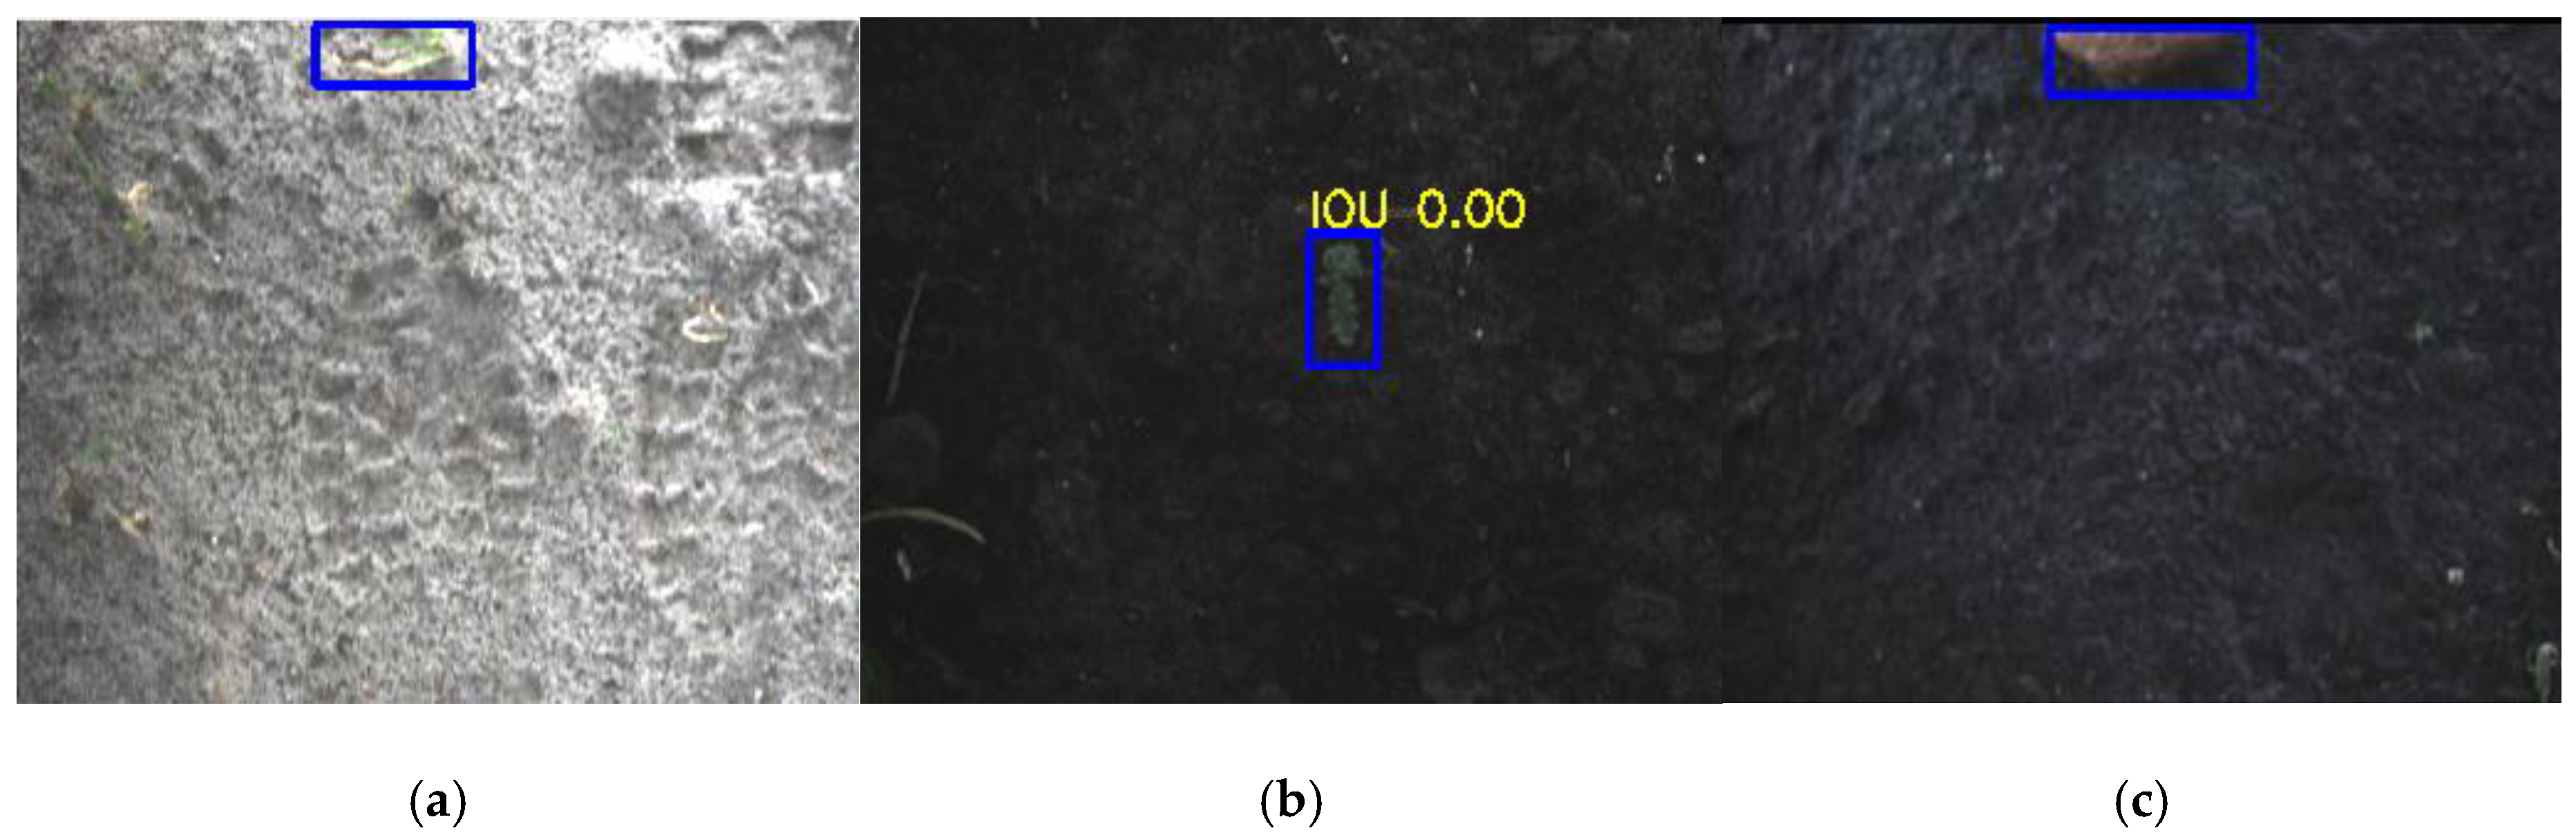
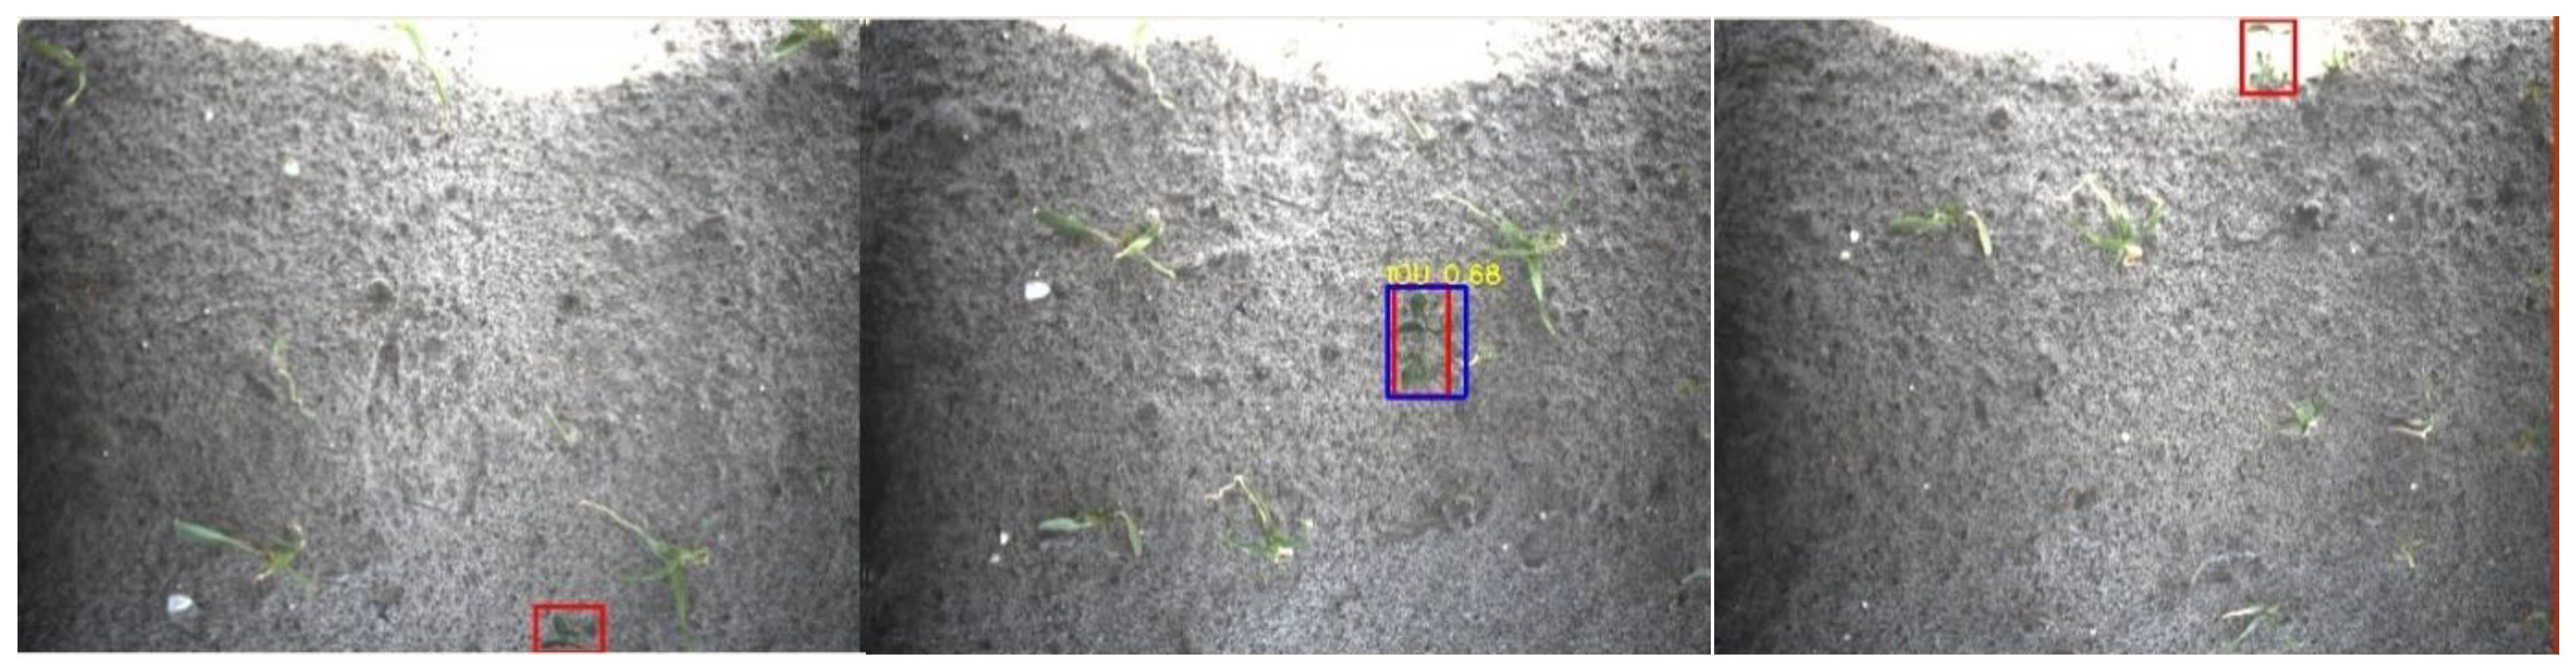
- A single potato plant was seen multiple times, due to overlap of the images of approximately 62% in the driving direction. In some images, the plant detection might be false, especially when a plant was only partially visible. However, if the potato plant was correctly detected at least once in the images from the multiple viewpoints, it would result in a correct spraying action. This plant detection was therefore considered a TP in the application-level evaluation, increasing the TP rate while reducing the FP rate. Examples of this case are given in Figure 11.
- Case 2.
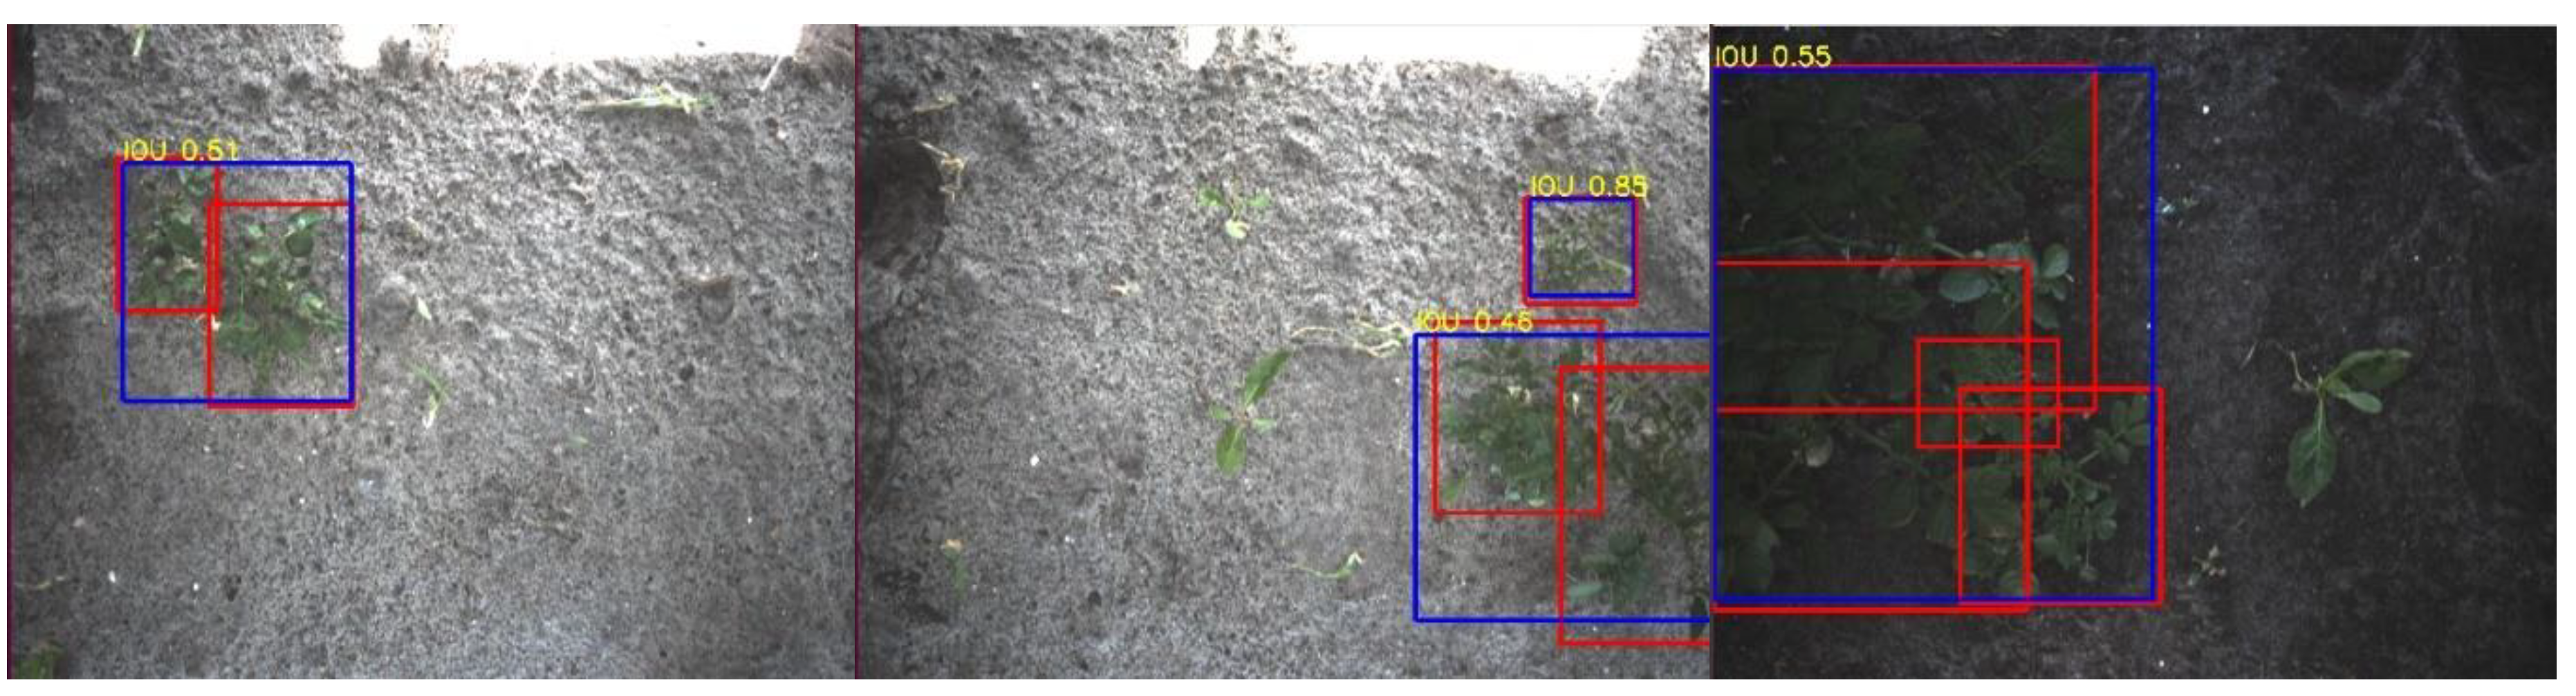
- Multiple smaller potato plants were detected as a single big potato plant. Evaluated at the image level, this is incorrect. However, in the application-level evaluation, this is counted as a true positive, increasing the recall. Examples of this case are given in Figure 12.
- Case 3.
- A big potato plant was identified as multiple smaller plants. This still resulted in a correct spraying action. The application-level evaluation counts this case as a TP. An example is given in Figure 13.
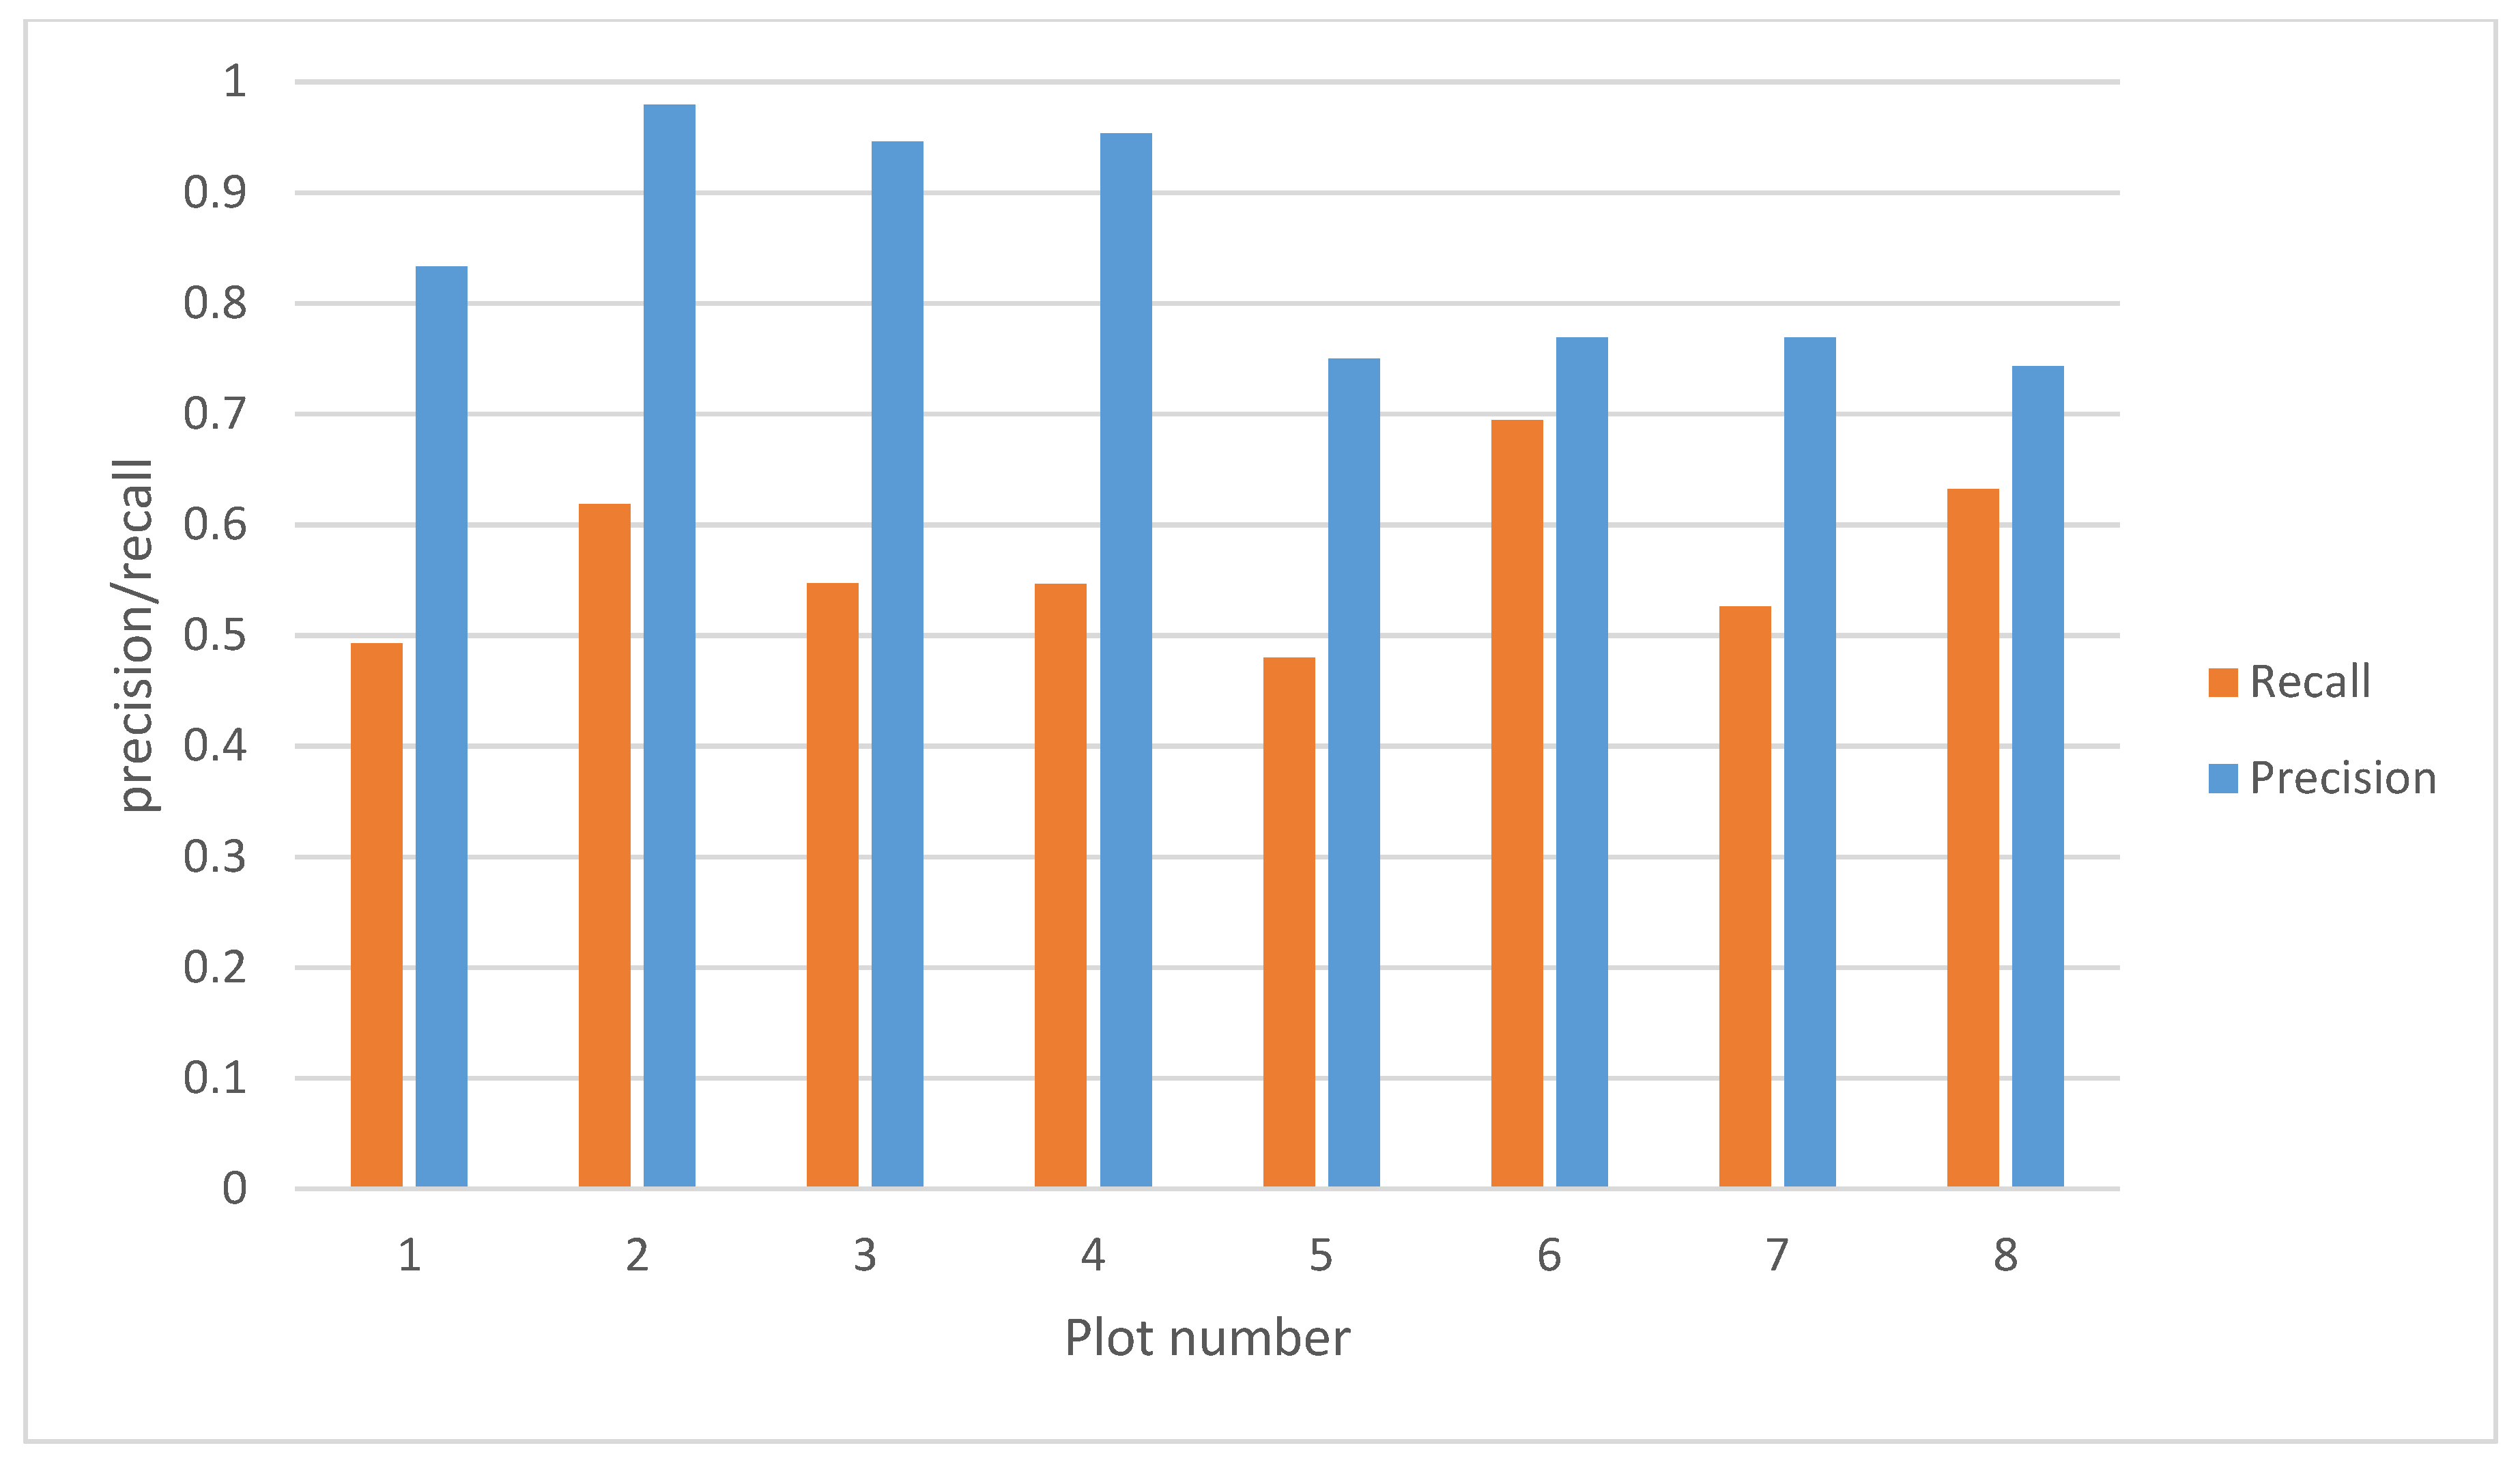
3.3. Field-Level Evaluation
4. Discussion
4.1. Comparing the Evaluations at Three Different Levels
4.2. Comparison with Related Work
4.3. Limitations and Future Improvements
5. Conclusions
Author Contributions
Funding
Conflicts of Interest
References
- Henle, K.; Alard, D.; Clitherow, J.; Cobb, P.; Firbank, L.; Kull, T.; McCracken, D.; Moritz, R.F.A.; Niemelä, J.; Rebane, M.; et al. Identifying and managing the conflicts between agriculture and biodiversity conservation in Europe-A review. Agric. Ecosyst. Environ. 2008, 124, 60–71. [Google Scholar] [CrossRef]
- Bastiaans, L.; Kropff, M.J.; Goudriaan, J.; Van Laar, H.H. Design of weed management systems with a reduced reliance on herbicides poses new challenges and prerequisites for modeling crop-weed interactions. Field Crop. Res. 2000, 67, 161–179. [Google Scholar] [CrossRef]
- Wilson, C.; Tisdell, C. Why farmers continue to use pesticides despite environmental, health and sustainability costs. Ecol. Econ. 2001, 39, 449–462. [Google Scholar] [CrossRef]
- Kempenaar, C.; Been, T.; Booij, J.; van Evert, F.; Michielsen, J.M.; Kocks, C. Advances in Variable Rate Technology Application in Potato in The Netherlands. Potato Res. 2017, 60, 295–305. [Google Scholar] [CrossRef] [PubMed]
- Biller, R.H. Reduced input of herbicides by use of optoelectronic sensors. J. Agric. Eng. Res. 1998, 71, 357–362. [Google Scholar] [CrossRef]
- Guyer, D.E.; Miles, G.E.; Schreiber, M.M.; Mitchell, O.R.; Vanderbilt, V.C. Machine vision and image processing for plant identification. Trans. ASAE 1986, 29, 1500–1507. [Google Scholar] [CrossRef]
- Lee, W.S.; Slaughter, D.C.; Giles, D.K. Robotic Weed Control System for Tomatoes. Precis. Agric. 1999, 1, 95–113. [Google Scholar] [CrossRef]
- Pérez, A.J.; López, F.; Benlloch, J.V.; Christensen, S. Colour and shape analysis techniques for weed detection in cereal fields. Comput. Electron. Agric. 2000, 25, 197–212. [Google Scholar] [CrossRef]
- Woebbecke, D.M.; Meyer, G.E.; Von Bargen, K.; Mortensen, D.A. Color Indices for Weed Identification Under Various Soil, Residue, and Lighting Conditions. Trans. ASAE 1995, 38, 259–269. [Google Scholar] [CrossRef]
- Zwiggelaar, R. A review of spectral properties of plants and their potential use for crop/weed discrimination in row-crops. Crop Prot. 1998, 17, 189–206. [Google Scholar] [CrossRef]
- Haug, S.; Michaels, A.; Biber, P.; Ostermann, J. Plant classification system for crop/weed discrimination without segmentation. In Proceedings of the IEEE Winter Conference on Applications of Computer Vision, IEEE, Steamboat Springs, CO, USA, 24–26 March 2014; pp. 1142–1149. [Google Scholar]
- Lottes, P.; Hörferlin, M.; Sander, S.; Stachniss, C. Effective Vision-based Classification for Separating Sugar Beets and Weeds for Precision Farming. J. Field Robot. 2017, 34, 1160–1178. [Google Scholar] [CrossRef]
- Lottes, P.; Stachniss, C. Semi-supervised online visual crop and weed classification in precision farming exploiting plant arrangement. In Proceedings of the IEEE International Conference on Intelligent Robots and Systems, Vancouver, BC, Canada, 24–28 September 2017; pp. 5155–5161. [Google Scholar]
- Suh, H.K.; Hofstee, J.W.; IJselmuiden, J.; Van Henten, E.J. Discrimination between Volunteer Potato and Sugar Beet with a Bag-of-Visual-Words Model. In Proceedings of the CIGR-AgEng 2016 Conference, Aarhus, Denmark, 26–29 June 2016; pp. 1–8. [Google Scholar]
- Dyrmann, M.; Karstoft, H.; Midtiby, H.S. Plant species classification using deep convolutional neural network. Biosyst. Eng. 2016, 151, 72–80. [Google Scholar] [CrossRef]
- Dyrmann, M.; Jørgensen, R.N.; Midtiby, H.S. RoboWeedSupport—Detection of weed locations in leaf occluded cereal crops using a fully convolutional neural network. Adv. Anim. Biosci. 2017, 8, 842–847. [Google Scholar] [CrossRef]
- Milioto, A.; Lottes, P.; Stachniss, C. Real-time blob-wise sugar beets VS weeds classification for monitoring field using convolutional neural networks. In Proceedings of the ISPRS Annals of Photogrammetry, Remote Sensing and Spatial Information Sciences, Bonn, Germany, 4–7 September 2017; Volume IV-2/W3, pp. 41–48. [Google Scholar]
- Milioto, A.; Lottes, P.; Stachniss, C. Real-Time Semantic Segmentation of Crop and Weed for Precision Agriculture Robots Leveraging Background Knowledge in CNNs. In Proceedings of the 2018 IEEE International Conference on Robotics and Automation (ICRA), IEEE, Brisbane, QLD, Australia, 21–25 May 2018; pp. 2229–2235. [Google Scholar]
- Suh, H.K.; IJsselmuiden, J.; Hofstee, J.W.; van Henten, E.J. Transfer learning for the classification of sugar beet and volunteer potato under field conditions. Biosyst. Eng. 2018, 174, 50–65. [Google Scholar] [CrossRef]
- Voorhoeve, L. Plant Detection under Natural Illumination Conditions. Master’s Thesis, Wageningen University, Wageningen, The Netherlands, 2018. [Google Scholar]
- Osorio, K.; Puerto, A.; Pedraza, C.; Jamaica, D.; Rodríguez, L. A Deep Learning Approach for Weed Detection in Lettuce Crops Using Multispectral Images. AgriEngineering 2020, 2, 471–488. [Google Scholar] [CrossRef]
- Teimouri, N.; Dyrmann, M.; Nielsen, P.; Mathiassen, S.; Somerville, G.; Jørgensen, R. Weed Growth Stage Estimator Using Deep Convolutional Neural Networks. Sensors 2018, 18, 1580. [Google Scholar] [CrossRef]
- Skovsen, S.; Dyrmann, M.; Mortensen, A.; Steen, K.; Green, O.; Eriksen, J.; Gislum, R.; Jørgensen, R.; Karstoft, H. Estimation of the Botanical Composition of Clover-Grass Leys from RGB Images Using Data Simulation and Fully Convolutional Neural Networks. Sensors 2017, 17, 2930. [Google Scholar] [CrossRef]
- Zhang, Q.; Liu, Y.; Gong, C.; Chen, Y.; Yu, H. Applications of Deep Learning for Dense Scenes Analysis in Agriculture: A Review. Sensors 2020, 20, 1520. [Google Scholar] [CrossRef]
- Bontsema, J.; van Asselt, C.J.; Lempens, P.W.J.; van Straten, G. Intra-Row Weed Control: A Mechatronics Approach. IFAC Proc. Vol. 1998, 31, 93–97. [Google Scholar] [CrossRef]
- Nieuwenhuizen, A.T.; Hofstee, J.W.; van Henten, E.J. Performance evaluation of an automated detection and control system for volunteer potatoes in sugar beet fields. Biosyst. Eng. 2010, 107, 46–53. [Google Scholar] [CrossRef]
- Hemming, J.; Nieuwenhuizen, A.; Struik, L. Image analysis system to determine crop row and plant positions for an intra-row weeding machine. In Proceedings of the International Symposium on Sustainable Bioproduction, Tokyo, Japan, 19–23 September 2011. [Google Scholar]
- Hemming, J.; Jong, H.; De Struik, L.; Meer, J.; Van Henten, E.J. Field Performance Evaluation Method for a Machine Vision Based Intra Row Hoeing Machine. In Proceedings of the AgEng2018, Wageningen, The Netherlands, 8–12 July 2018. [Google Scholar]
- van Evert, F.K.; Samsom, J.; Vijn, M.; Dooren, H.-J.; van Lamaker, A.; van der Heijden, G.W.A.M.; Kempenaar, C.; van der Zalm, T.; Lotz, L.A.P. A Robot to Detect and Control Broad-Leaved Dock (Rumex obtusifolius L.) in Grassland. J. Field Robot. 2011, 28, 264–277. [Google Scholar] [CrossRef]
- Underwood, J.P.; Calleija, M.; Taylor, Z.; Hung, C.; Nieto, J.; Fitch, R.; Sukkarieh, S. Real-time target detection and steerable spray for vegetable crops. In Proceedings of the International Conference on Robotics and Automation: Robotics in Agriculture Workshop, Seattle, WA, USA, 26–30 May 2015; pp. 26–30. [Google Scholar]
- NVWA Teeltvoorschrift-Phytophthora-Infestans. Available online: https://www.nvwa.nl/onderwerpen/teeltvoorschriften-akkerbouw-en-tuinbouw/teeltvoorschrift-phytophthora-infestans (accessed on 18 August 2020).
- Redmon, J.; Farhadi, A. YOLOv3: An Incremental Improvement. arXiv 2018, arXiv:1804.02767. [Google Scholar]
- Ren, S.; He, K.; Girshick, R.; Sun, J. Faster R-CNN: Towards Real-Time Object Detection with Region Proposal Networks. Adv. Neural Inf. Process. Syst. 28 2015, 39, 1137–1149. [Google Scholar] [CrossRef]
- Lin, T.-Y.; Goyal, P.; Girshick, R.; He, K.; Dollar, P. Focal Loss for Dense Object Detection. In Proceedings of the 2017 IEEE International Conference on Computer Vision (ICCV), IEEE, Venice, Italy, 22–29 October 2017; pp. 2999–3007. [Google Scholar]
- Jocher, G. YOLOv3 Ultralytics. Available online: https://github.com/ultralytics/yolov3 (accessed on 19 August 2019).
- Joseph, R.; Farhadi, A. YOLO: Real-Time Object Detection. Available online: https://pjreddie.com/darknet/yolo/ (accessed on 6 May 2019).
- Lin, T.-Y.; Maire, M.; Belongie, S.; Bourdev, L.; Girshick, R.; Hays, J.; Perona, P.; Ramanan, D.; Zitnick, C.L.; Dollár, P. Microsoft COCO: Common Objects in Context. In Proceedings of the European Conference on Computer Vision, Zurich, Switzerland, 6–12 September 2014. [Google Scholar]
- Lottes, P.; Behley, J.; Milioto, A.; Stachniss, C. Fully Convolutional Networks with Sequential Information for Robust Crop and Weed Detection in Precision Farming. IEEE Robot. Autom. Lett. 2018, 3, 2870–2877. [Google Scholar] [CrossRef]


| Augmentation type | Description |
|---|---|
| Translation | ±6.8% (vertical and horizontal) |
| Rotation | ±1.1 degrees |
| Shear | ±0.6 degrees (vertical and horizontal) |
| Scale | ±11% |
| Reflection | 50% probability (horizontal-only) |
| Saturation | ±57% |
| Brightness | ±32% |
| Part | Acquisition Date (s) | Contains Barley | Lighting | Resolution | Number of Images | Number of Sugar Beet Annotations | Number of Potato Annotations |
|---|---|---|---|---|---|---|---|
| a | 20 May 2019 | No | Controlled | 2048 × 1536 | 280 | 1177 | 440 |
| b | 9 August 2019 | Yes | Controlled | 2048 × 1536 | 228 | 738 | 336 |
| c | 2017 | No | Natural | 640 × 480 | 250 | 0 | 0 |
| d | Summer 2018 | No | Natural | 1280 × 1024 | 250 | 631 | 193 |
| e | 28 May 2018 and 1 June 2018 | No | Controlled | 2076 × 2076 | 250 | 794 | 161 |
| f | 28 May 2018 and 1 June 2018 | Yes | Natural | 2076 × 2076 | 250 | 734 | 195 |
| g | 28 May 2018 | No | Controlled | 1280 × 720 | 250 | 554 | 93 |
| h | 28 May 2018 and 1 June 2018 | Yes | Natural | 1280 × 720 | 250 | 484 | 121 |
| i | 4 May 2019 | No | Natural | 1280 × 720 | 250 | 1271 | 170 |
| Plot Number | Soil Type | Contains Barley | Number of Images | Number of Sugar Beet Annotations | Number of Potato Annotations |
|---|---|---|---|---|---|
| 1 | Sandy | Yes | 188 | 645 | 71 |
| 2 | Sandy | No | 188 | 678 | 76 |
| 3 | Sandy | No | 180 | 579 | 64 |
| 4 | Sandy | Yes | 176 | 365 | 75 |
| 5 | Peaty | Yes | 180 | 744 | 75 |
| 6 | Peaty | No | 184 | 718 | 72 |
| 7 | Peaty | No | 176 | 563 | 57 |
| 8 | Peaty | Yes | 184 | 543 | 87 |
| Plot Number | 1 | 2 | 3 | 4 | 5 | 6 | 7 | 8 | Average |
|---|---|---|---|---|---|---|---|---|---|
| Percentage sugar beets hit close to a potato | 14% | 36% | 67% | 100% | 43% | 75% | 67% | 0% | 50% |
Publisher’s Note: MDPI stays neutral with regard to jurisdictional claims in published maps and institutional affiliations. |
© 2020 by the authors. Licensee MDPI, Basel, Switzerland. This article is an open access article distributed under the terms and conditions of the Creative Commons Attribution (CC BY) license (http://creativecommons.org/licenses/by/4.0/).
Share and Cite
Ruigrok, T.; van Henten, E.; Booij, J.; van Boheemen, K.; Kootstra, G. Application-Specific Evaluation of a Weed-Detection Algorithm for Plant-Specific Spraying. Sensors 2020, 20, 7262. https://doi.org/10.3390/s20247262
Ruigrok T, van Henten E, Booij J, van Boheemen K, Kootstra G. Application-Specific Evaluation of a Weed-Detection Algorithm for Plant-Specific Spraying. Sensors. 2020; 20(24):7262. https://doi.org/10.3390/s20247262
Chicago/Turabian StyleRuigrok, Thijs, Eldert van Henten, Johan Booij, Koen van Boheemen, and Gert Kootstra. 2020. "Application-Specific Evaluation of a Weed-Detection Algorithm for Plant-Specific Spraying" Sensors 20, no. 24: 7262. https://doi.org/10.3390/s20247262
APA StyleRuigrok, T., van Henten, E., Booij, J., van Boheemen, K., & Kootstra, G. (2020). Application-Specific Evaluation of a Weed-Detection Algorithm for Plant-Specific Spraying. Sensors, 20(24), 7262. https://doi.org/10.3390/s20247262