SwimOne. New Device for Determining Instantaneous Power and Propulsive Forces in Swimming

 ,
,  ,
,  , , , and
Abstract
:1. Introduction
2. Materials and Methods
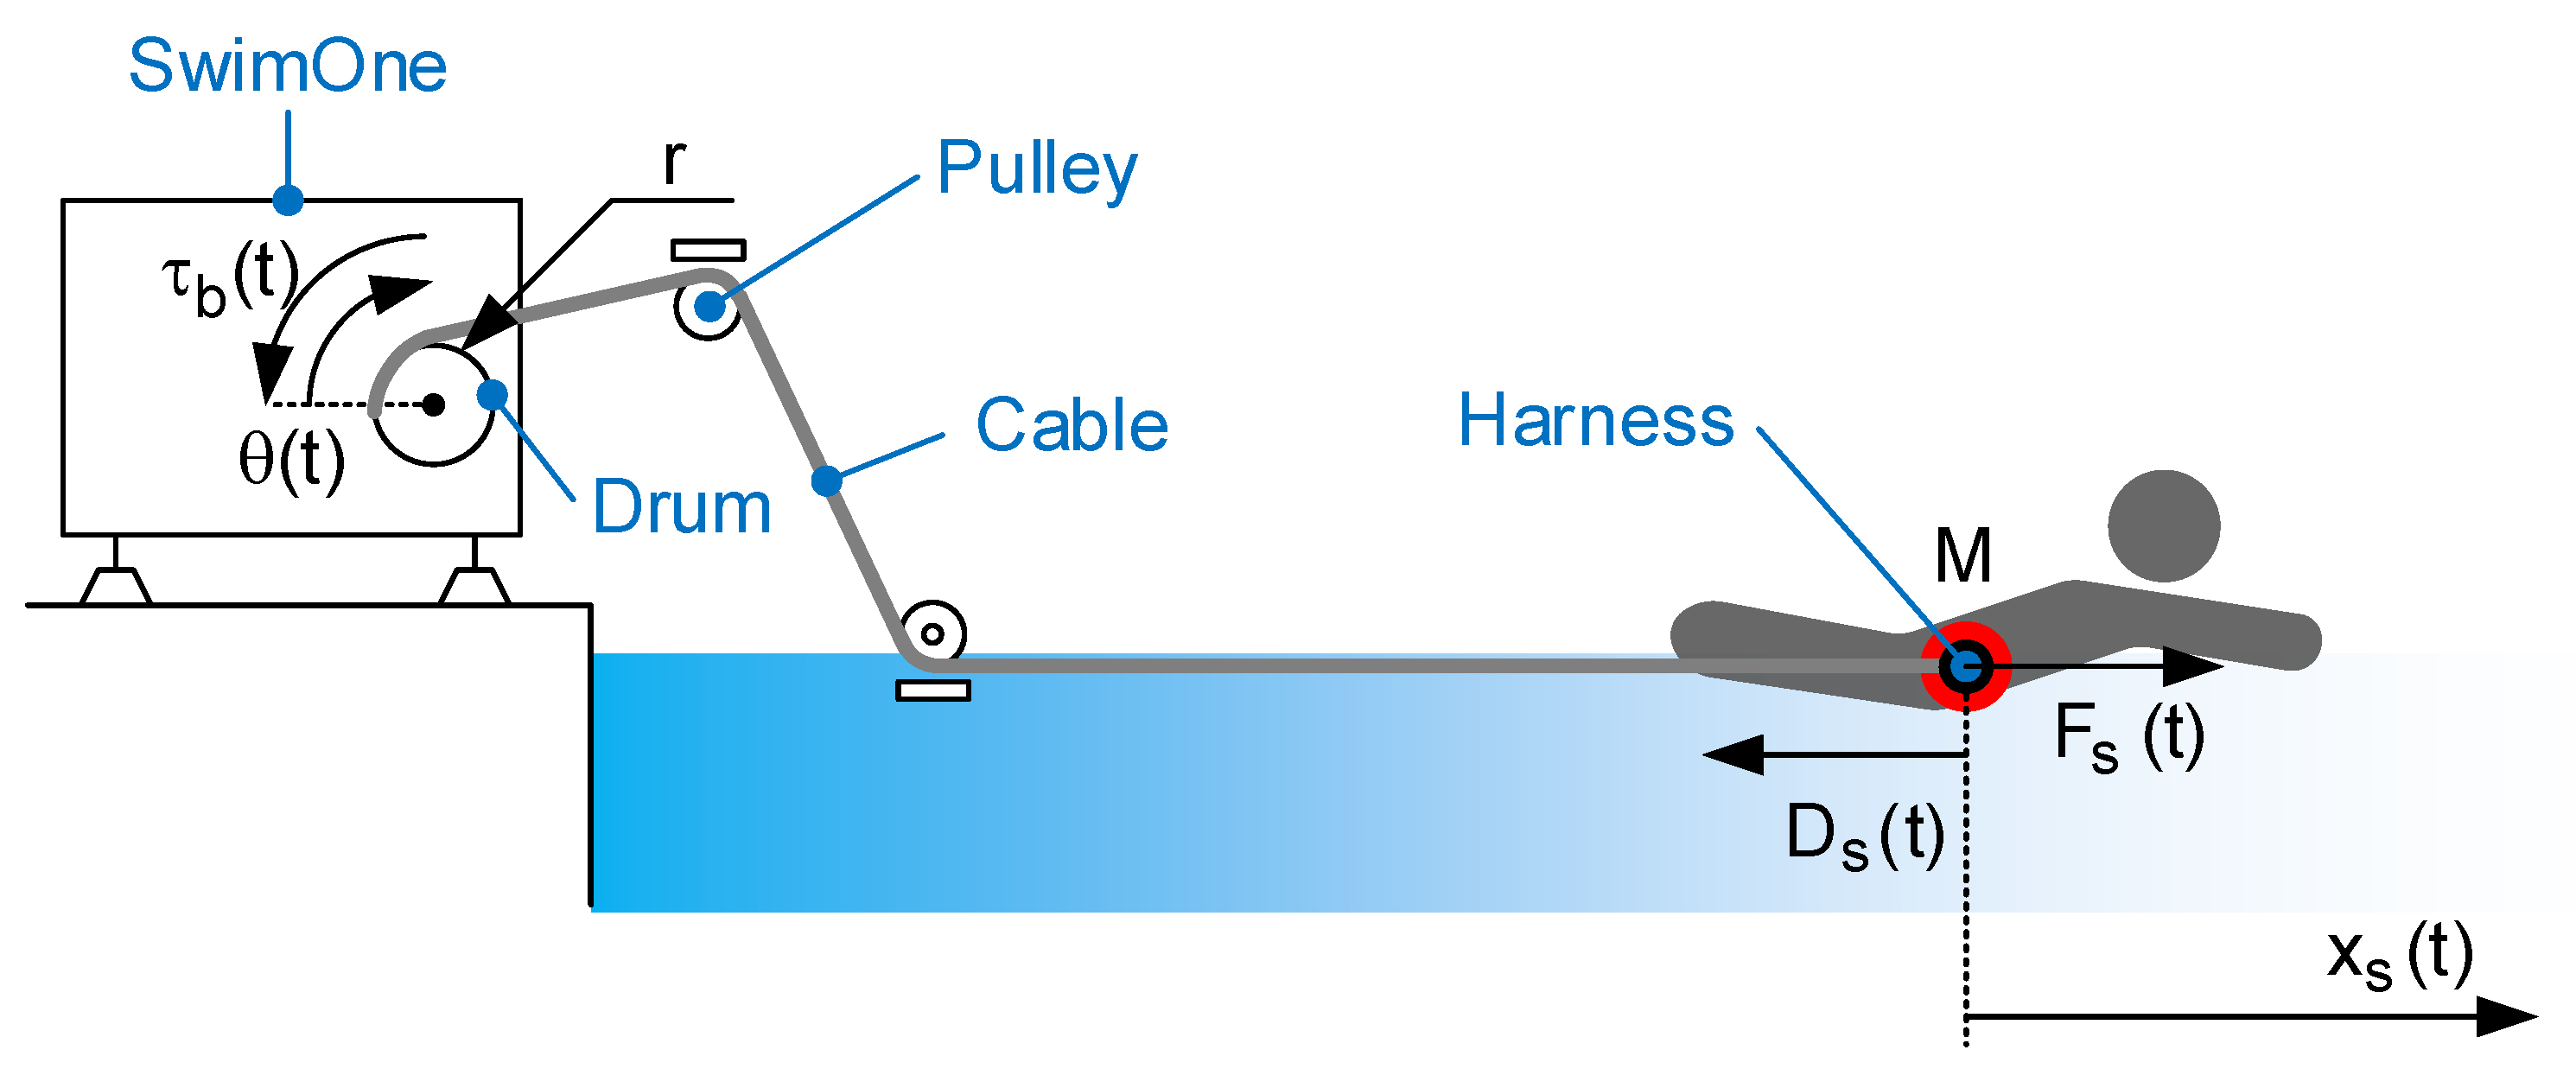
2.1. Conceptual Design
- 1.
- To measure the drum angle, , and:
- (a)
- to estimate the swimmer displacement, .
- (b)
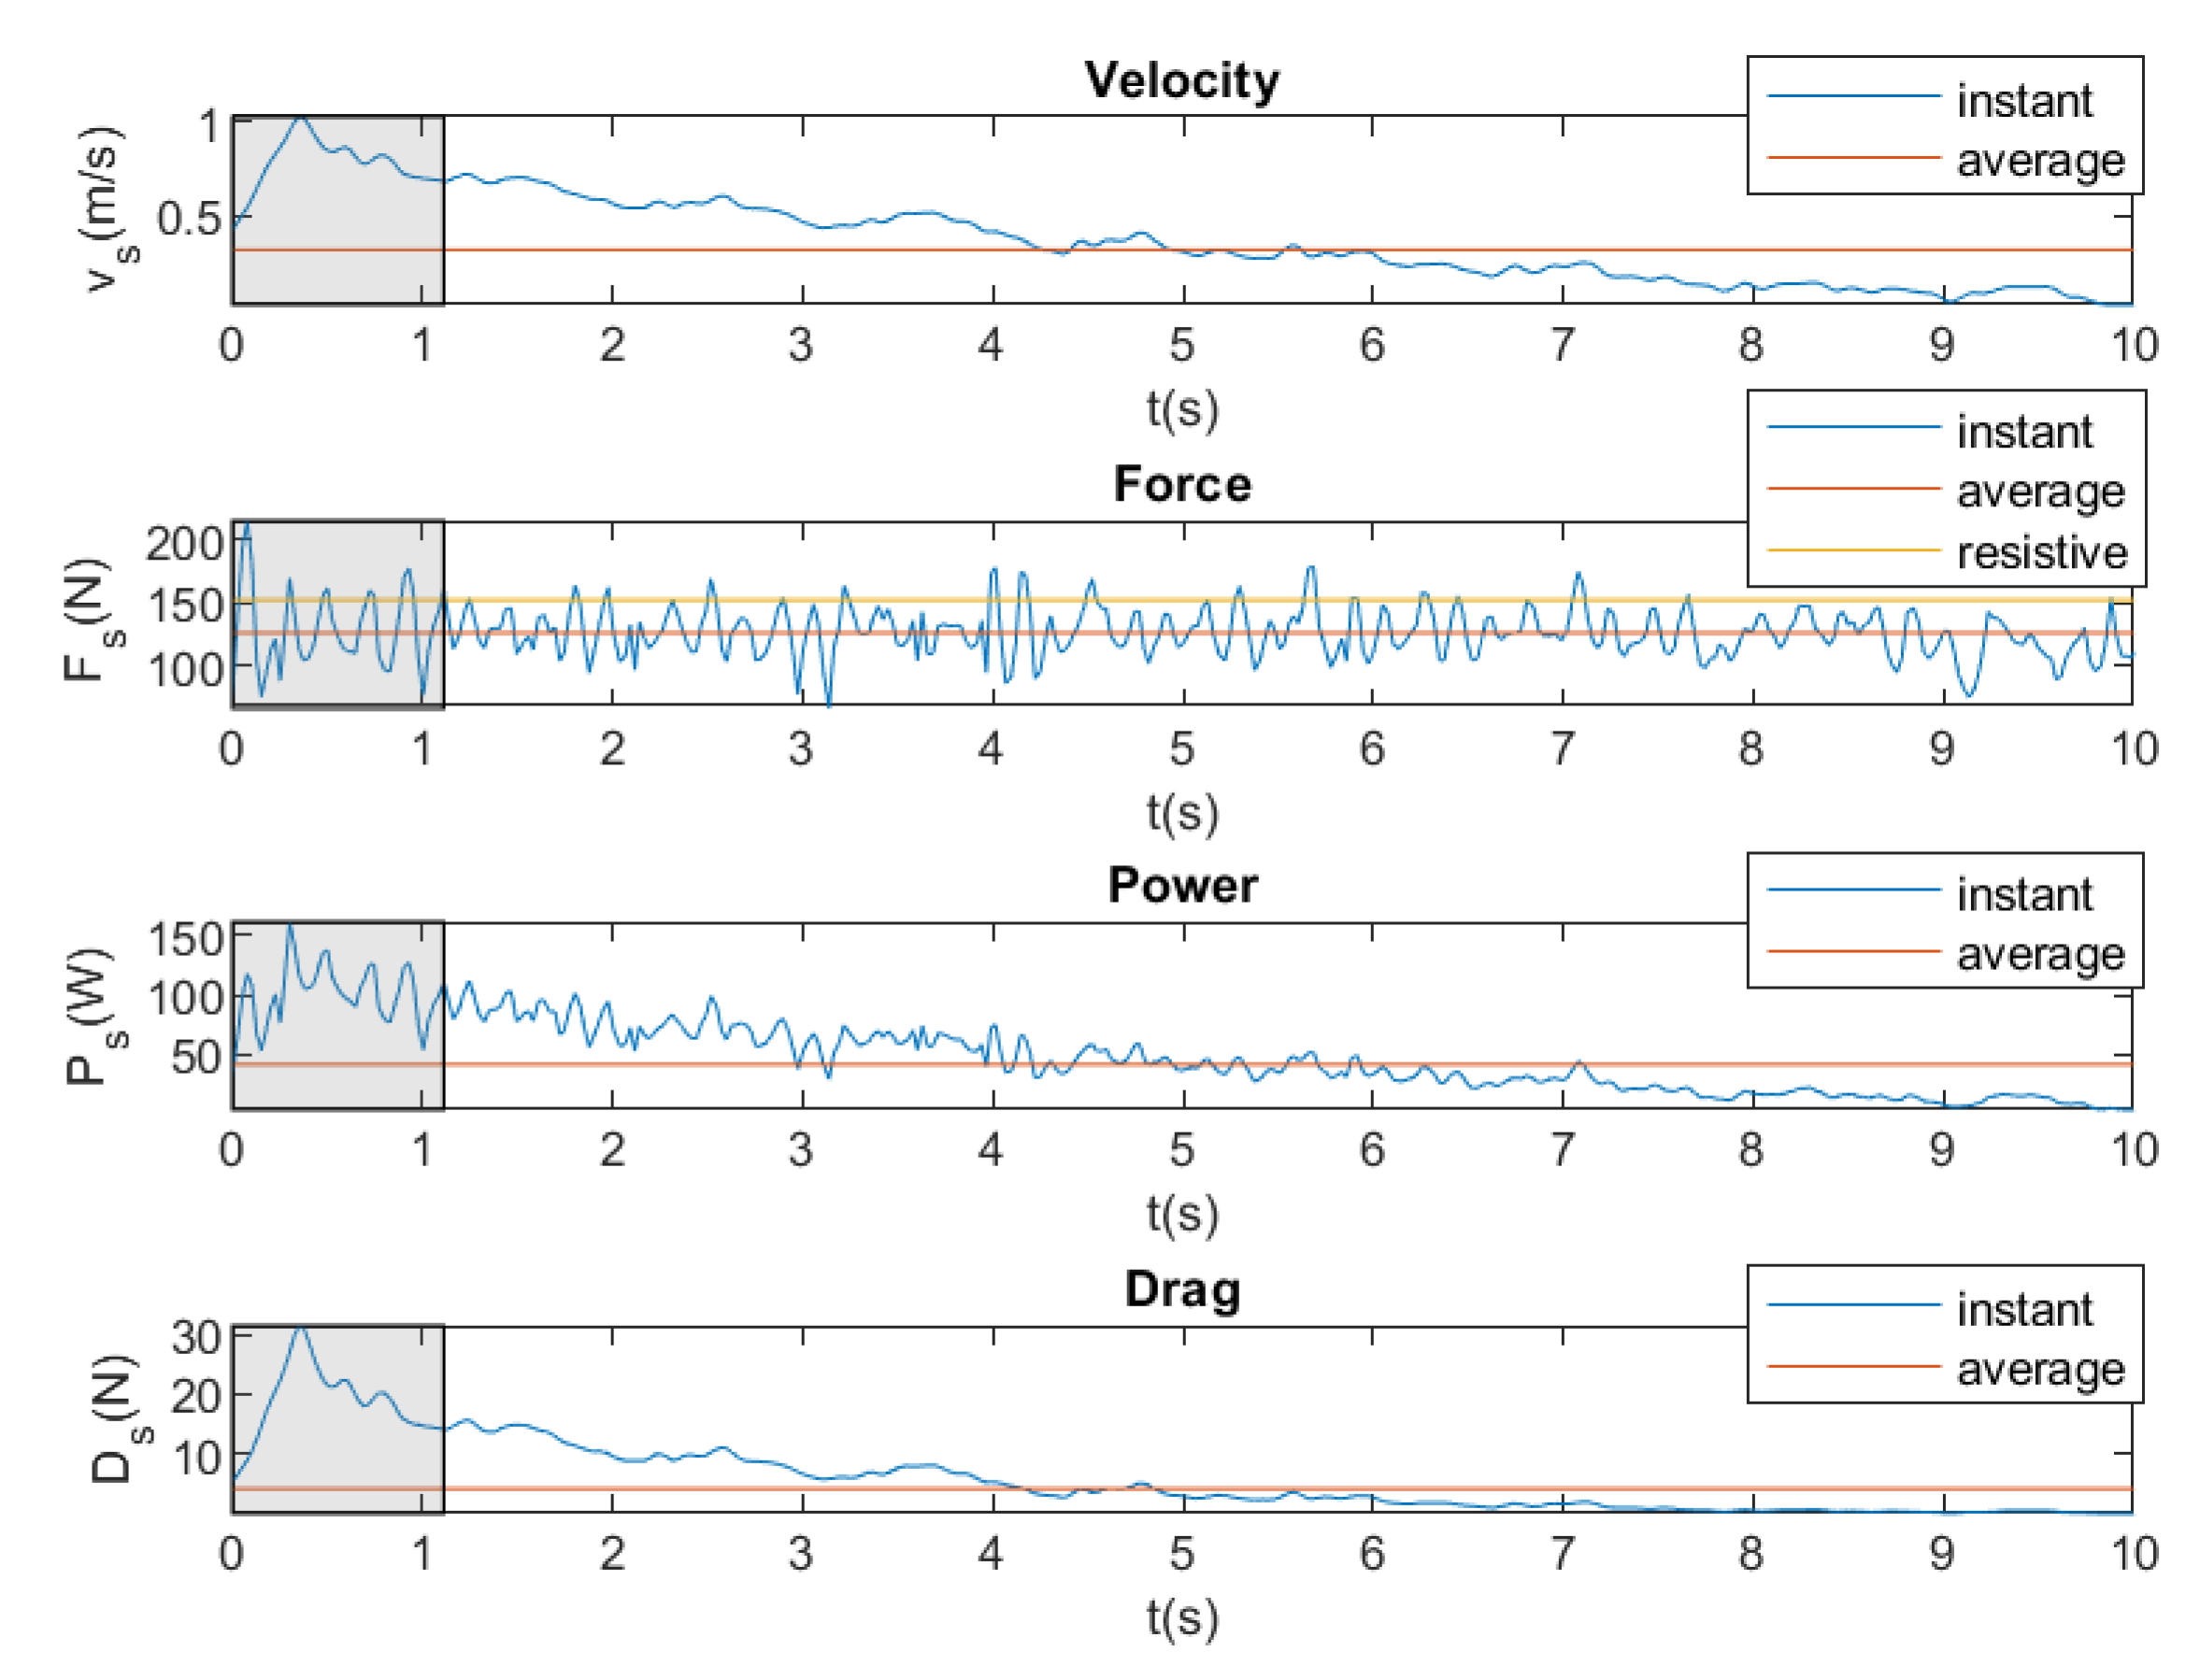
- To obtain swimmer velocity and acceleration, and .
- (c)
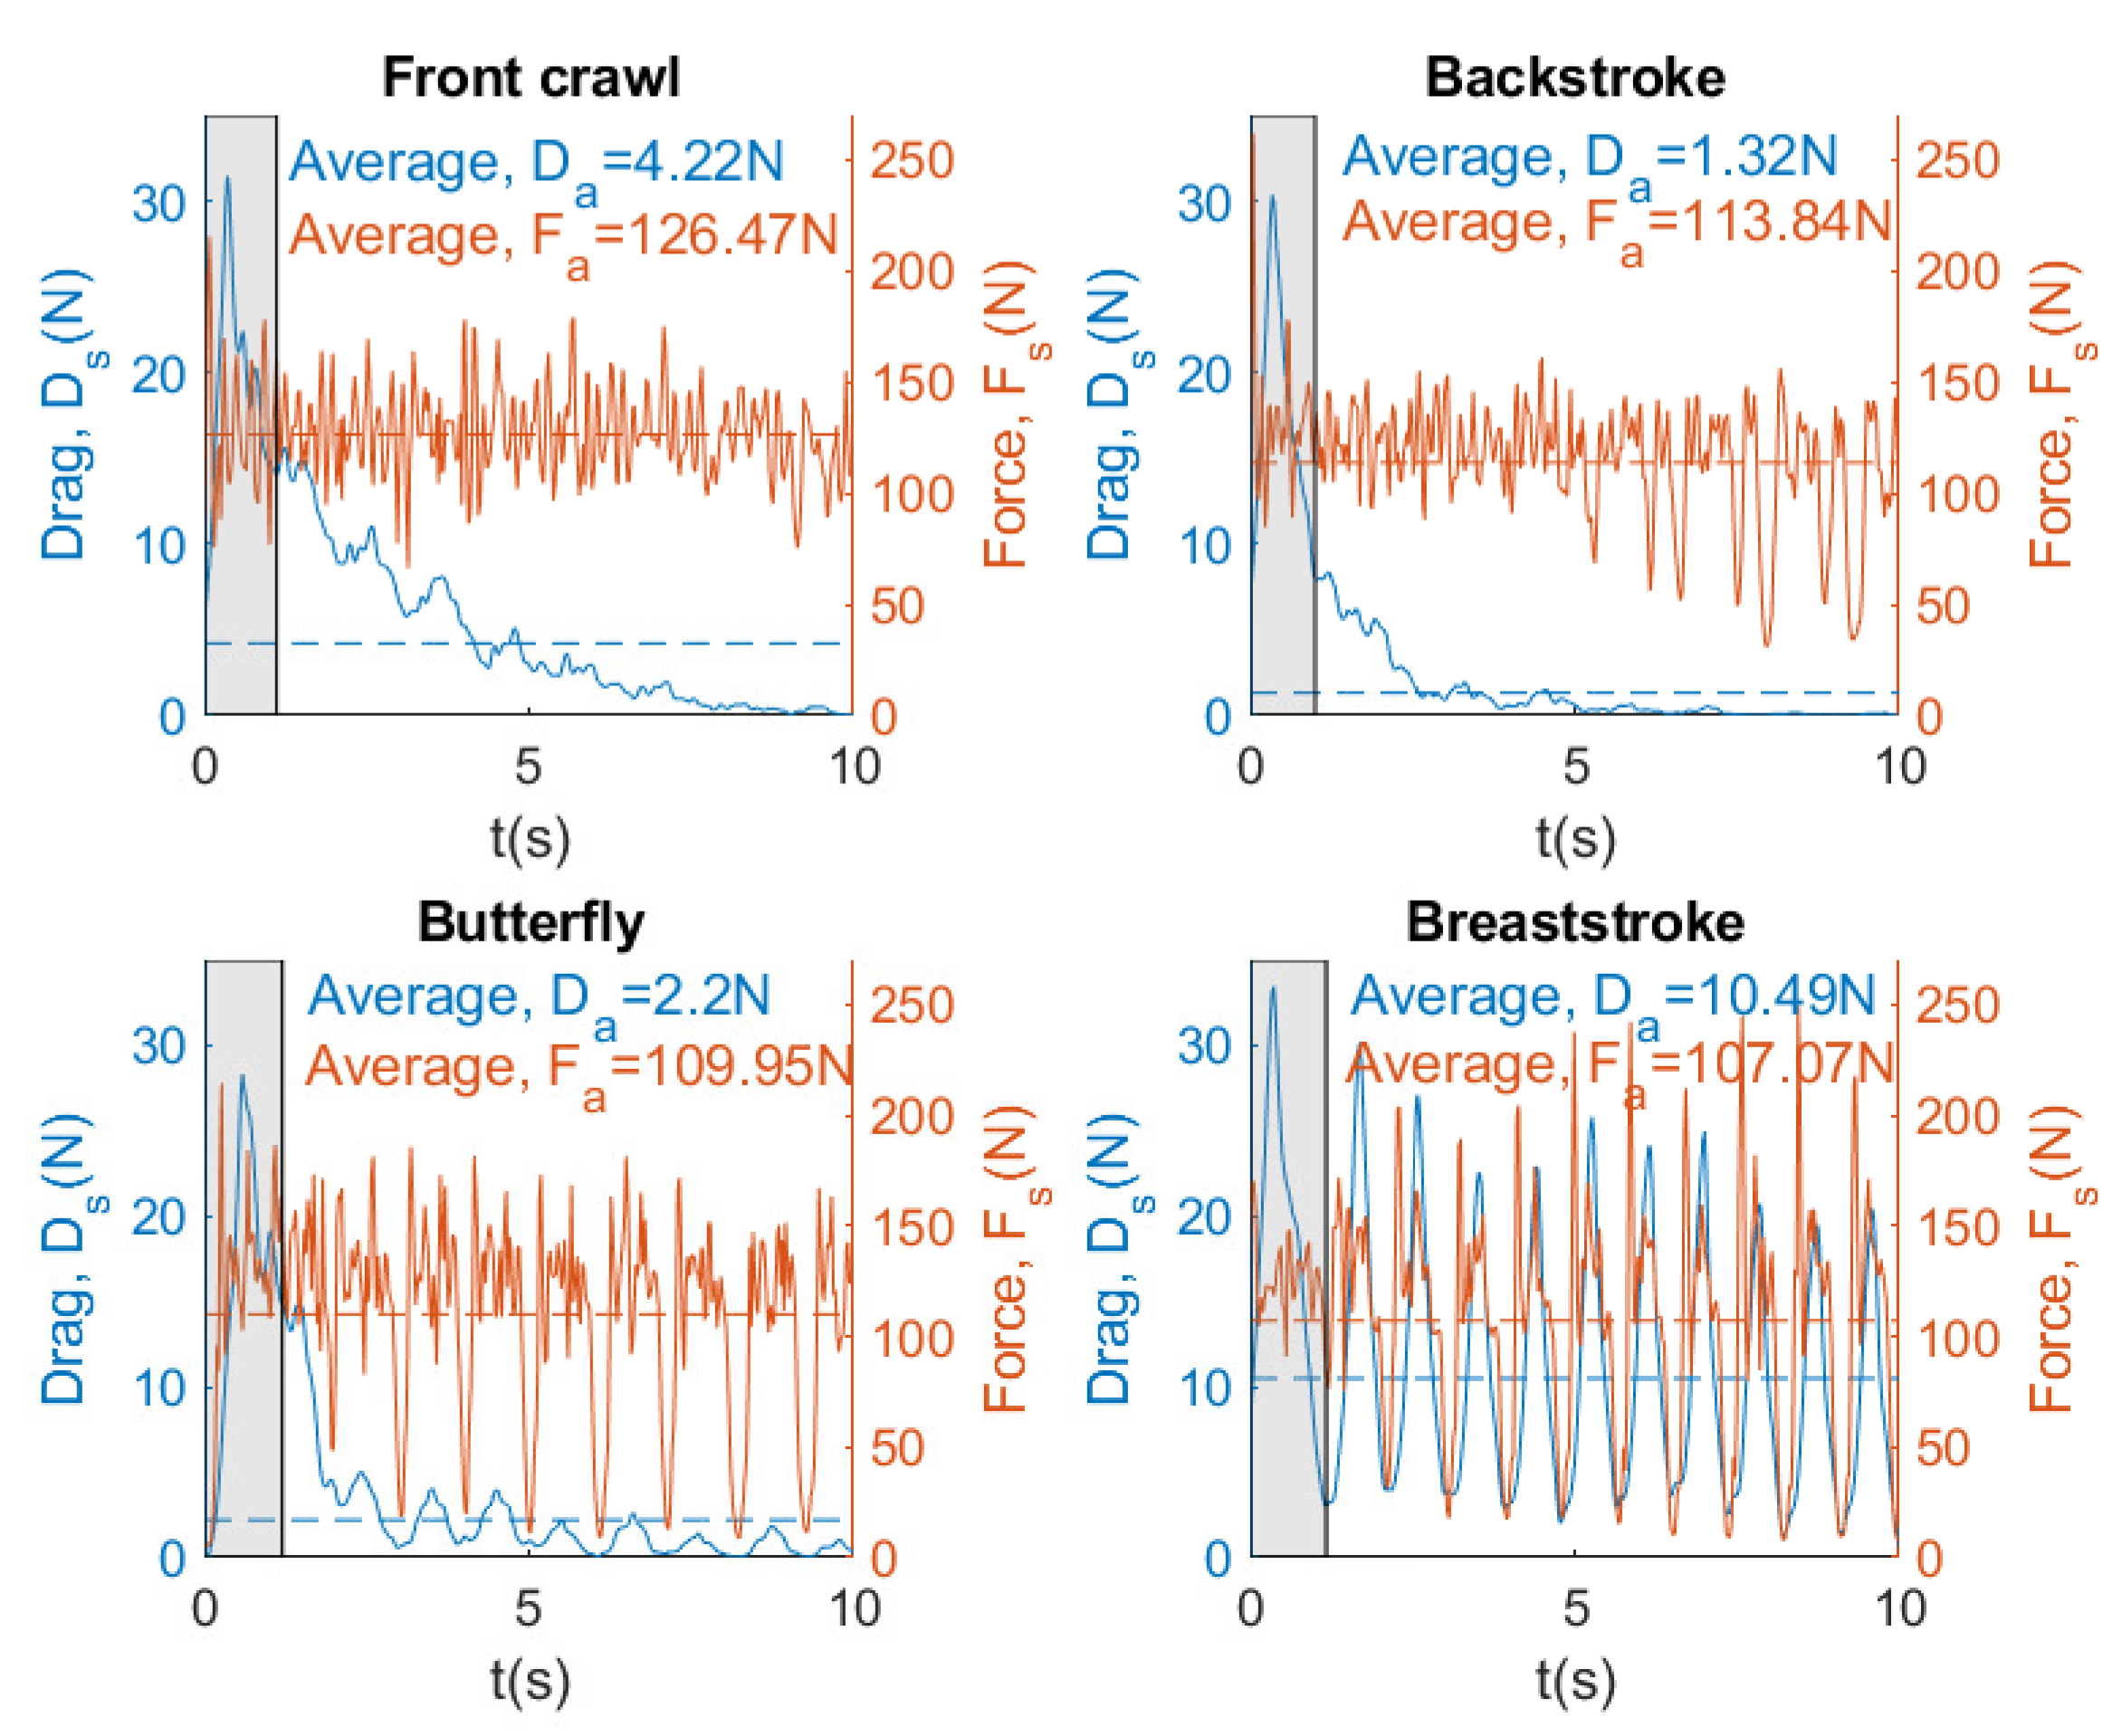
- To determine drag term .
- 2.
- To measure cable tension, , and to estimate propulsive force by means of .
- 3.
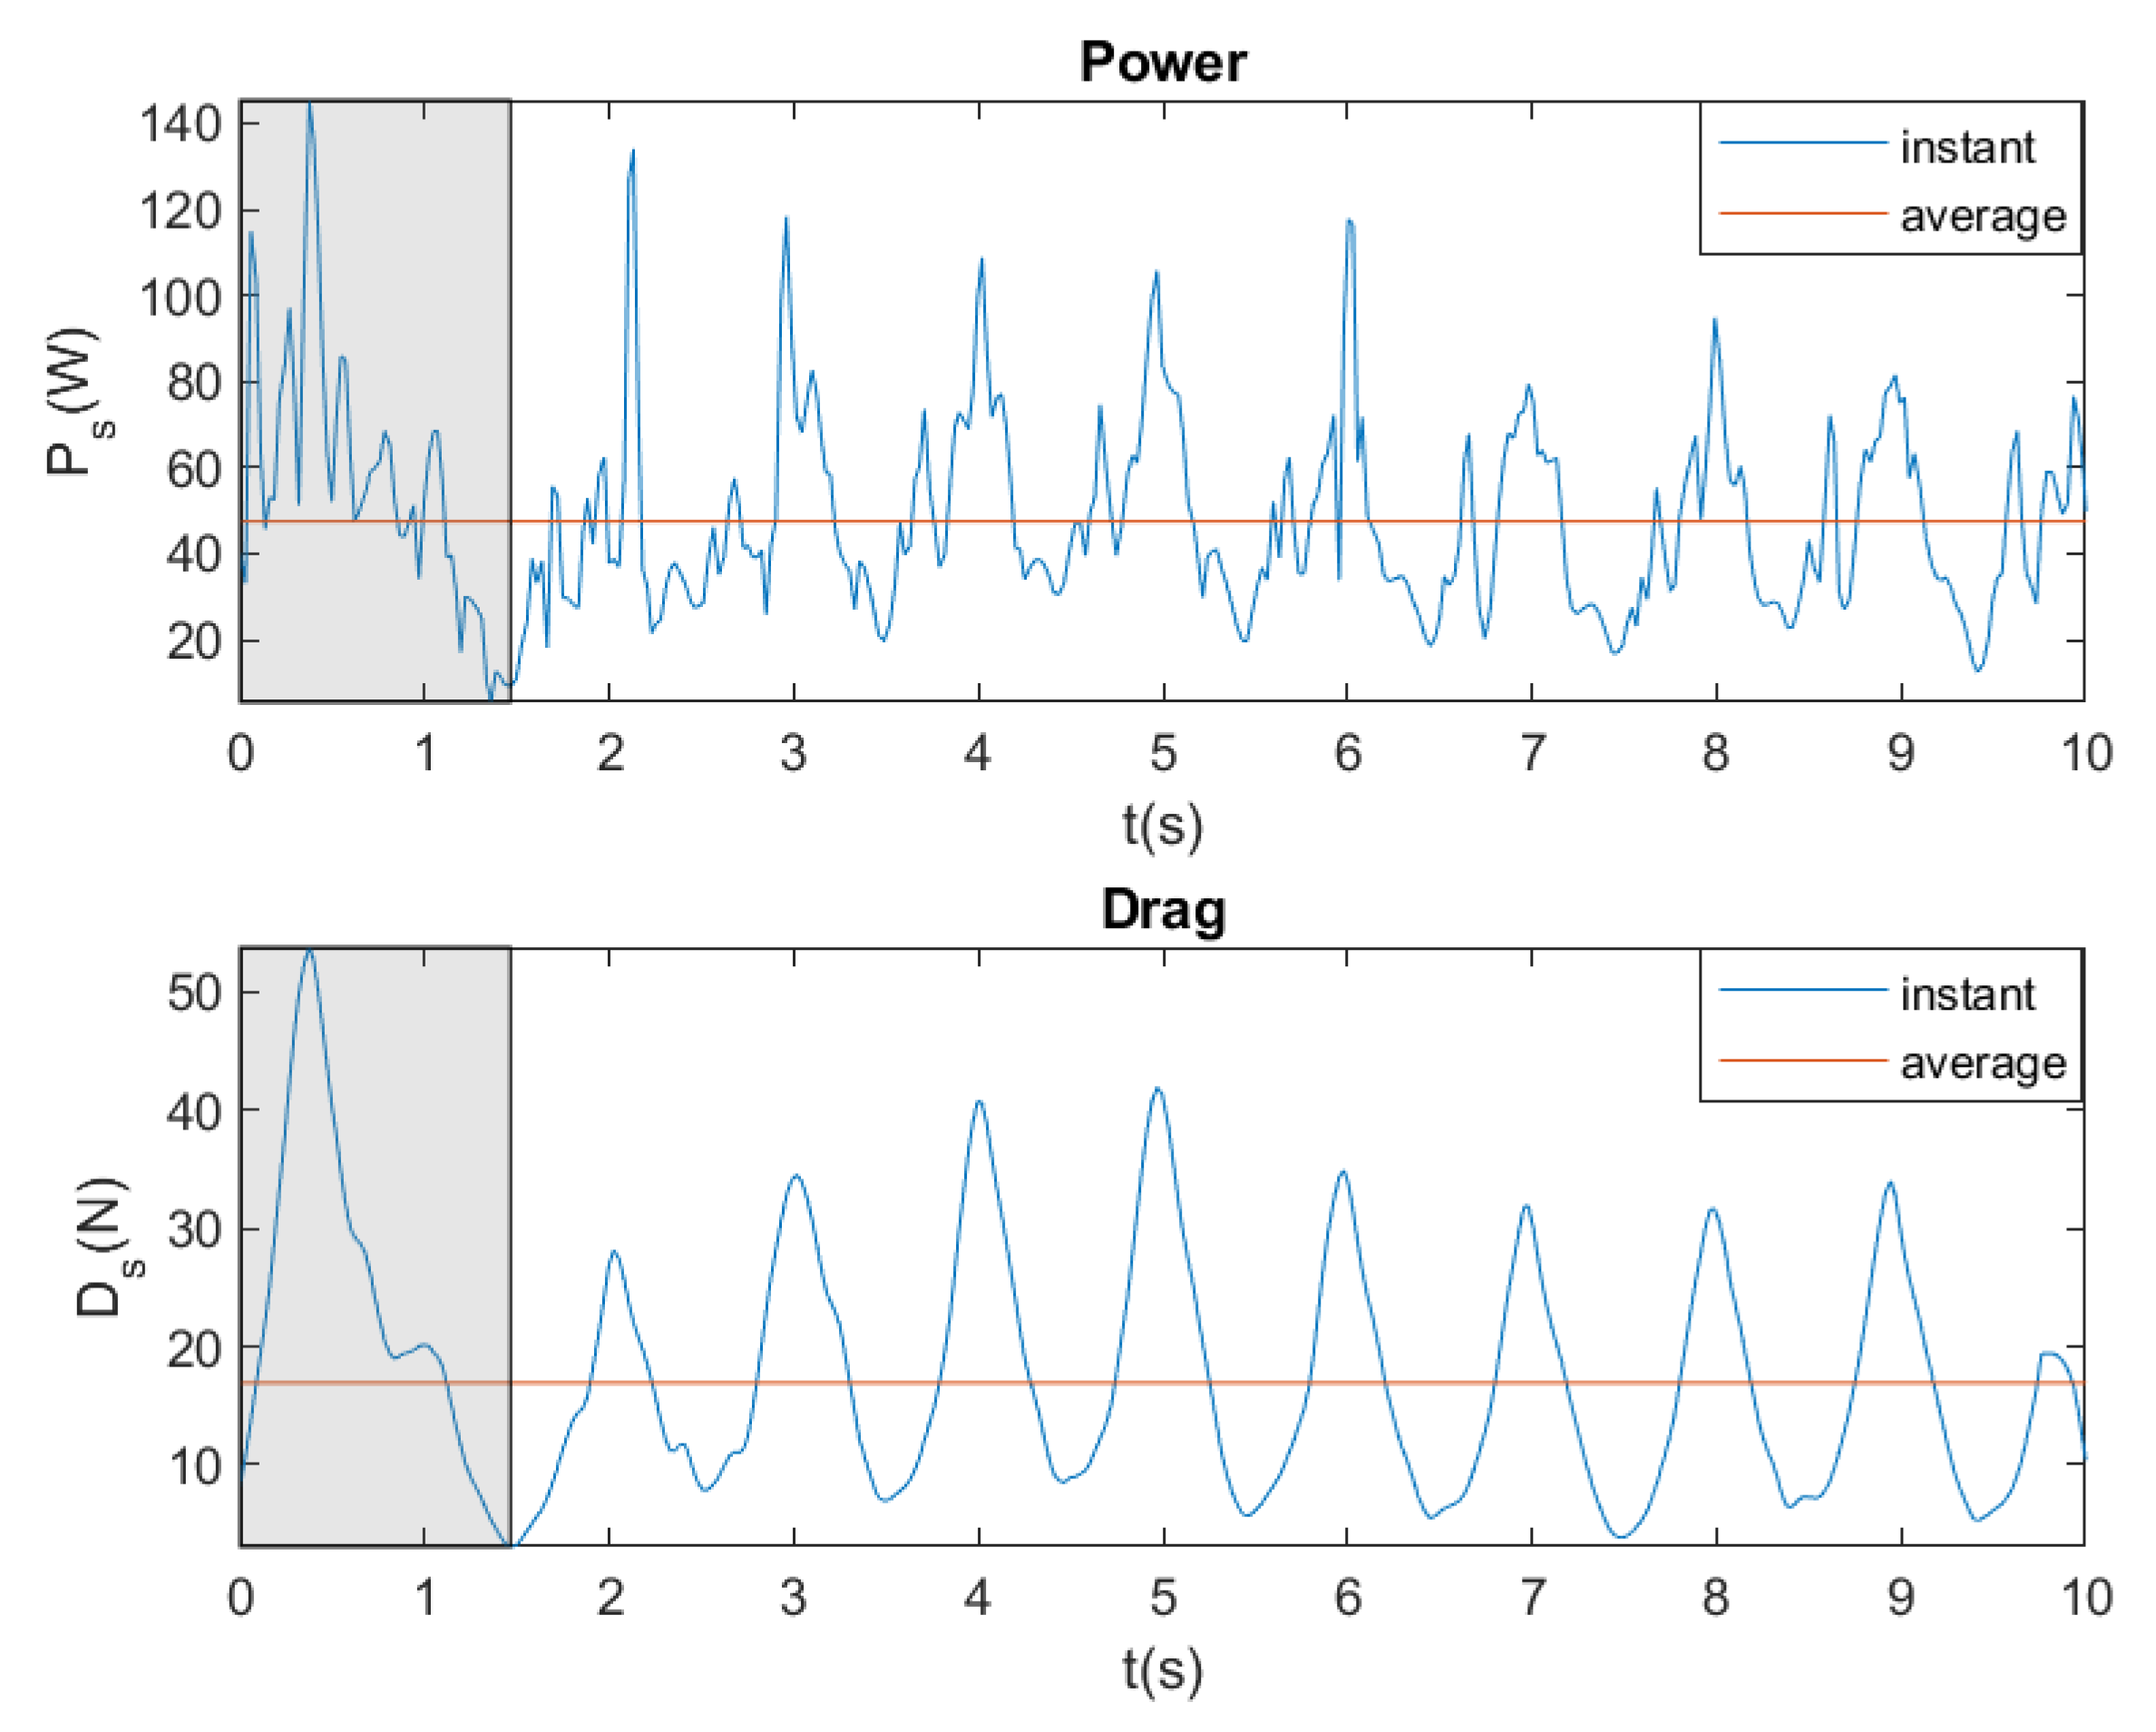
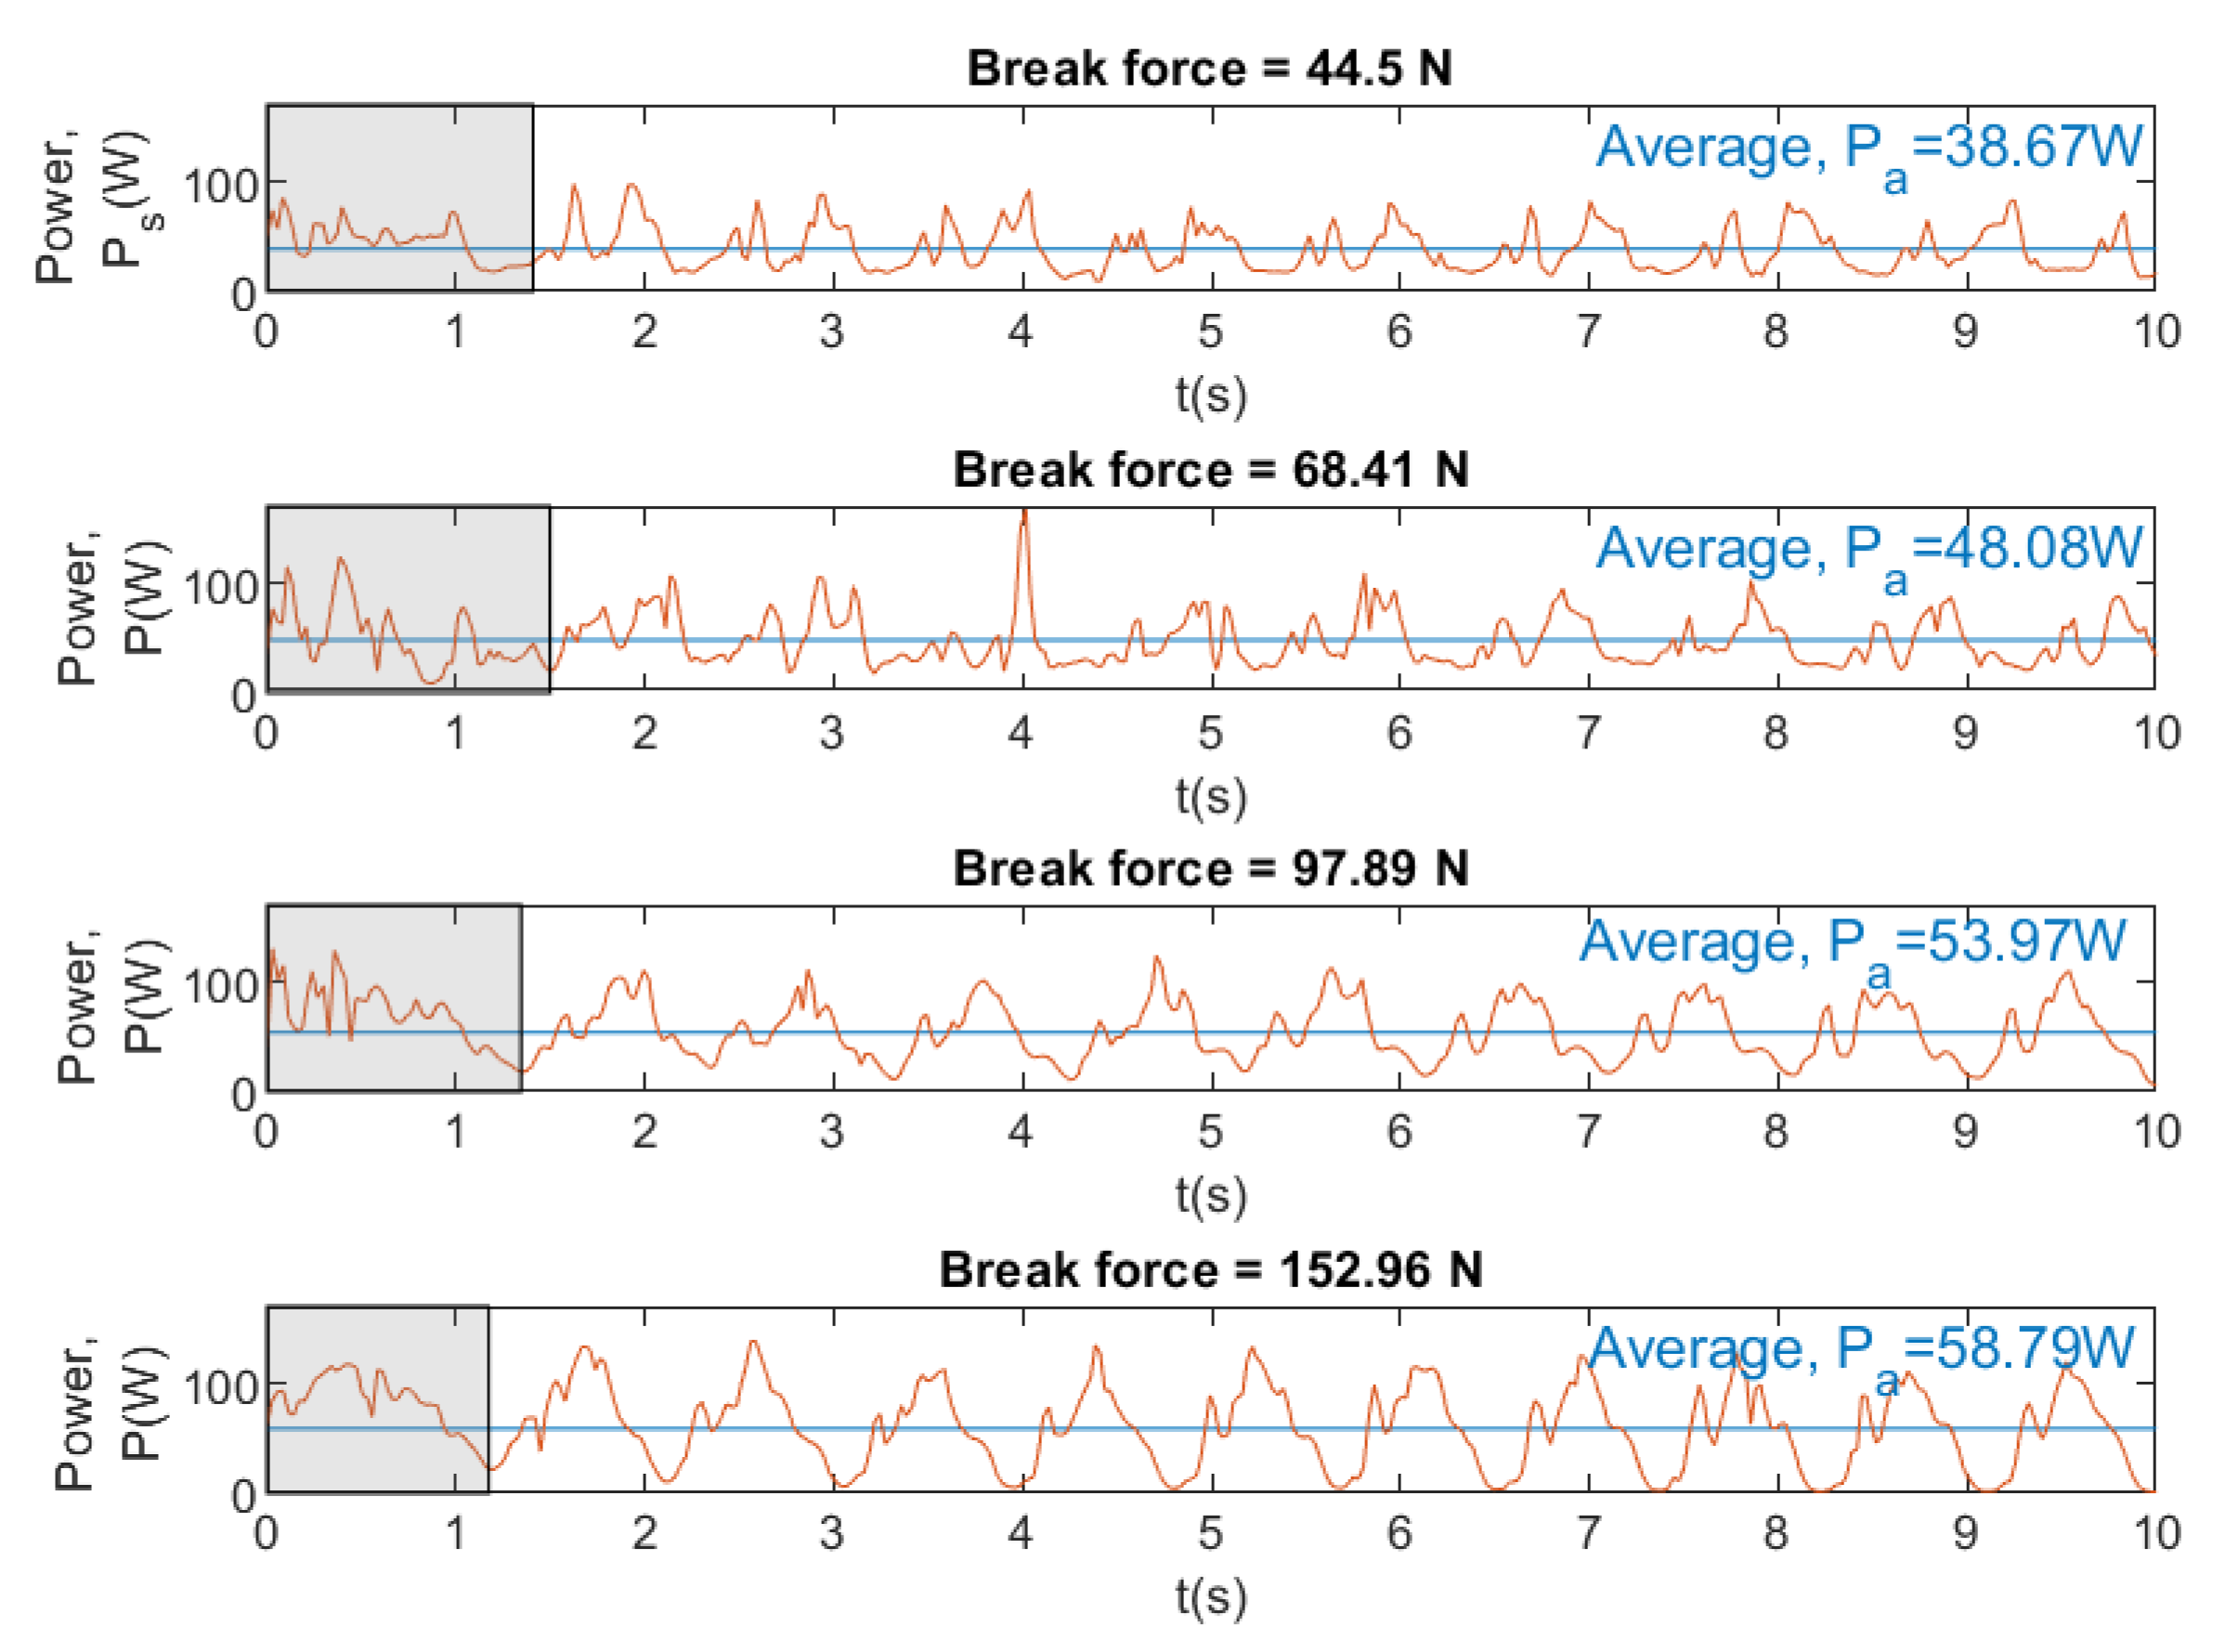
- To obtain instantaneous power by computing
2.2. Requirements for Designing
- It shall be able to monitor force, displacement, velocity, and instant acceleration to know the swimmer performance.
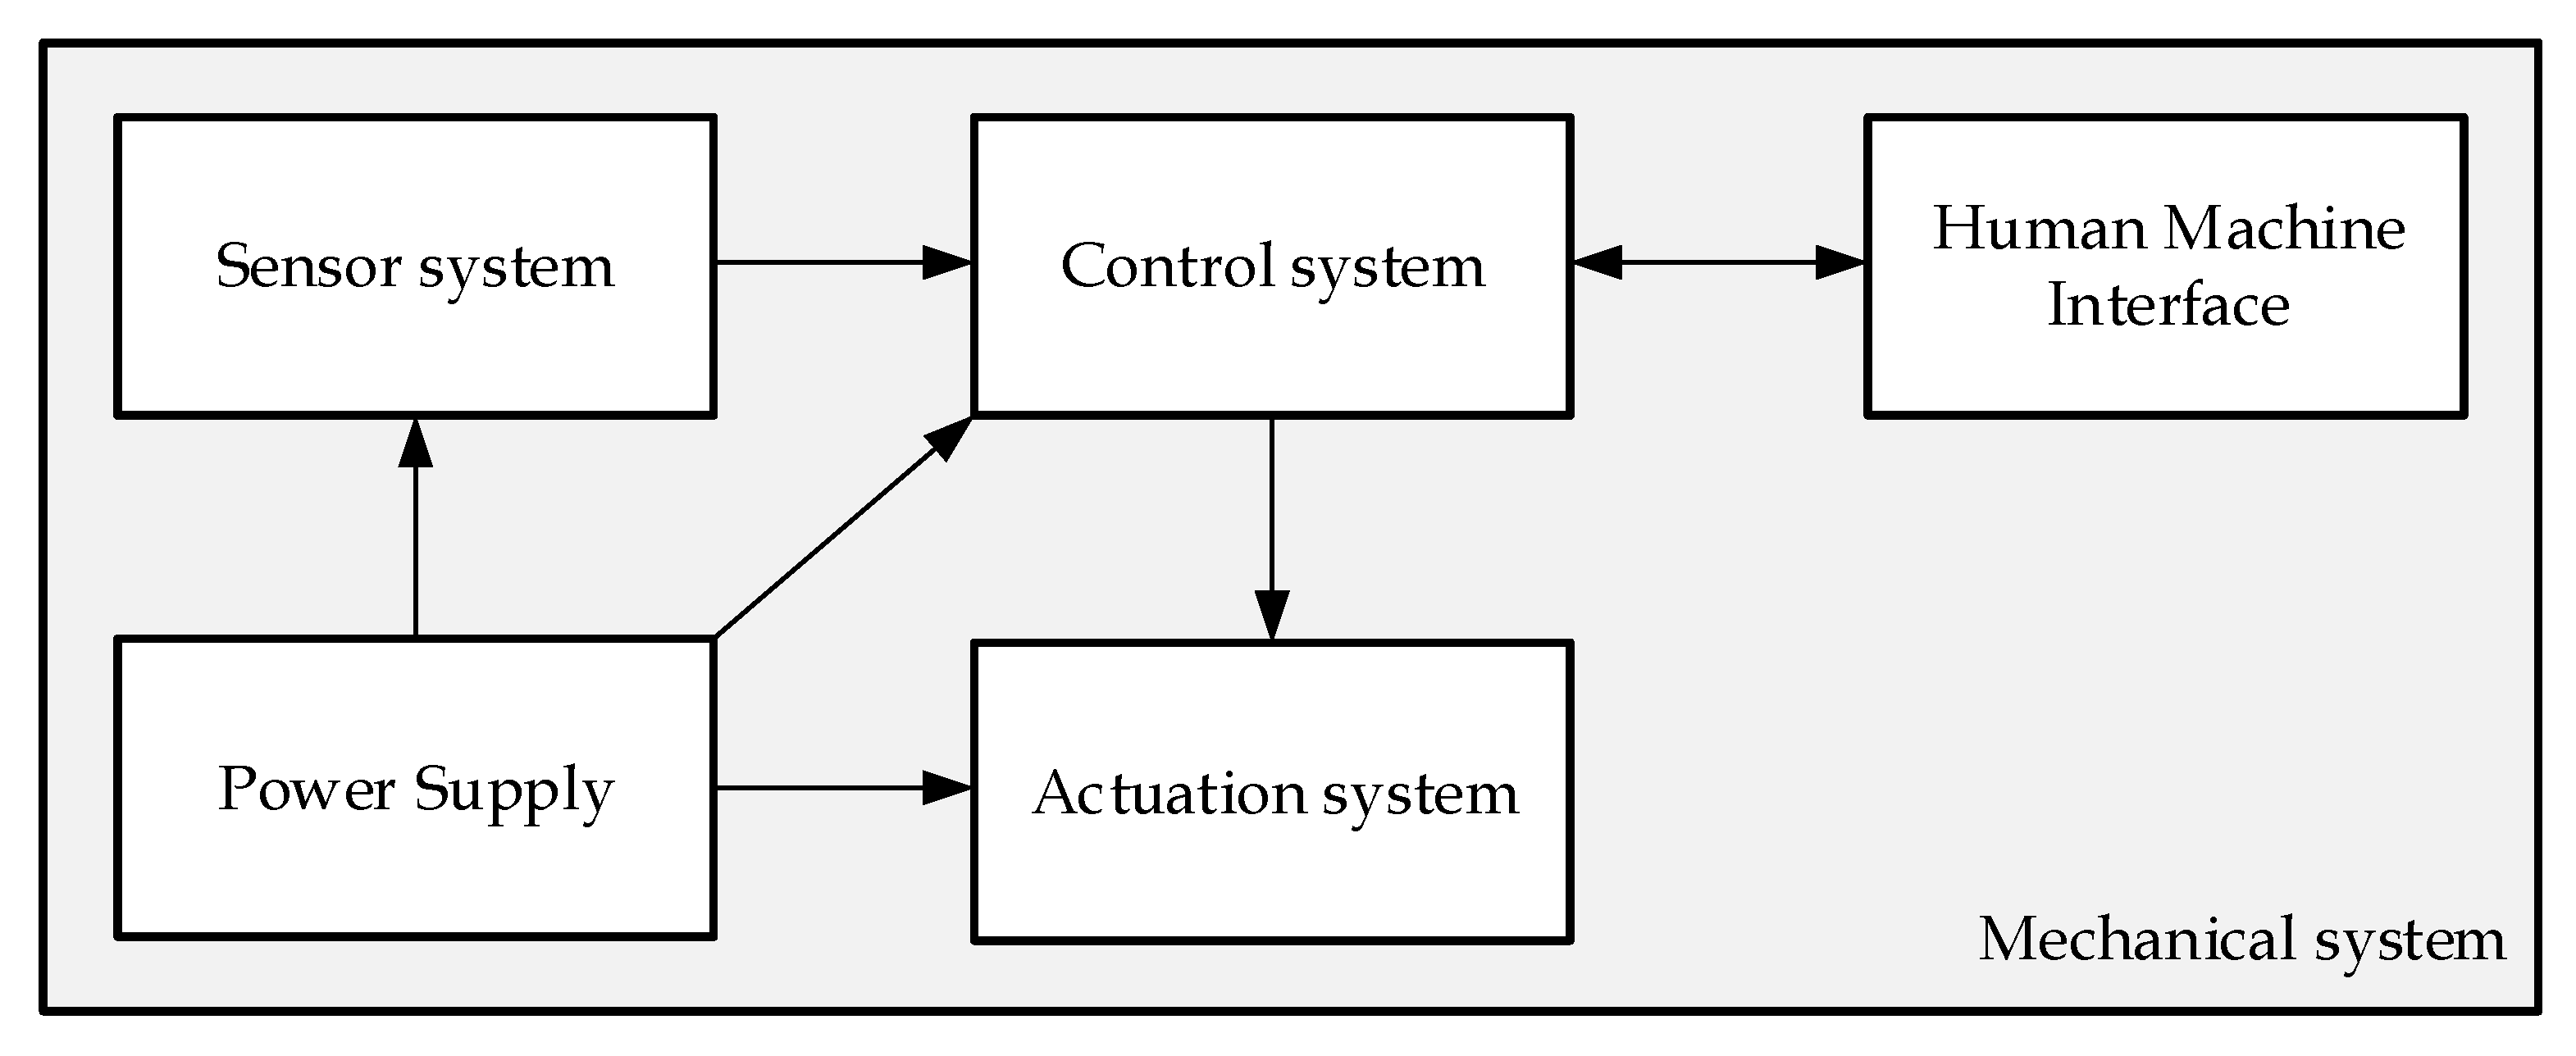
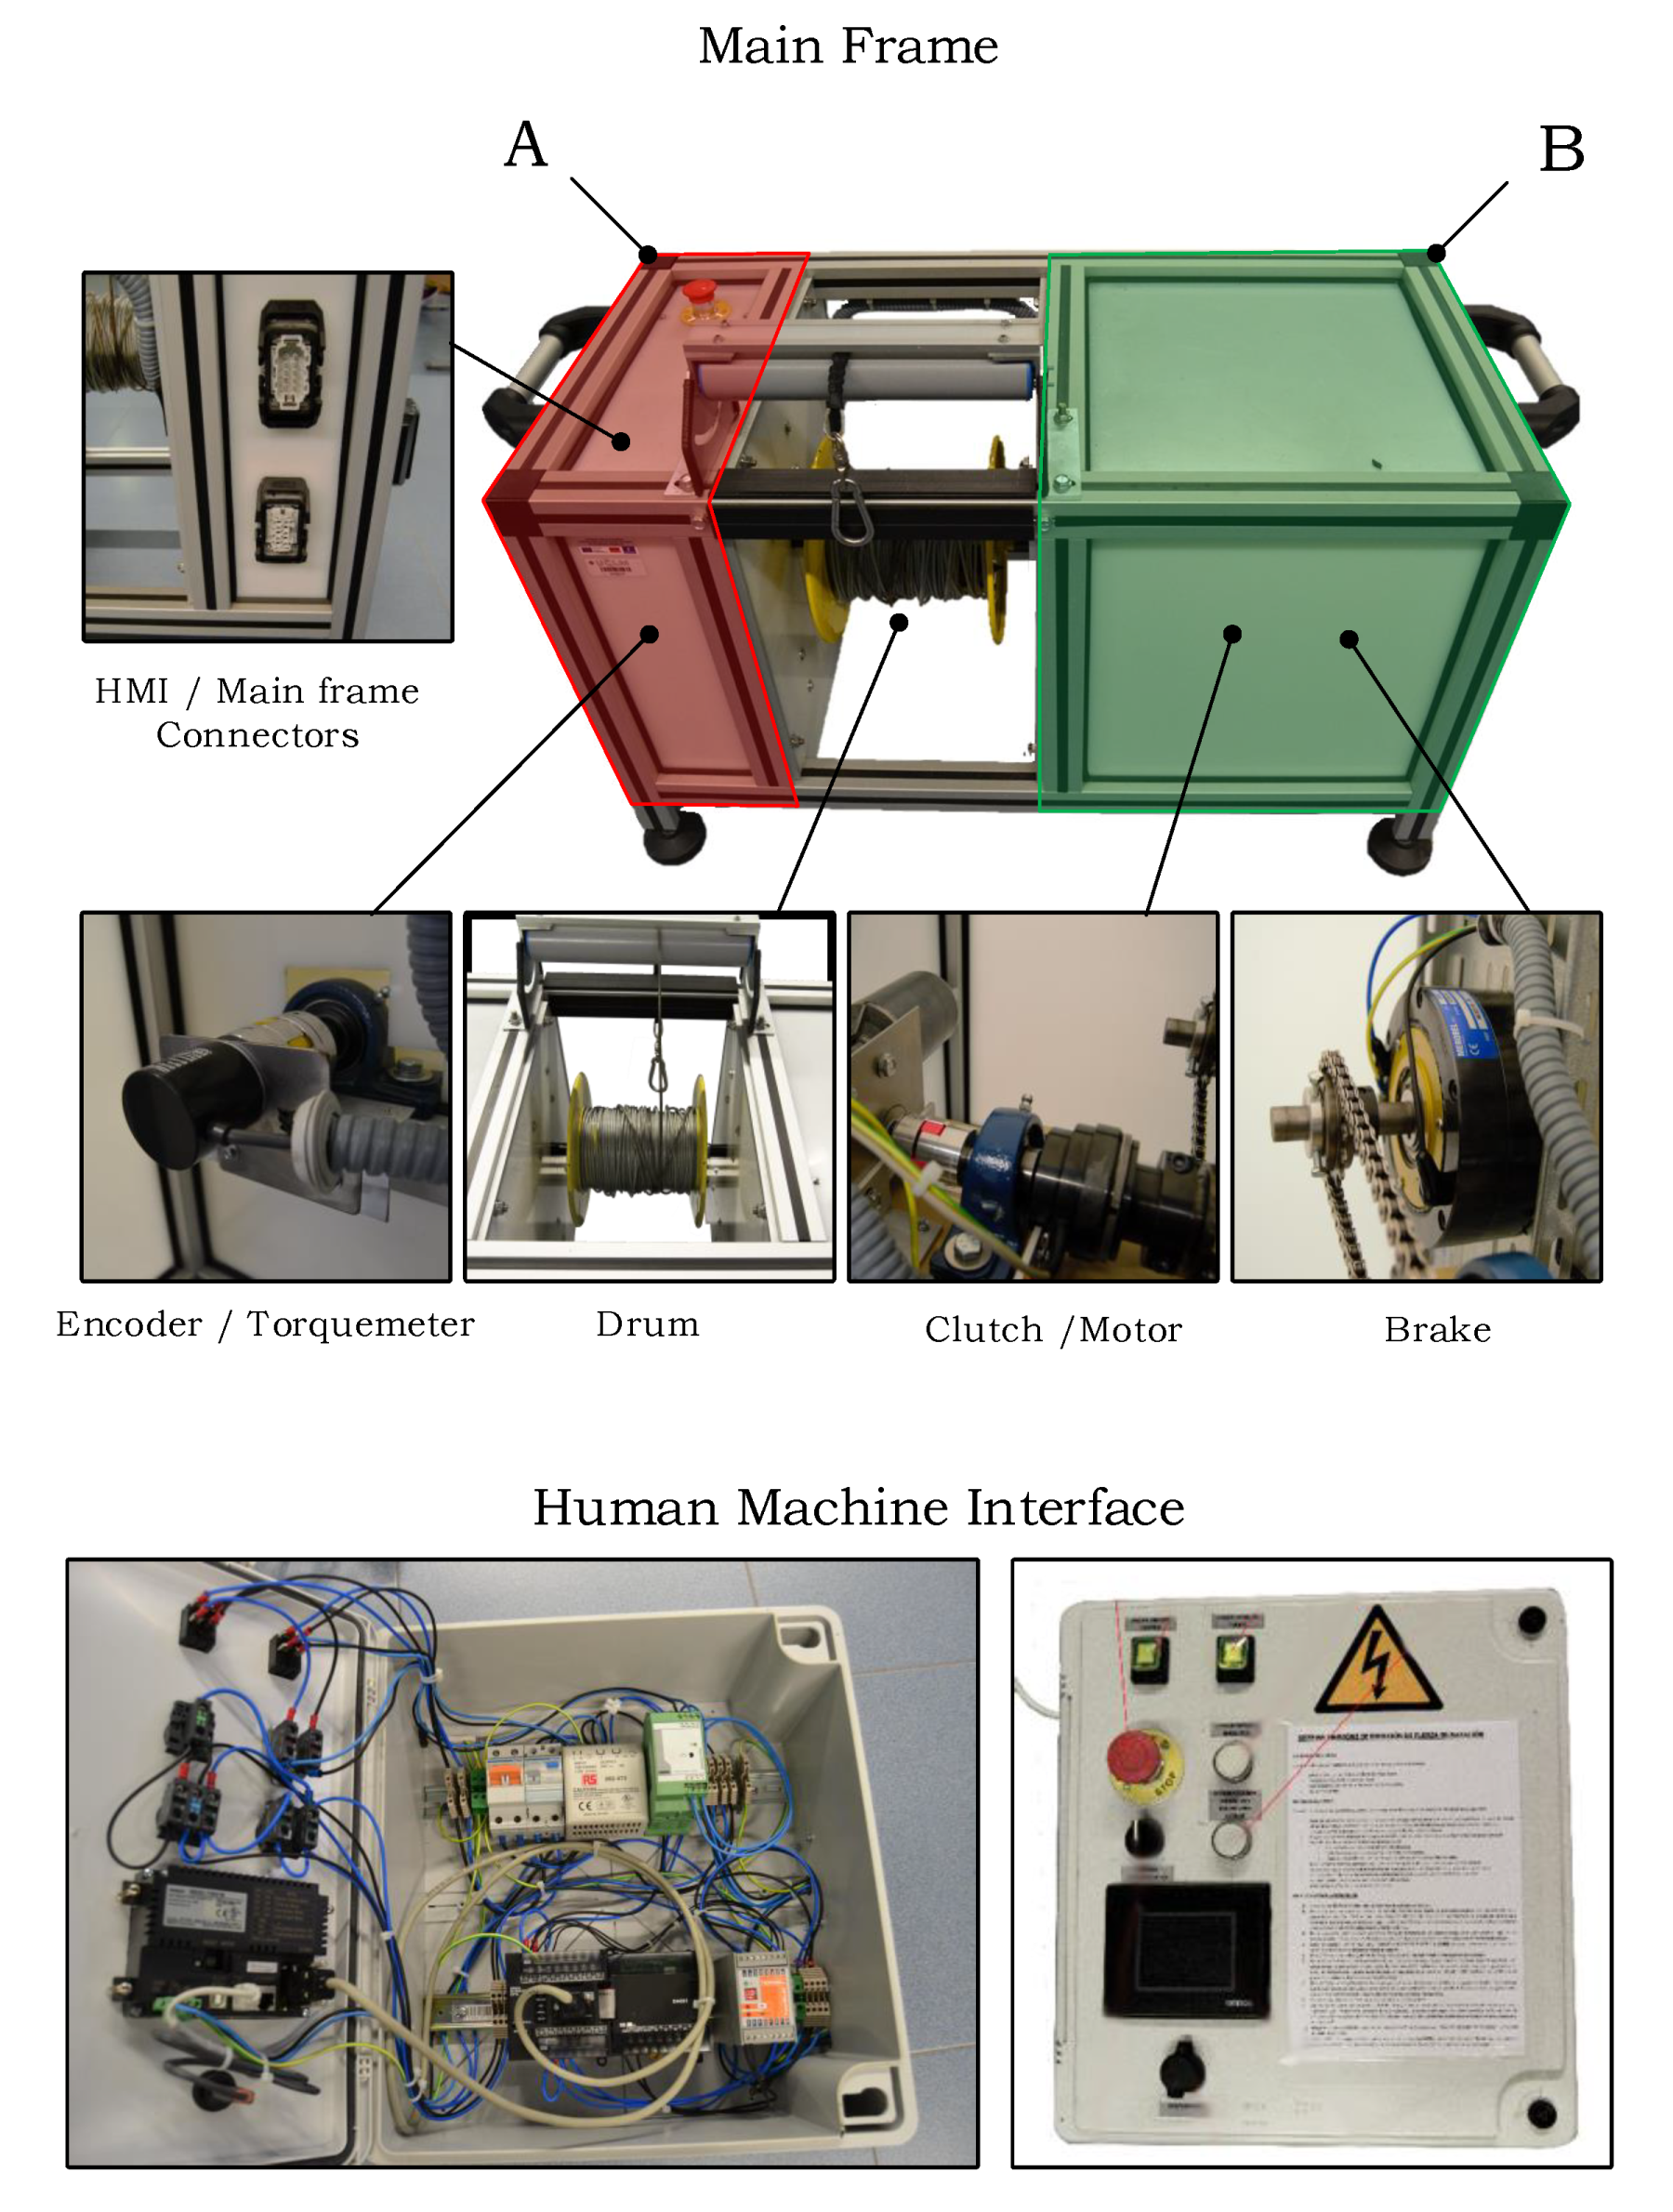
2.3. High Level Design
- Mechanical system. The mechanical system consists of the structure, cover case, and other mechanical elementary elements. This system includes a drum to roll in and out a cable that can be attached to the swimmer.
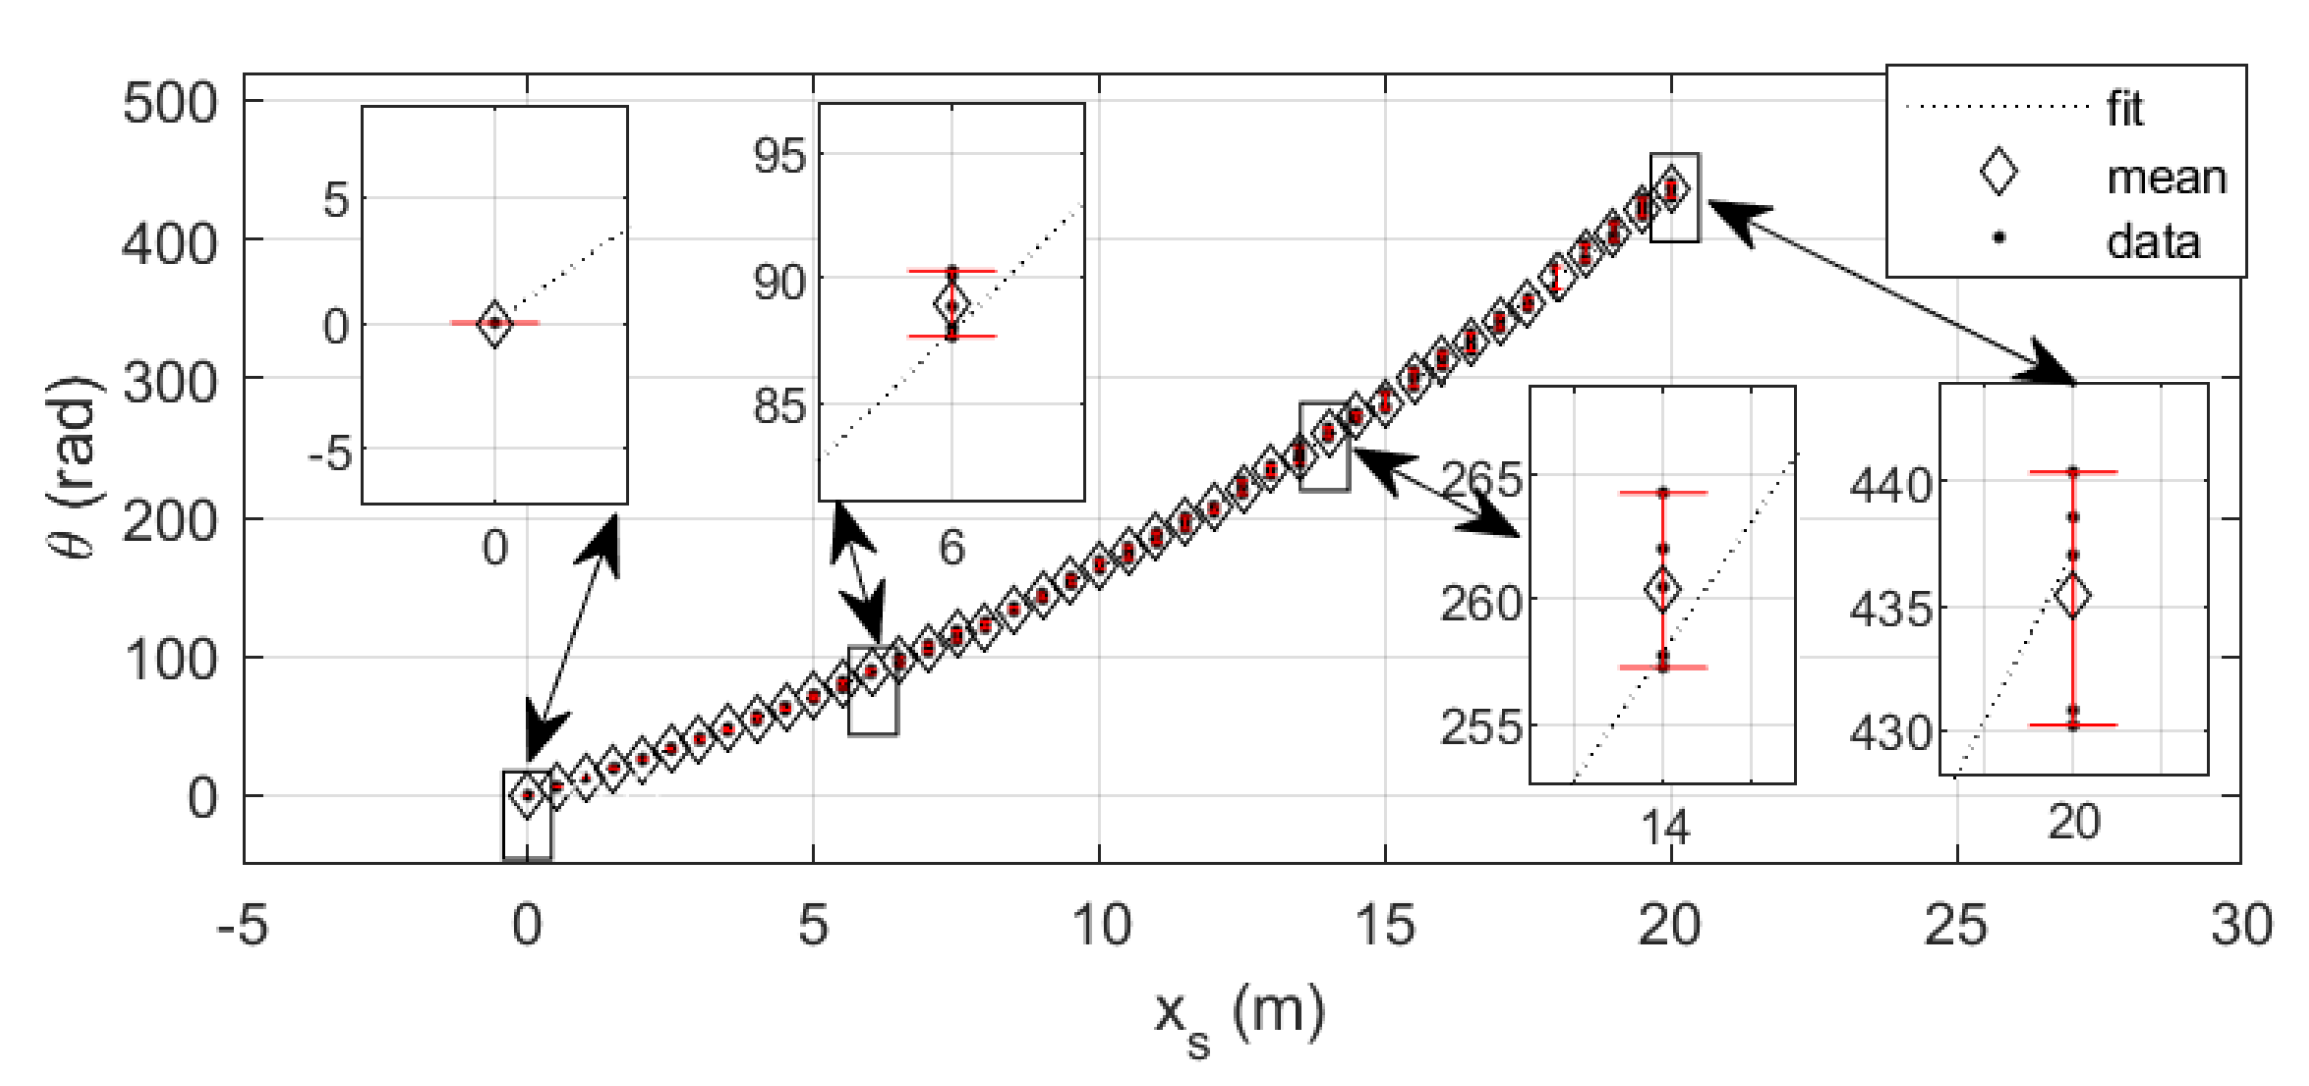
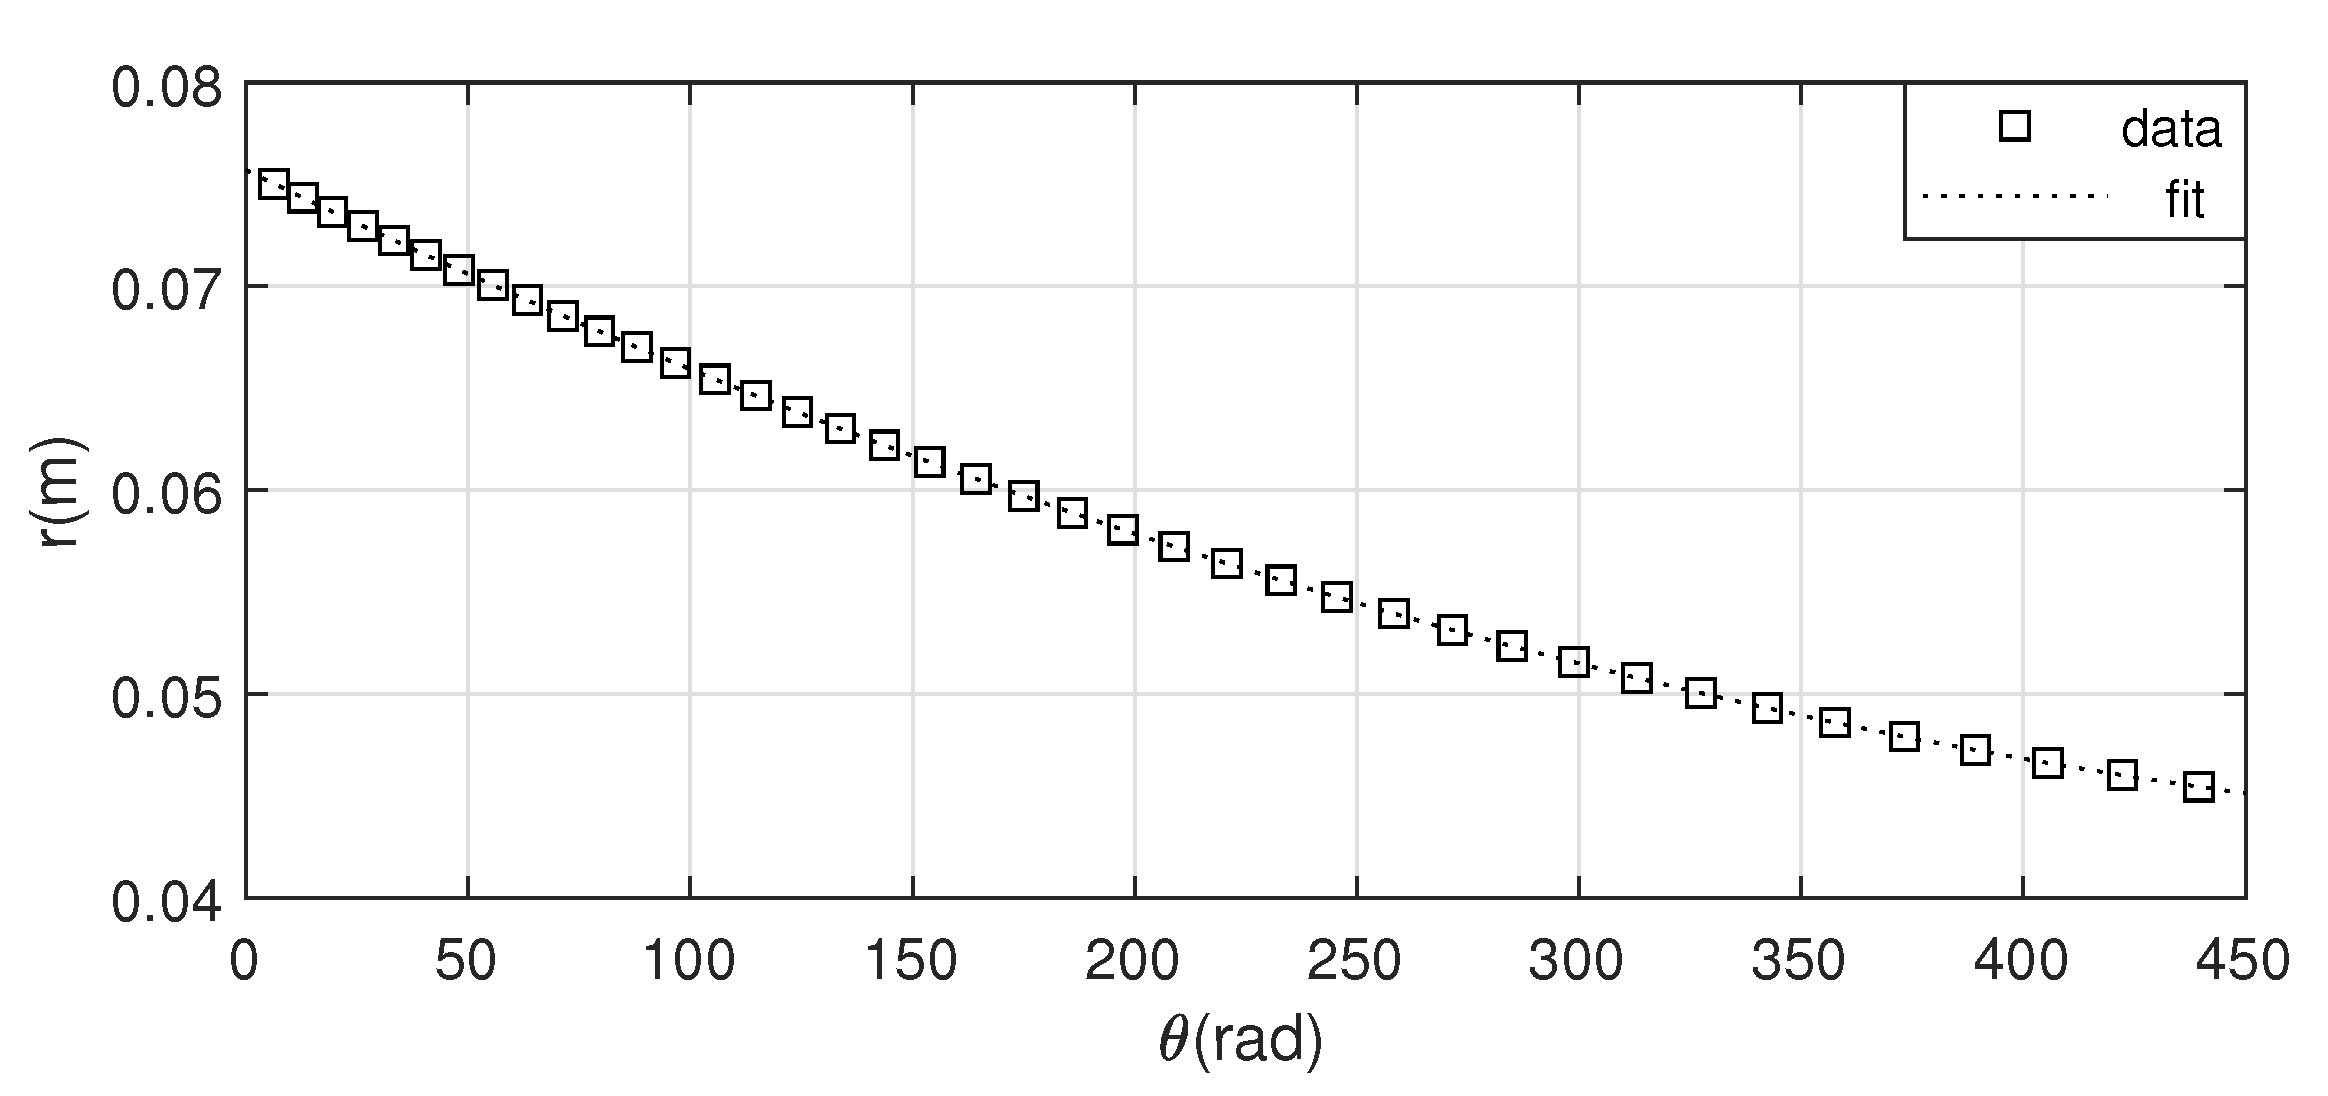
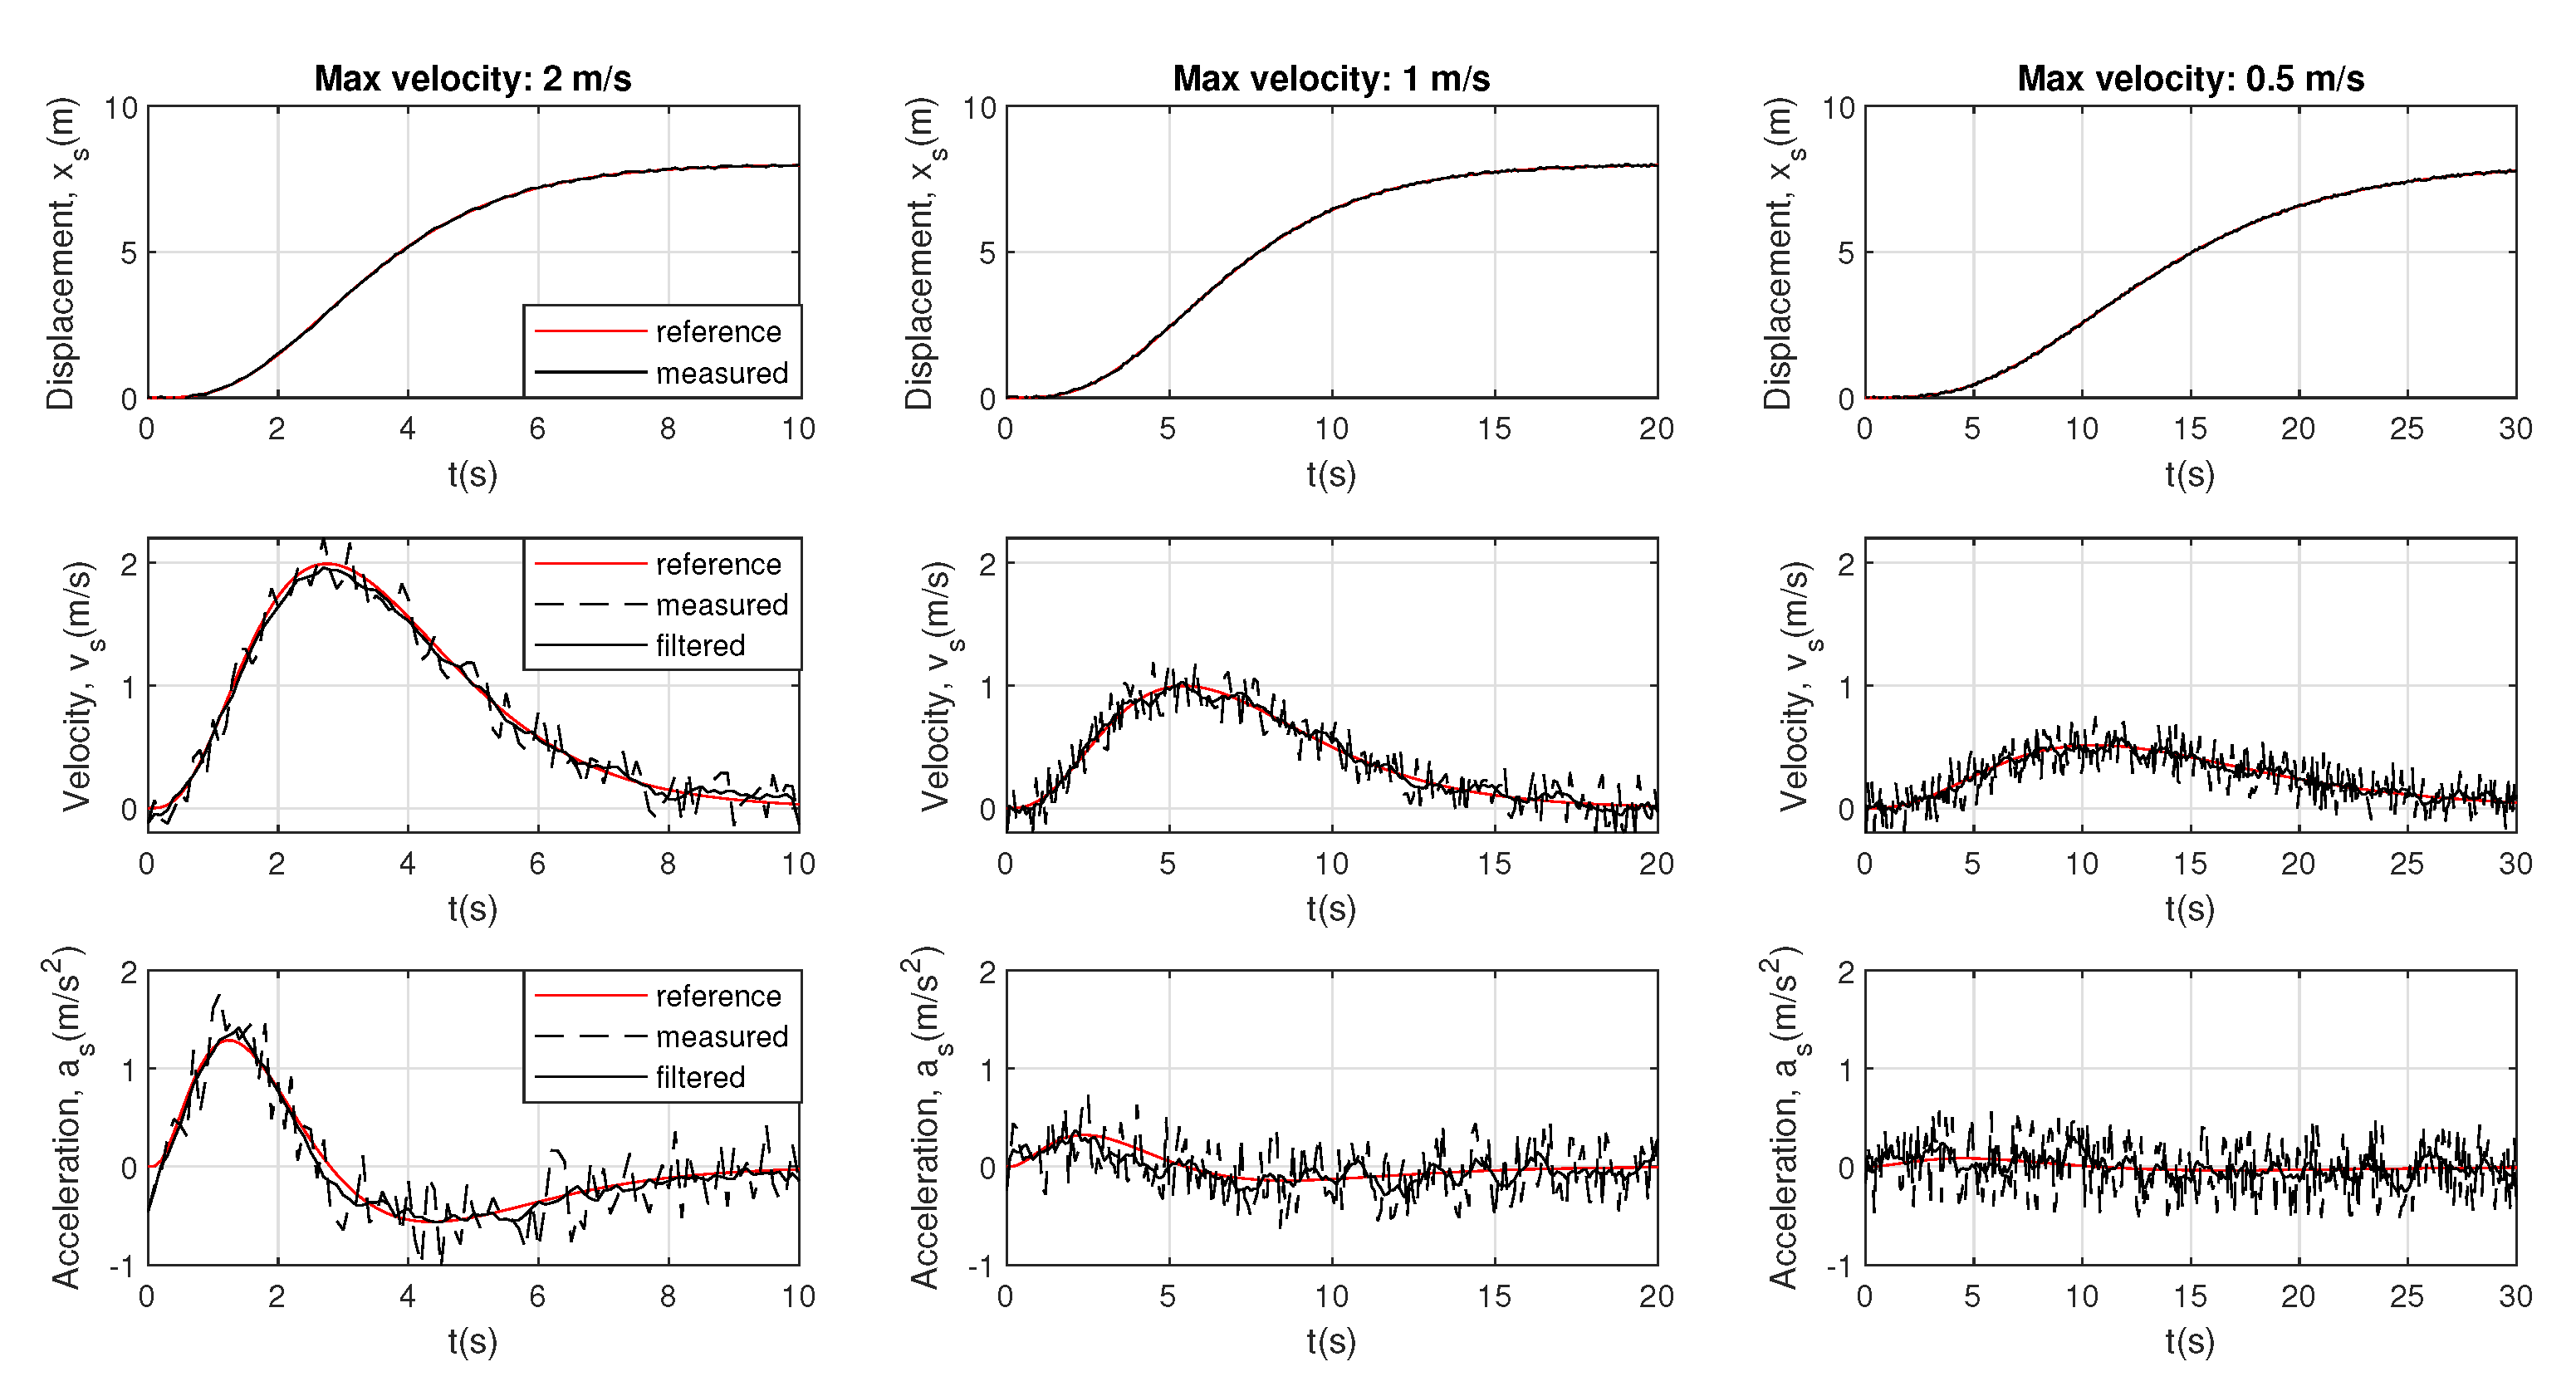
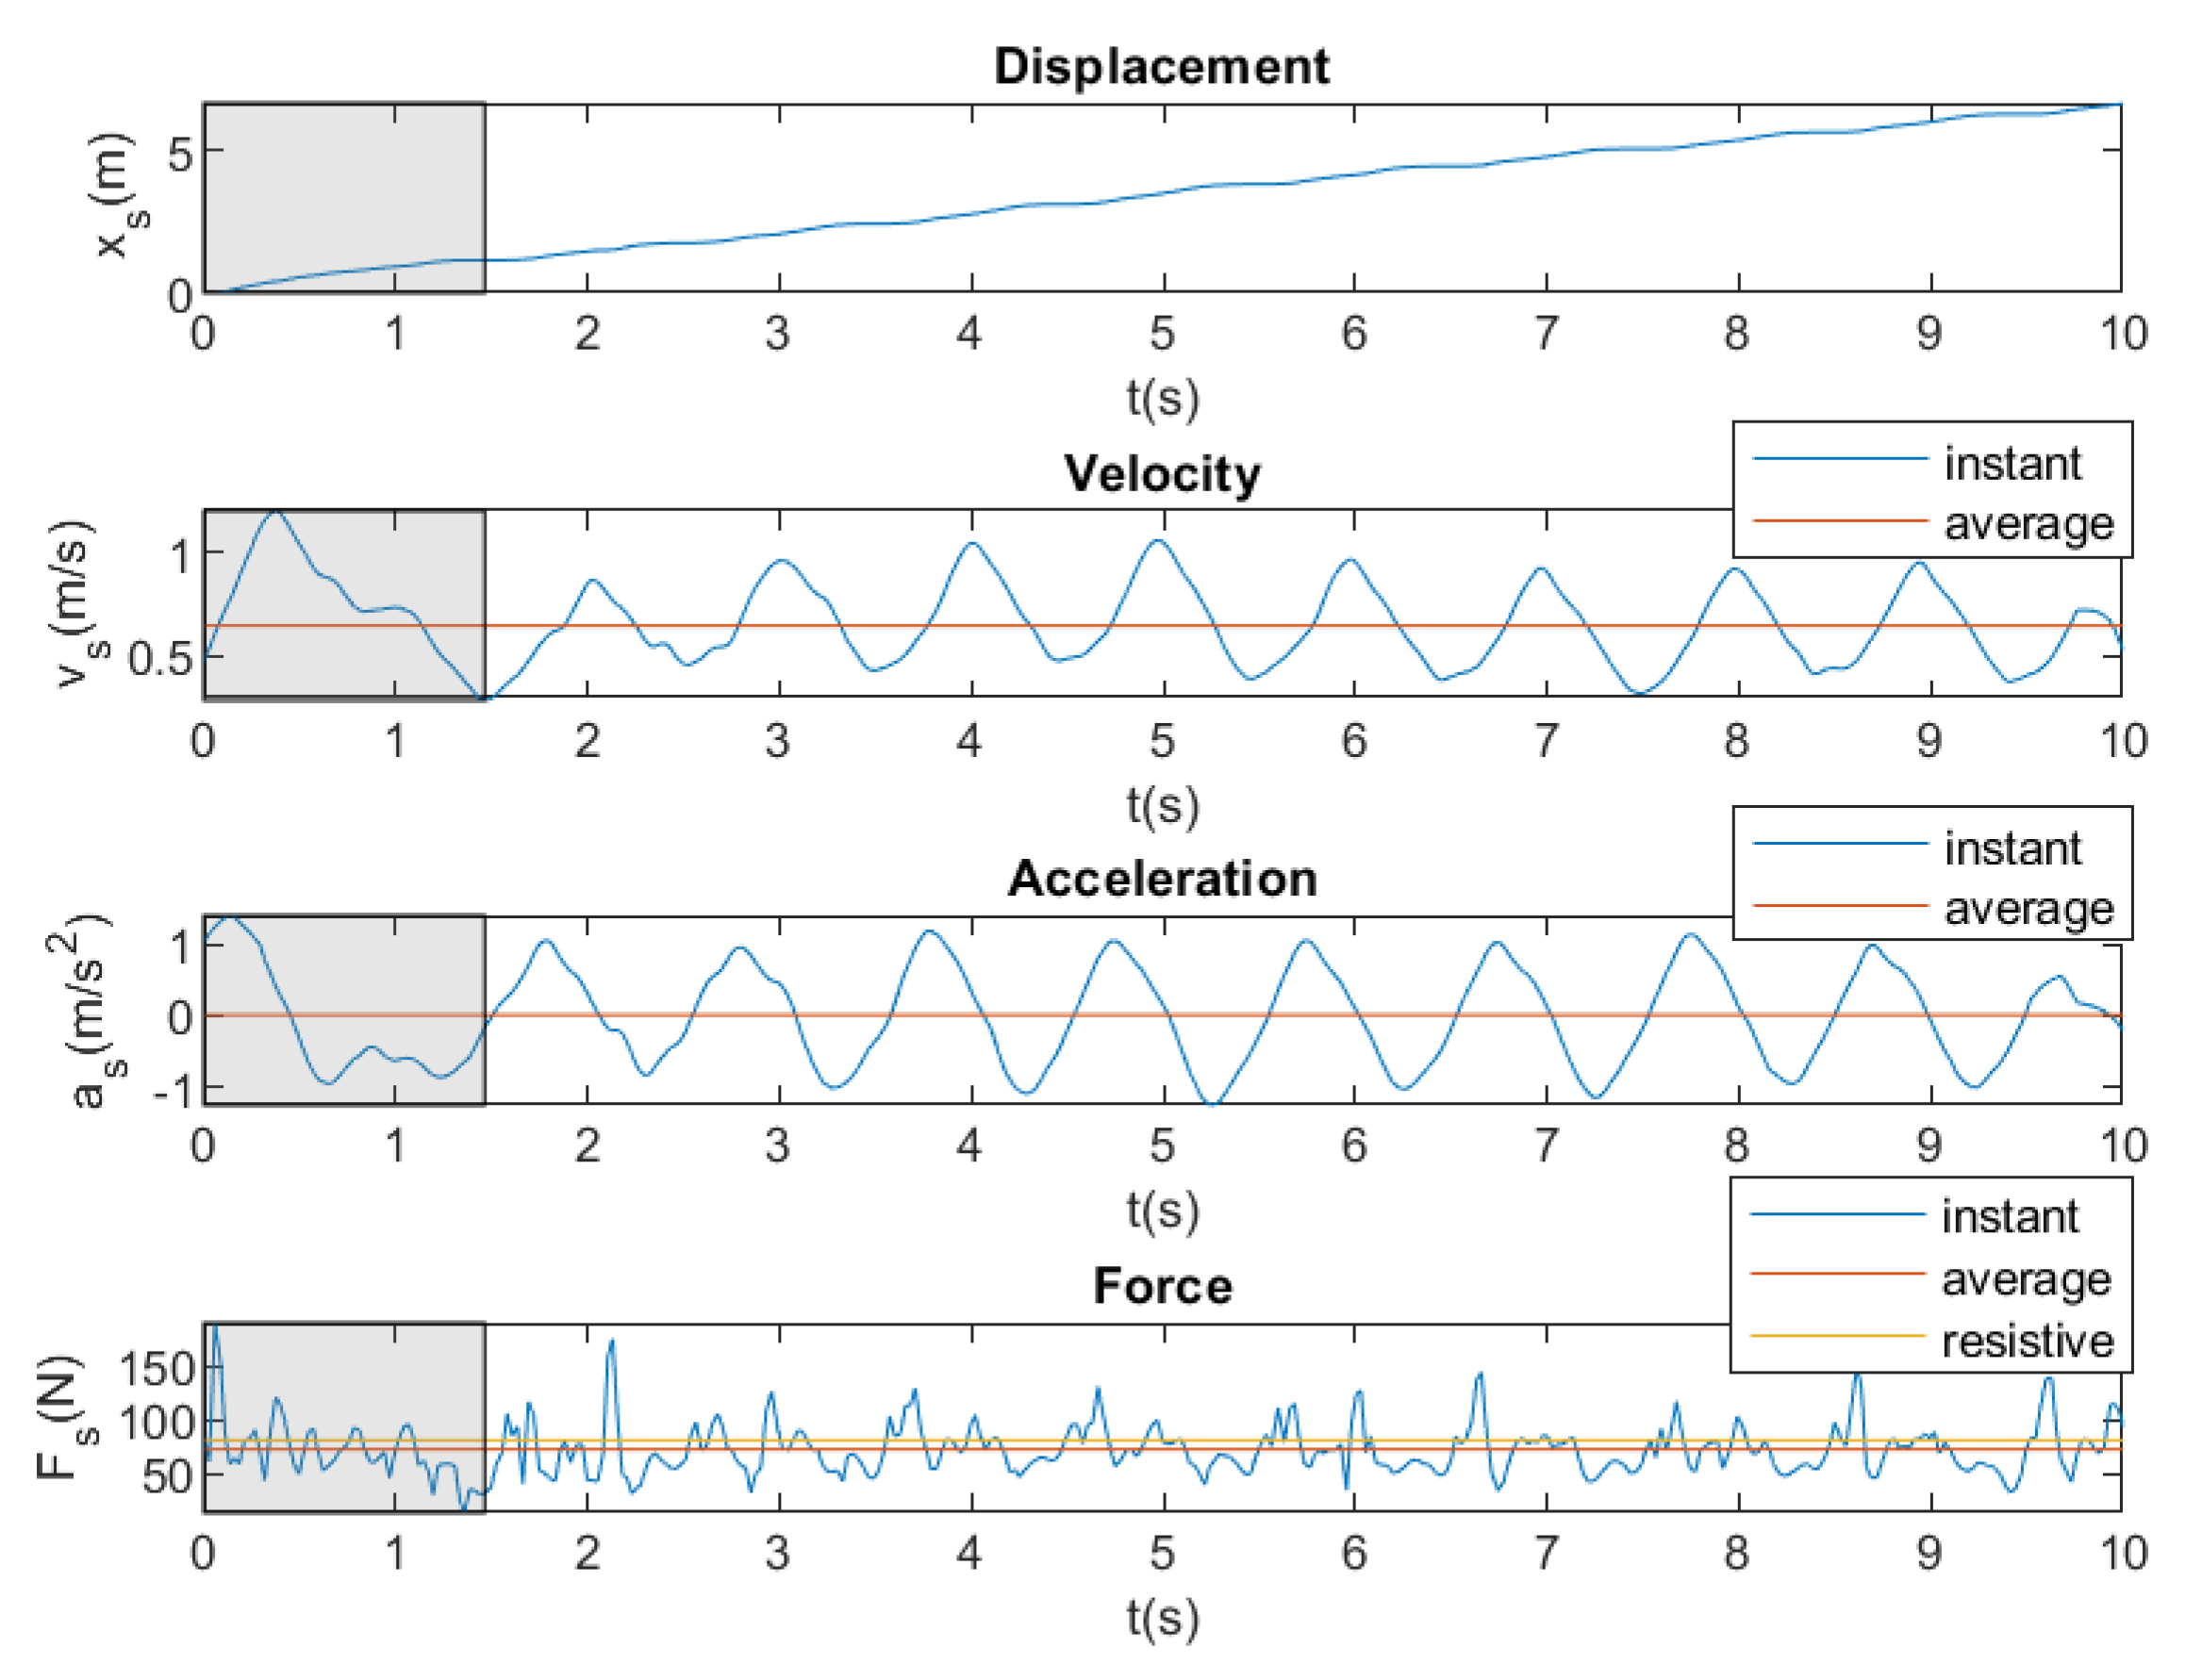
- Sensor system. This system should measure all of the required variables for estimating the instantaneous power of swimming (see Section 2.2). In this sense, a rotatory encoder has been selected to measure the angular position of the drum, . The instantaneous displacement swimmer can, therefore, be estimated by , with r being the effective radius of the drum, which depends of the quantity of cable rolled in the drum. The instant velocity, , and acceleration, , can be estimated by differentiation of the displacement.The rotatory encoder is a digital sensor and, consequently, the differentiation of includes non-desirable noise. A mobile mean filter has been implemented in order to remove the the noise in the estimation of and (see Section 3.2.1).This system also includes a torquemeter in order to estimate the instantaneous cable tension, .
- Actuation system. This system includes a DC motor to automated roll in or out the cable and a magnetic breaker to exert the configurable resistant force.
- Control system. The control system is a PLC (Programmable Logic Controller), which obtains the information of the sensors and command the behaviour of the actuation system. The sample time for registering (inputs) or commanding (outputs) the signal has been set to 20 ms.
- Human–Machine Interface. This system allows for the final user to configure the experiments and obtain the experimental data.
- Power Supply. It provides the required power supply to the control system, sensors, and actuators.
2.4. Detailed Design
2.4.1. Overall Design
2.4.2. Actuator System
2.4.3. Sensor System
3. Validation and Results
3.1. Effective Radius of the Drum
3.2. Sensor System Validation
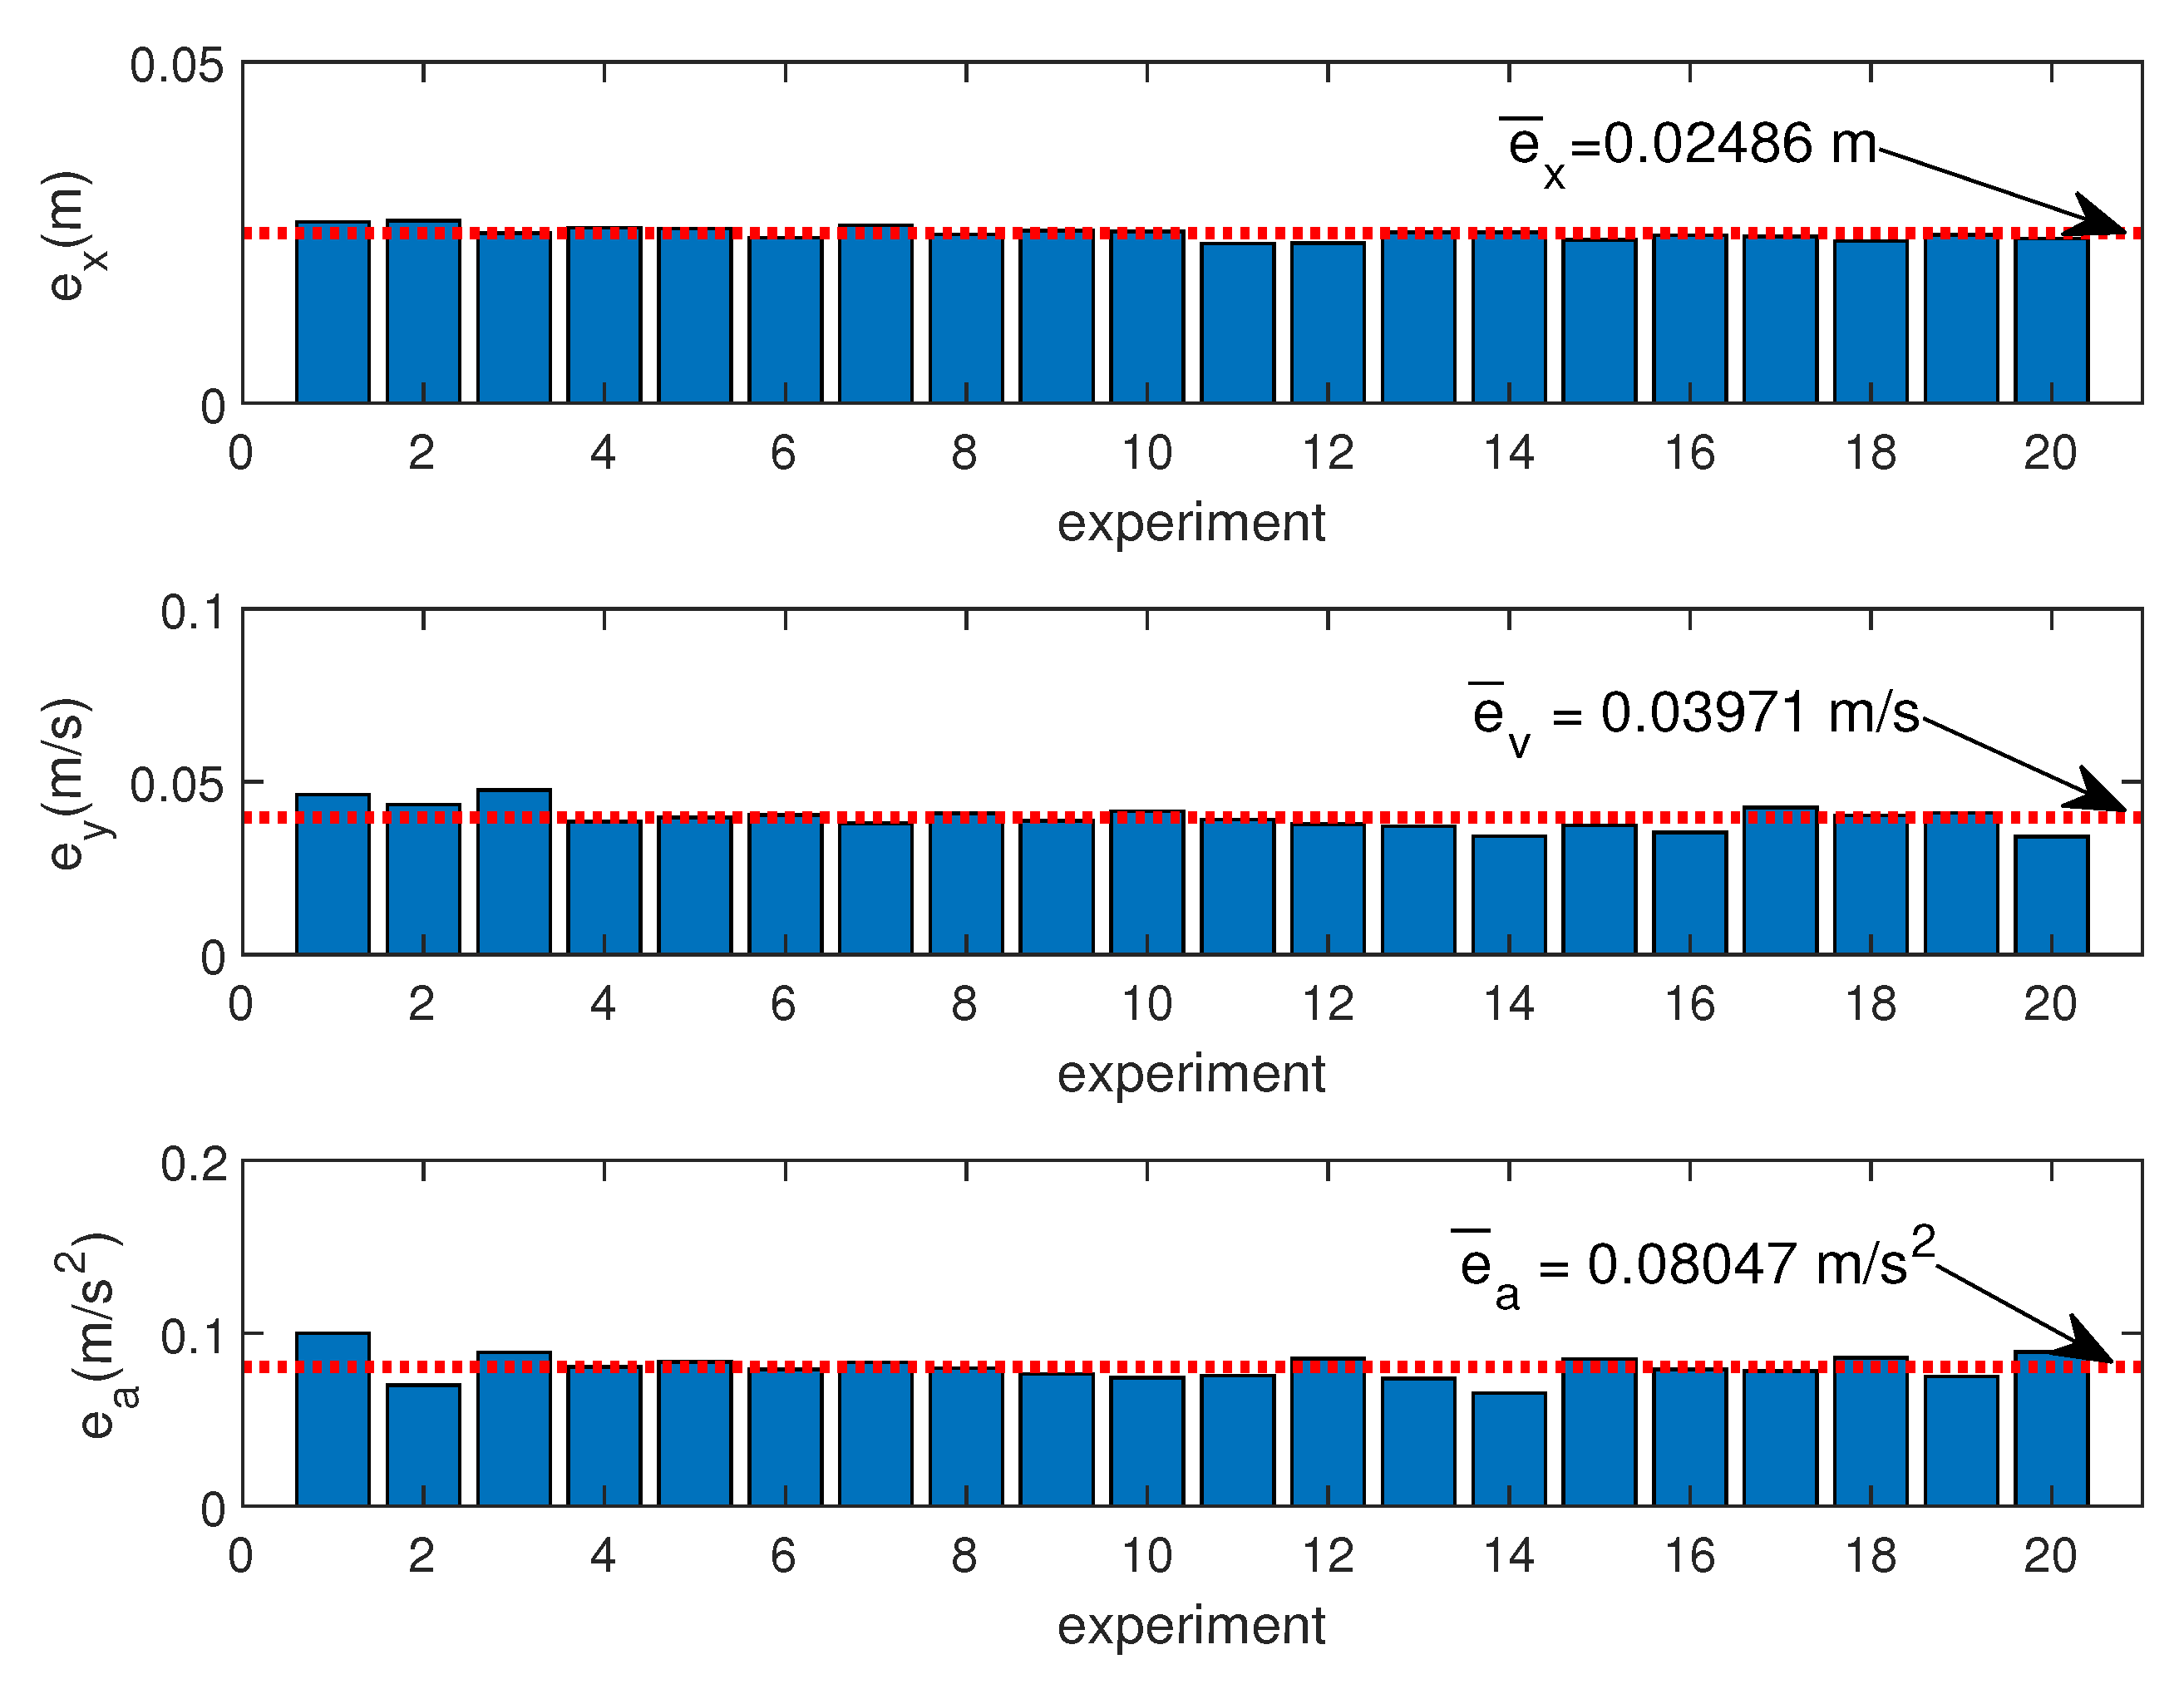
3.2.1. Displacement, Velocity and Acceleration
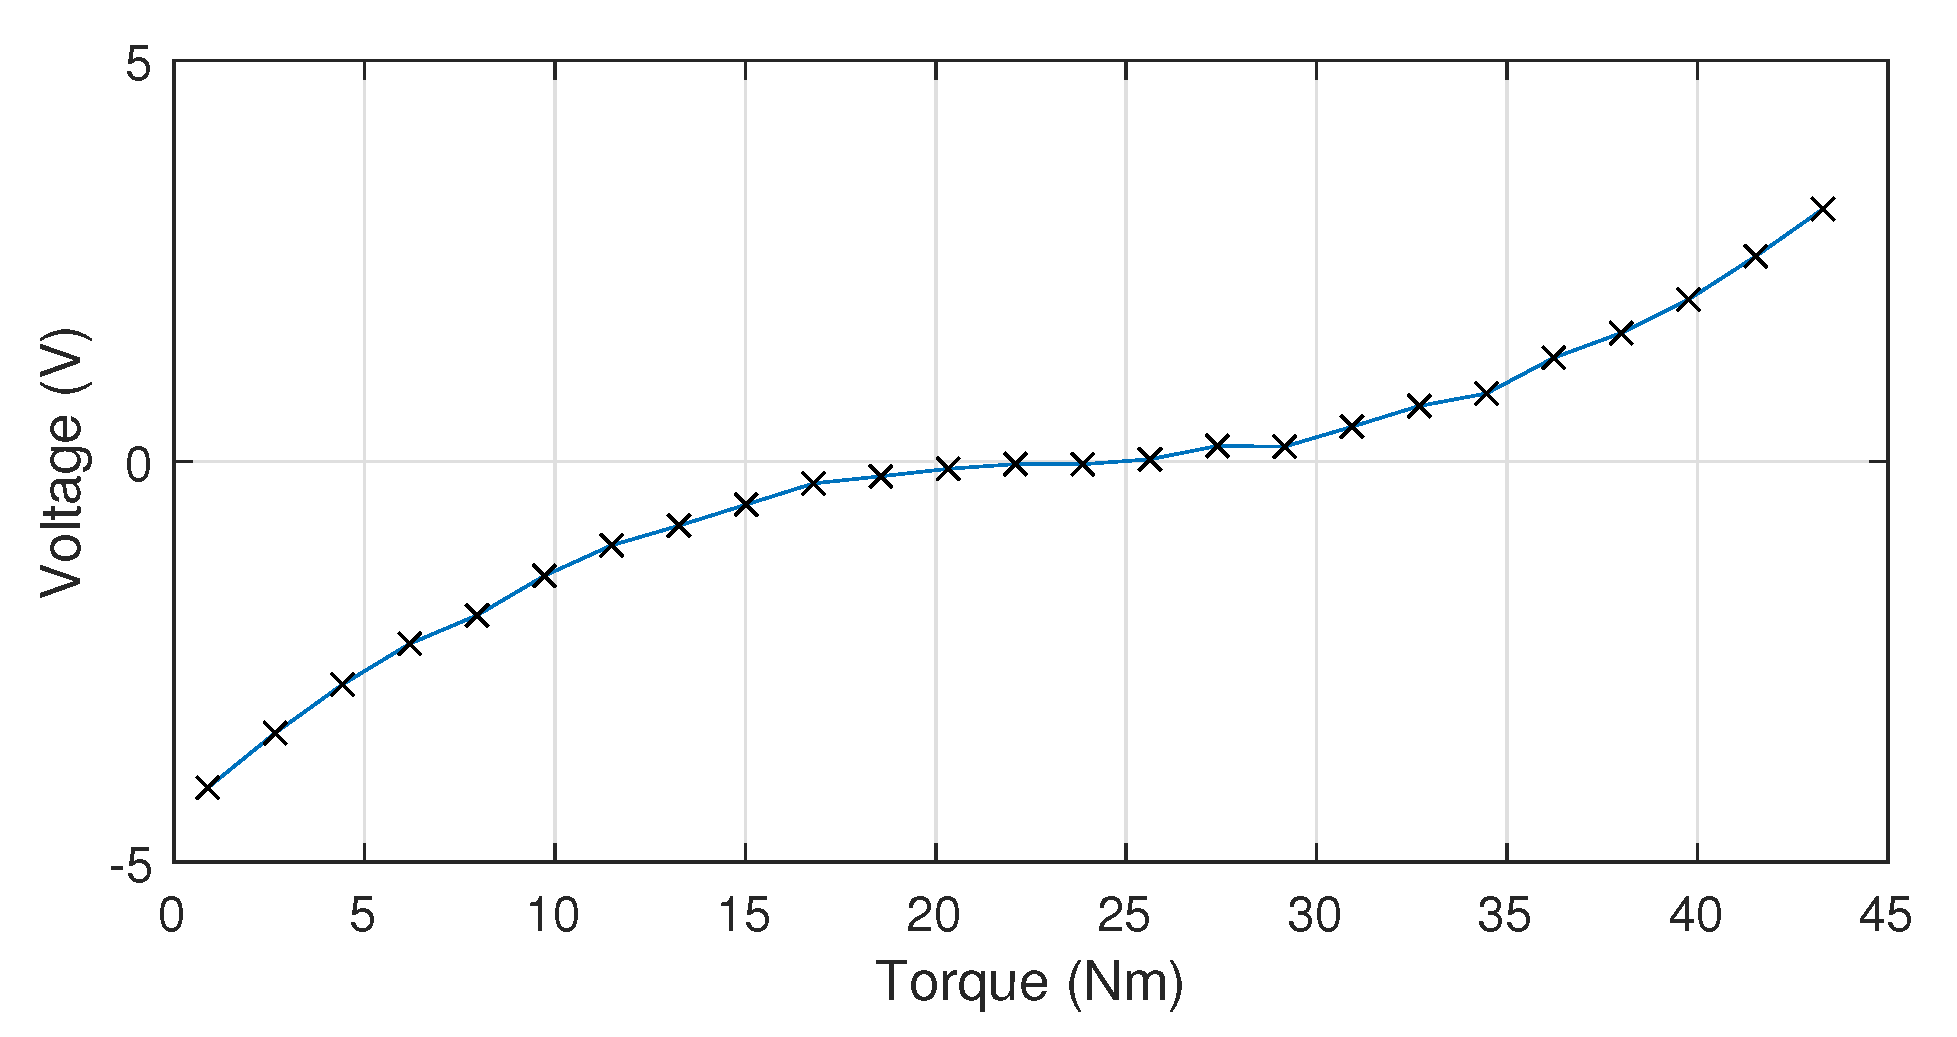
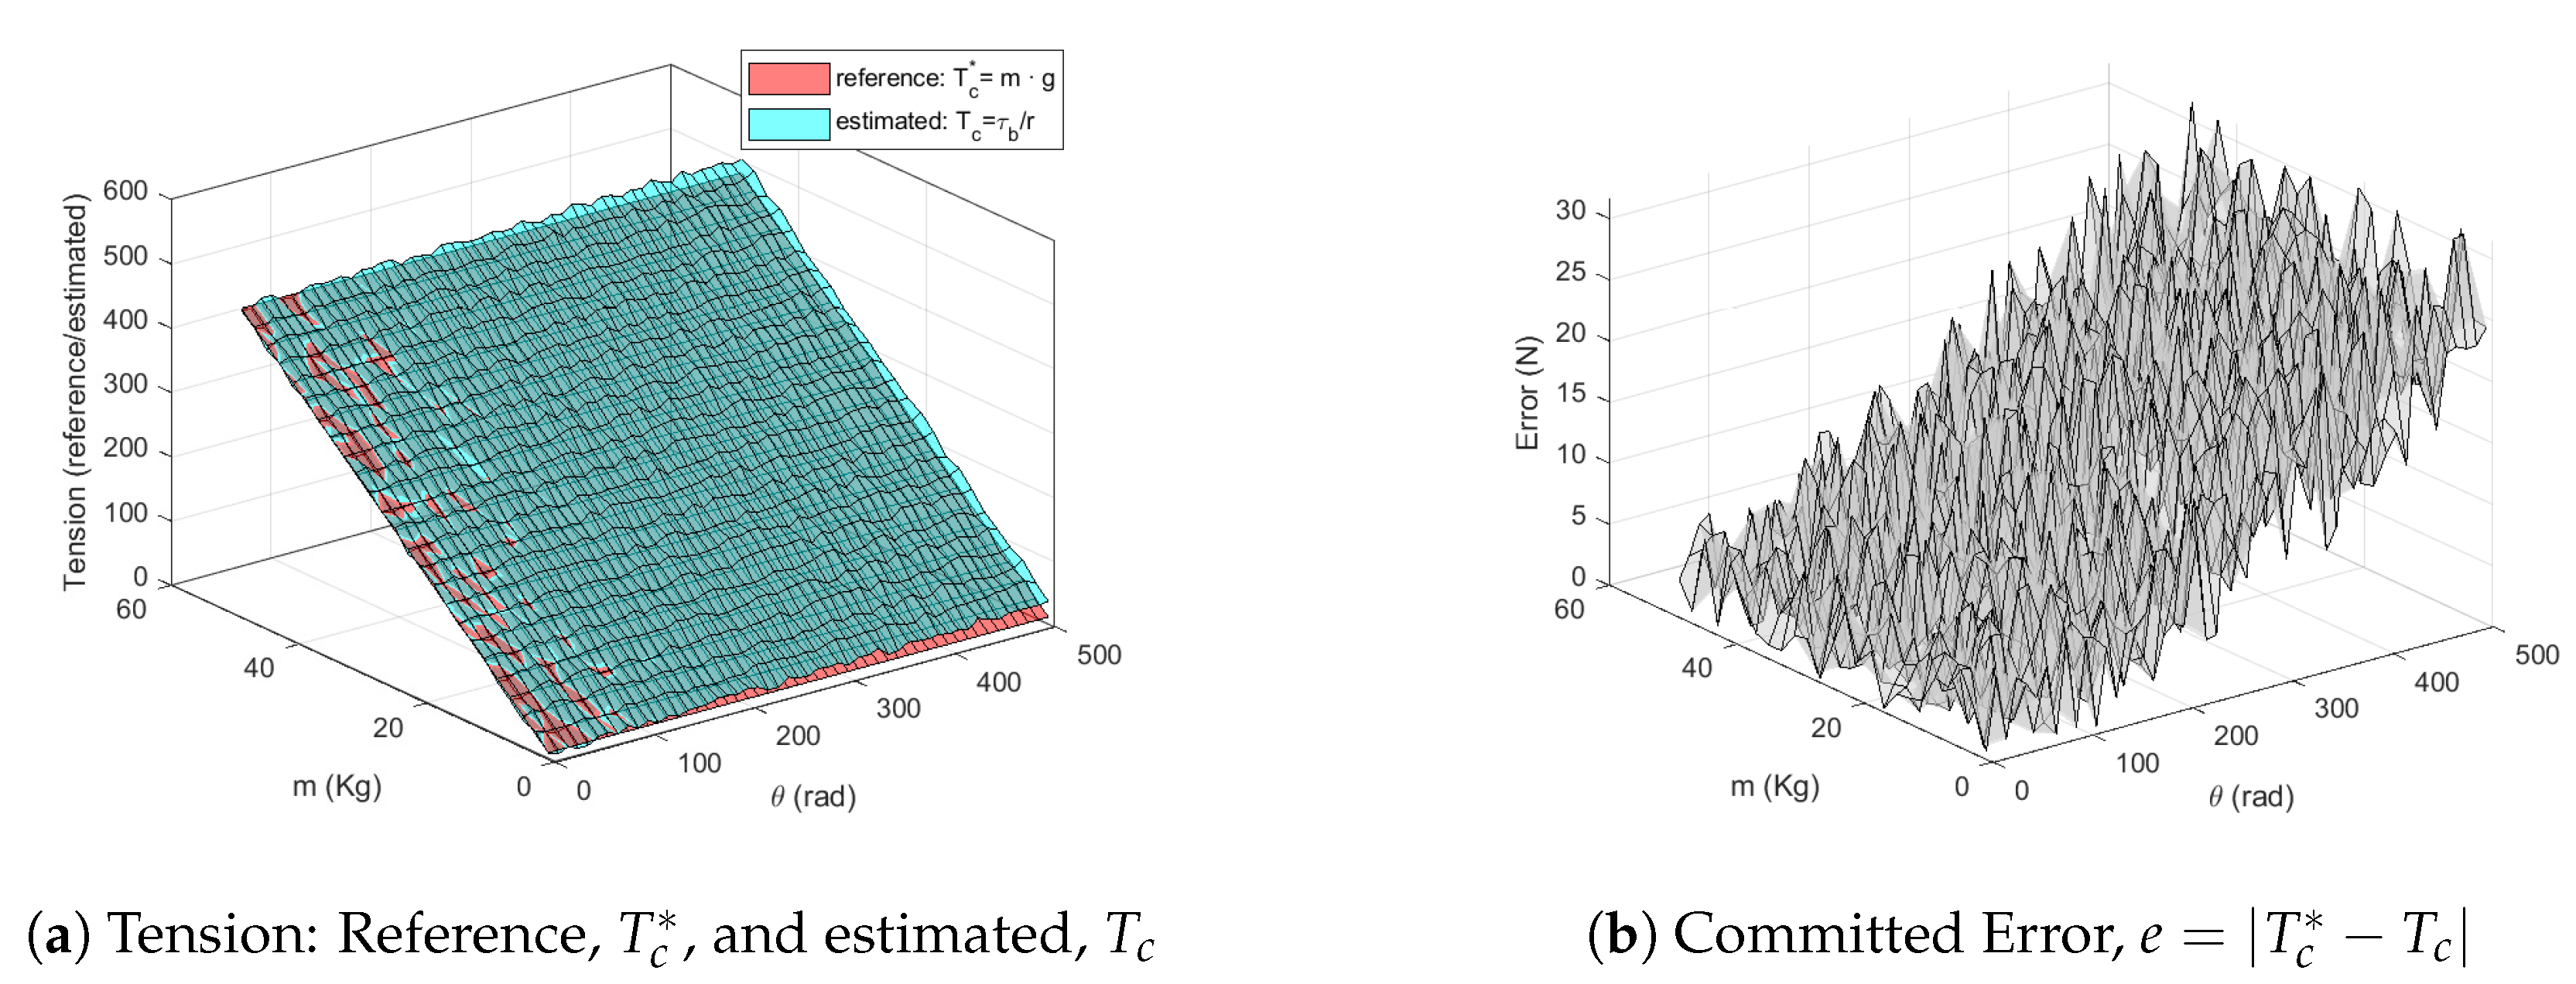
3.2.2. Cable Tension
- The effective radius of the pulley, r, is determined by (9).
- A set of known mass ( Kg) is connected to the drum in vertical position.
- The cable tension is estimated by means of and compared with the reference tension that should be .
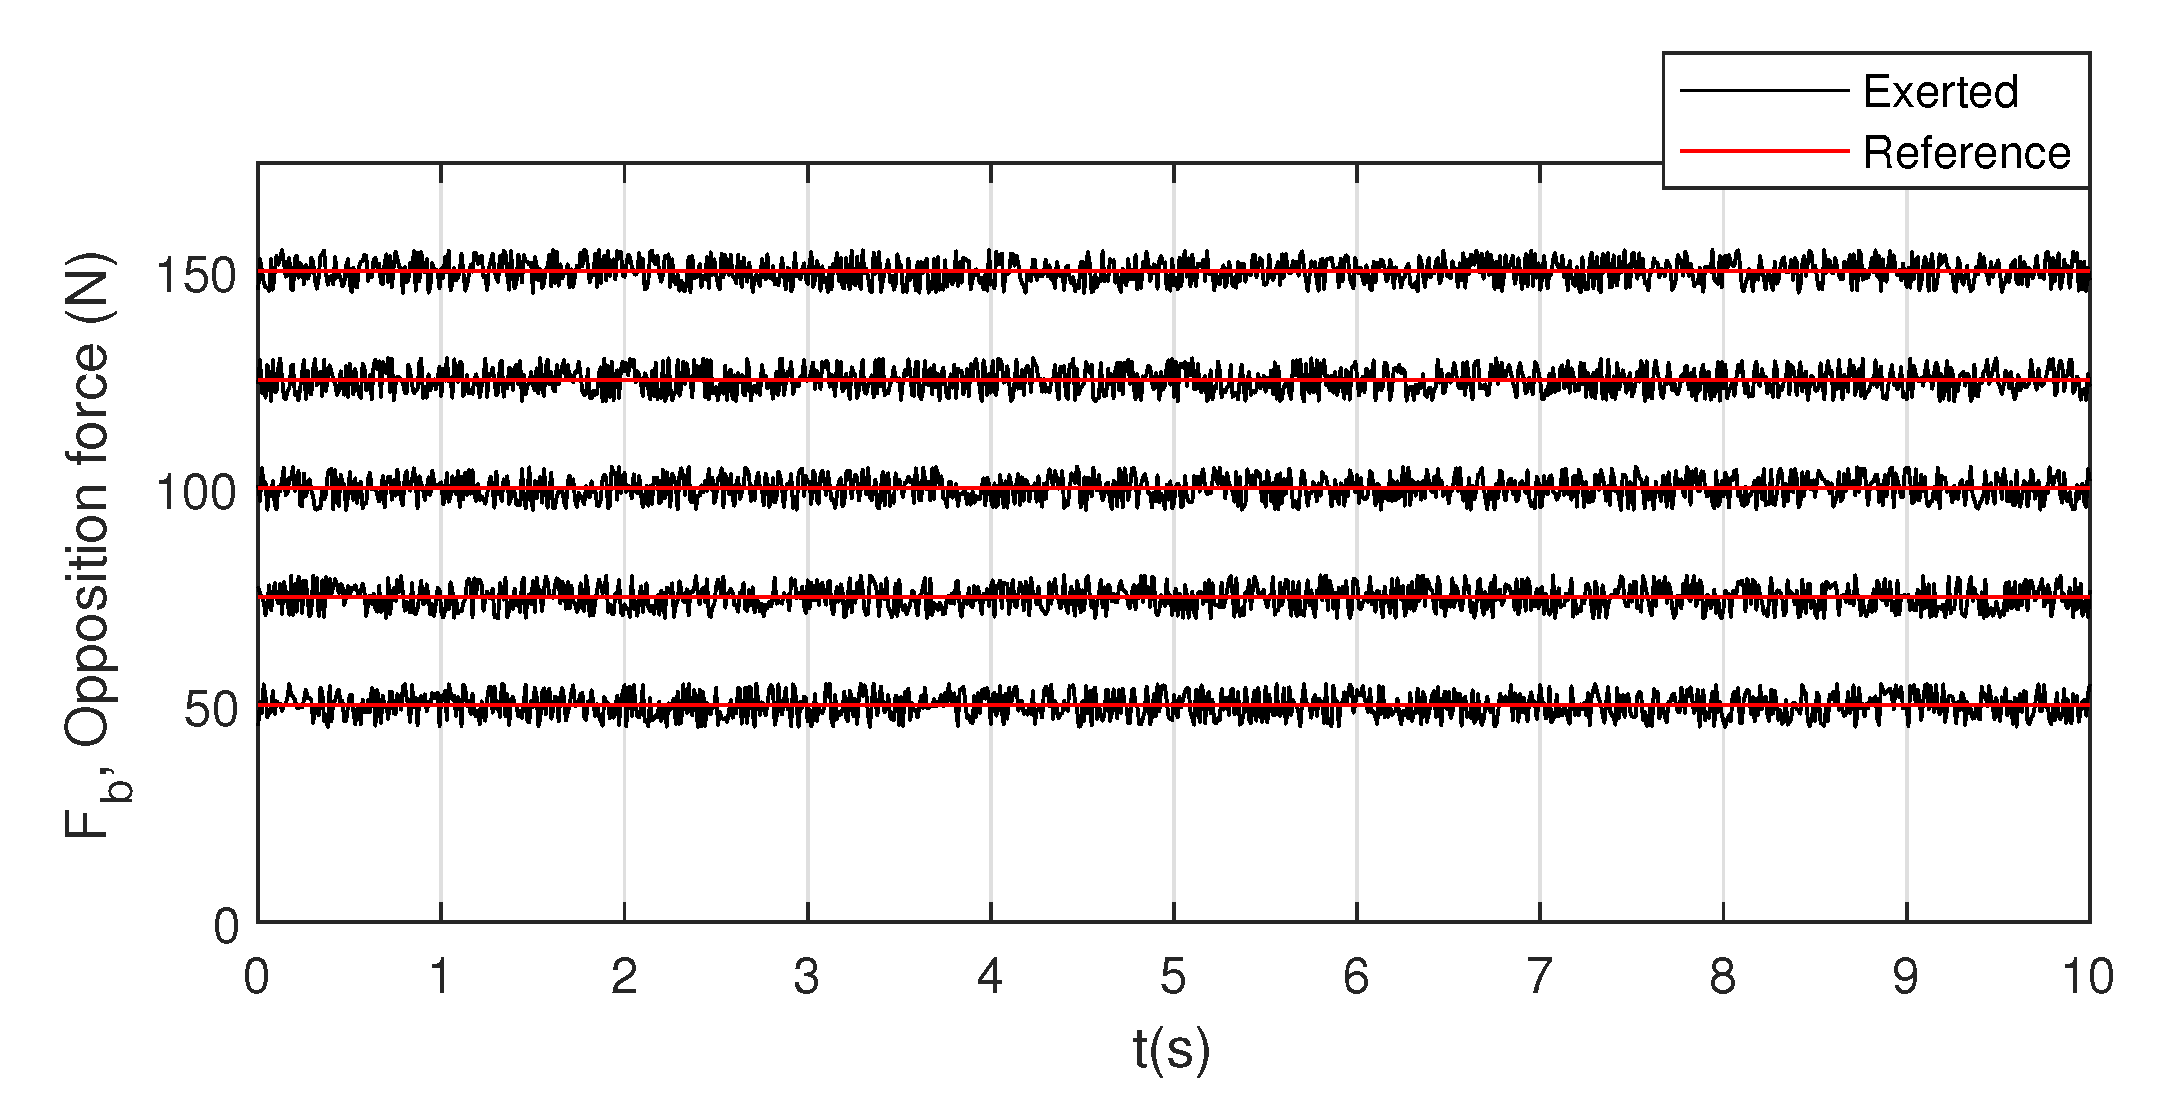
3.3. Actuator System Validation
3.4. Experimental Protocol
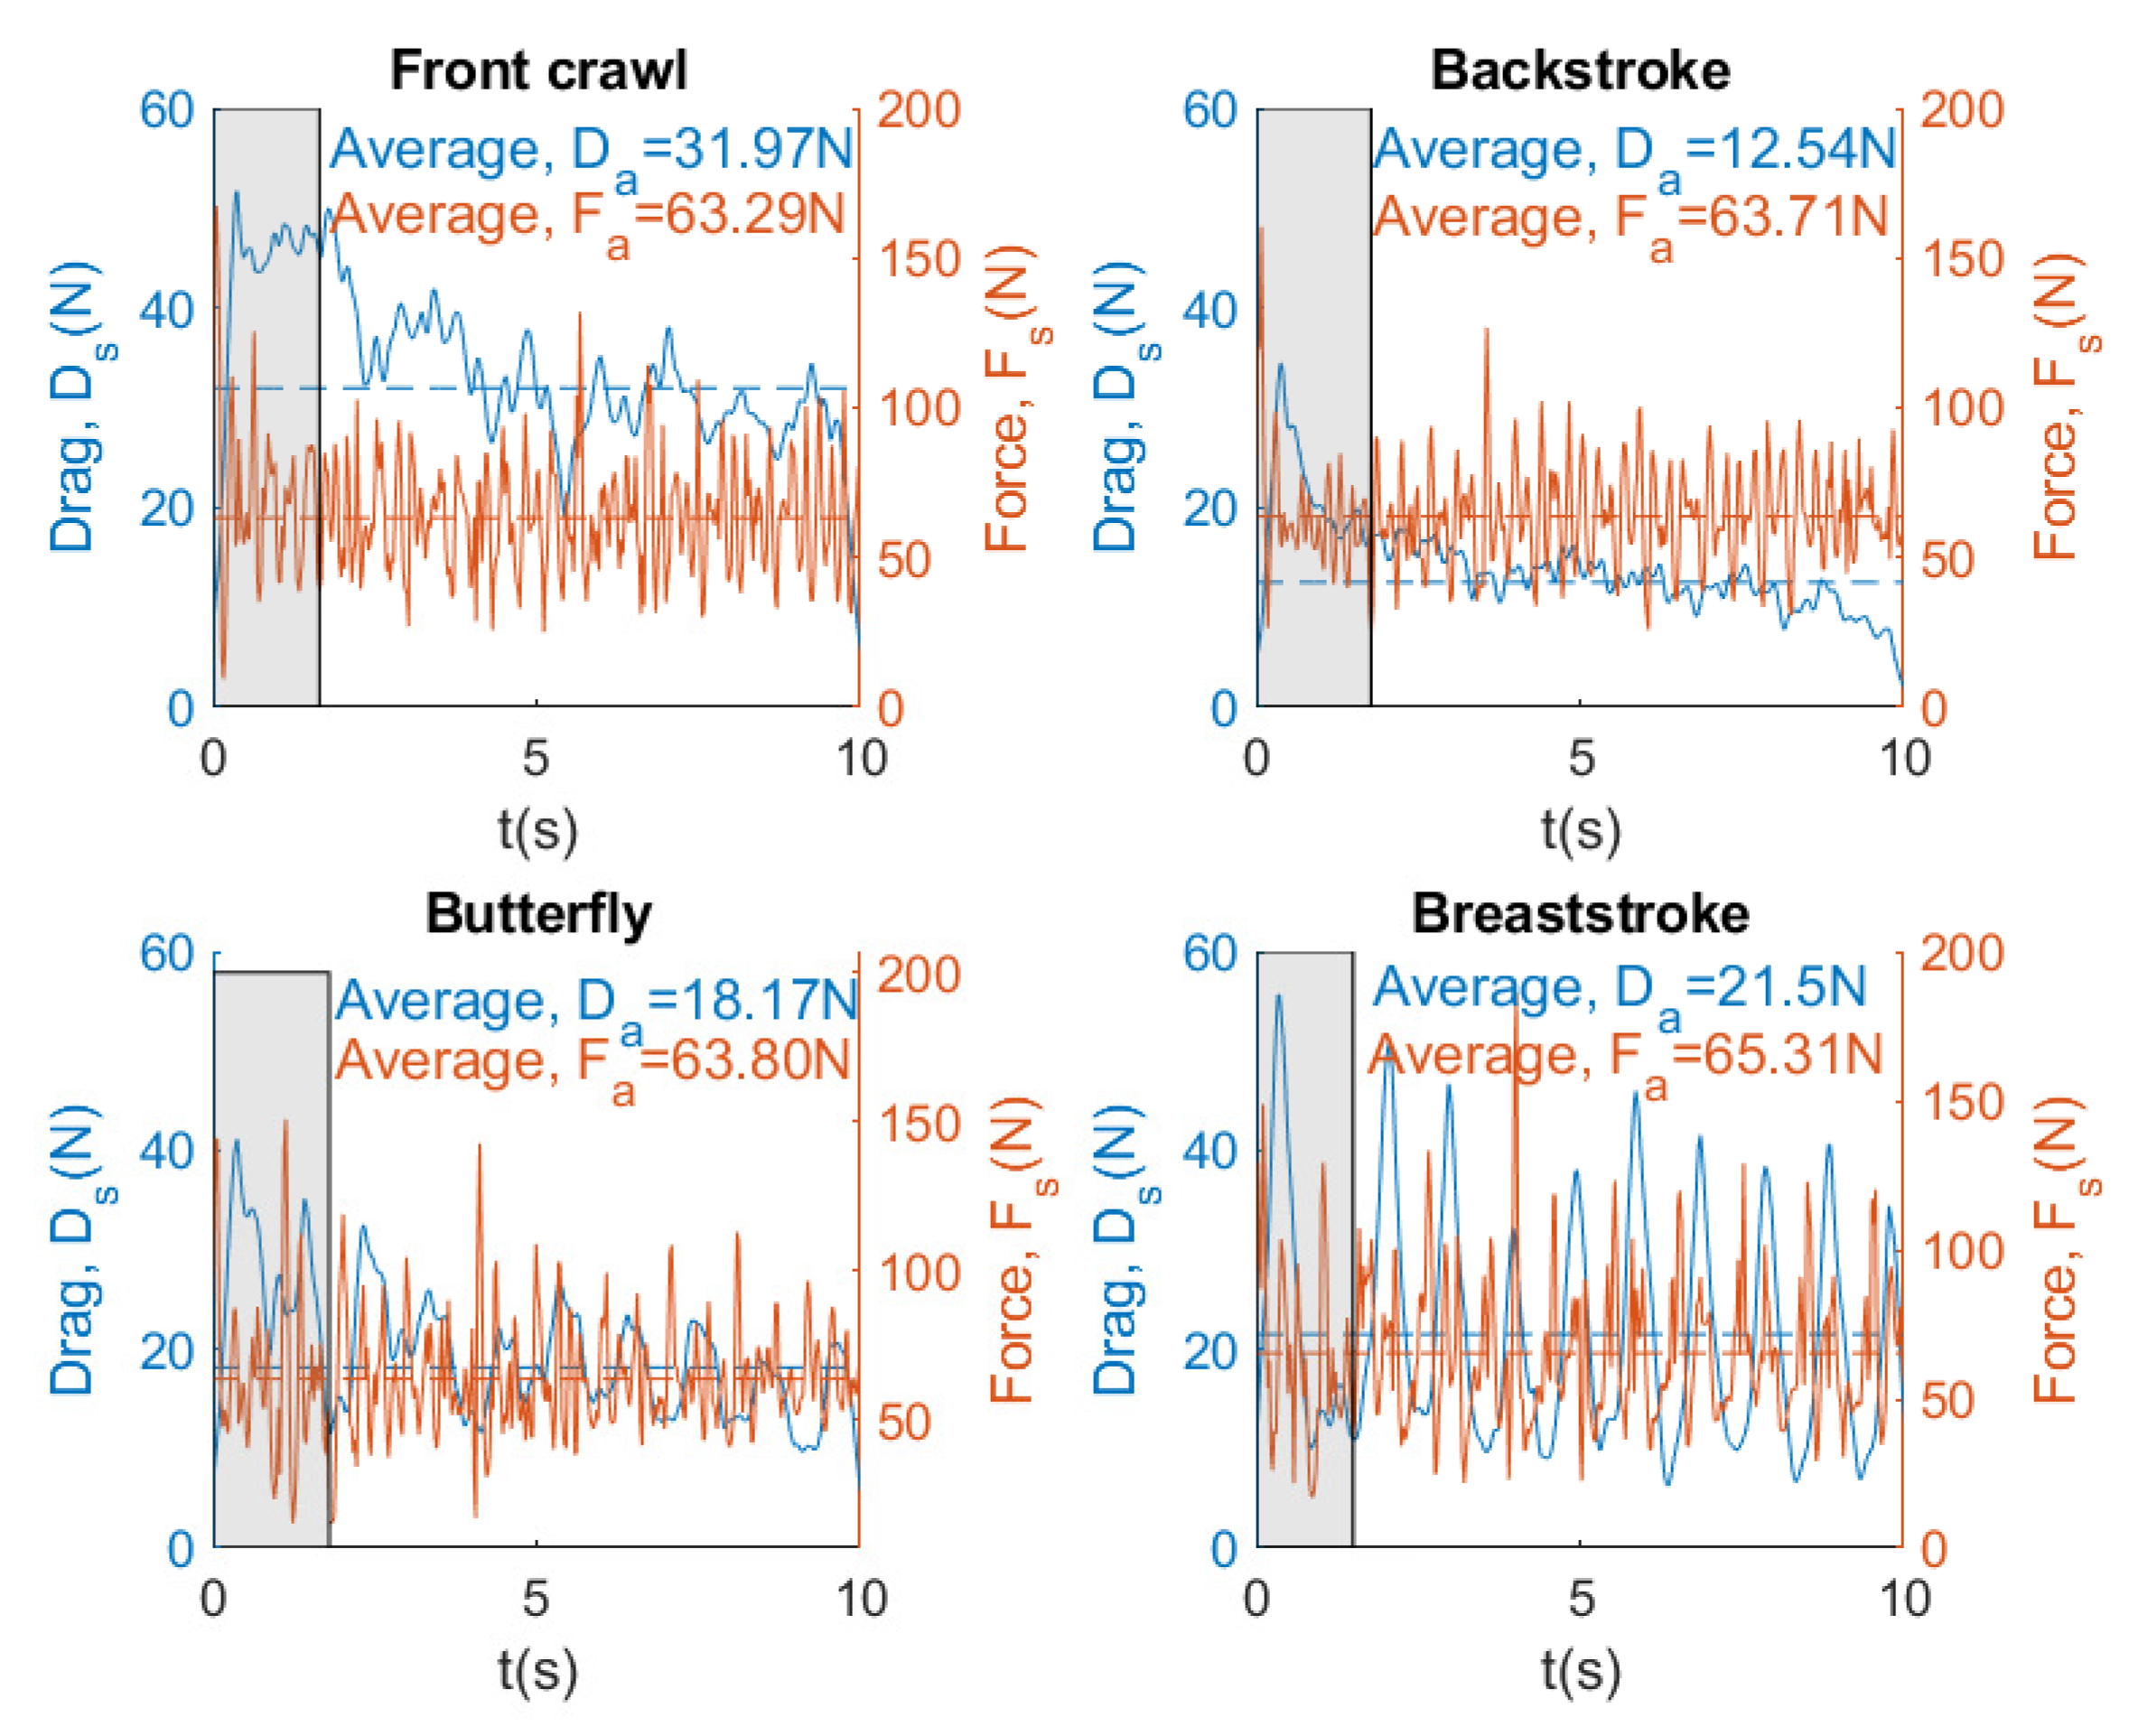
3.5. Results
4. Results Discussion
5. Conclusions
Author Contributions
Funding
Acknowledgments
Conflicts of Interest
References
- Bradshaw, A.; Hoyle, J. Correlation between sprinting and dry land power. J. Swim. Res. 1993, 9, 15–18. [Google Scholar]
- Hawley, J.A.; Williams, M.; Vickovic, M.; Handcock, P. Muscle power predicts freestyle swimming performance. Br. J. Sport. Med. 1992, 26, 151–155. [Google Scholar] [CrossRef] [PubMed] [Green Version]
- Lanotte, N.; Annino, G.; Bifaretti, S.; Gatta, G.; Romagnoli, C.; Salvucci, A.; Bonaiuto, V. A New Device for Propulsion Analysis in Swimming. Proceedings 2018, 2, 285. [Google Scholar] [CrossRef] [Green Version]
- Morouço, P.G.; Keskinen, K.L.; Vilas-Boas, J.P.; Fernandes, R.J. Relationship between tethered forces and the four swimming techniques performance. J. Appl. Biomech. 2011, 27, 161–169. [Google Scholar] [CrossRef] [PubMed] [Green Version]
- Carvalho, D.D.; Soares, S.; Zacca, R.; Marinho, D.A.; Silva, A.J.; Pyne, D.B.; Vilas-Boas, J.P.; Fernandes, R.J. In-Water and On-Land Swimmers’ Symmetry and Force Production. Int. J. Environ. Res. Public Health 2019, 16, 5018. [Google Scholar] [CrossRef] [PubMed] [Green Version]
- Morouço, P.G.; Vilas-Boas, J.P.; Fernandes, R.J. Evaluation of adolescent swimmers through a 30-s tethered test. Pediatr. Exerc. Sci. 2012, 24, 312–321. [Google Scholar] [CrossRef] [PubMed]
- Amaro, N.M.; Morouço, P.G.; Marques, M.C.; Fernandes, R.J.; Marinho, D.A. Biomechanical and bioenergetical evaluation of swimmers using fully-tethered swimming: A qualitative review. J. Hum. Sport Exerc. 2017, 12, 1346–1360. [Google Scholar] [CrossRef]
- González-Ravé, J.M.; Legaz-Arrese, A.; González-Mohíno, F.; Yustres, I.; Barragán, R.; de Asís Fernández, F.; Juárez, D.; Arroyo-Toledo, J.J. The effects of two different resisted swim training load protocols on swimming strength and performance. J. Hum. Kinet. 2018, 64, 195–204. [Google Scholar] [CrossRef] [Green Version]
- González-Ravé, J.M.; Santos-García, D.J.; Suárez, V.J.C.; Fernández-Arroyo, V.E.M.; Ureña, G.D.; Poyatos, M.C.; Valdivielso, F.N. Análisis de la potencia máxima específica en nadadores de diferente nivel. Red: Rev. Entren. Deport. 2011, 25, 11–15. [Google Scholar]
- Hay, J.G.; Thayer, A.M. Flow visualization of competitive swimming techniques: The tufts method. J. Biomech. 1989, 22, 11–19. [Google Scholar] [CrossRef]
- Samson, M.; Monnet, T.; Bernard, A.; Lacouture, P.; David, L. Comparative study between fully tethered and free swimming at different paces of swimming in front crawl. Sport. Biomech. 2019, 18, 571–586. [Google Scholar] [CrossRef] [PubMed]
- Muniz-Pardos, B.; Gomez-Bruton, A.; Matute-Llorente, A.; Gonzalez-Aguero, A.; Gomez-Cabello, A.; Gonzalo-Skok, O.; Casajus, J.A.; Vicente-Rodriguez, G. Swim-specific resistance training: A systematic review. J. Strength Cond. Res. 2019, 33, 2875–2881. [Google Scholar] [CrossRef] [PubMed]
- Crowley, E.; Harrison, A.J.; Lyons, M. The impact of resistance training on swimming performance: A systematic review. Sport. Med. 2017, 47, 2285–2307. [Google Scholar] [CrossRef] [PubMed]
- Vogel, S. Life in Moving Fluids: The Physical Biology of Flow-Revised and Expanded Second Edition; Princeton University Press: Princeton, NJ, USA, 2020. [Google Scholar]
- Cortesi, M.; Gatta, G.; Michielon, G.; Di Michele, R.; Bartolomei, S.; Scurati, R. Passive Drag in Young Swimmers: Effects of Body Composition, Morphology and Gliding Position. Int. J. Environ. Res. Public Health 2020, 17, 2002. [Google Scholar] [CrossRef] [PubMed] [Green Version]
- Gatta, G.; Cortesi, M.; Fantozzi, S.; Zamparo, P. Planimetric frontal area in the four swimming strokes: Implications for drag, energetics and speed. Hum. Mov. Sci. 2015, 39, 41–54. [Google Scholar] [CrossRef]
- Andrade, R.M.; Figueira Júnior, A.J.; Metz, V.; Amadio, A.C.; Serrão, J.C. Interpretation of propulsive force in tethered swimming through principal component analysis. Rev. Bras. Med. Esporte 2018, 24, 178–181. [Google Scholar] [CrossRef]
- Karsai, I.; Garrido, N.; Louro, H.; Leitao, L.; Magyar, F.; Alves, F.; Silva, A. Force production and spatial arm coordination profile in arm crawl swimming in a fixed position. Acta Physiol. Hung. 2010, 97, 385–392. [Google Scholar] [CrossRef]
- Loturco, I.; Barbosa, A.; Nocentini, R.; Pereira, L.; Kobal, R.; Kitamura, K.; Abad, C.; Figueiredo, P.; Nakamura, F. A correlational analysis of tethered swimming, swim sprint performance and dry-land power assessments. Int. J. Sport. Med. 2016, 37, 211–218. [Google Scholar] [CrossRef] [Green Version]
- Morouço, P.G.; Marinho, D.A.; Izquierdo, M.; Neiva, H.; Marques, M.C. Relative contribution of arms and legs in 30 s fully tethered front crawl swimming. Biomed Res. Int. 2015, 2015. [Google Scholar] [CrossRef]
- General Assembly of the World Medical Association. World Medical Association Declaration of Helsinki: Ethical principles for medical research involving human subjects. J. Am. Coll. Dent. 2014, 81, 14. [Google Scholar]
- Dominguez-Castells, R.; Izquierdo, M.; Arellano, R. An updated protocol to assess arm swimming power in front crawl. Int. J. Sport. Med. 2013, 34, 324–329. [Google Scholar] [CrossRef] [PubMed] [Green Version]
- Shionoya, A.; Shibukura, T.; Shimizu, T.; Ohba, M.; Tachikawa, K.; Miyake, H. Middle power measurement in semi-tethered swimming using ergometer attachment. Res. Rep. Technol. Univ. Nagaoka 2001, 23, 83–91. [Google Scholar]
- Barbosa, T.M.; Fernandes, R.; Keskinen, K.; Colašo, P.; Cardoso, C.; Silva, J.; Vilas-Boas, J. Evaluation of the energy expenditure in competitive swimming strokes. Int. J. Sport. Med. 2006, 27, 894–899. [Google Scholar] [CrossRef] [PubMed] [Green Version]
- Sanchez-Medina, L.; Perez, C.; Gonzalez-Badillo, J. Importance of the propulsive phase in strength assessment. Int. J. Sport. Med. 2010, 31, 123–129. [Google Scholar] [CrossRef] [PubMed]
- Cuenca-Fernández, F.; Gay, A.; Ruiz-Navarro, J.; Arellano, R. The effect of different loads on semi-tethered swimming and its relationship with dry-land performance variables. Int. J. Perform. Anal. Sport 2020, 20, 90–106. [Google Scholar]
- Hooper, R. Measurement of power delivered to an external weight. Biomechanics and medicine in swimming. Hum. Kinet. Champaign 1983, 2, 113–119. [Google Scholar]
- Jiménez-Reyes, P.; Samozino, P.; García-Ramos, A.; Cuadrado-Peñafiel, V.; Brughelli, M.; Morin, J.B. Relationship between vertical and horizontal force-velocity-power profiles in various sports and levels of practice. PeerJ 2018, 6, e5937. [Google Scholar] [CrossRef]
- Morin, J.B.; Samozino, P. Interpreting power-force-velocity profiles for individualized and specific training. Int. J. Sport. Physiol. Perform. 2016, 11, 267–272. [Google Scholar] [CrossRef] [PubMed]
- Gonjo, T.; Eriksrud, O.; Papoutsis, F.; Olstad, B.H. Relationships between a load-velocity profile and sprint performance in butterfly swimming. Int. J. Sport. Med. 2020, 41, 461–467. [Google Scholar] [CrossRef] [PubMed]
- Callaway, A.J. Measuring kinematic variables in front crawl swimming using accelerometers: A validation study. Sensors 2015, 15, 11363–11386. [Google Scholar] [CrossRef] [PubMed] [Green Version]


Publisher’s Note: MDPI stays neutral with regard to jurisdictional claims in published maps and institutional affiliations. |
© 2020 by the authors. Licensee MDPI, Basel, Switzerland. This article is an open access article distributed under the terms and conditions of the Creative Commons Attribution (CC BY) license (http://creativecommons.org/licenses/by/4.0/).
Share and Cite
Hermosilla, F.; Corral-Gómez, L.; González-Ravé, J.M.; Juárez Santos-García, D.; Rodríguez-Rosa, D.; Juárez-Pérez, S.; Castillo-Garcia, F.J. SwimOne. New Device for Determining Instantaneous Power and Propulsive Forces in Swimming. Sensors 2020, 20, 7169. https://doi.org/10.3390/s20247169
Hermosilla F, Corral-Gómez L, González-Ravé JM, Juárez Santos-García D, Rodríguez-Rosa D, Juárez-Pérez S, Castillo-Garcia FJ. SwimOne. New Device for Determining Instantaneous Power and Propulsive Forces in Swimming. Sensors. 2020; 20(24):7169. https://doi.org/10.3390/s20247169
Chicago/Turabian StyleHermosilla, Francisco, Lis Corral-Gómez, José M. González-Ravé, Daniel Juárez Santos-García, David Rodríguez-Rosa, Sergio Juárez-Pérez, and Fernando J. Castillo-Garcia. 2020. "SwimOne. New Device for Determining Instantaneous Power and Propulsive Forces in Swimming" Sensors 20, no. 24: 7169. https://doi.org/10.3390/s20247169