Feasibility of Heart Rate and Respiratory Rate Estimation by Inertial Sensors Embedded in a Virtual Reality Headset

 ,
,  ,
,  and
and 
Abstract
1. Introduction
2. Materials and Methods
2.1. Study Population
2.2. Data Collection
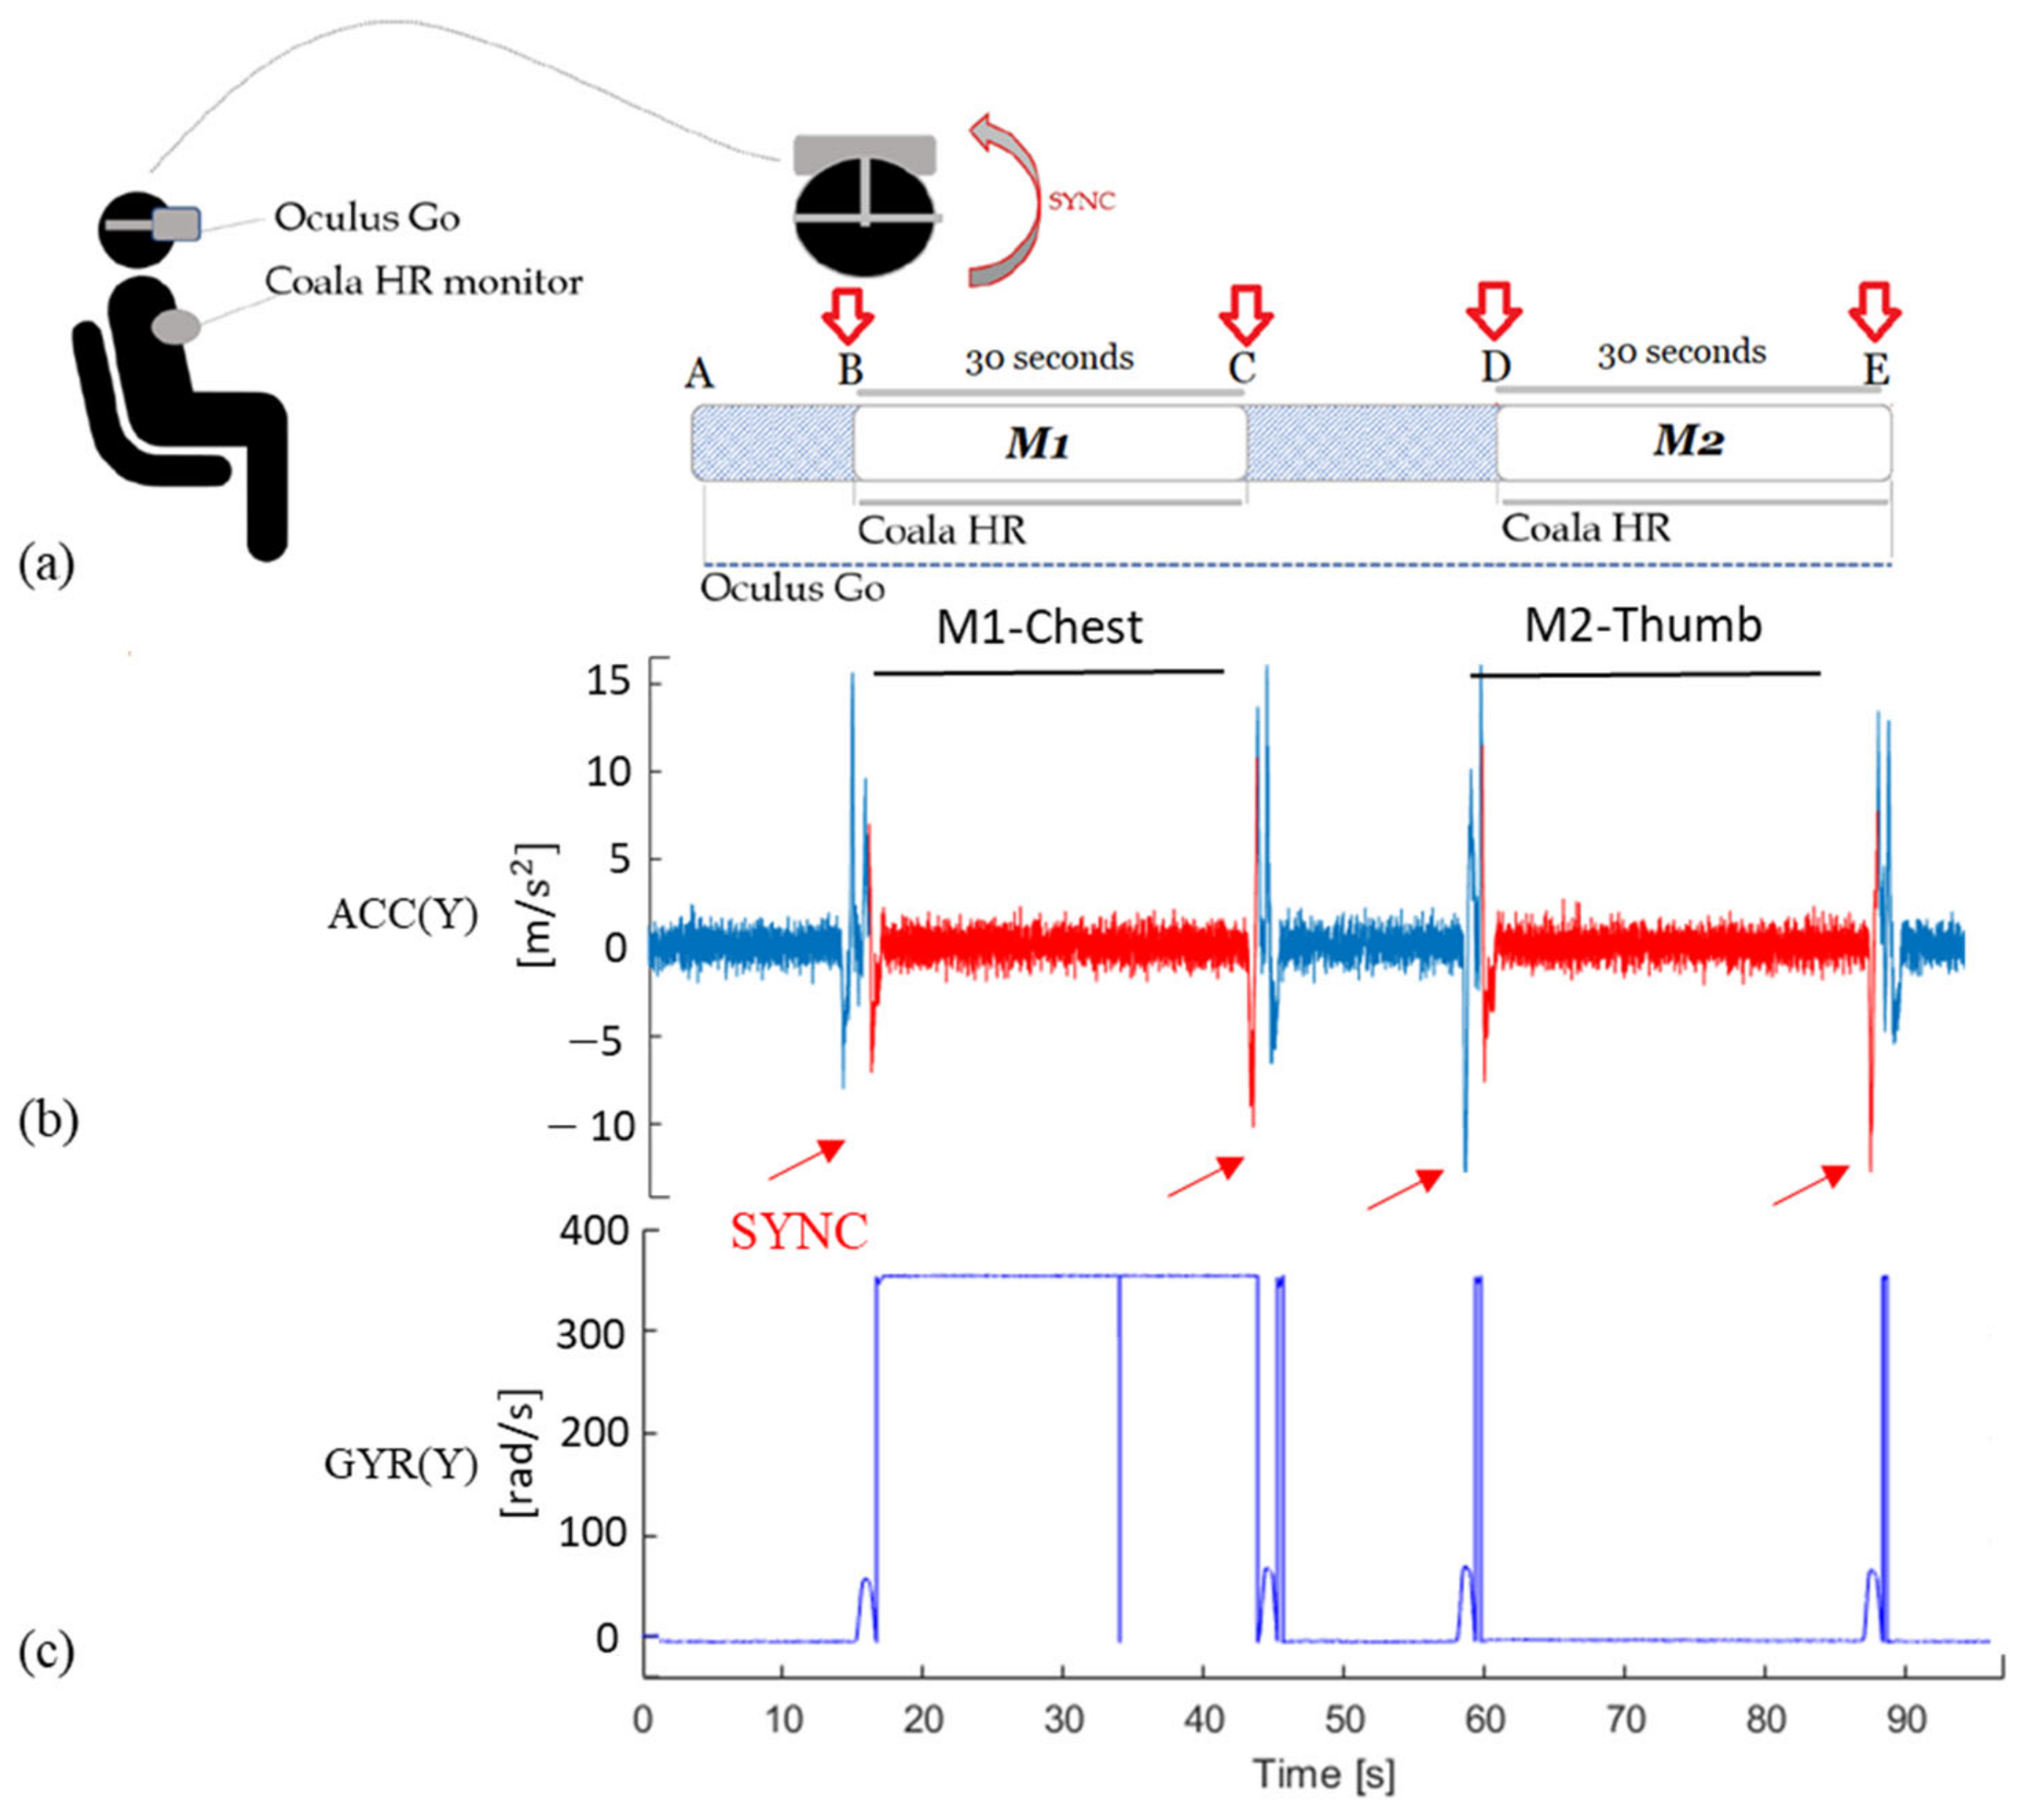
2.2.1. Protocol for Heart Rate Evaluation
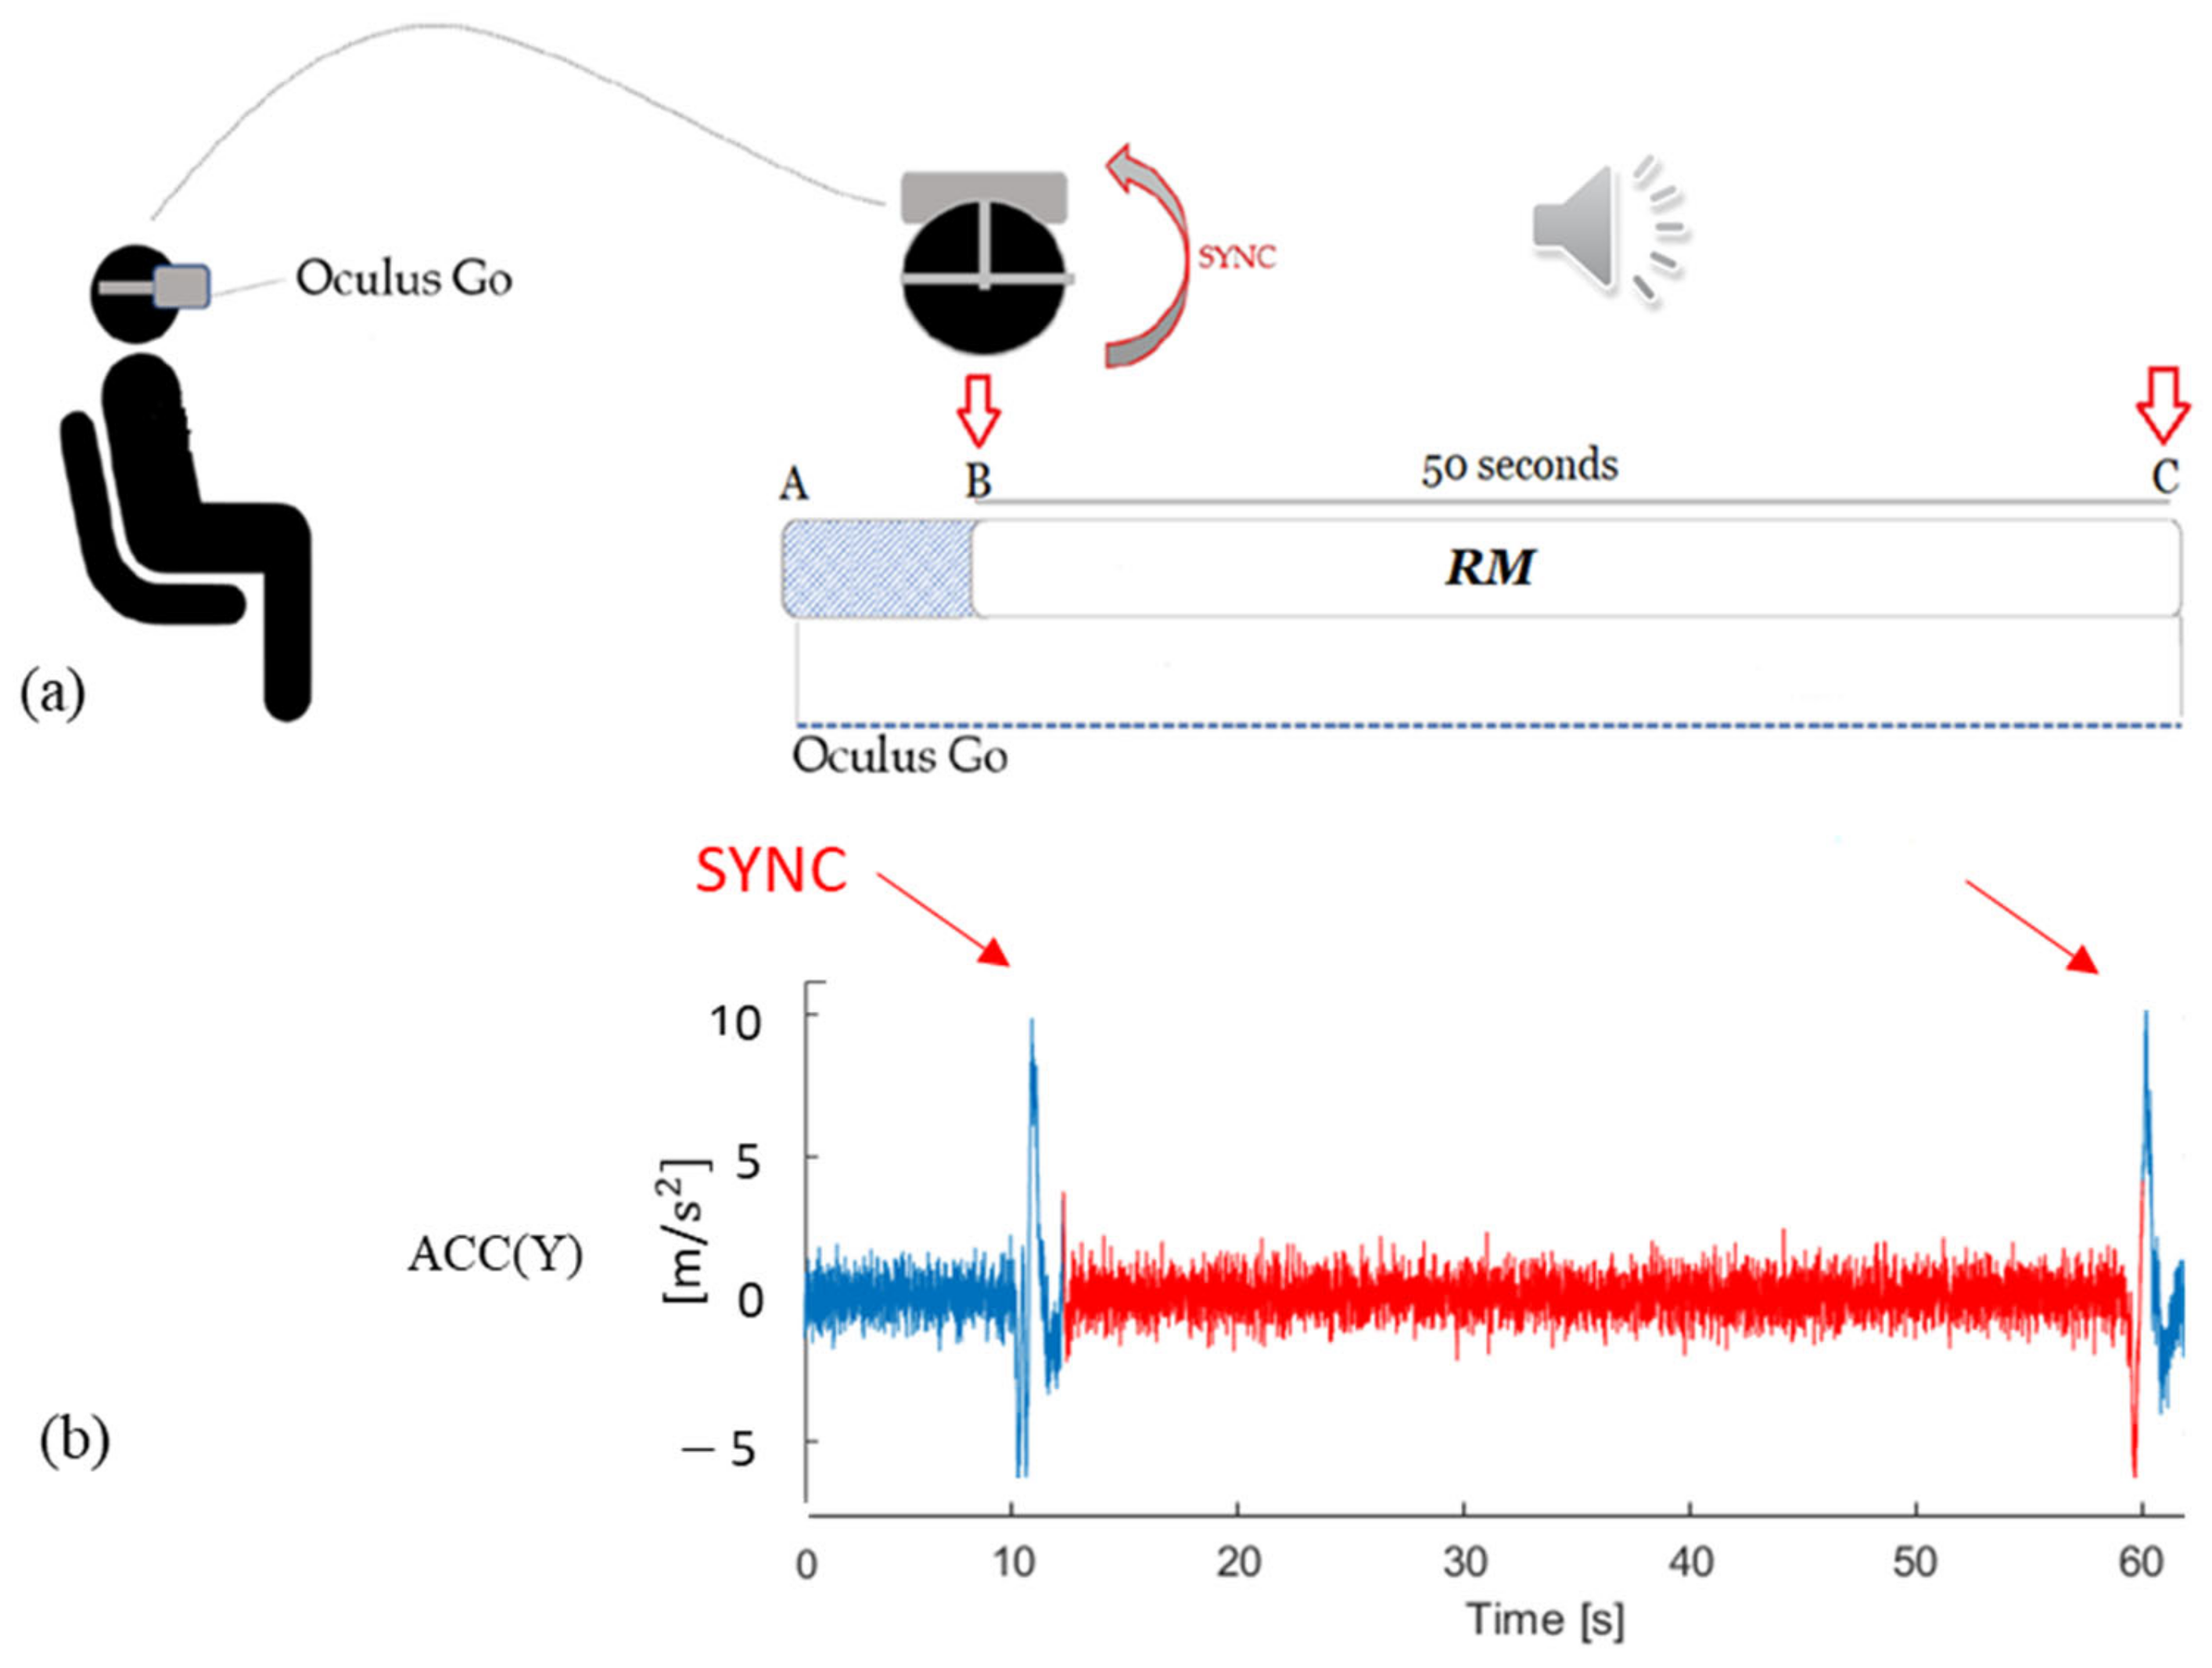
2.2.2. Protocol for Respiratory Rate Evaluation
2.3. Data Processing
2.3.1. Pre-Processing
2.3.2. HR Estimation
- (i)
- A digital band-pass (10–13 Hz) second order Butterworth IIR filter was applied to each component of the acquired signals [19].
- (ii)
- The magnitude of the total acceleration (separately for linear and angular components) was calculated as the square root of the sum of the squared components at each sample (Equation (1)).
- (iii)
- An additional band-pass (0.75–2.5 Hz) second order Butterworth filter, thus limiting the detection of HR in the range between 45 and 150 beats per minute (bpm), was applied to the magnitude vector [19].
- (iv)
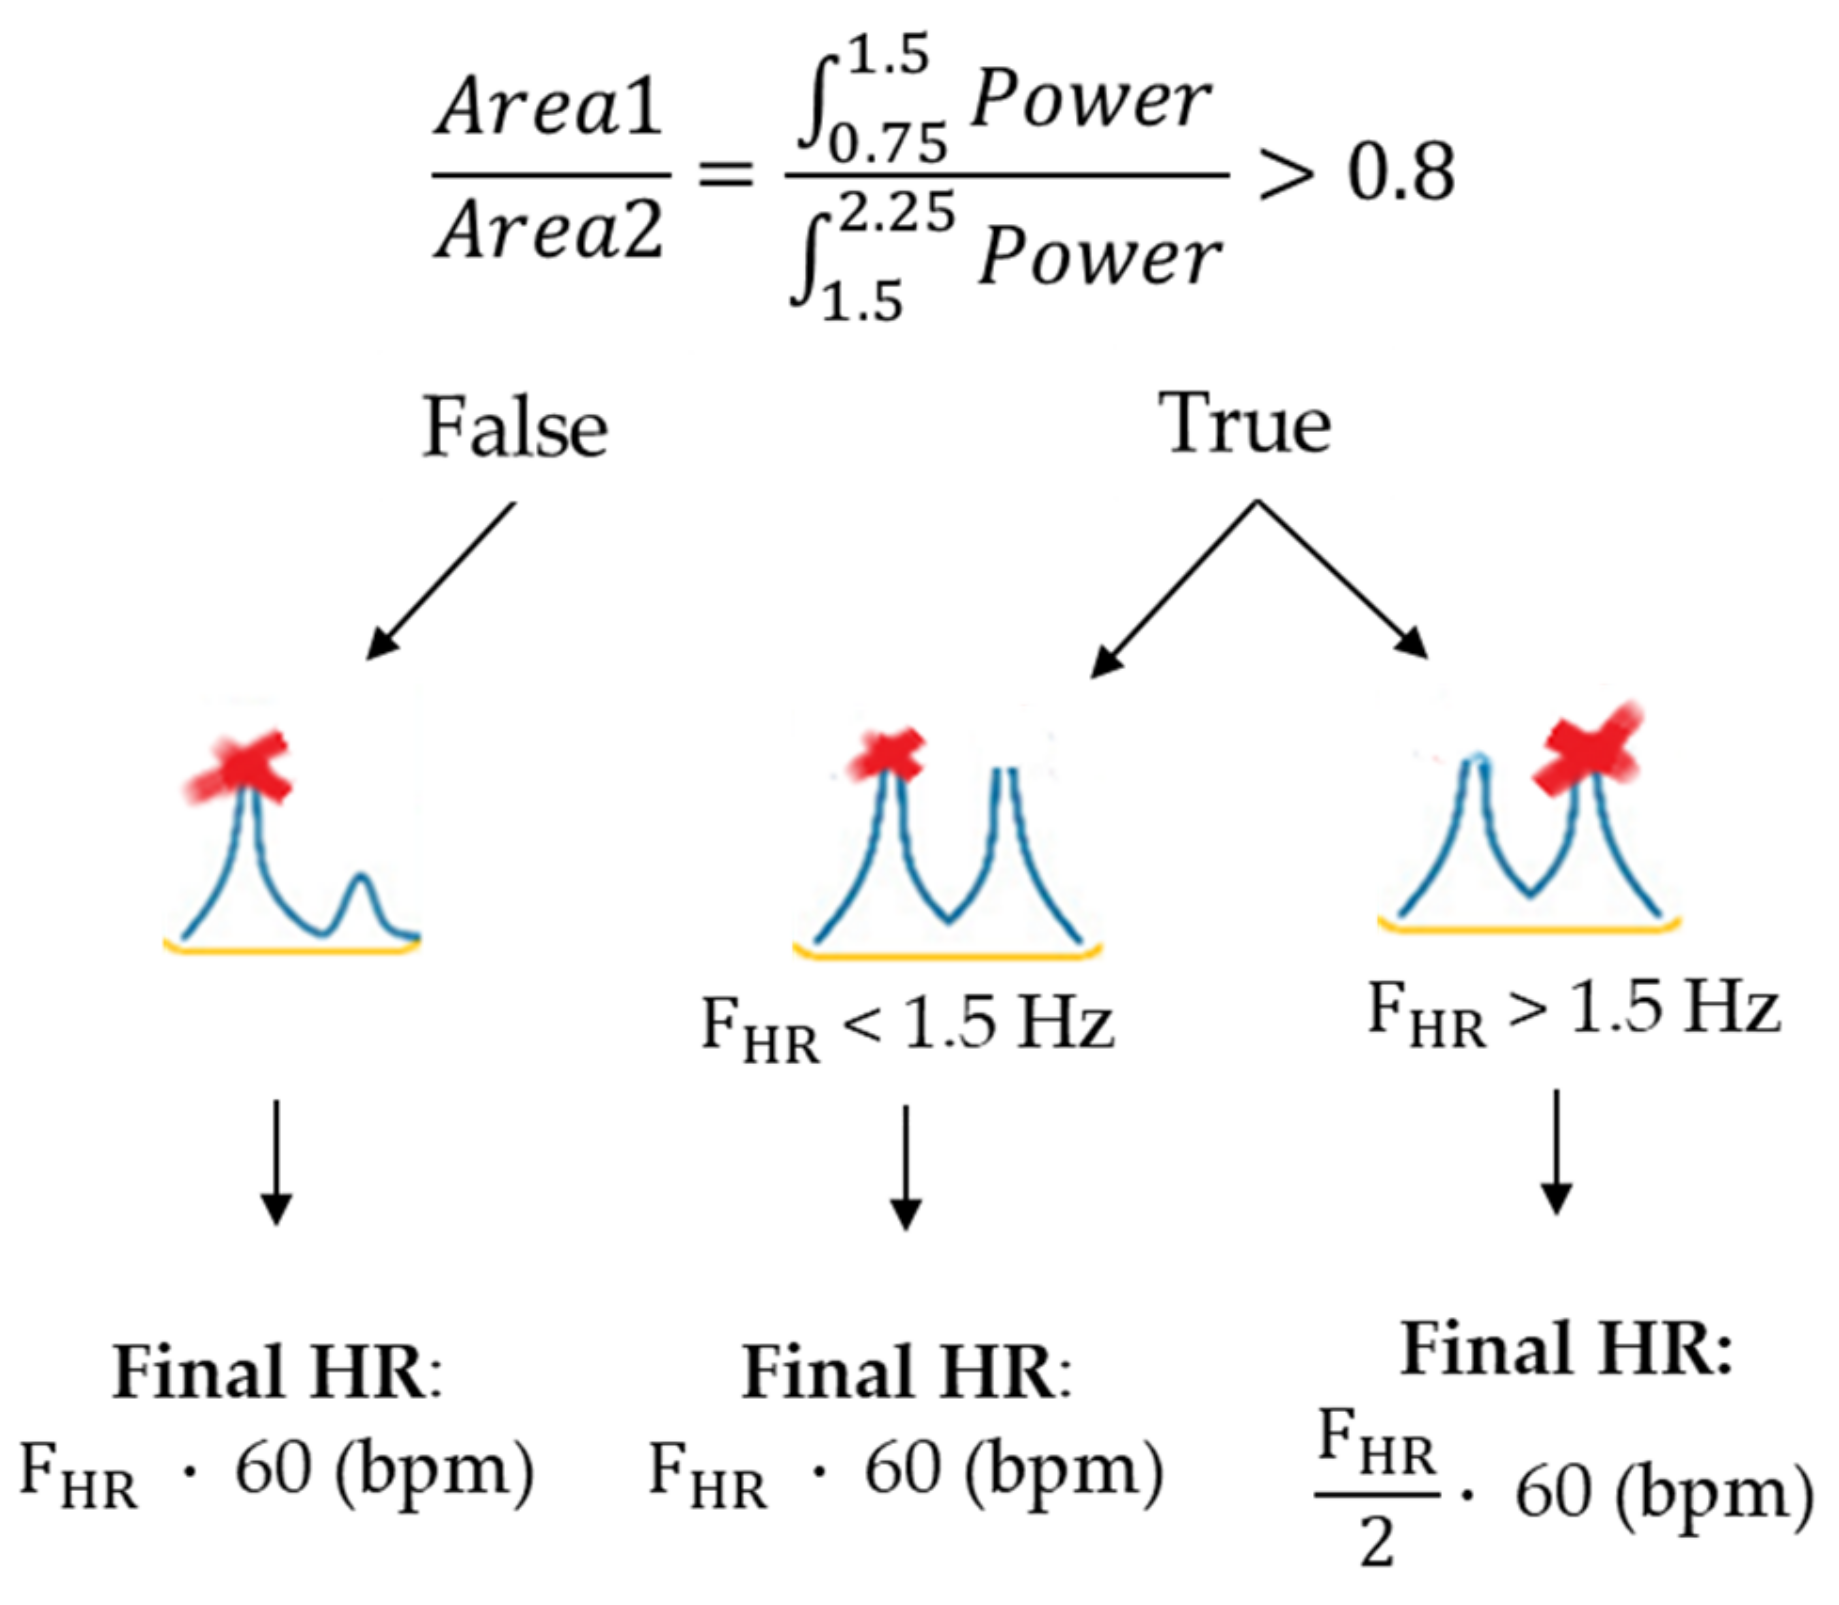
- To estimate the mean HR from the magnitude vector, two traditional approaches in the frequency domain were proposed: the Fast Fourier Transform (FFT) and the Short-Time Fourier Transform (STFT).
- (v)
- In the former case, the HR was computed multiplying the frequency corresponding to the highest spectral power amplitude by 60 (bpm); in the latter case, the HR estimate was obtained as the median of the estimated frequencies corresponding to the highest spectral power amplitude computed by applying the Fourier transform in consecutive 10 s span time windows with 9 s of overlap.

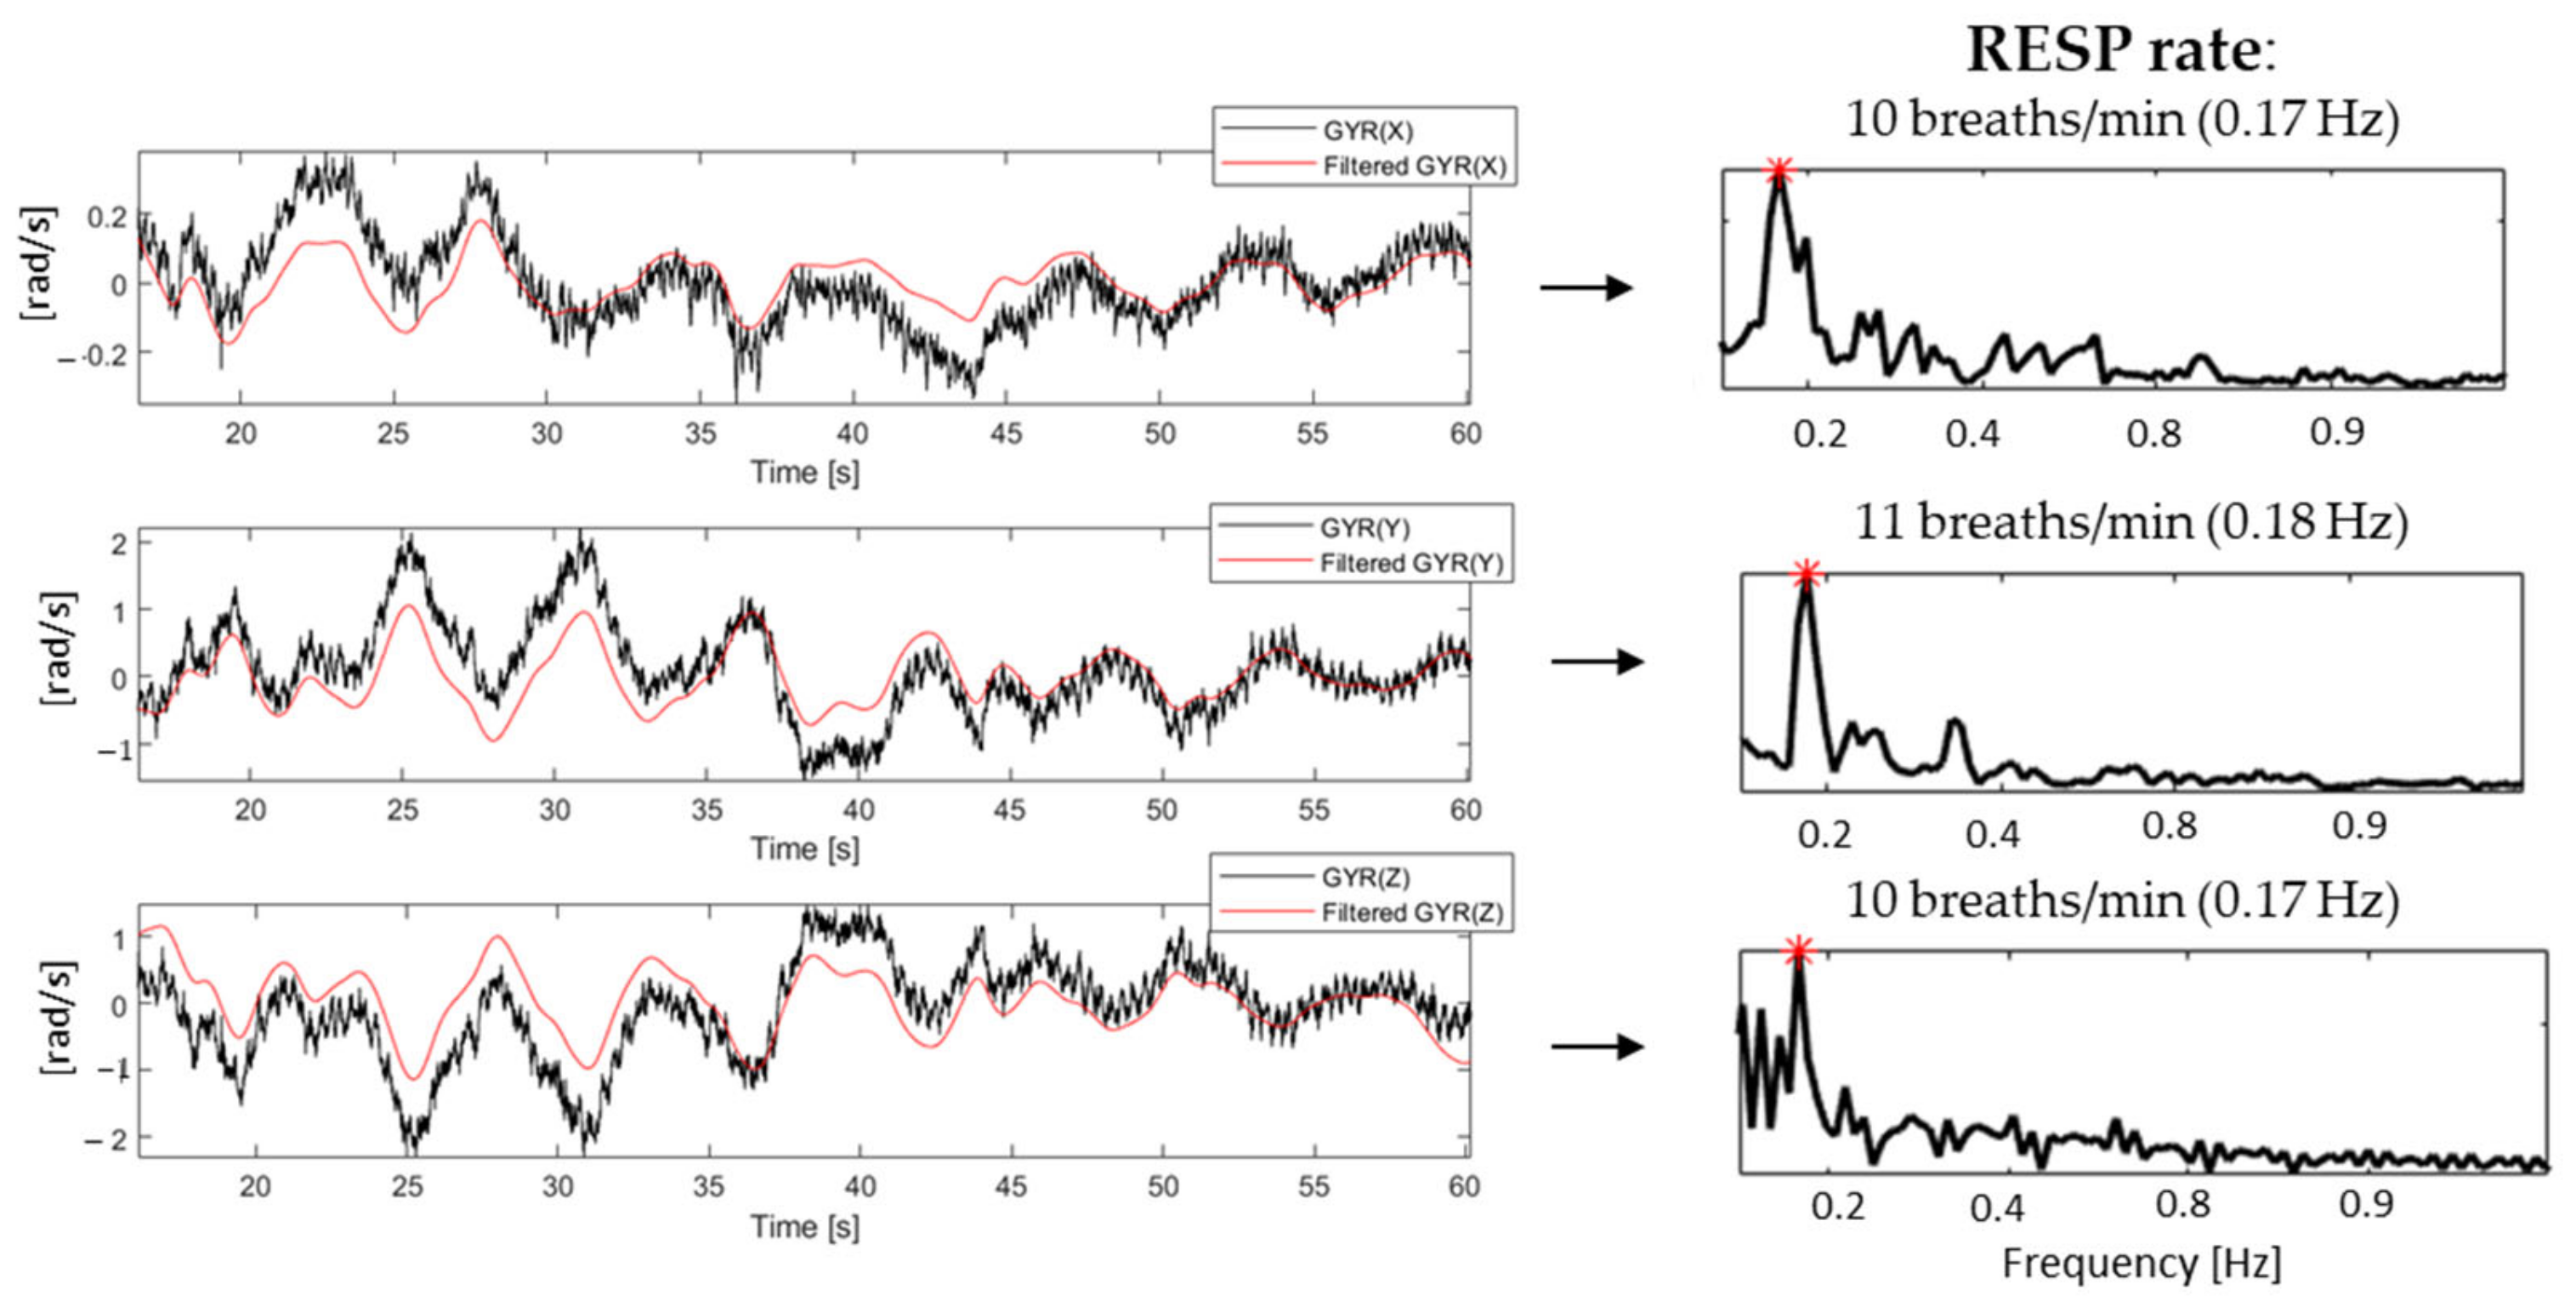
2.3.3. Protocol for RESP Estimation
2.4. Statistical Analysis
3. Results
3.1. Results Relevant to Mean HR
3.2. Results Relevant to RESP Rate
4. Discussion
Limitations
5. Conclusions
Author Contributions
Funding
Acknowledgments
Conflicts of Interest
Appendix A

| N = 25 | ECG Chest (bpm) | ECG Thumb (bpm) | ||||
|---|---|---|---|---|---|---|
| Subject (#) | SIT | STAND | SUP | SIT | STAND | SUP |
| 1 | 64 | 72 | 67 | 67 | 80 | 67 |
| 2 | 84 | 76 | 73 | 77 | 79 | 71 |
| 3 | 77 | 79 | 73 | 77 | 79 | 71 |
| 4 | 52 | 62 | 50 | 52 | 61 | 49 |
| 5 | 84 | 96 | 78 | 85 | 101 | 77 |
| 7 | 85 | 107 | 68 | 83 | 110 | 76 |
| 8 | 80 | 82 | 82 | 84 | 84 | 85 |
| 9 | 72 | 77 | 74 | 74 | 79 | 71 |
| 12 | 60 | 64 | 58 | 59 | 64 | 60 |
| 14 | 57 | 64 | 56 | 55 | 68 | 57 |
| 15 | 43 | 43 | 47 | 44 | 46 | 48 |
| 16 | 77 | 87 | 70 | 85 | 86 | 72 |
| 17 | 59 | 64 | 58 | 64 | 86 | 59 |
| 18 | 75 | 80 | 68 | 73 | 89 | 70 |
| 19 | 72 | 78 | 72 | 71 | 78 | 69 |
| 20 | 72 | 76 | 75 | 74 | 79 | 79 |
| 21 | 83 | 87 | 78 | 84 | 92 | 78 |
| 22 | 76 | 76 | 79 | 72 | 75 | 73 |
| 23 | 66 | 71 | 63 | 67 | 89 | 64 |
| 24 | 78 | 75 | 76 | 76 | 78 | 78 |
| 25 | 54 | 50 | 47 | 48 | 49 | 47 |
| 27 | 79 | 84 | 78 | 80 | 92 | 78 |
| 28 | 84 | 93 | 85 | 85 | 96 | 84 |
| 29 | 74 | 80 | 72 | 76 | 86 | 71 |
| 30 | 61 | 62 | 48 | 55 | 63 | 48 |
| Median (25th; 75th) | 74 # * (61; 79) | 76 (64; 82) | 72 # (58; 76) | 74 # * (64; 80) | 79 (75; 89) | 71 # (69; 77) |
| FFT Method | STFT Method | Adjusted-FFT Method | |||||
|---|---|---|---|---|---|---|---|
| Body Posture | Sensor Modality | M1 Chest (bpm) | M2 Thumb (bpm) | M1 Chest (bpm) | M2 Thumb (bpm) | M1 Chest (bpm) | M2 Thumb (bpm) |
| SIT | ACC | 77 (70; 85) | 75 (70; 83) | 78 (72; 90) | 78 * (72; 84) | 77 (68; 82) | 75 (62; 77) |
| GYR | 75 (62; 81) | 75 # (60; 77) | 78 (72; 84) | 72 (66; 78) | 71 # (62; 77) | 75 # (60; 77) | |
| STAND | ACC | 77 (70; 82) | 80 (70; 92) | 78 (72; 84) | 78 (72; 90) | 75 (67; 80) | 75 (66; 82) |
| GYR | 77 (70; 82) | 79 (62; 87) | 78 (69; 84) | 78 (60; 84) | 77 (67; 80) | 79 (62; 84) | |
| SUP | ACC | 76 (70; 82) | 73 * (70; 77) | 72 (72; 78) | 72 * (66; 78) | 75 (67; 78) | 72 (68; 77) |
| GYR | 70 * (62; 76) | 75 (70; 82) | 78 (72; 84) | 78 (72; 84) | 70 # (62; 75) | 75 (70; 80) | |
References
- Nee, A.Y.C.; Ong, S.K. Virtual and augmented reality applications in manufacturing. IFAC Proc. 2013. [Google Scholar] [CrossRef]
- Slater, M.; Sanchez-Vives, M.V. Enhancing our lives with immersive virtual reality. Front. Robot. AI 2016, 3, 1–47. [Google Scholar] [CrossRef]
- Stryla, W.; Banas, A. The Use of Virtual Reality Technologies during Physiotherapy of the Paretic Upper Limb in Patients after Ischemic Stroke. J. Neurol. Neurosci. 2015, 6, 1–6. [Google Scholar] [CrossRef]
- Aida, J.; Chau, B.; Dunn, J. Immersive virtual reality in traumatic brain injury rehabilitation: A literature review. NeuroRehabilitation 2018. [Google Scholar] [CrossRef] [PubMed]
- Maples-Keller, J.L.; Yasinski, C.; Manjin, N.; Rothbaum, B.O. Virtual Reality-Enhanced Extinction of Phobias and Post-Traumatic Stress. Neurotherapeutics 2017, 14, 554–563. [Google Scholar] [CrossRef]
- Spiegel, B.; Fuller, G.; Lopez, M.; Dupuy, T.; Noah, B.; Howard, A.; Albert, M.; Tashjian, V.; Lam, R.; Ahn, J.; et al. Virtual reality for management of pain in hospitalized patients: A randomized comparative effectiveness trial. PLoS ONE 2019. [Google Scholar] [CrossRef]
- Schneider, S.M.; Kisby, C.K.; Flint, E.P. Effect of virtual reality on time perception in patients receiving chemotherapy. Support. Care Cancer 2011. [Google Scholar] [CrossRef]
- Morris, L.D.; Louw, Q.A.; Grimmer-Somers, K. The effectiveness of virtual reality on reducing pain and anxiety in burn injury patients: A systematic review. Clin. J. Pain 2009. [Google Scholar] [CrossRef]
- Gold, J.I.; Kant, A.J.; Kim, S.H.; Rizzo, A. Virtual anesthesia: The use of virtual reality for pain distraction during acute medical interventions. Semin. Anesth. Perioper. Med. Pain 2005. [Google Scholar] [CrossRef]
- Furman, E.; Jasinewicius, T.R.; Bissada, N.F.; Victoroff, K.Z.; Skillicorn, R.; Buchner, M. Virtual reality distraction for pain control during periodontal scaling and root planing procedures. J. Am. Dent. Assoc. 2009. [Google Scholar] [CrossRef]
- Farra, S.; Hodgson, E.; Miller, E.T.; Timm, N.; Brady, W.; Gneuhs, M.; Ying, J.; Hausfeld, J.; Cosgrove, E.; Simon, A.; et al. Effects of Virtual Reality Simulation on Worker Emergency Evacuation of Neonates. Disaster Med. Public Health Prep. 2019. [Google Scholar] [CrossRef] [PubMed]
- Pandrangi, V.C.; Gaston, B.; Appelbaum, N.P.; Albuquerque, F.C.; Levy, M.M.; Larson, R.A. The Application of Virtual Reality in Patient Education. Ann. Vasc. Surg. 2019. [Google Scholar] [CrossRef] [PubMed]
- Rourke, S. How does virtual reality simulation compare to simulated practice in the acquisition of clinical psychomotor skills for pre-registration student nurses? A systematic review. Int. J. Nurs. Stud. 2020. [Google Scholar] [CrossRef] [PubMed]
- Khor, W.S.; Baker, B.; Amin, K.; Chan, A.; Patel, K.; Wong, J. Augmented and virtual reality in surgery-the digital surgical environment: Applications, limitations and legal pitfalls. Ann. Transl. Med. 2016. [Google Scholar] [CrossRef] [PubMed]
- Brunnström, K.; Ariel Beker, S.; de Moor, K.; Dooms, A.; Egger, S.; Garcia, M.-N.; Hossfeld, T.; Jumisko-Pyykkö, S.; Keimel, C.; Larabi, M.-C.; et al. Qualinet White Paper on Definitions of Quality of Experience. 2013. ffhal-00977812f. Available online: https://hal.archives-ouvertes.fr/hal-00977812 (accessed on 13 December 2020).
- Sanchez-Vives, M.V.; Slater, M. From presence to consciousness through virtual reality. Nat. Rev. Neurosci. 2005. [Google Scholar] [CrossRef]
- Slater, M. Place illusion and plausibility can lead to realistic behaviour in immersive virtual environments. Philos. Trans. R. Soc. B Biol. Sci. 2009. [Google Scholar] [CrossRef]
- Slater, M.; Wilbur, S. A framework for immersive virtual environments (FIVE): Speculations on the role of presence in virtual environments. Presence Teleoper. Virtual Environ. 1997. [Google Scholar] [CrossRef]
- Kroupi, E.; Hanhart, P.; Lee, J.S.; Rerabek, M.; Ebrahimi, T. Modeling immersive media experiences by sensing impact on subjects. Multimed. Tools Appl. 2016, 75, 12409–12429. [Google Scholar] [CrossRef]
- Hupont, I.; Gracia, J.; Sanagustin, L.; Gracia, M.A. How do new visual immersive systems influence gaming QoE? A use case of serious gaming with Oculus Rift. In Proceedings of the 2015 7th International Workshop on Quality of Multimedia Experience, QoMEX 2015, Pylos-Nestoras, Greece, 26–29 May 2015. [Google Scholar] [CrossRef]
- Li, H.C.O.; Seo, J.; Kham, K.; Lee, S. Measurement of 3D visual fatigue using event-related potential (ERP): 3D oddball paradigm. In Proceedings of the 2008 3DTV-Conference: The True Vision—Capture, Transmission and Display of 3D Video, 3DTV-CON 2008 Proceedings, Istanbul, Turkey, 28–30 May 2008. [Google Scholar] [CrossRef]
- Egan, D.; Brennan, S.; Barrett, J.; Qiao, Y.; Timmerer, C.; Murray, N. An evaluation of Heart Rate and ElectroDermal Activity as an objective QoE evaluation method for immersive virtual reality environments. In Proceedings of the 2016 8th International Conference on Quality of Multimedia Experience, QoMEX 2016, Lisbon, Portugal, 6–8 June 2016; pp. 1–6. [Google Scholar] [CrossRef]
- Hernandez, J.; Li, Y.; Rehg, J.M.; Picard, R.W. Cardiac and Respiratory Parameter Estimation Using Head-mounted Motion-sensitive Sensors. EAI Endorsed Trans. Pervasive Health Technol. 2015, 1, e2. [Google Scholar] [CrossRef]
- Hernandez, J.; McDuff, D.; Quigley, K.S.; Maes, P.; Picard, R.W. Wearable Motion-based Heart-rate at Rest: A Workplace Evaluation. IEEE J. Biomed. Health Inform. 2018, 23, 1920–1927. [Google Scholar] [CrossRef]
- Landreani, F.; Caiani, E.G. Smartphone accelerometers for the detection of heart rate. Expert Rev. Med Devices 2017, 14, 935–948. [Google Scholar] [CrossRef] [PubMed]
- Landreani, F.; Martin-Yebra, A.; Casellato, C.; Pavan, E.; Frigo, C.; Migeotte, P.F.; Caiani, E.G. Feasibility study for beat-to-beat heart rate detection by smartphone’s accelerometers. In Proceedings of the 2015 E-Health and Bioengineering Conference, EHB 2015, Iasi, Romania, 19–21 November 2015. [Google Scholar] [CrossRef]
- Landreani, Faini, Martin-Yebra, Morri, Parati, and Caiani, Assessment of Ultra-Short Heart Variability Indices Derived by Smartphone Accelerometers for Stress Detection. Sensors 2019, 19, 3729. [CrossRef] [PubMed]
- Inan, O.T.; Migeotte, P.F.; Park, K.S.; Etemadi, M.; Tavakolian, K.; Casanella, R.; Zanetti, J.; Tank, J.; Funtova, I.; Prisk, G.K.; et al. Ballistocardiography and Seismocardiography: A Review of Recent Advances. IEEE J. Biomed. Health Inform. 2015, 19, 1414–1427. [Google Scholar] [CrossRef] [PubMed]
- Hernandez, J.; McDuff, D.J.; Picard, R.W. BioInsights: Extracting personal data from ‘Still’ wearable motion sensors. In Proceedings of the 2015 IEEE 12th International Conference on Wearable and Implantable Body Sensor Networks, BSN 2015, Cambridge, MA, USA, 9–12 June 2015; pp. 1–6. [Google Scholar] [CrossRef]
- Coala Life. Available online: https://www.coalalife.com/english/ (accessed on 13 December 2020).
- Jelinek, H.F.; Cornforth, D.J.; Khandoker, A.H. Heart rate variability. Standards of measurement, physiological interpretation, and clinical use. Eur. Heart J. 1996, 1–12. [Google Scholar] [CrossRef]
- Yoon, J.W.; Noh, Y.S.; Kwon, Y.S.; Kim, W.K.; Yoon, H.R. Improvement of dynamic respiration monitoring through sensor fusion of accelerometer and gyro-sensor. J. Electr. Eng. Technol. 2014, 9, 334–343. [Google Scholar] [CrossRef]
- Shandhi, M.M.H.; Semiz, B.; Hersek, S.; Goller, N.; Ayazi, F.; Inan, O. Performance Analysis of Gyroscope and Accelerometer Sensors for Seismocardiography-Based Wearable Pre-Ejection Period Estimation. IEEE J. Biomed. Health Inform. 2019, 23, 2365–2374. [Google Scholar] [CrossRef]
- Bland, J.M.; Altman, D.G. Agreement between methods of measurement with multiple observations per individual. J. Biopharm. Stat. 2007, 17, 571–582. [Google Scholar] [CrossRef]
- Choi, H.; Baraniuk, R. Interpolation and denoising of nonuniformly sampled data using wavelet-domain processing. In Proceedings of the ICASSP, IEEE International Conference on Acoustics, Speech and Signal Processing, Phoenix, AZ, USA, 15–19 March 1999. [Google Scholar] [CrossRef]


| ACC | GYR | ||||||
|---|---|---|---|---|---|---|---|
| Method\Posture | SIT (N = 26) Rs2 | STAND (N = 28) Rs2 | SUP (N = 29) Rs2 | SIT (N = 26) Rs2 | STAND (N = 28) Rs2 | SUP (N = 29) Rs2 | |
| FFT | M1 Chest | 0.28 (0.03–0.58) | 0.23 (0.02–0.52) | 0.00 (0.14–0.33) | 0.58 (0.29–0.79) | 0.79 (0.60–0.90) | 0.30 (0.05–0.58) |
| M2 Thumb | 0.17 (0–0.47) | 0.08 (0.01–0.35) | 0.06 (0.02–0.31) | 0.91 (0.81–0.96) | 0.81 (0.64–0.91) | 0.14 (0–0.43) | |
| STFT | M1 Chest | 0.23 (0.01–0.54) | 0.31 (0.06–0.59) | 0.1 (0.09–0.18) | 0.23 (0.01–0.54) | 0.76 (0.55–0.88) | 0.1 (0–0.38) |
| M2 Thumb | 0.2 (0.07–0.25) | 0.15 (0.1–0.18) | 0.1 (0–0.38) | 0.49 (0.19–0.73) | 0.79 (0.60–0.90) | 0.04 (0.03–0.27) | |
| Adjusted FFT | M1 Chest | 0.44 (0.14–0.7) | 0.12 (0–0.41) | 0.1 (0.05–0.24) | 0.83 (0.66–0.92) | 0.51 (0.21–0.73) | 0.44 (0.15–0.68) |
| M2 Thumb | 0.55 (0.25–0.77) | 0.11 (0–0.4) | 0.02 (0.01–0.49) | 0.91 (0.81–0.96) | 0.69 (0.43–0.84) | 0.20 (0.01–0.48) | |
| ACC | GYR | |||||||||||||
|---|---|---|---|---|---|---|---|---|---|---|---|---|---|---|
| SIT (N = 26) | STAND (N = 28) | SUP (N = 29) | SIT (N = 26) | STAND (N = 28) | SUP (N = 29) | |||||||||
| Bias (LoA) | Bias (LoA) | Bias (LoA) | Bias (LoA) | Bias (LoA) | Bias (LoA) | |||||||||
| FFT | M1 Chest | 6.9 (31.2) | 0.249 | 4.7 (30.3) | 0.240 | 11 (39) | 0.374 | 3.6 (25.3) | 0.131 | 0.6 (14.9) | 0.049 | 6.6 (38.9) | 0.321 | |
| M2 Thumb | 5.3 (37.2) | 0.178 | 5.5 (42.9) | 0.254 | 5.8 (27.6) | 0.361 | 1.9 (25.4) | 0.068 | −1.7 (11.6) | 0.046 | 5.8 (29) | 0.203 | ||
| STFT | M1 Chest | 5.7 (29.4) | 0.229 | 4.6 (27.2) | 0.242 | 10.1 (34.3) | 0.521 | 5.7 (29.4) | 0.229 | 0.7 (15.1) | 0.034 | 10.6* (34.1) | 0.358 | |
| M2 Thumb | 5.5 (33) | 0.236 | 6.4 (42.6) | 0.199 | 7.1 (26.3) | 0.371 | 1.5 (19.5) | 0.064 | −2.9 (11.7) | 0.097 | 11 (37.8) | 0.326 | ||
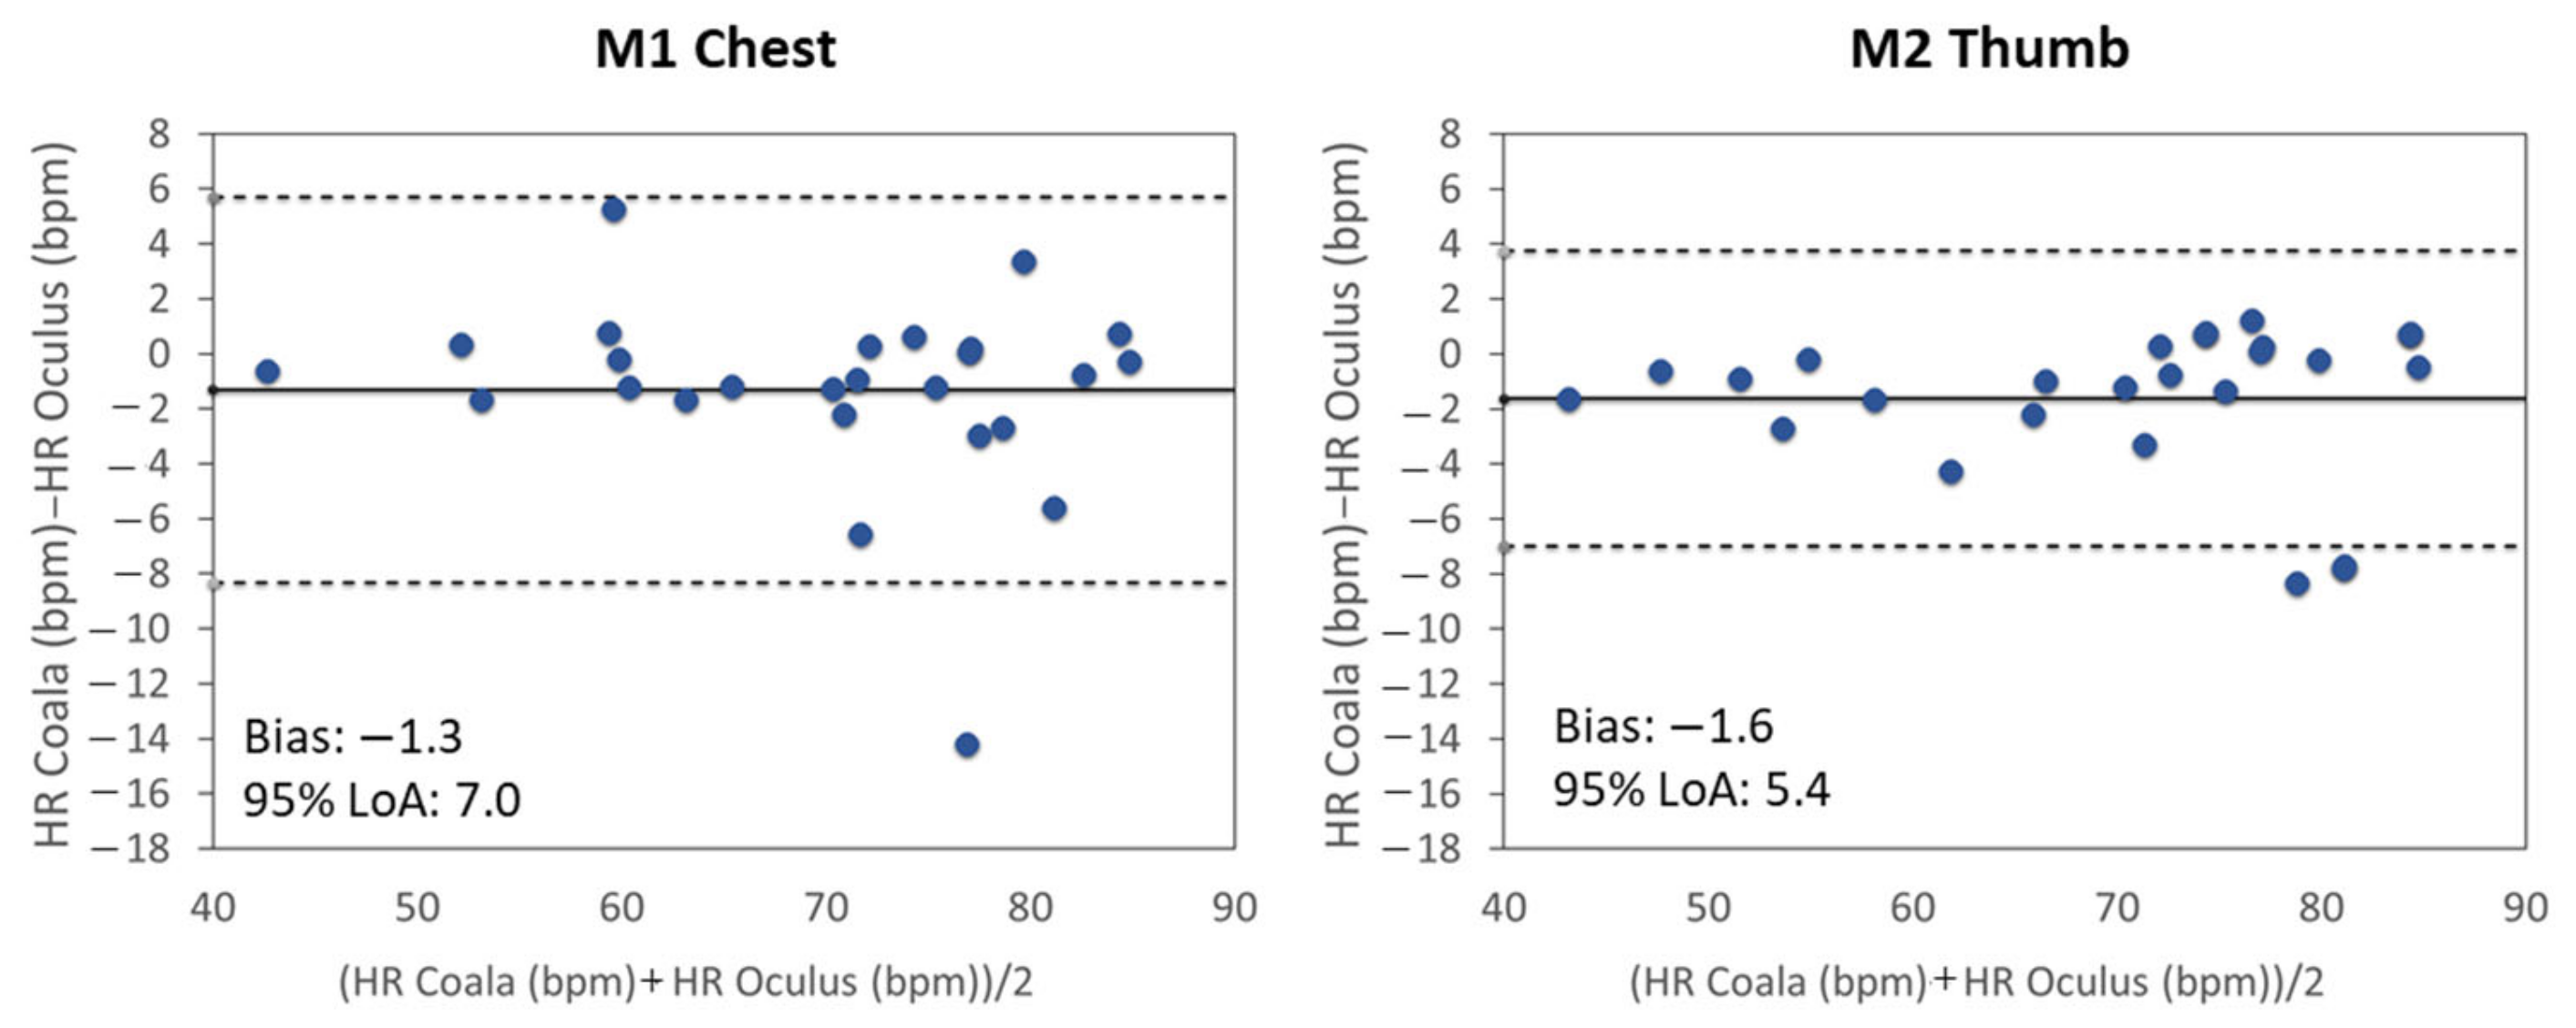
| Adjusted FFT | M1 Chest | 3.4 (19.2) | 0.154 | −0.8 (28) | 0.002 | 5.6 (27.3) | 0.351 | −1.3 (7) | 0.060 | −1.3 (22.6) | 0.037 | 0.2 (19.4) | 0.124 | |
| M2 Thumb | 0.2 (13.7) | 0.001 | −2.4 (36.9) | 0.026 | 4.3 (23) | 0.273 | −1.6 (5.4) | 0.068 | −3.6 (13.1) | 0.127 | 4.3 (21) | 0.146 | ||
| SUP | SIT | STAND | |||||||
|---|---|---|---|---|---|---|---|---|---|
| Reference (breaths/min) | X | Y | Z | X | Y | Z | X | Y | Z |
| 7 | 0 | 0 | 0 | 5 | 4 | 3 | 8 | 7 | 8 |
| 10.5 | 0 | 1 | 1 | 3 | 4 | 5 | 7 | 7 | 11 |
| 14 | 0 | 0 | 0 | 4 | 2 | 5 | 5 | 4 | 6 |
| Total Number of discarded acquisition | 2 | 35 | 63 | ||||||
| SUP (N = 88) | SIT (N = 55) | STAND (N = 27) | |||||||
|---|---|---|---|---|---|---|---|---|---|
| Reference (breaths/min) | X | Y | Z | X | Y | Z | X | Y | Z |
| 7 | 7 (7; 7) | 7 (7; 10) | 7 (6; 9) | 7 (7; 7) | 7 (6; 9) | 10 (7; 12) | 7 (7; 9) | 7 (5; 8) | 7 (7; 12) |
| 10.5 | 10 (10; 11) | 10 (9; 11) | 10 (9; 11) | 10 (10; 11) | 10 (9; 11) | 10 (10; 11) | 10 (10; 11) | 10 (1; 10) | 10 (10; 13) |
| 14 | 14 (14; 14) | 11 (9; 14) | 11 (6; 14) | 14 (14; 14) | 14 (9; 14) | 14 (8; 14) | 14 (14; 15) | 12 (7; 14) | 14 (10; 14) |
| SUP (N = 88) | SIT (N = 55) | STAND (N = 27) | |||||||
|---|---|---|---|---|---|---|---|---|---|
| Reference (breaths/min) | X | Y | Z | X | Y | Z | X | Y | Z |
| 7 | 0.5 (0.5; 0.8) | 1.7 (0.5; 6.7) | 1.7 (0.5; 3.3) | 0.5 (0.5; 1.7) | 1.1 (0.5; 3.7) | 4.2 (0.8; 5.6) | 0.6 (0.5; 2.5) | 1.4 (0.5; 3.2) | 0.8 (0.5; 5.1) |
| 10.5 | 0.6 (0.5; 0.7) | 0.7 (0.5; 3.0) | 1.8 (0.7; 4.3) | 0.5 (0.5; 1.8) | 1.8 (0.5; 4.3) | 0.7 (0.5; 2.0) | 0.7 (0.5; 1.9) | 0.7 (0.5; 4.9) | 0.7 (0.5; 3.7) |
| 14 | 0.3 (0.3; 0.9) | 2.8 (0.3; 5.3) | 2.8 (0.3; 7.8) | 0.3 (0.3; 0.3) | 1.3 (0.3; 5.3) | 1.2 (0.3; 5.6) | 0.3 (0.3; 1.6) | 1.3 (0.3; 6.4) | 1.5 (0.3; 4.4) |
Publisher’s Note: MDPI stays neutral with regard to jurisdictional claims in published maps and institutional affiliations. |
© 2020 by the authors. Licensee MDPI, Basel, Switzerland. This article is an open access article distributed under the terms and conditions of the Creative Commons Attribution (CC BY) license (http://creativecommons.org/licenses/by/4.0/).
Share and Cite
Floris, C.; Solbiati, S.; Landreani, F.; Damato, G.; Lenzi, B.; Megale, V.; Caiani, E.G. Feasibility of Heart Rate and Respiratory Rate Estimation by Inertial Sensors Embedded in a Virtual Reality Headset. Sensors 2020, 20, 7168. https://doi.org/10.3390/s20247168
Floris C, Solbiati S, Landreani F, Damato G, Lenzi B, Megale V, Caiani EG. Feasibility of Heart Rate and Respiratory Rate Estimation by Inertial Sensors Embedded in a Virtual Reality Headset. Sensors. 2020; 20(24):7168. https://doi.org/10.3390/s20247168
Chicago/Turabian StyleFloris, Claudia, Sarah Solbiati, Federica Landreani, Gianfranco Damato, Bruno Lenzi, Valentino Megale, and Enrico Gianluca Caiani. 2020. "Feasibility of Heart Rate and Respiratory Rate Estimation by Inertial Sensors Embedded in a Virtual Reality Headset" Sensors 20, no. 24: 7168. https://doi.org/10.3390/s20247168
APA StyleFloris, C., Solbiati, S., Landreani, F., Damato, G., Lenzi, B., Megale, V., & Caiani, E. G. (2020). Feasibility of Heart Rate and Respiratory Rate Estimation by Inertial Sensors Embedded in a Virtual Reality Headset. Sensors, 20(24), 7168. https://doi.org/10.3390/s20247168