A Bronchoscope Localization Method Using an Augmented Reality Co-Display of Real Bronchoscopy Images with a Virtual 3D Bronchial Tree Model


Abstract
1. Introduction
2. Method
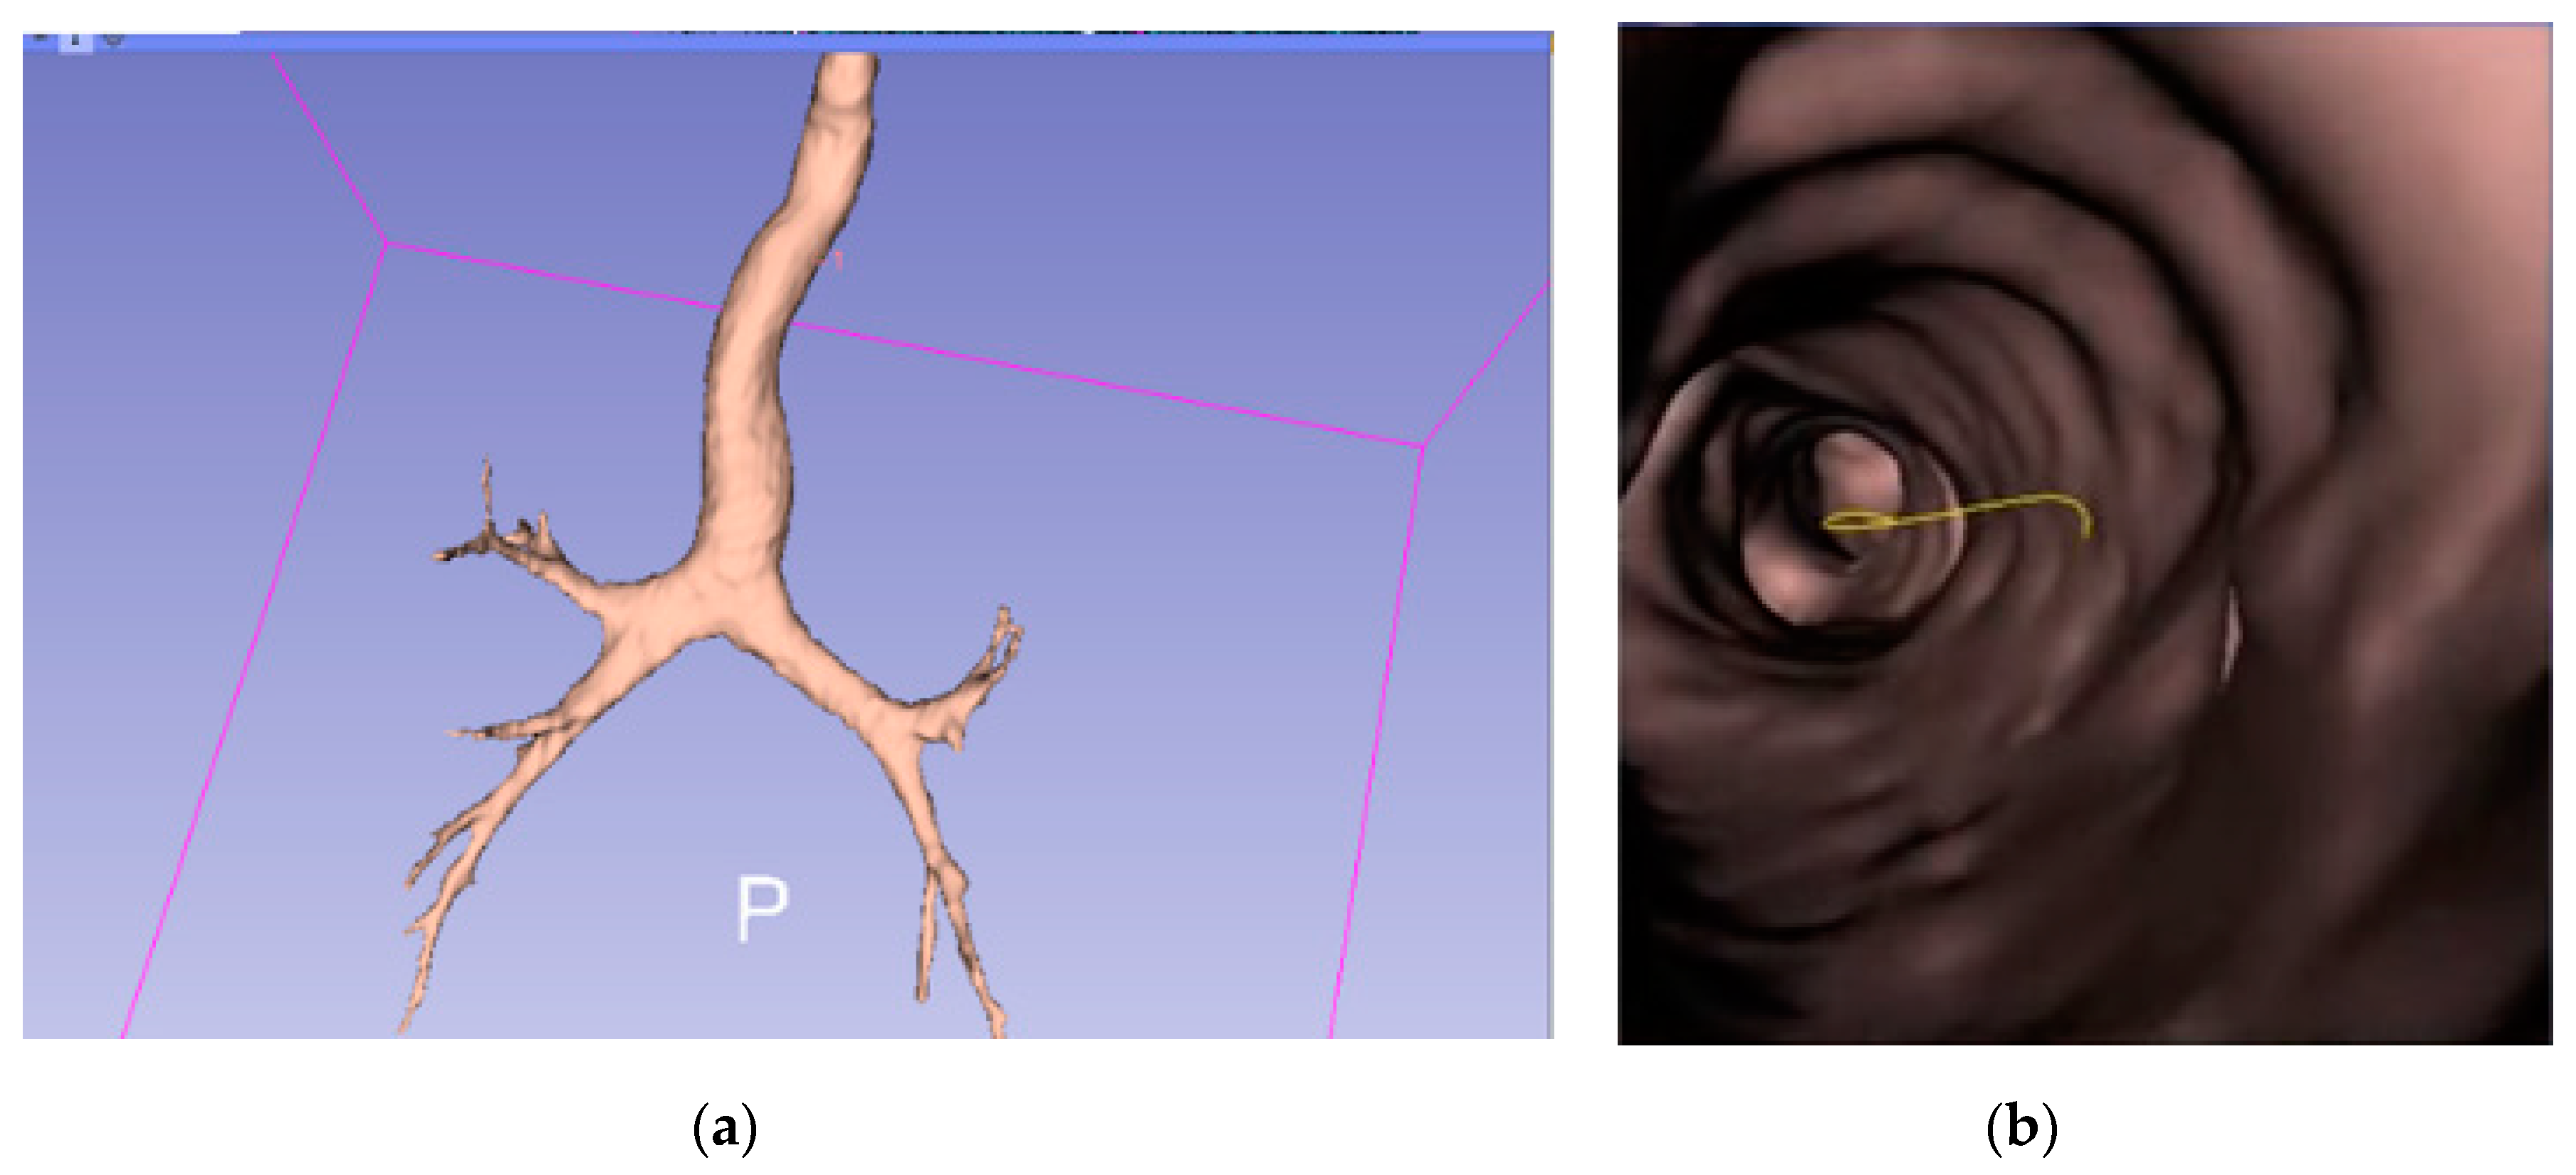
2.1. Construction of 3D Bronchial Tree Model
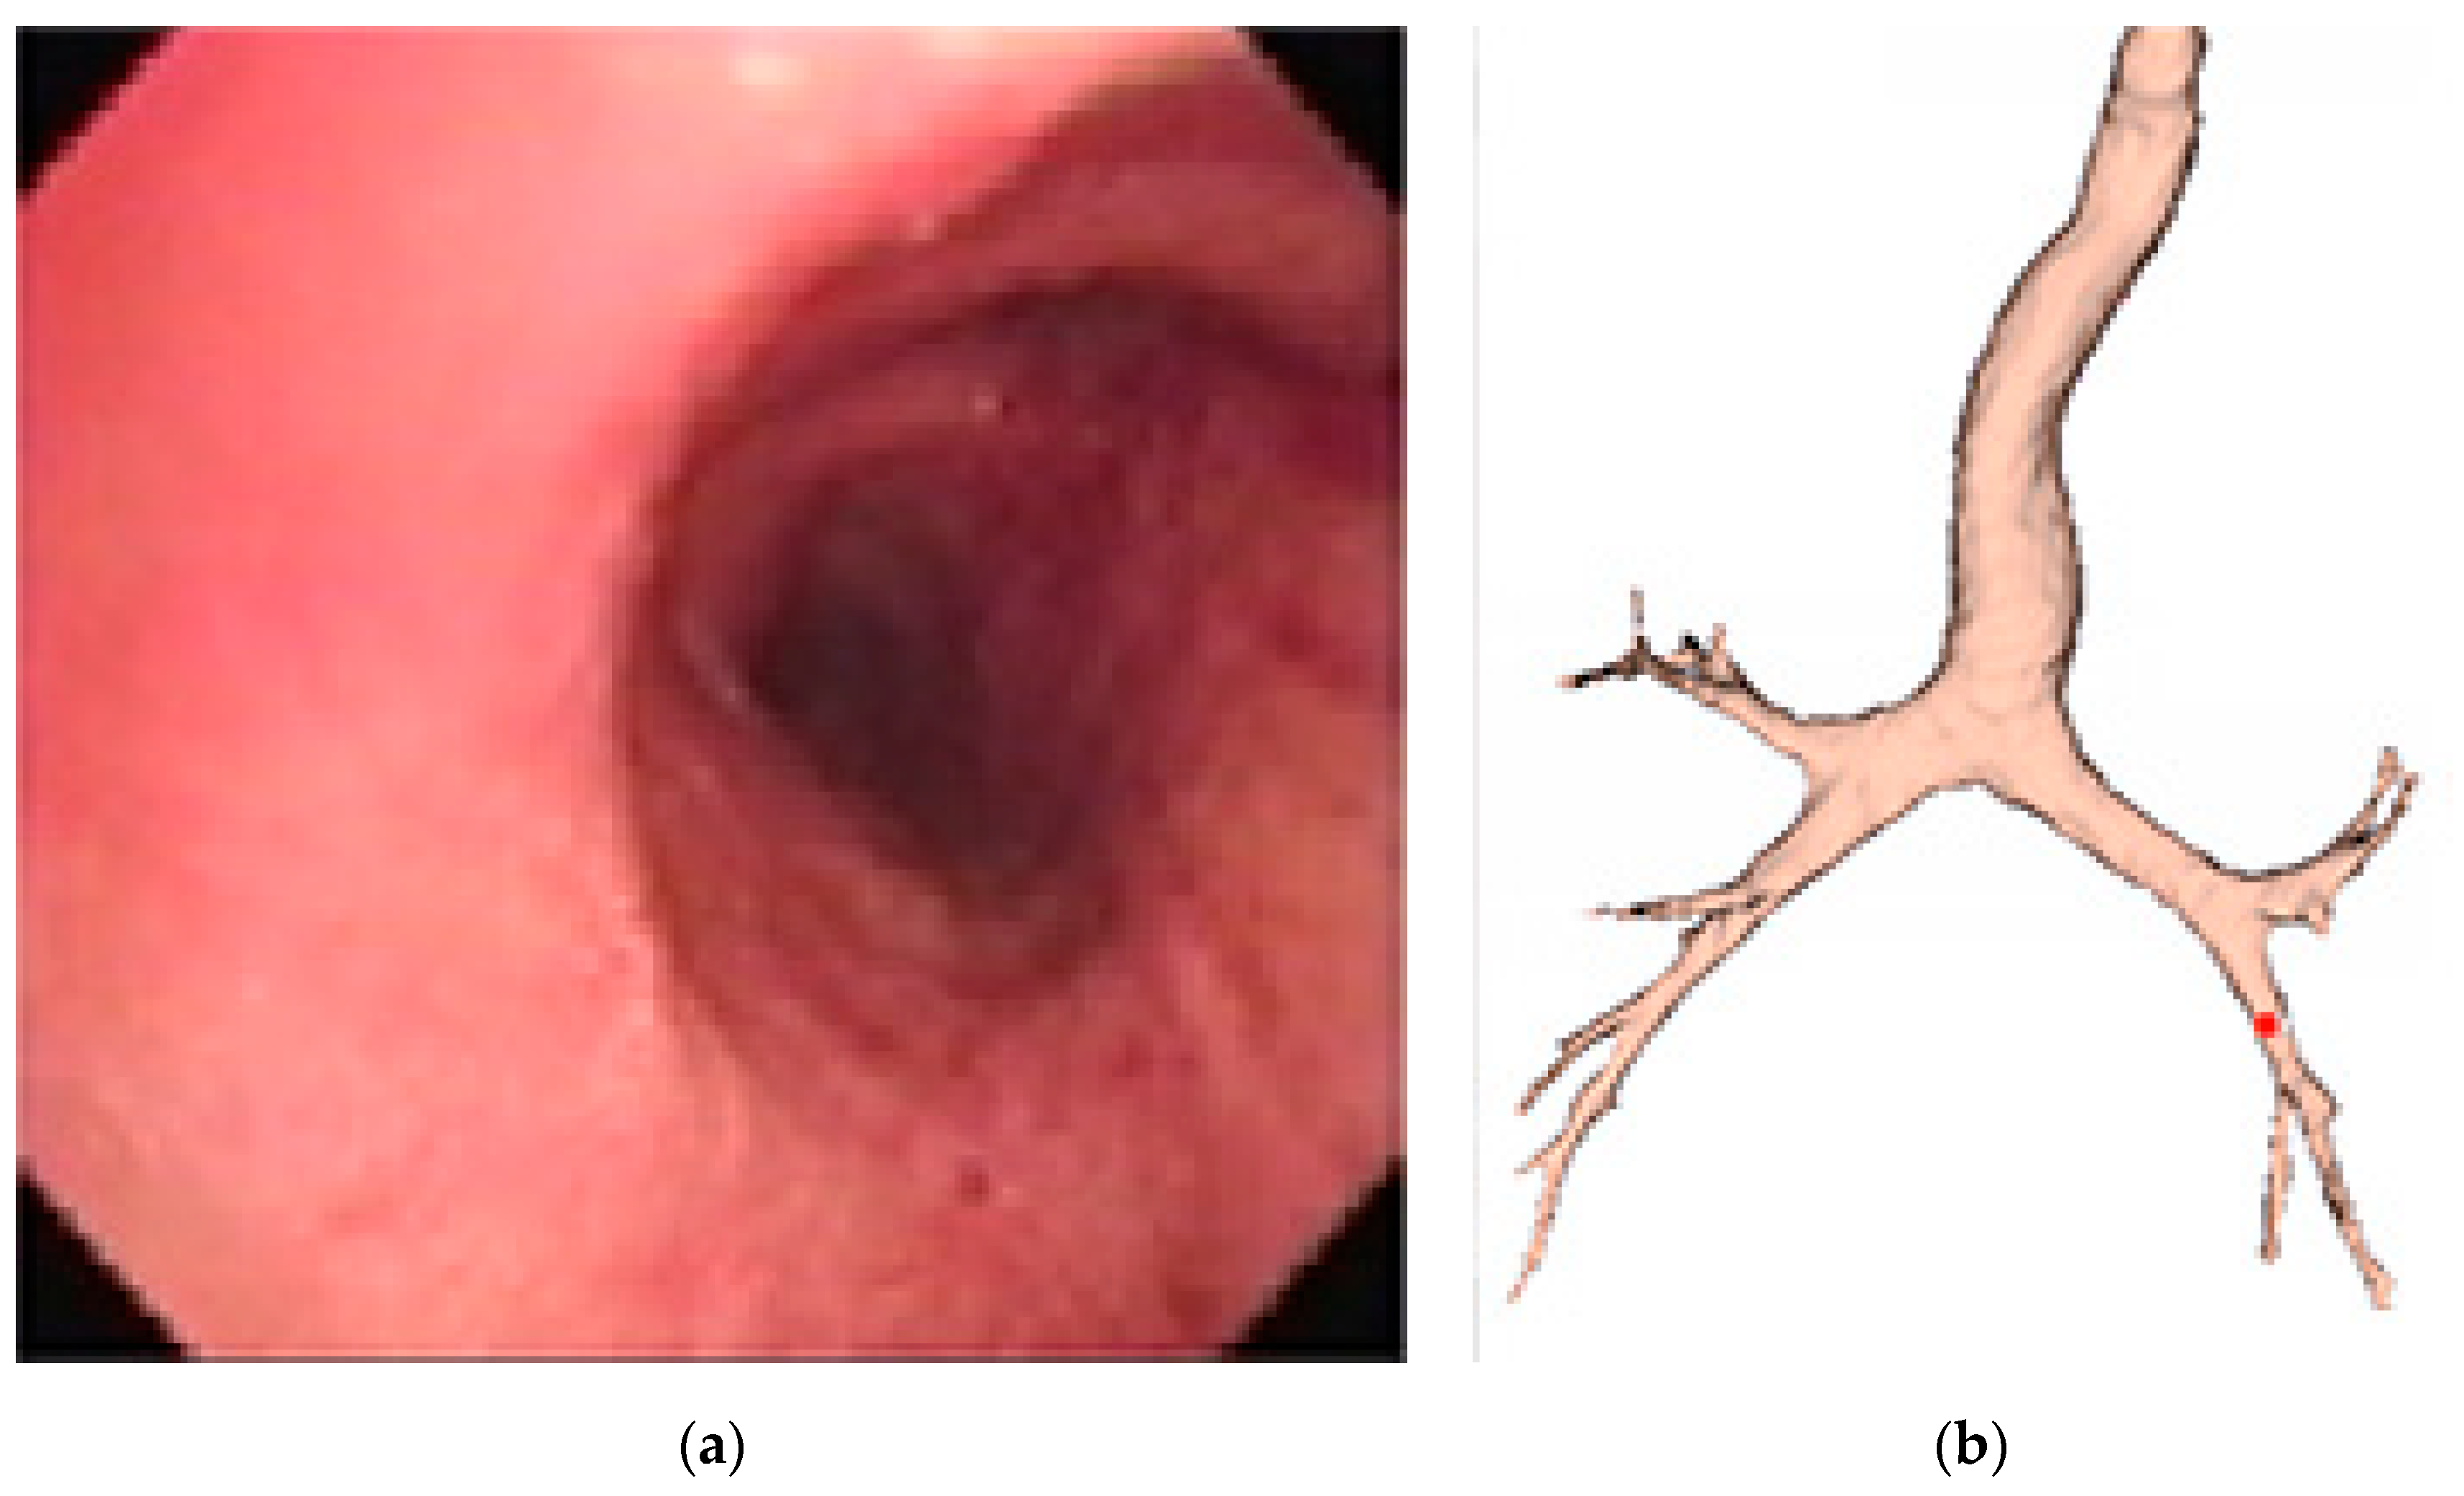
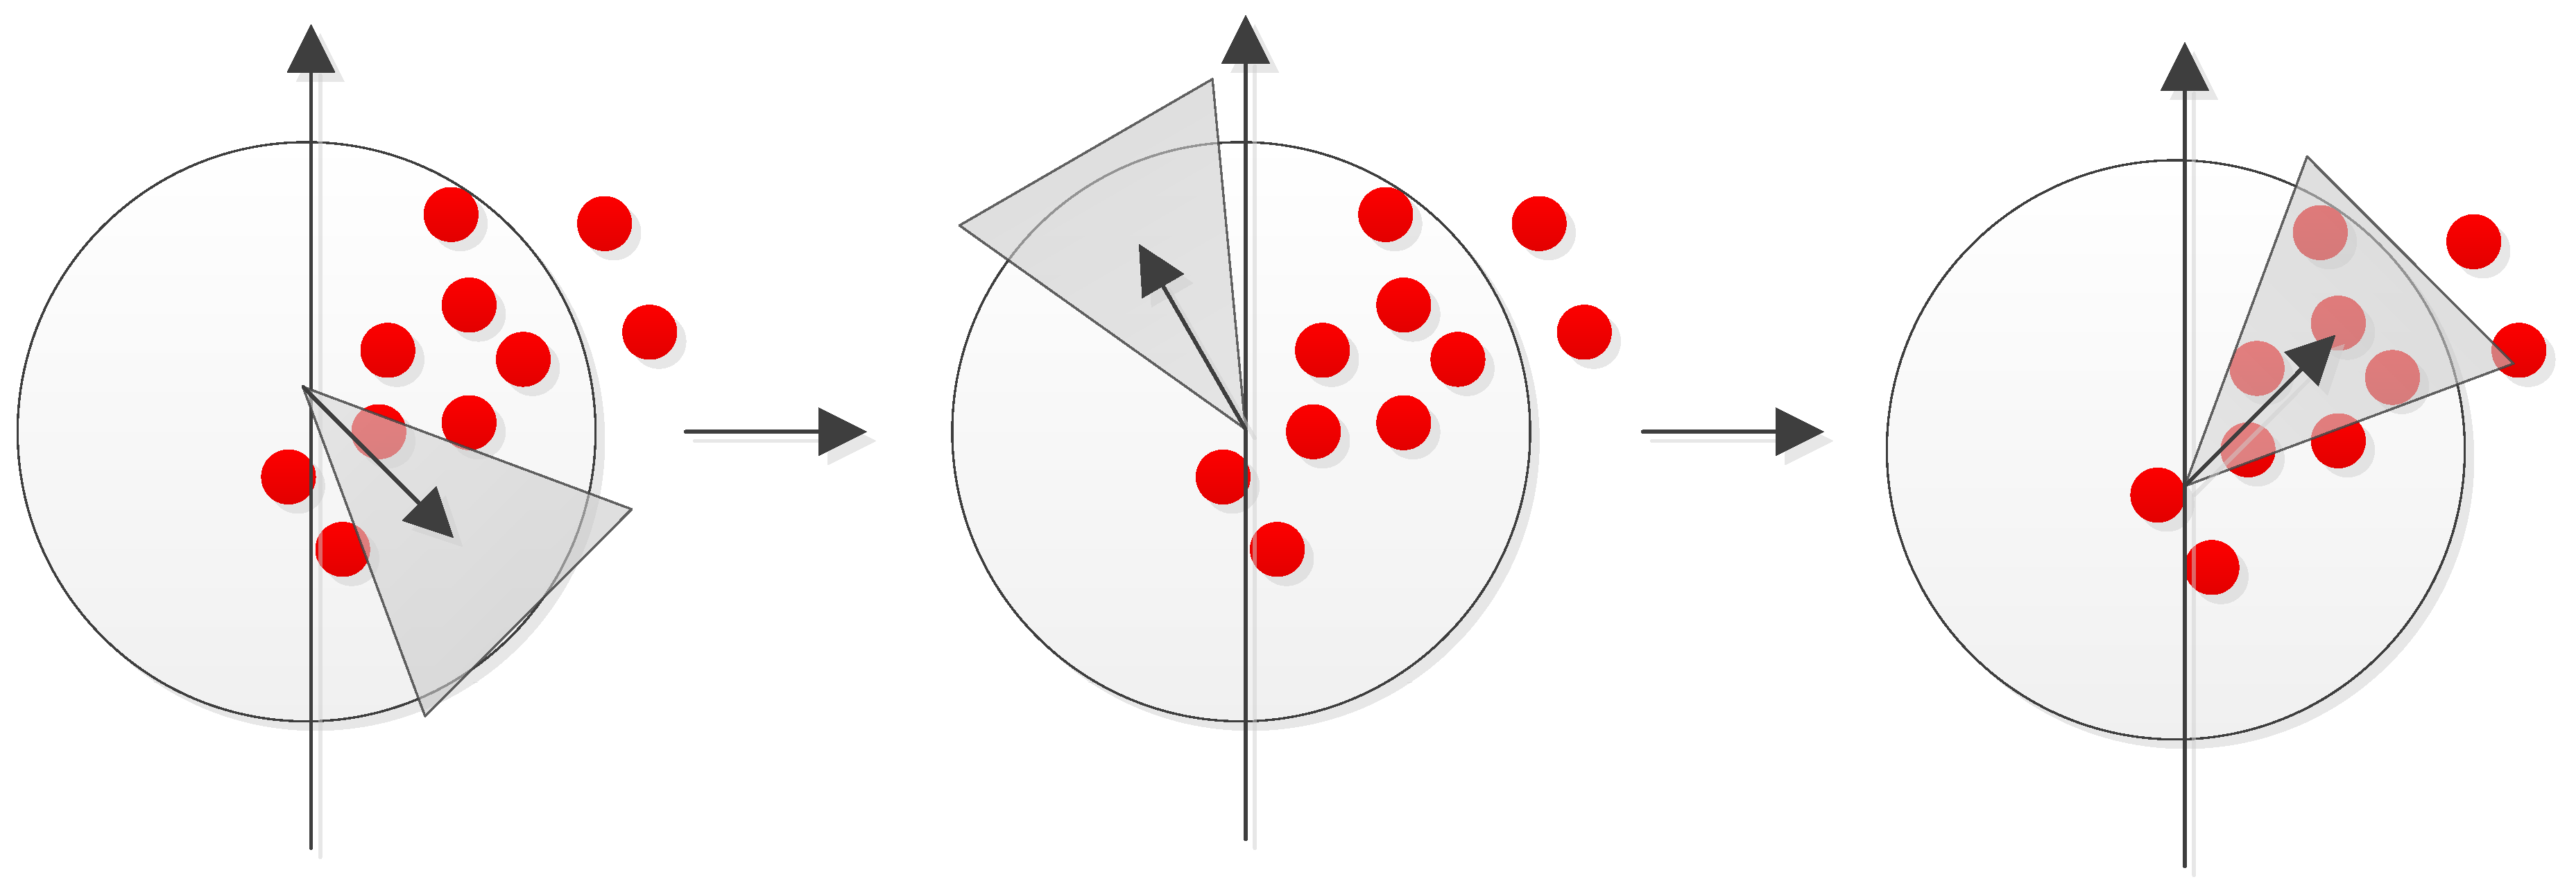
2.2. Position Tracking
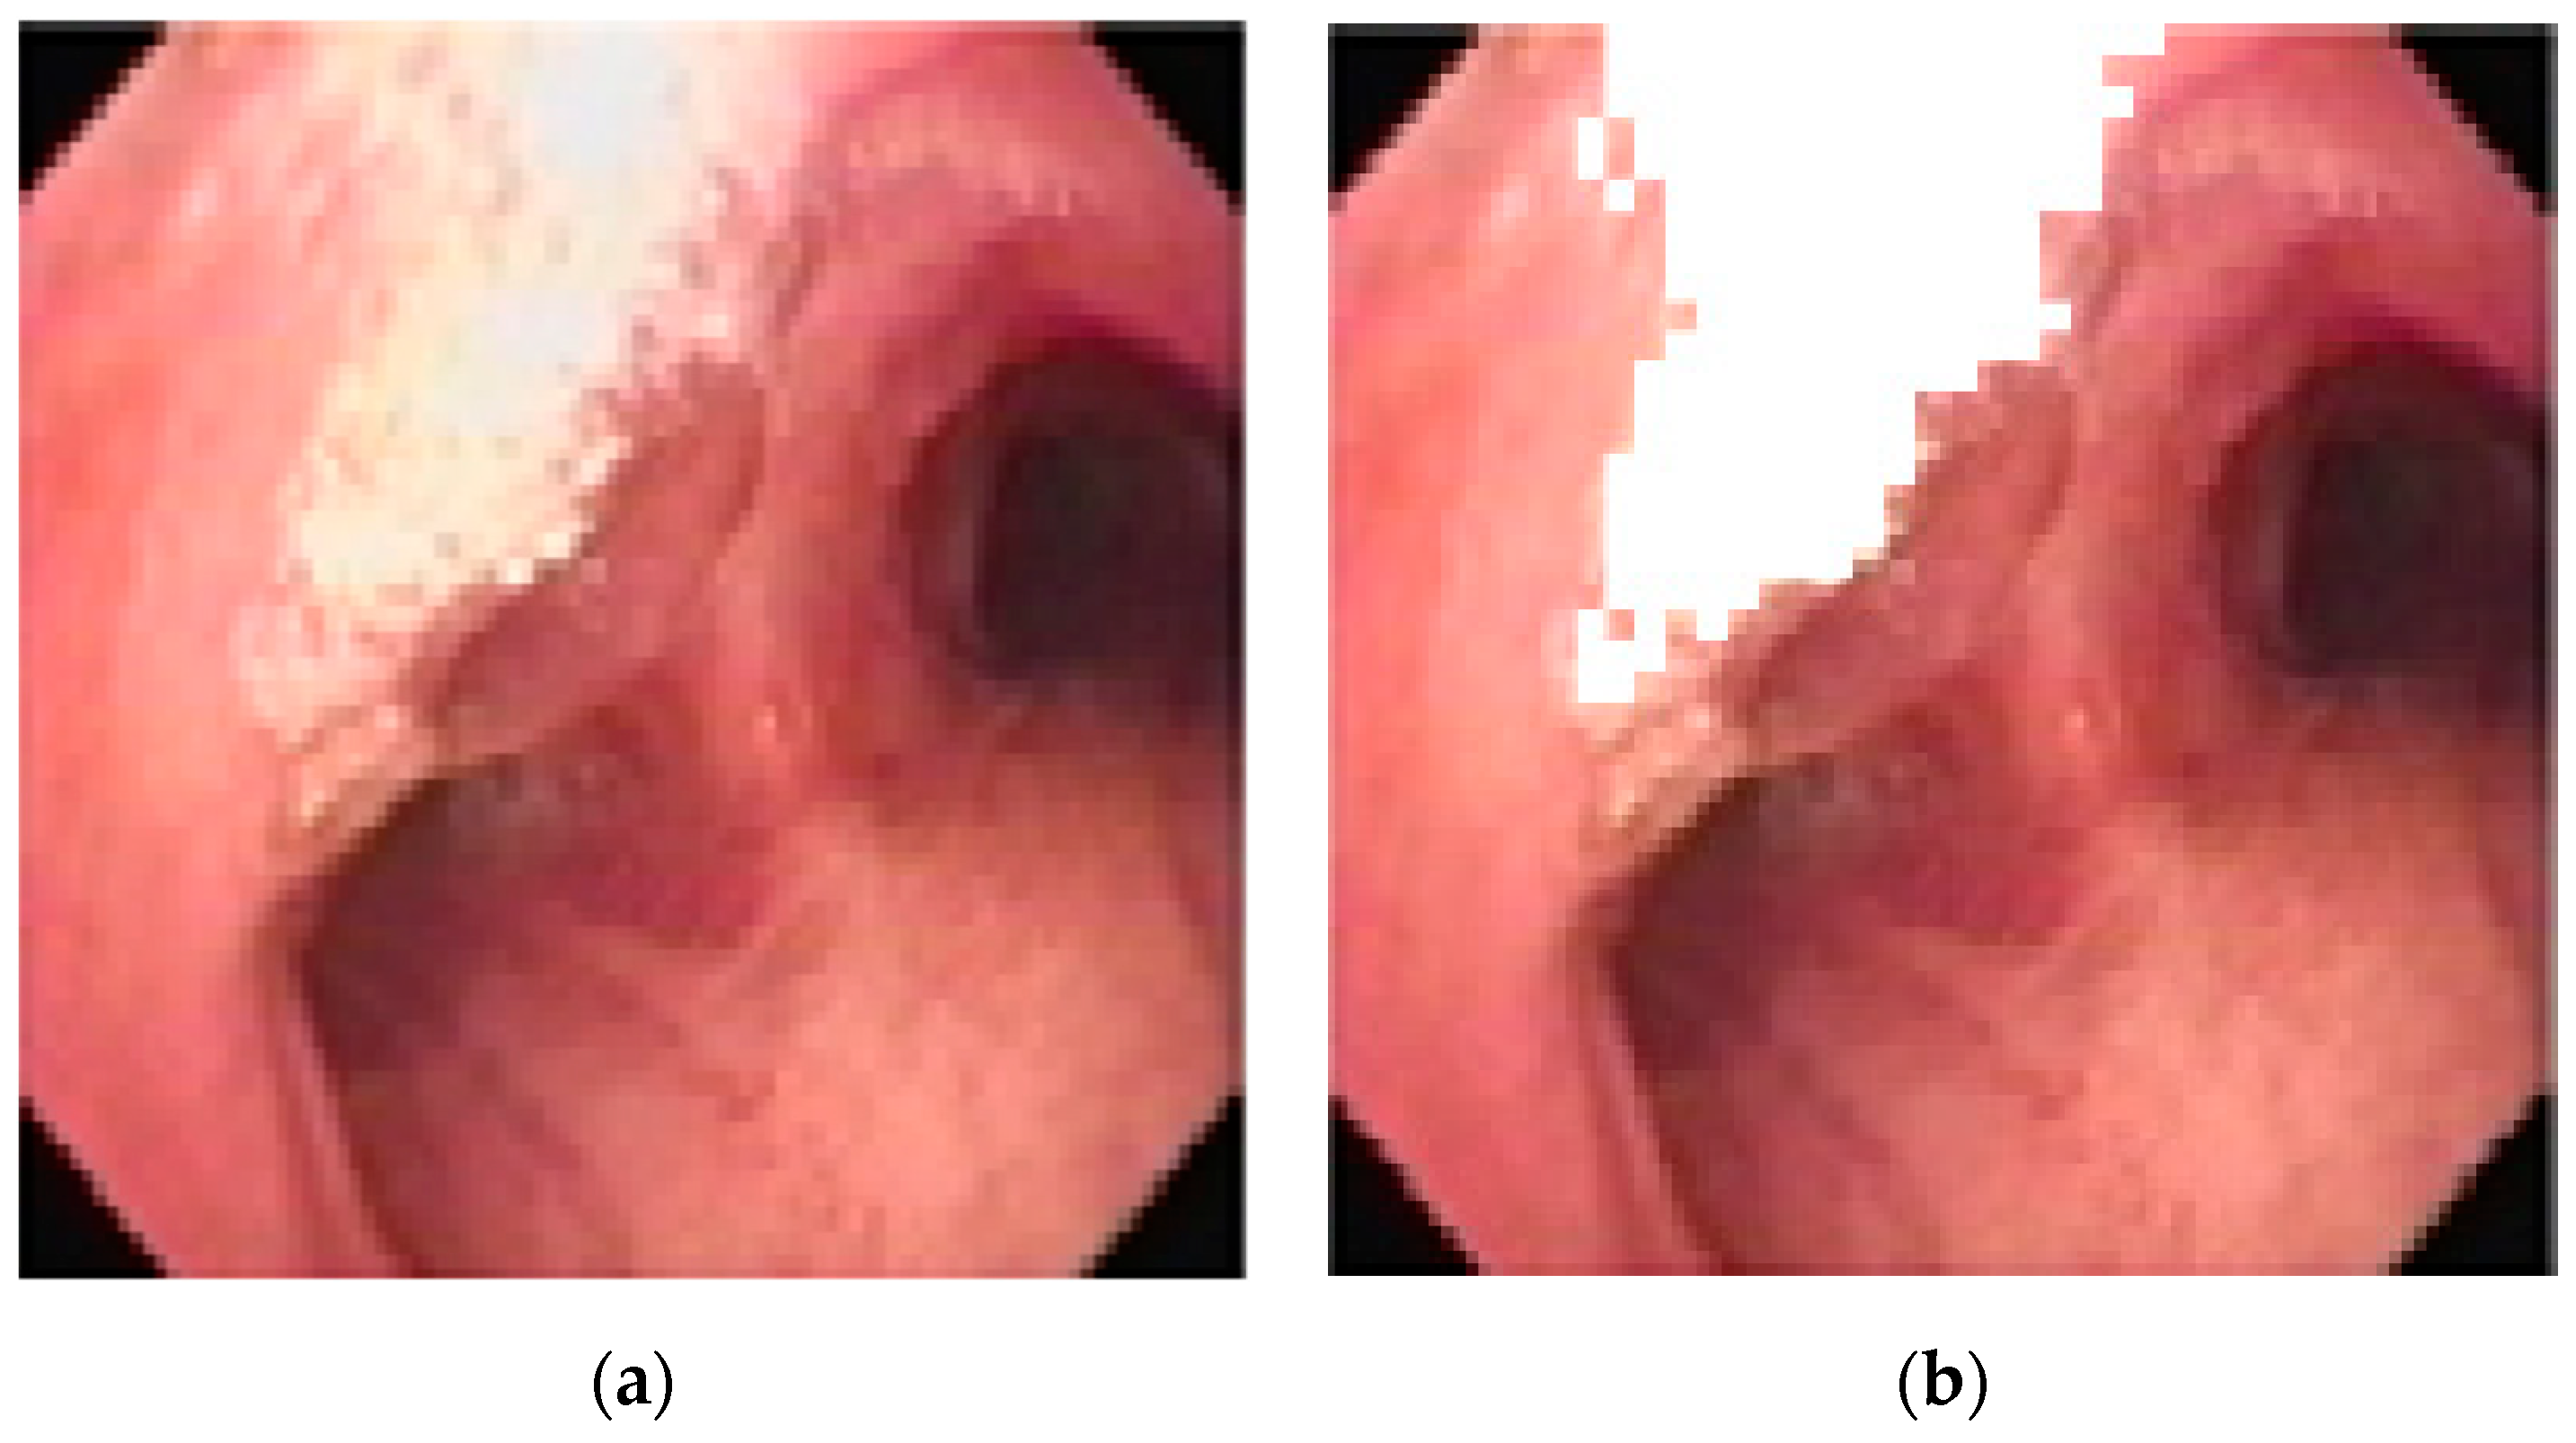
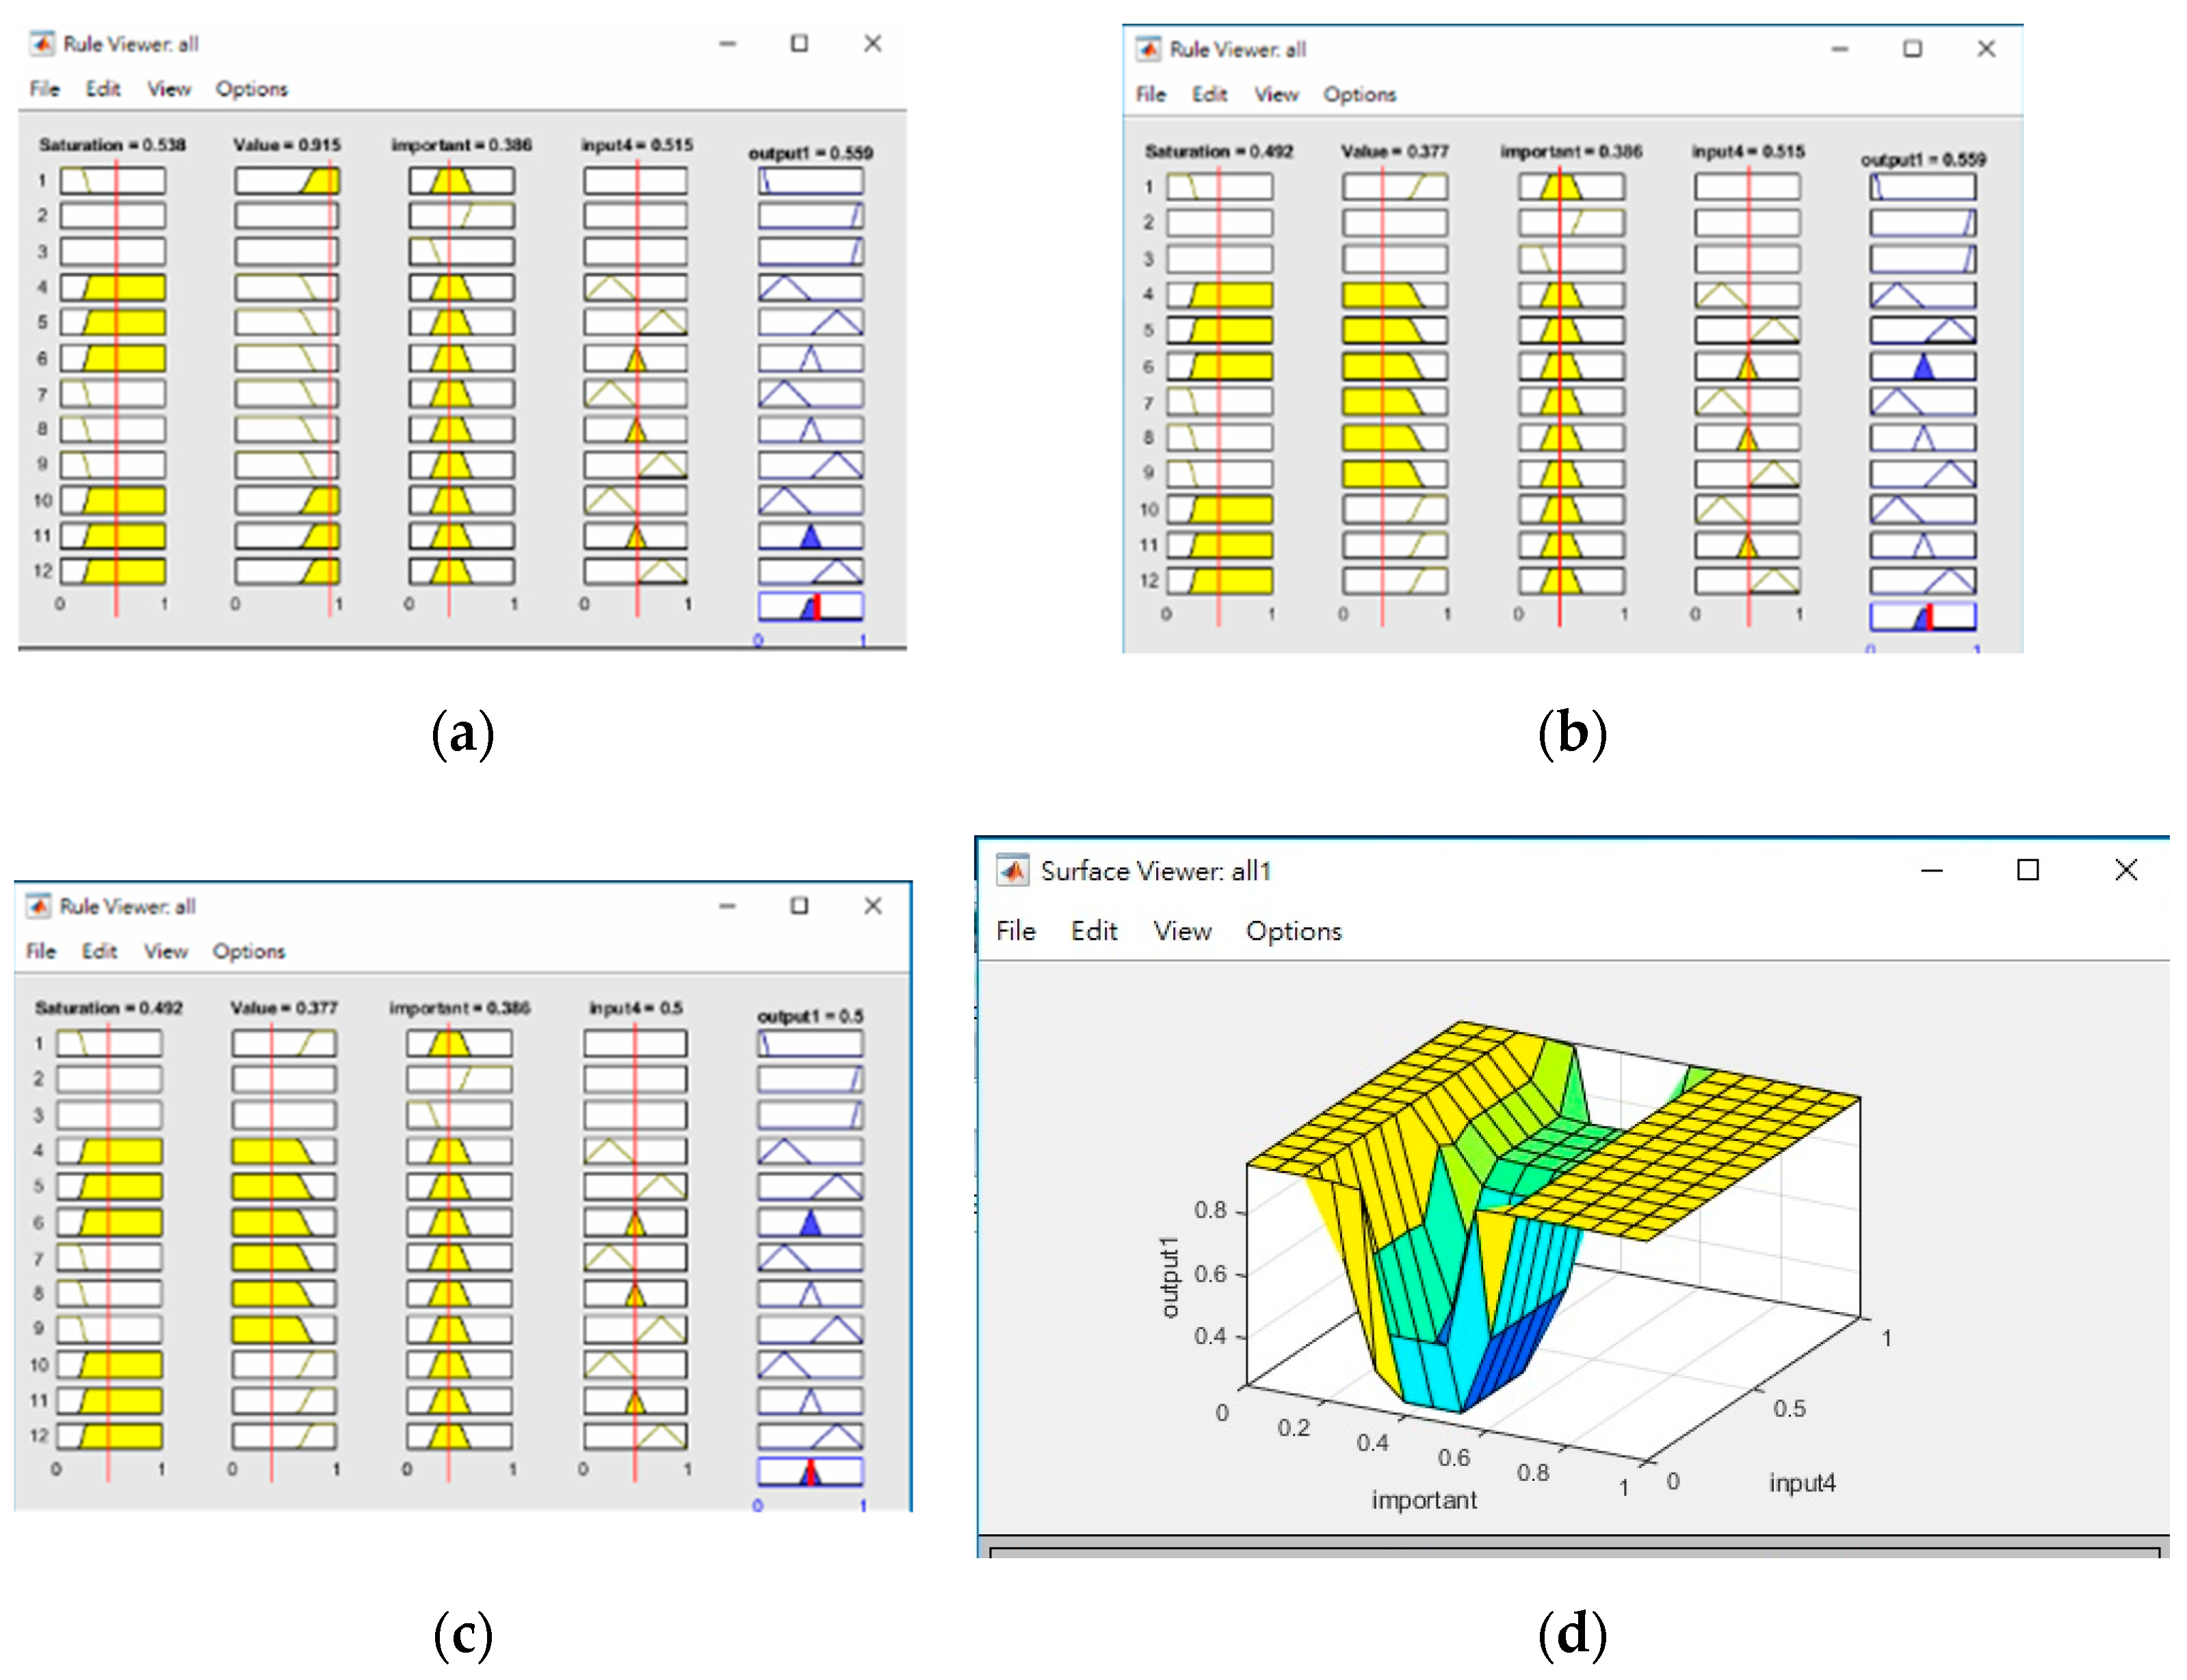
2.3. Position Verification
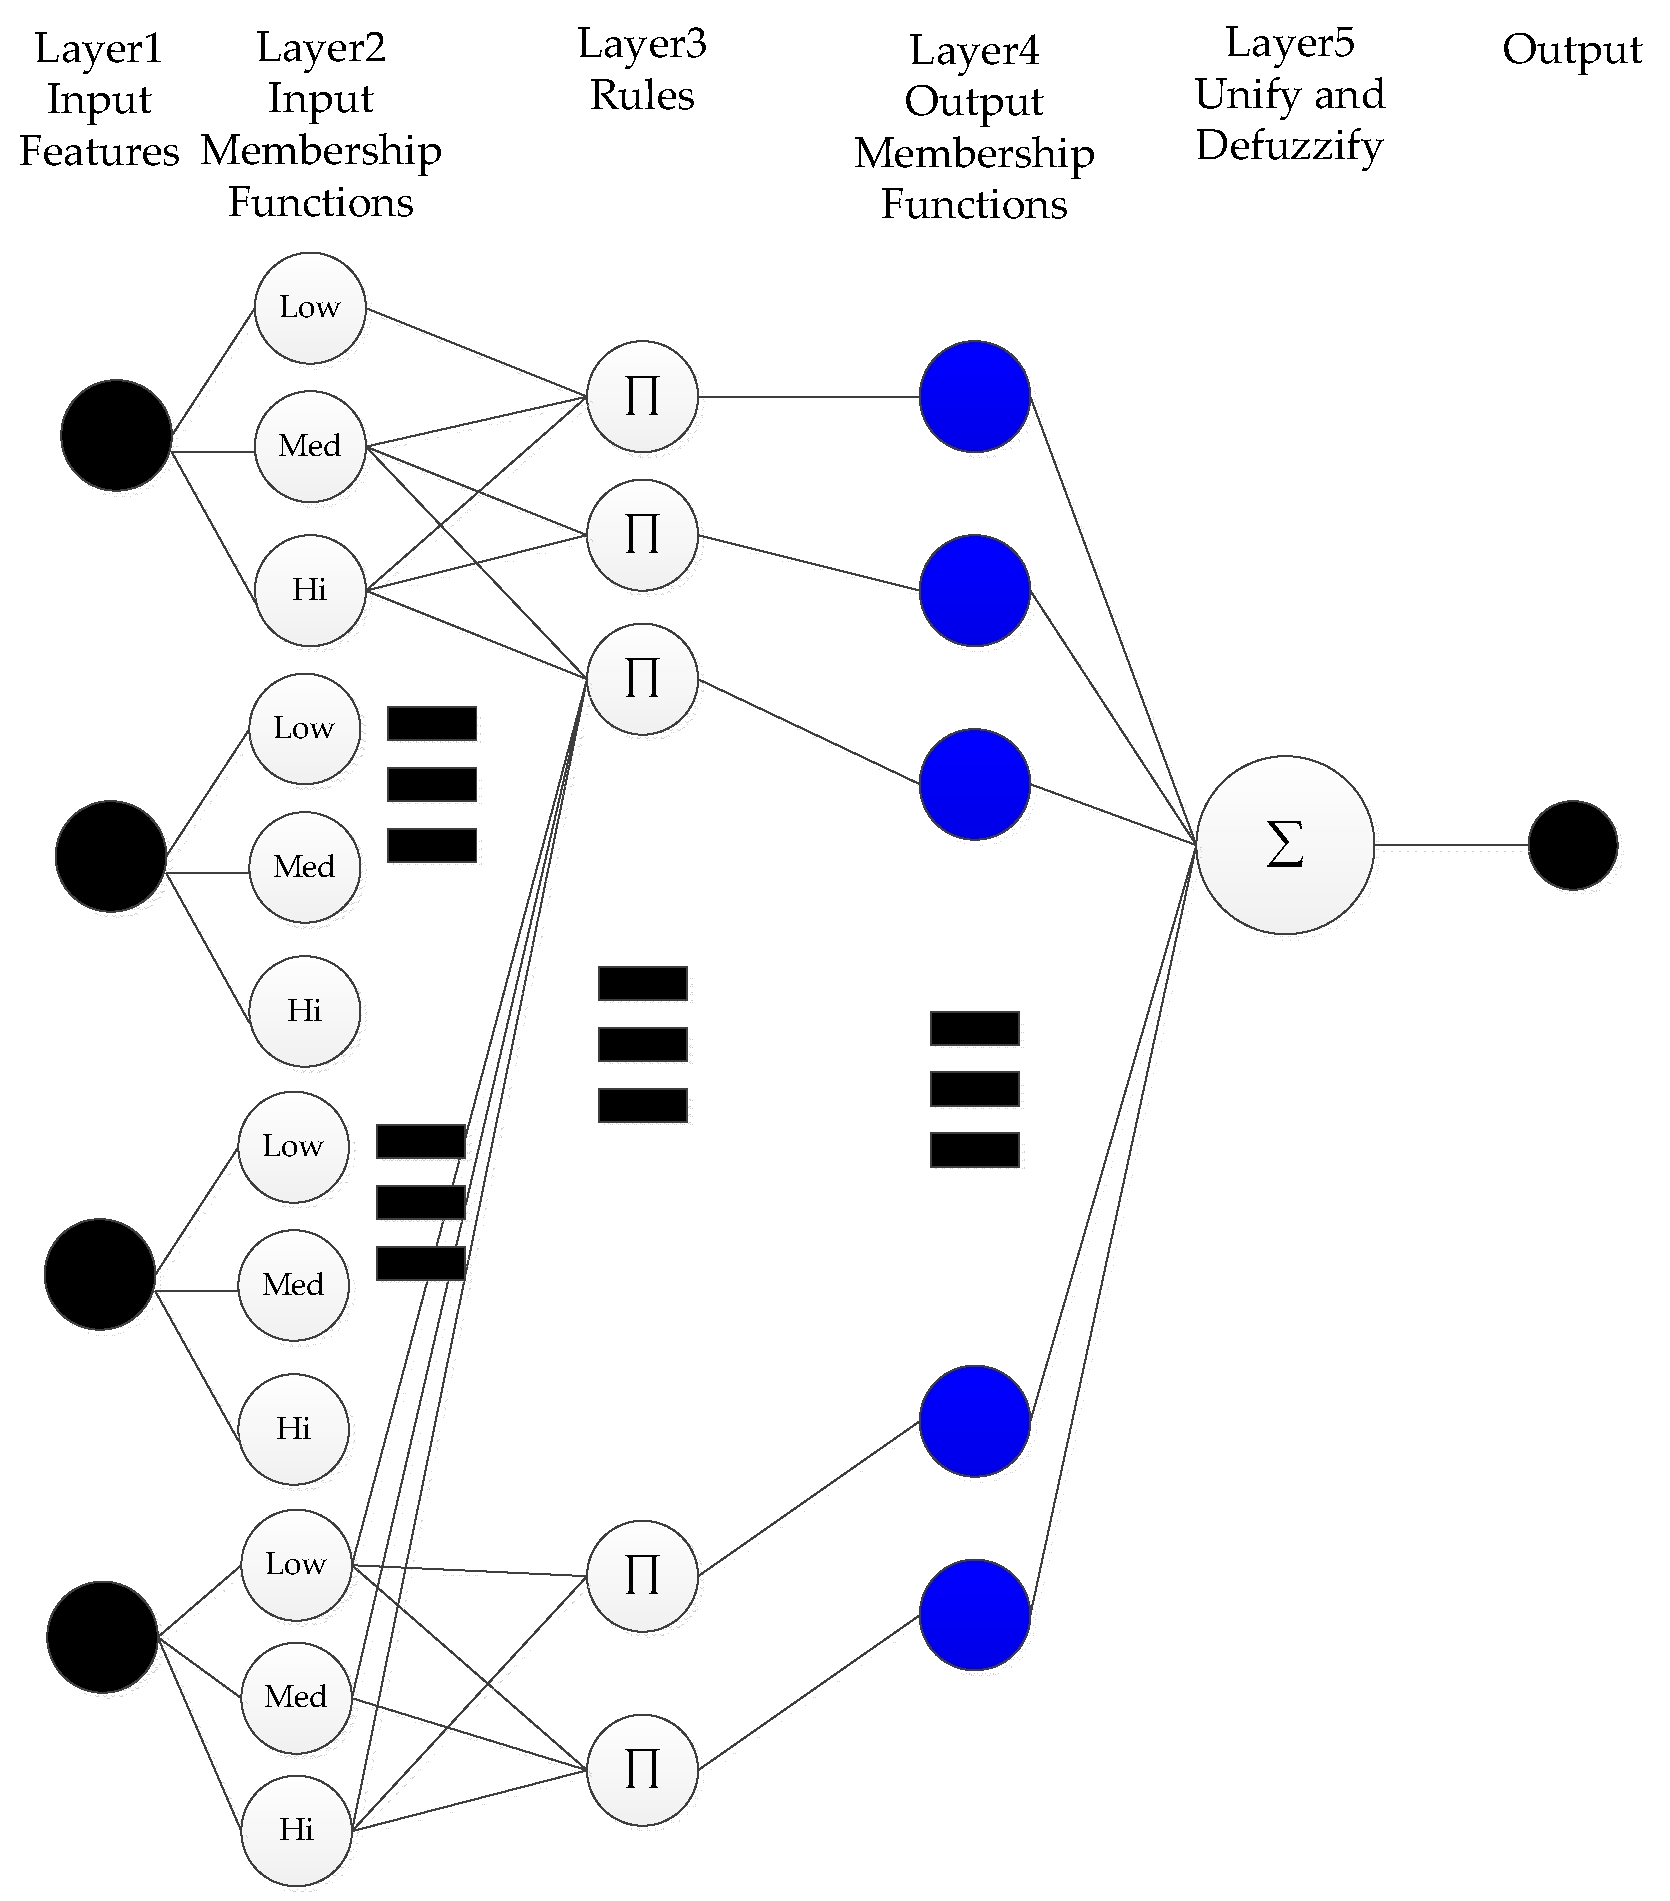
2.4. Preliminary Study of a Hidden Markov Model-Based Path Planner
3. Results
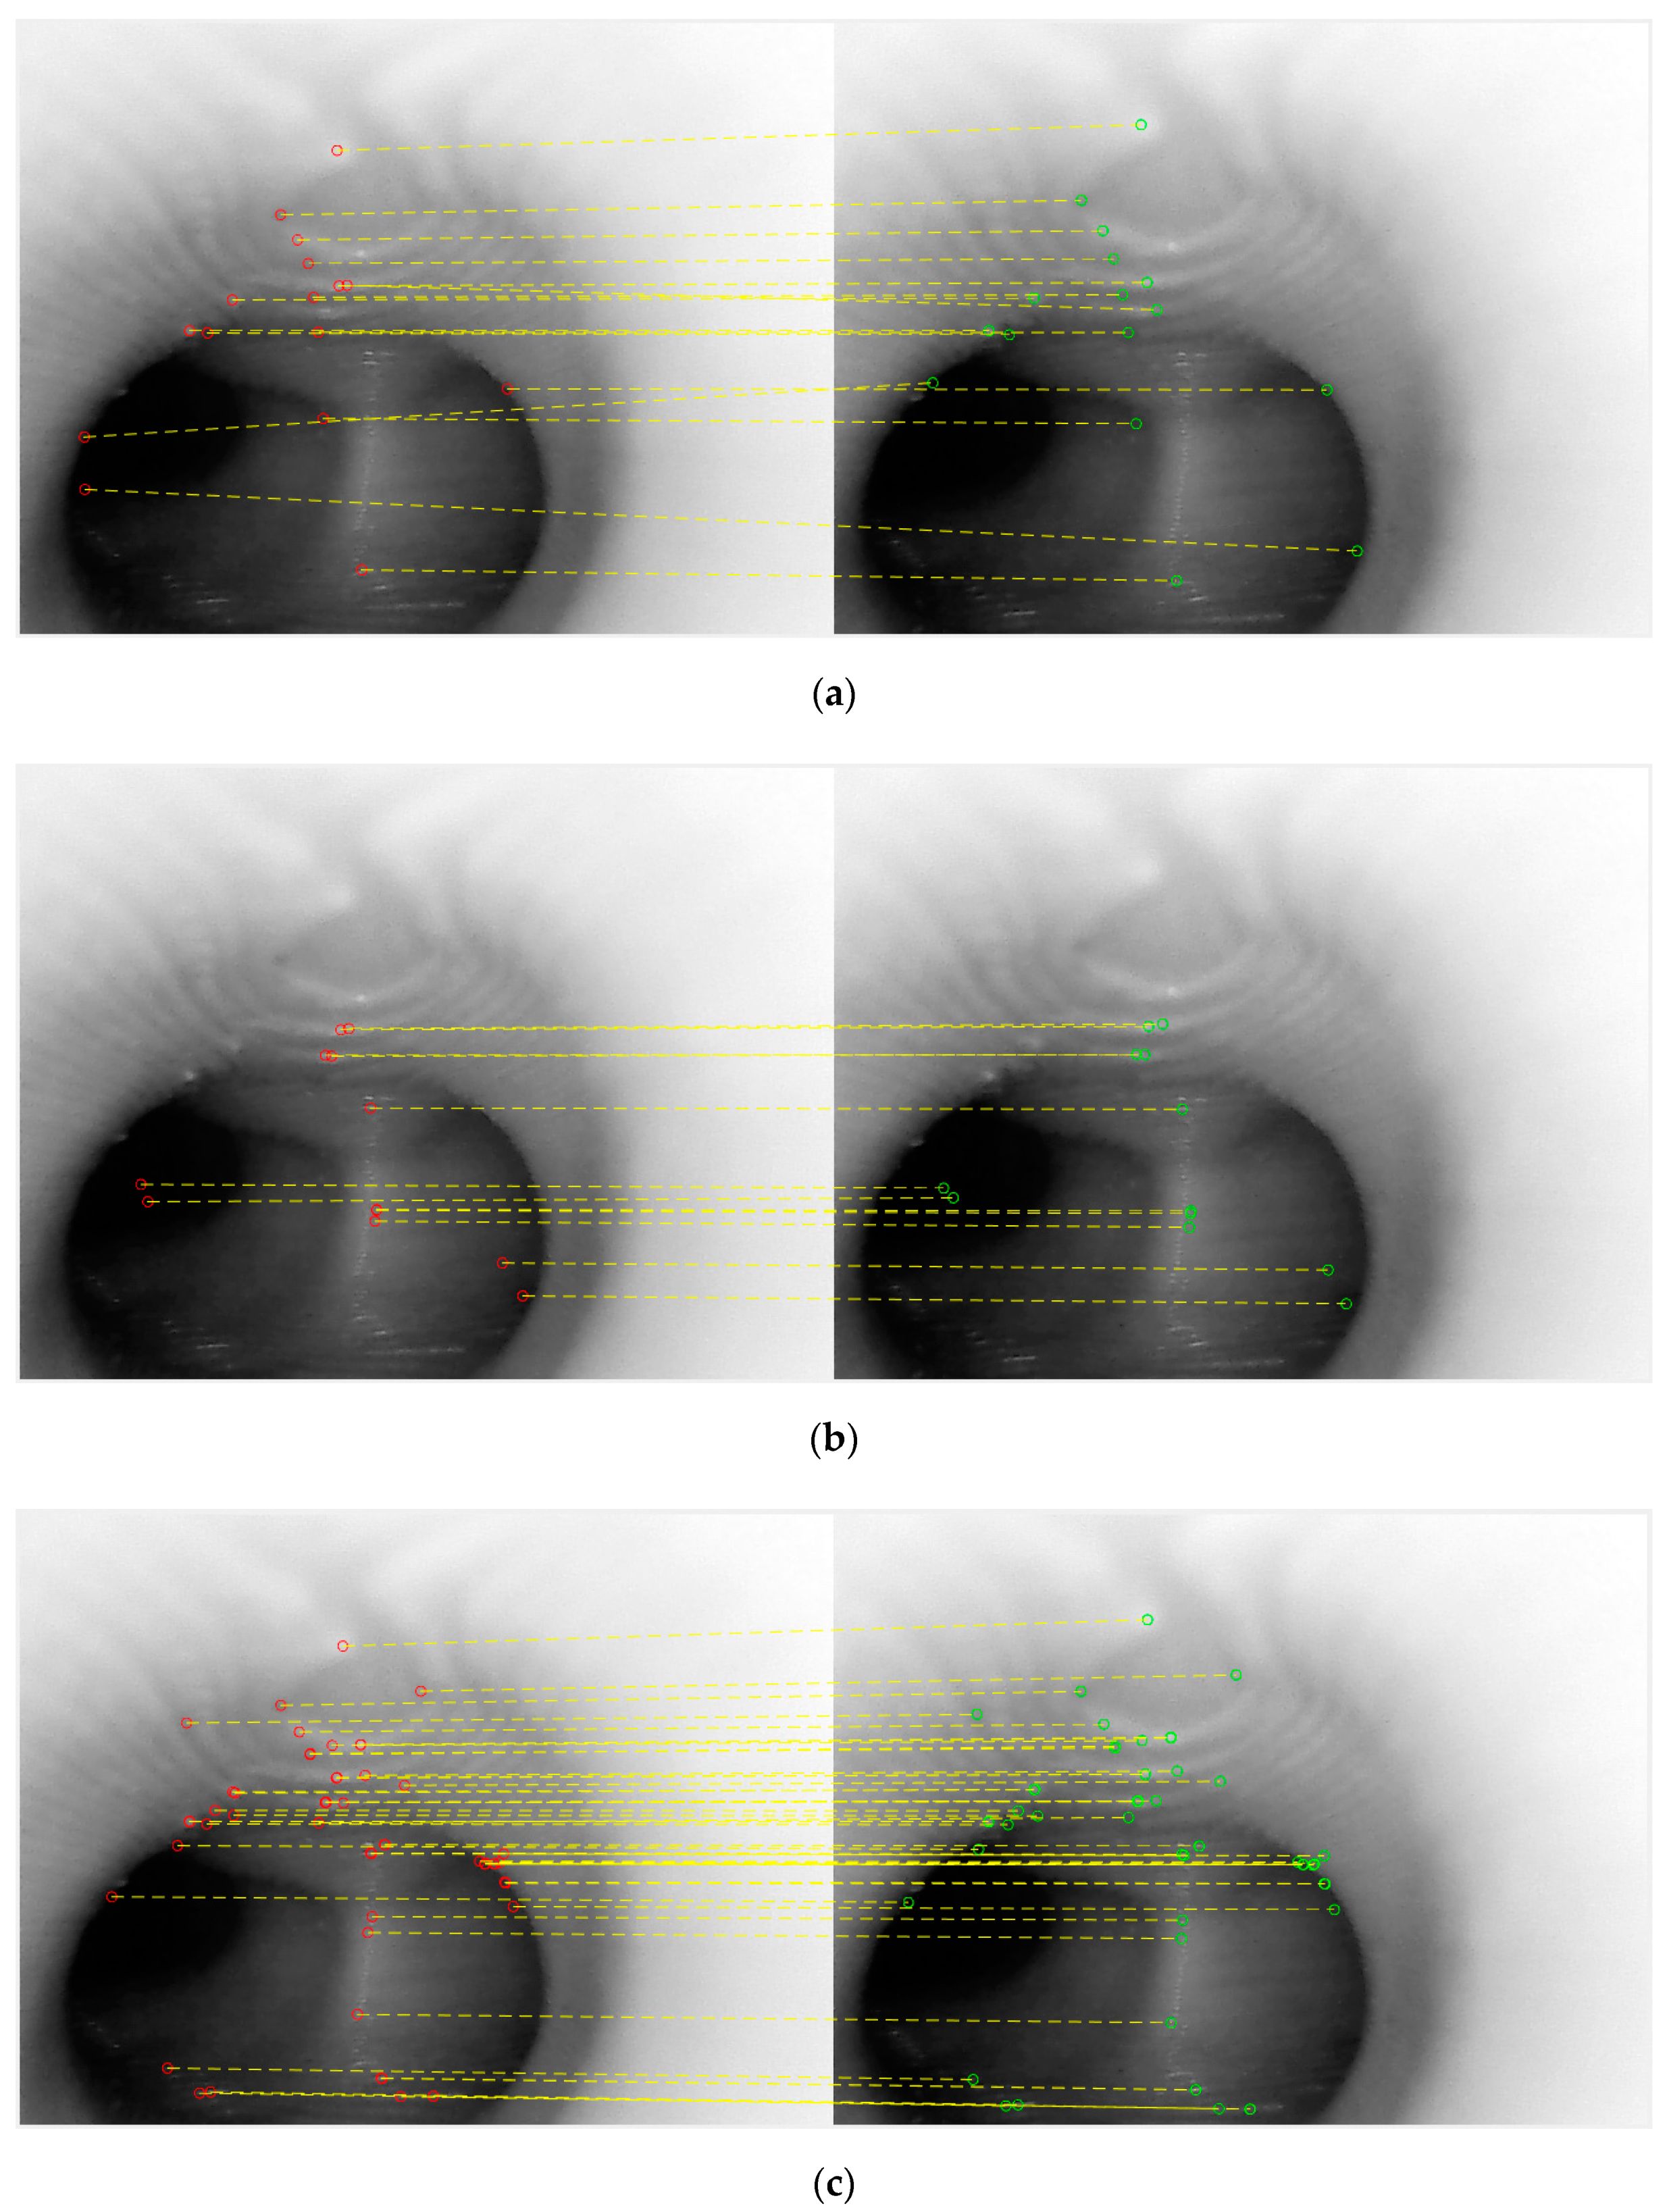
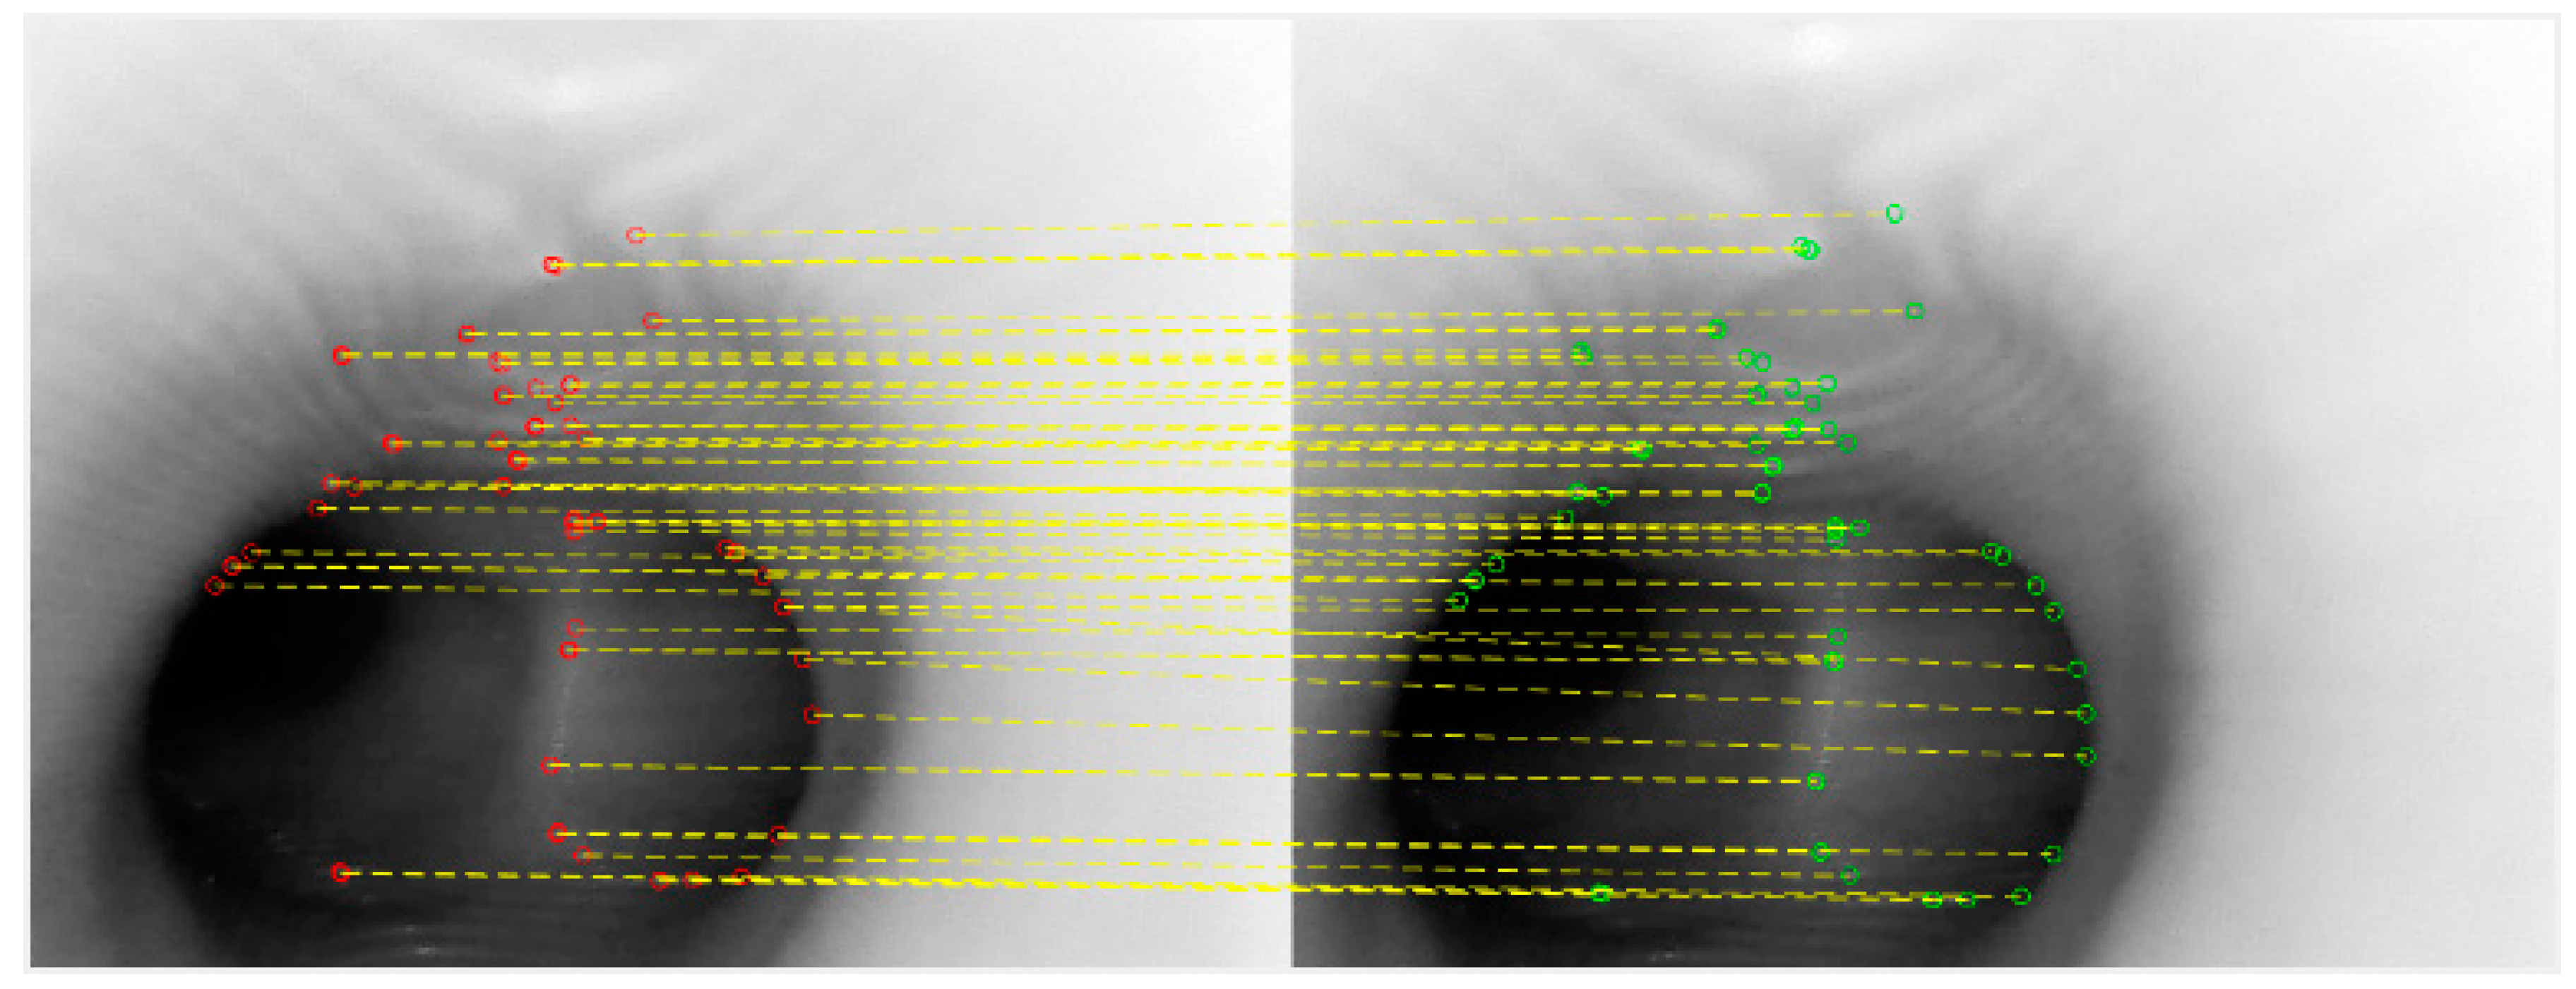
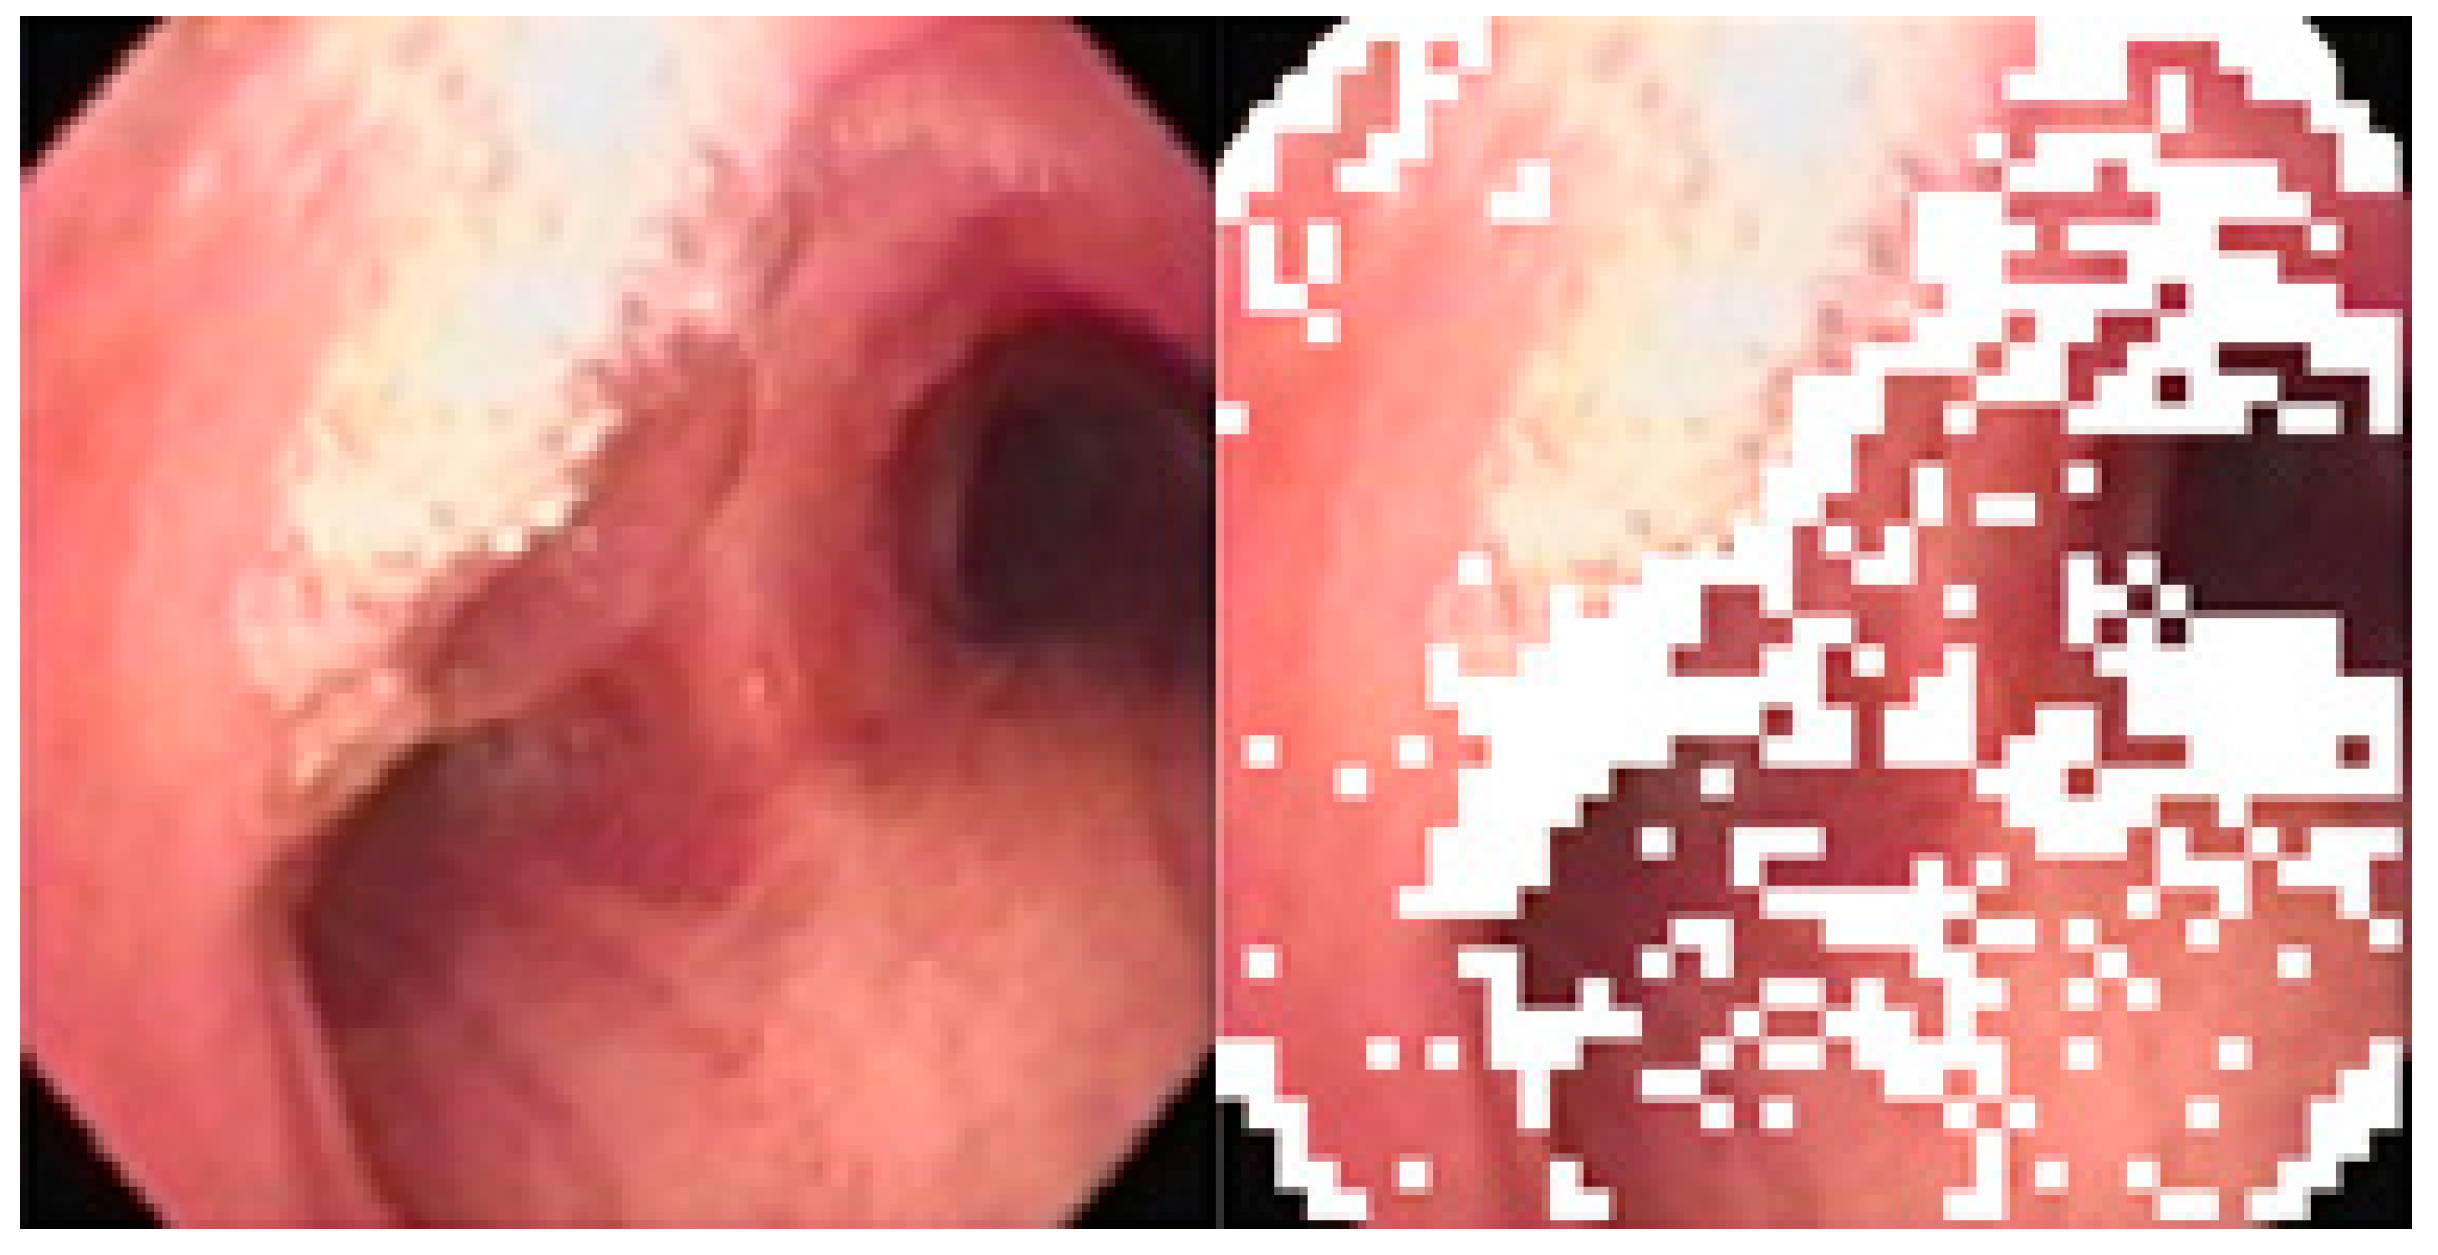
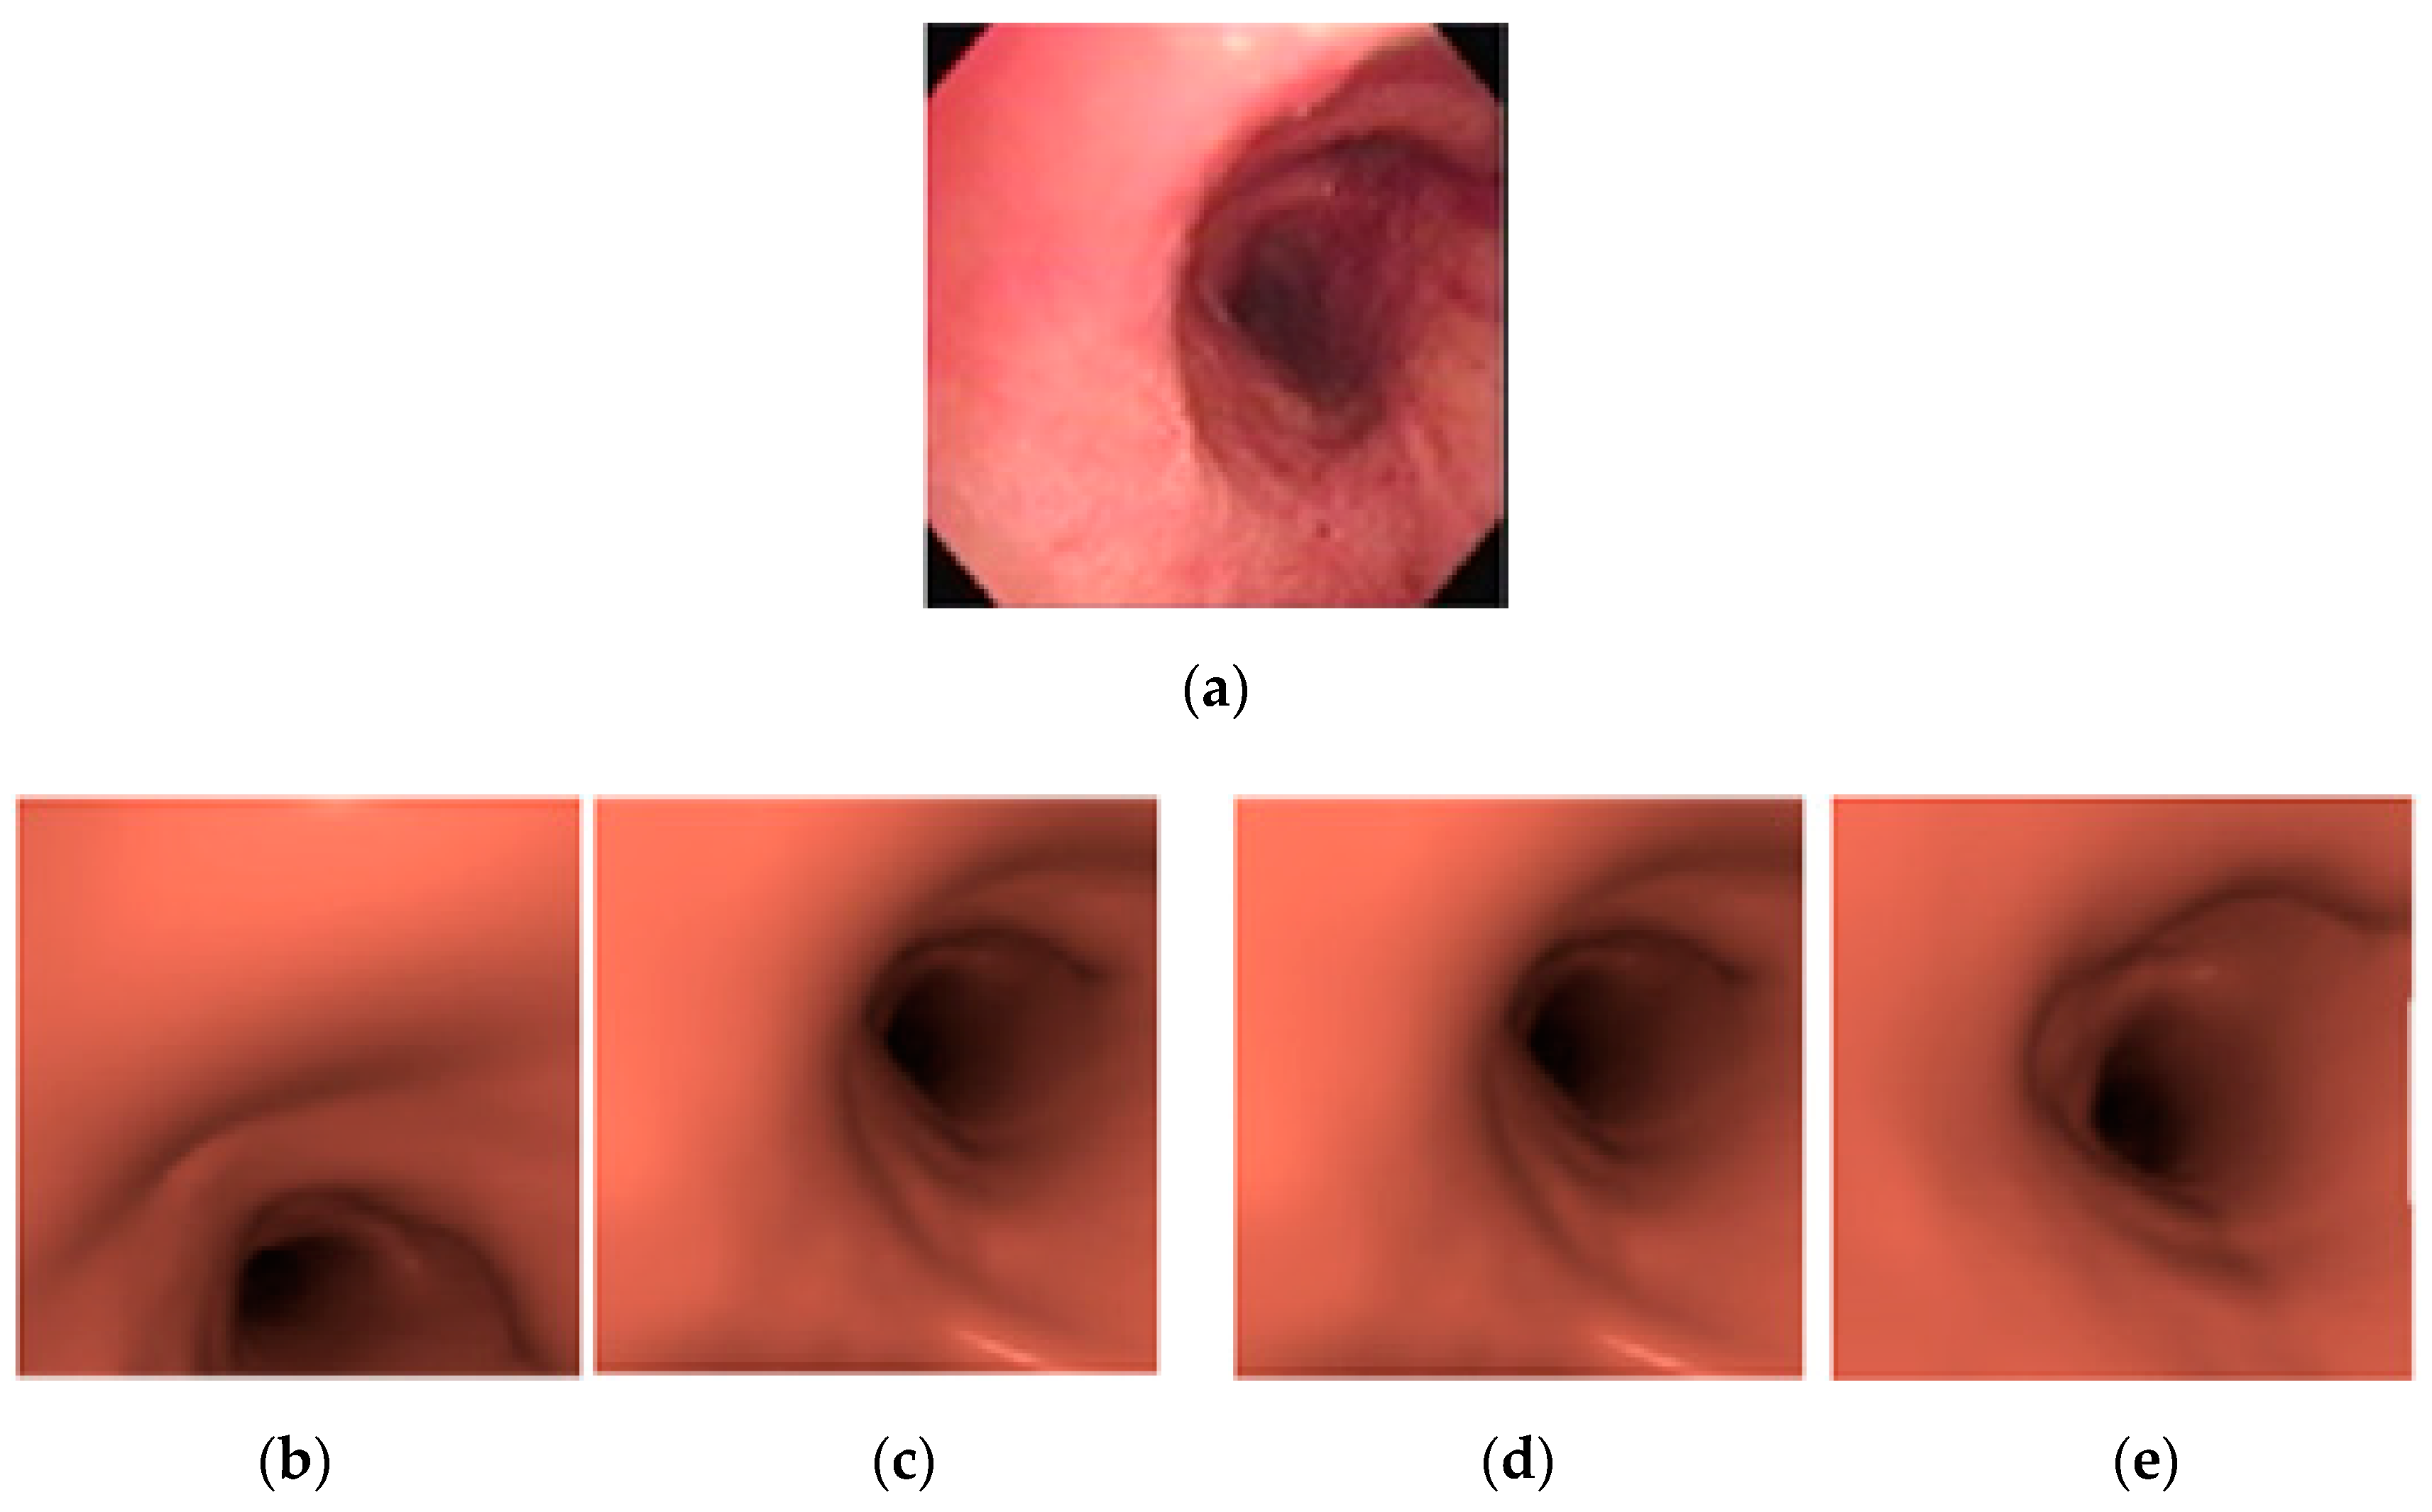
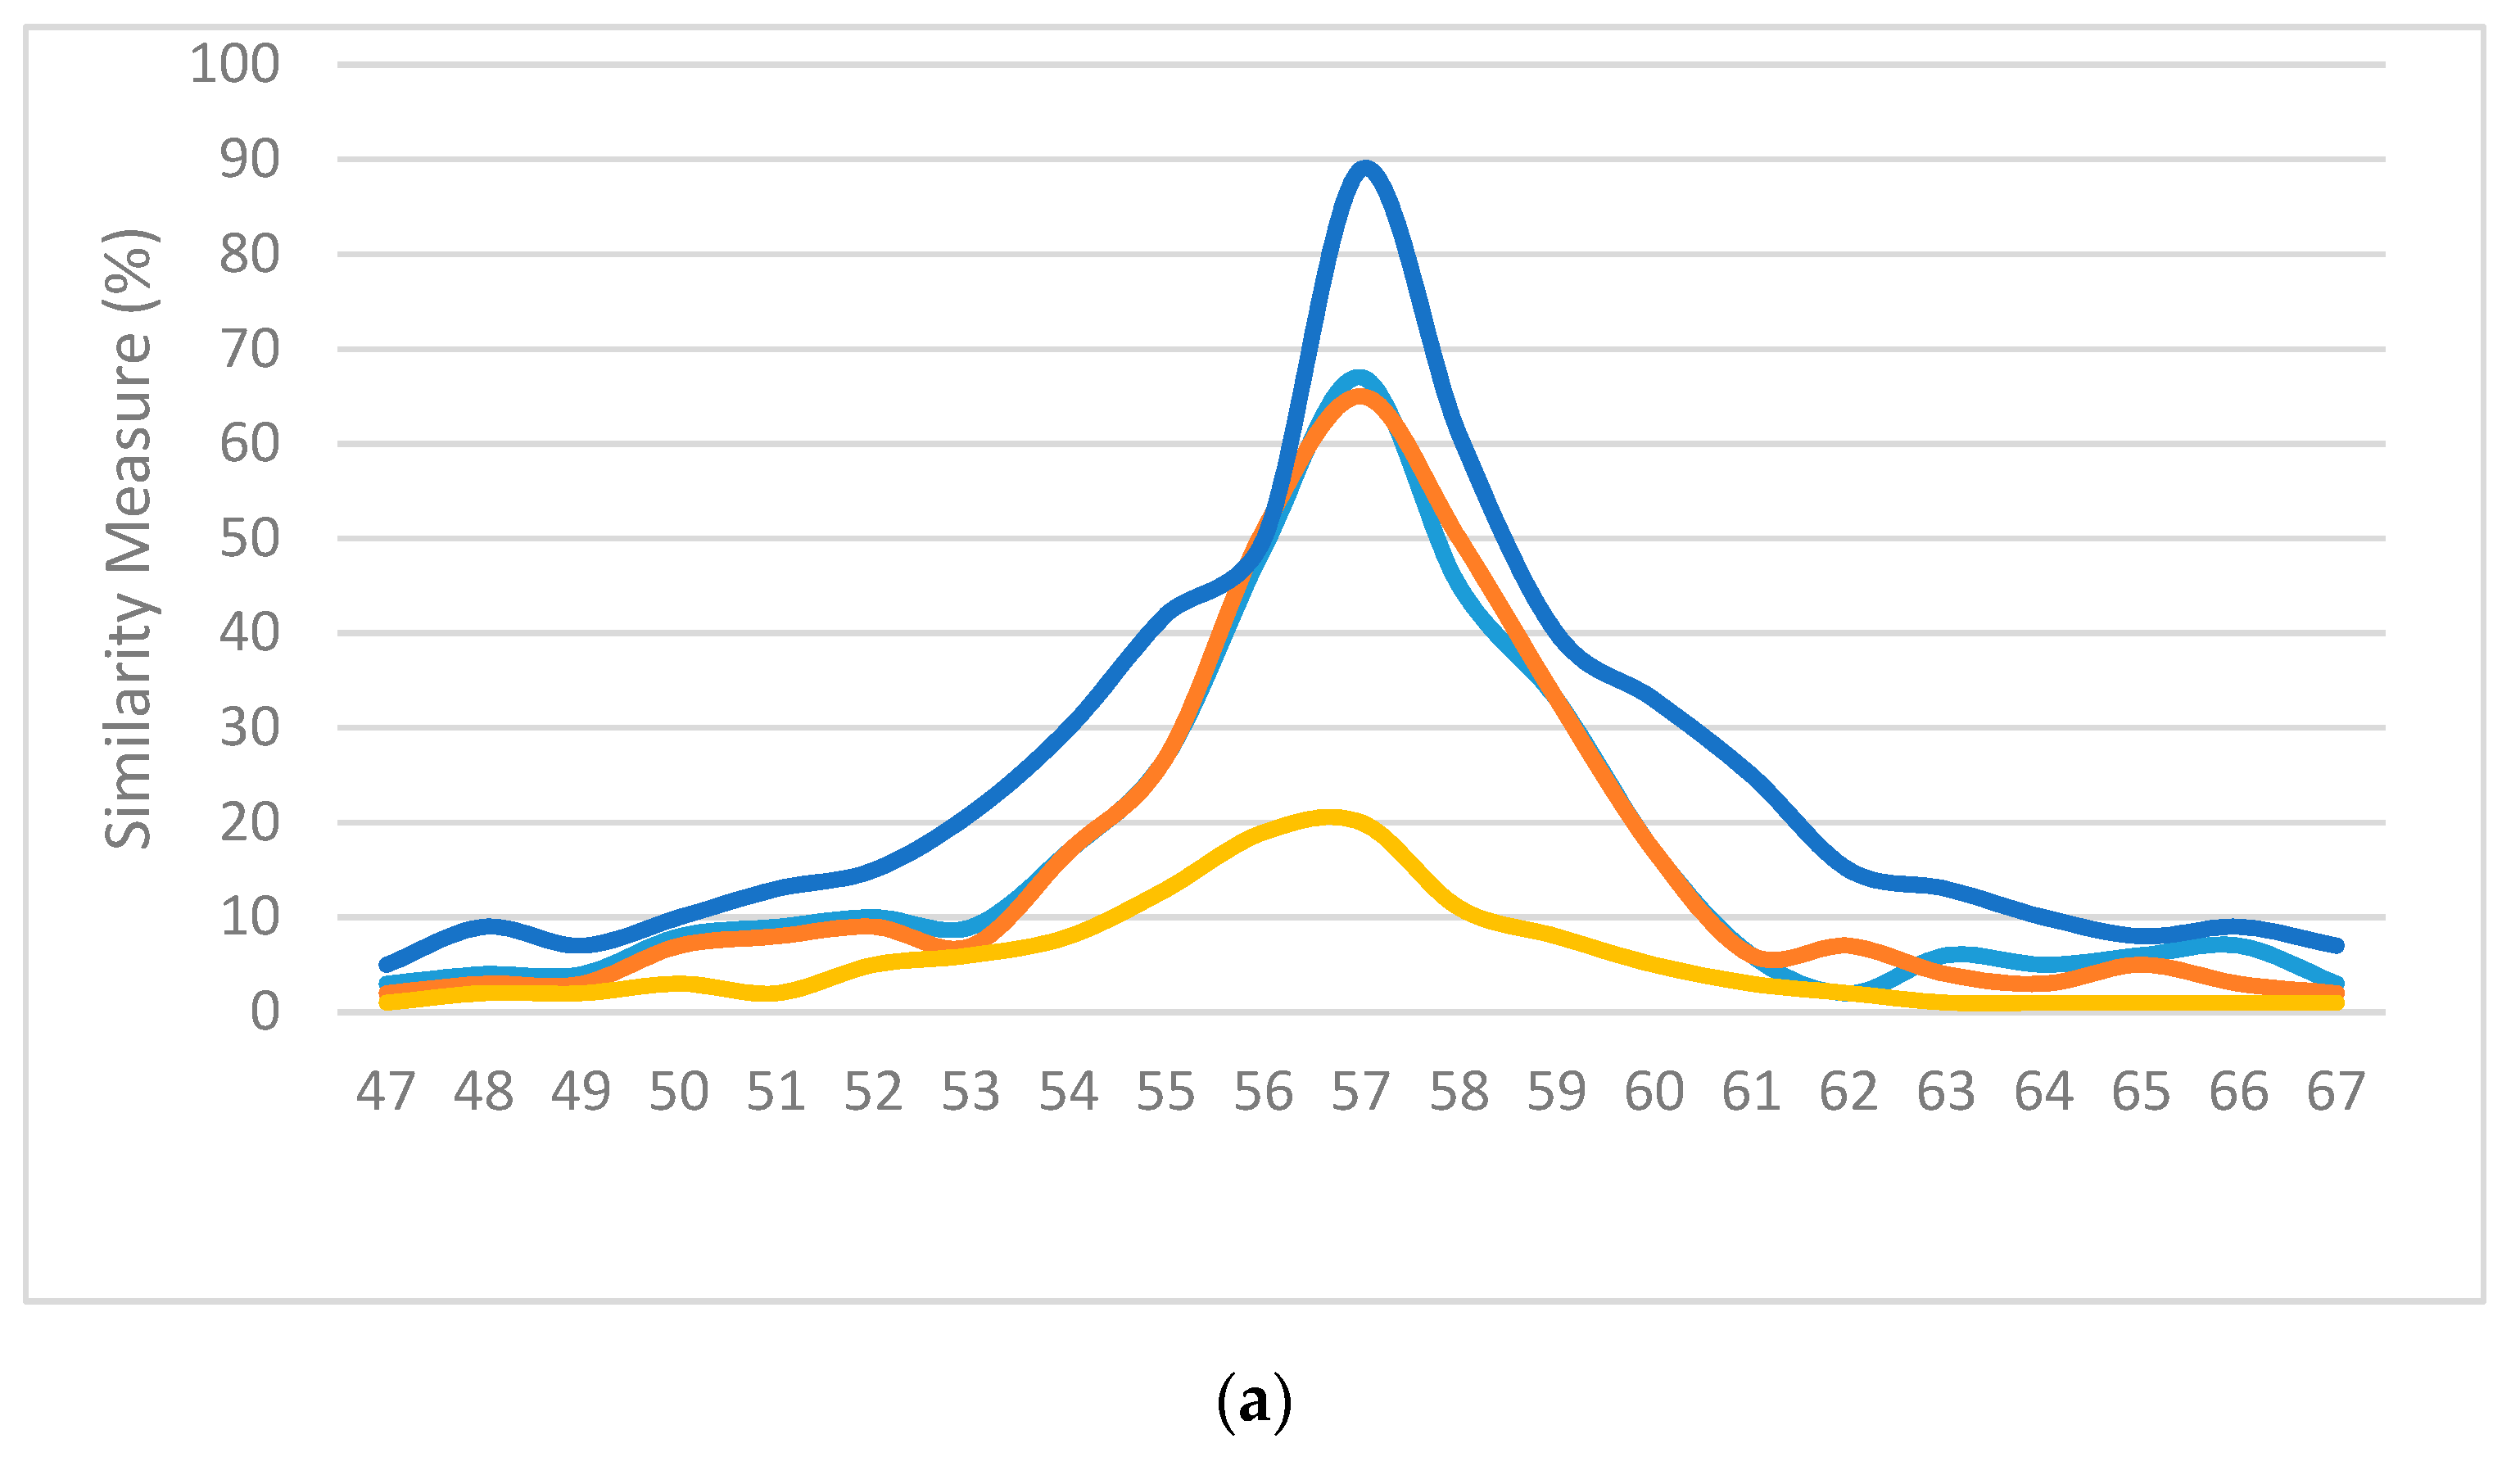
3.1. Image Matching
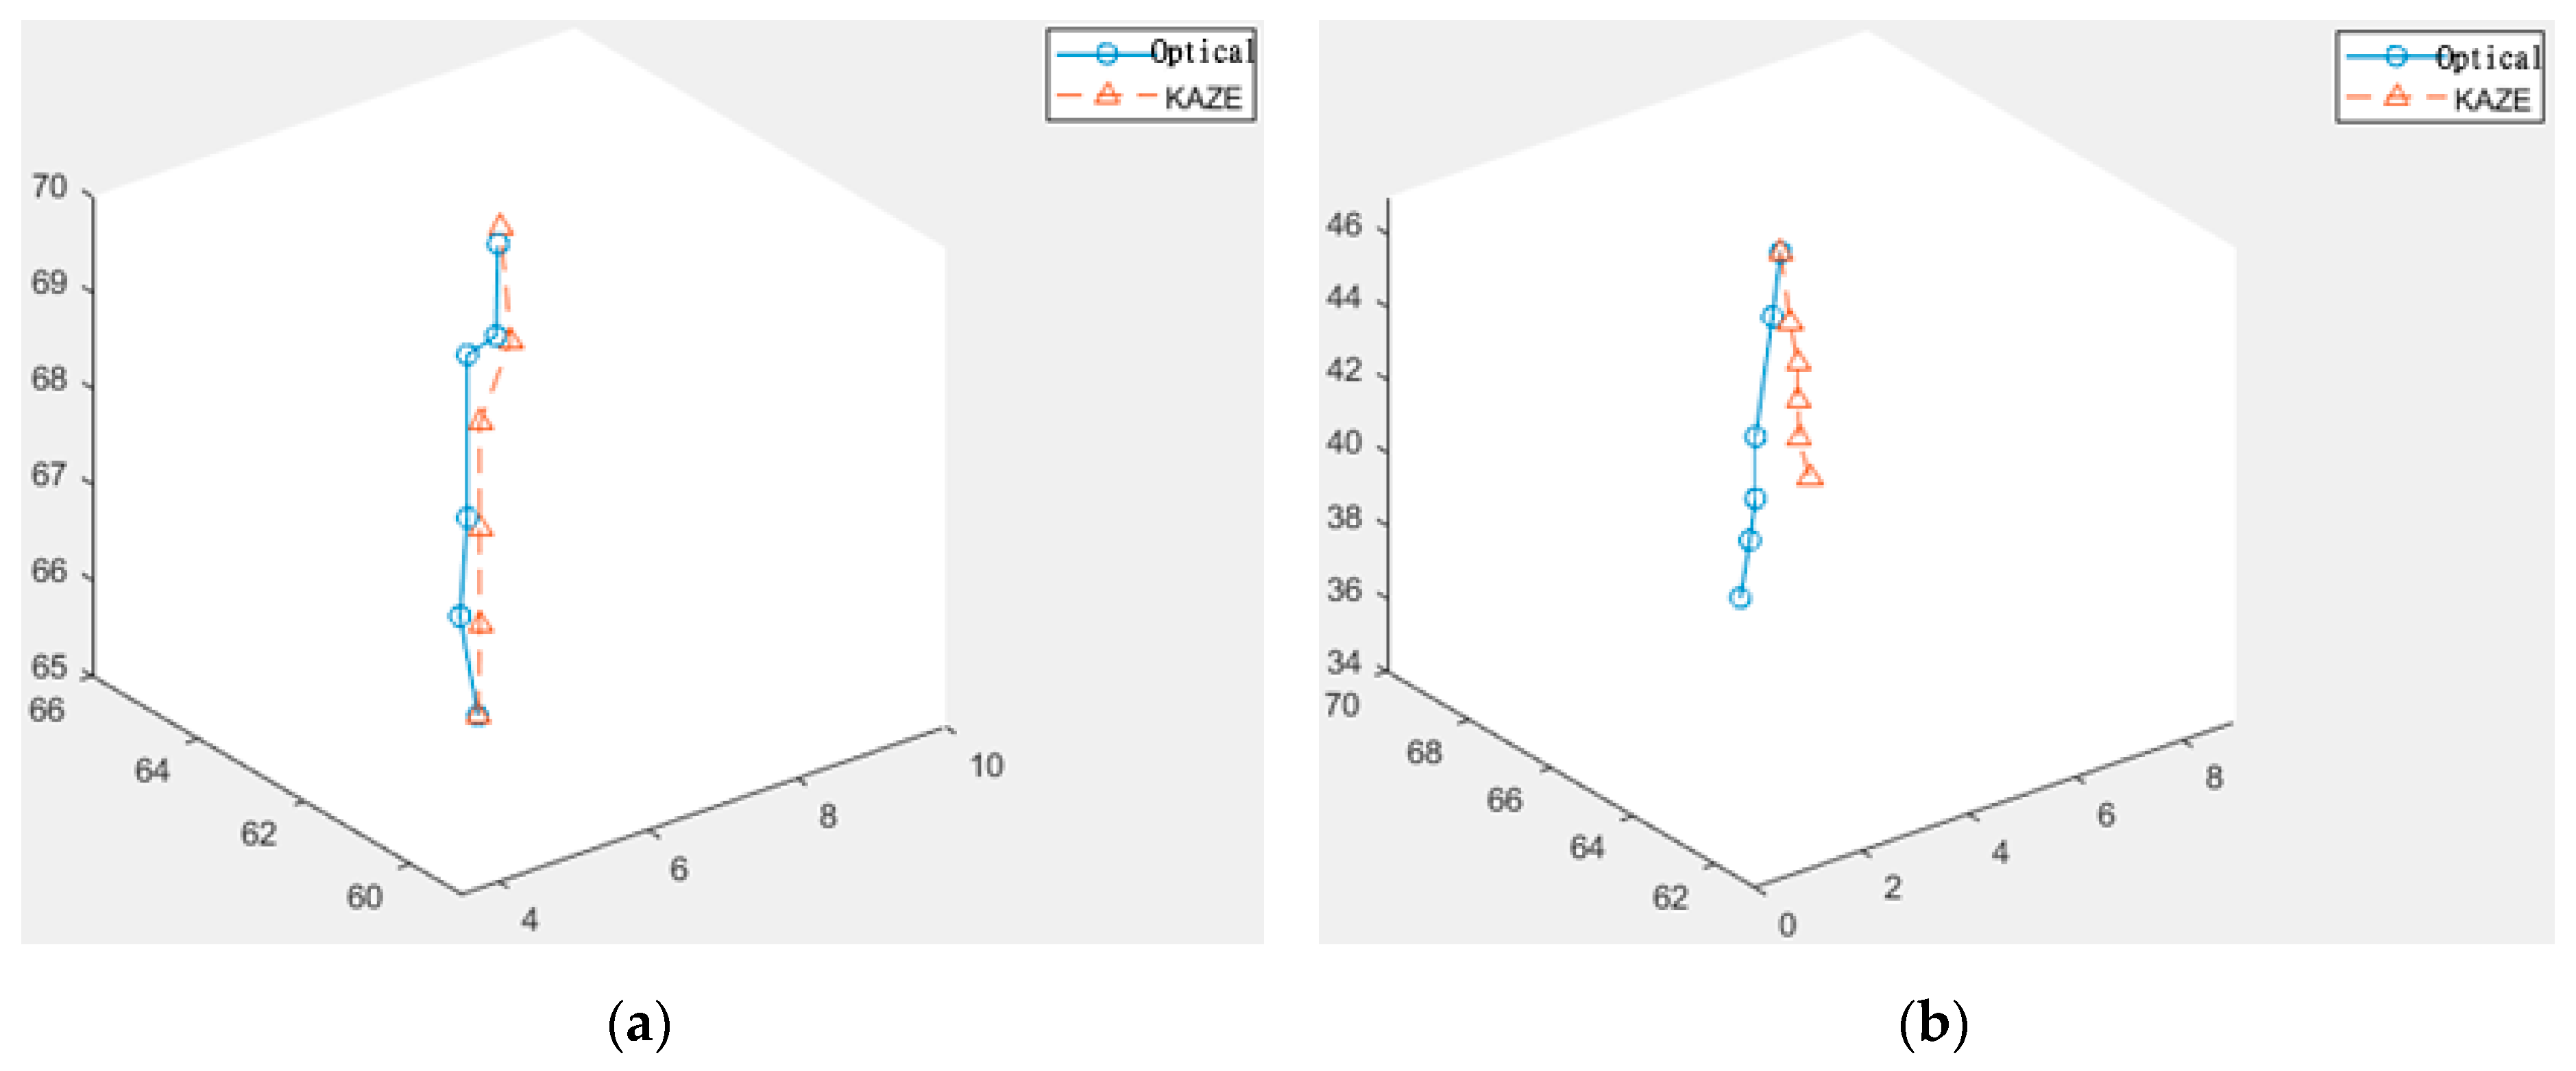
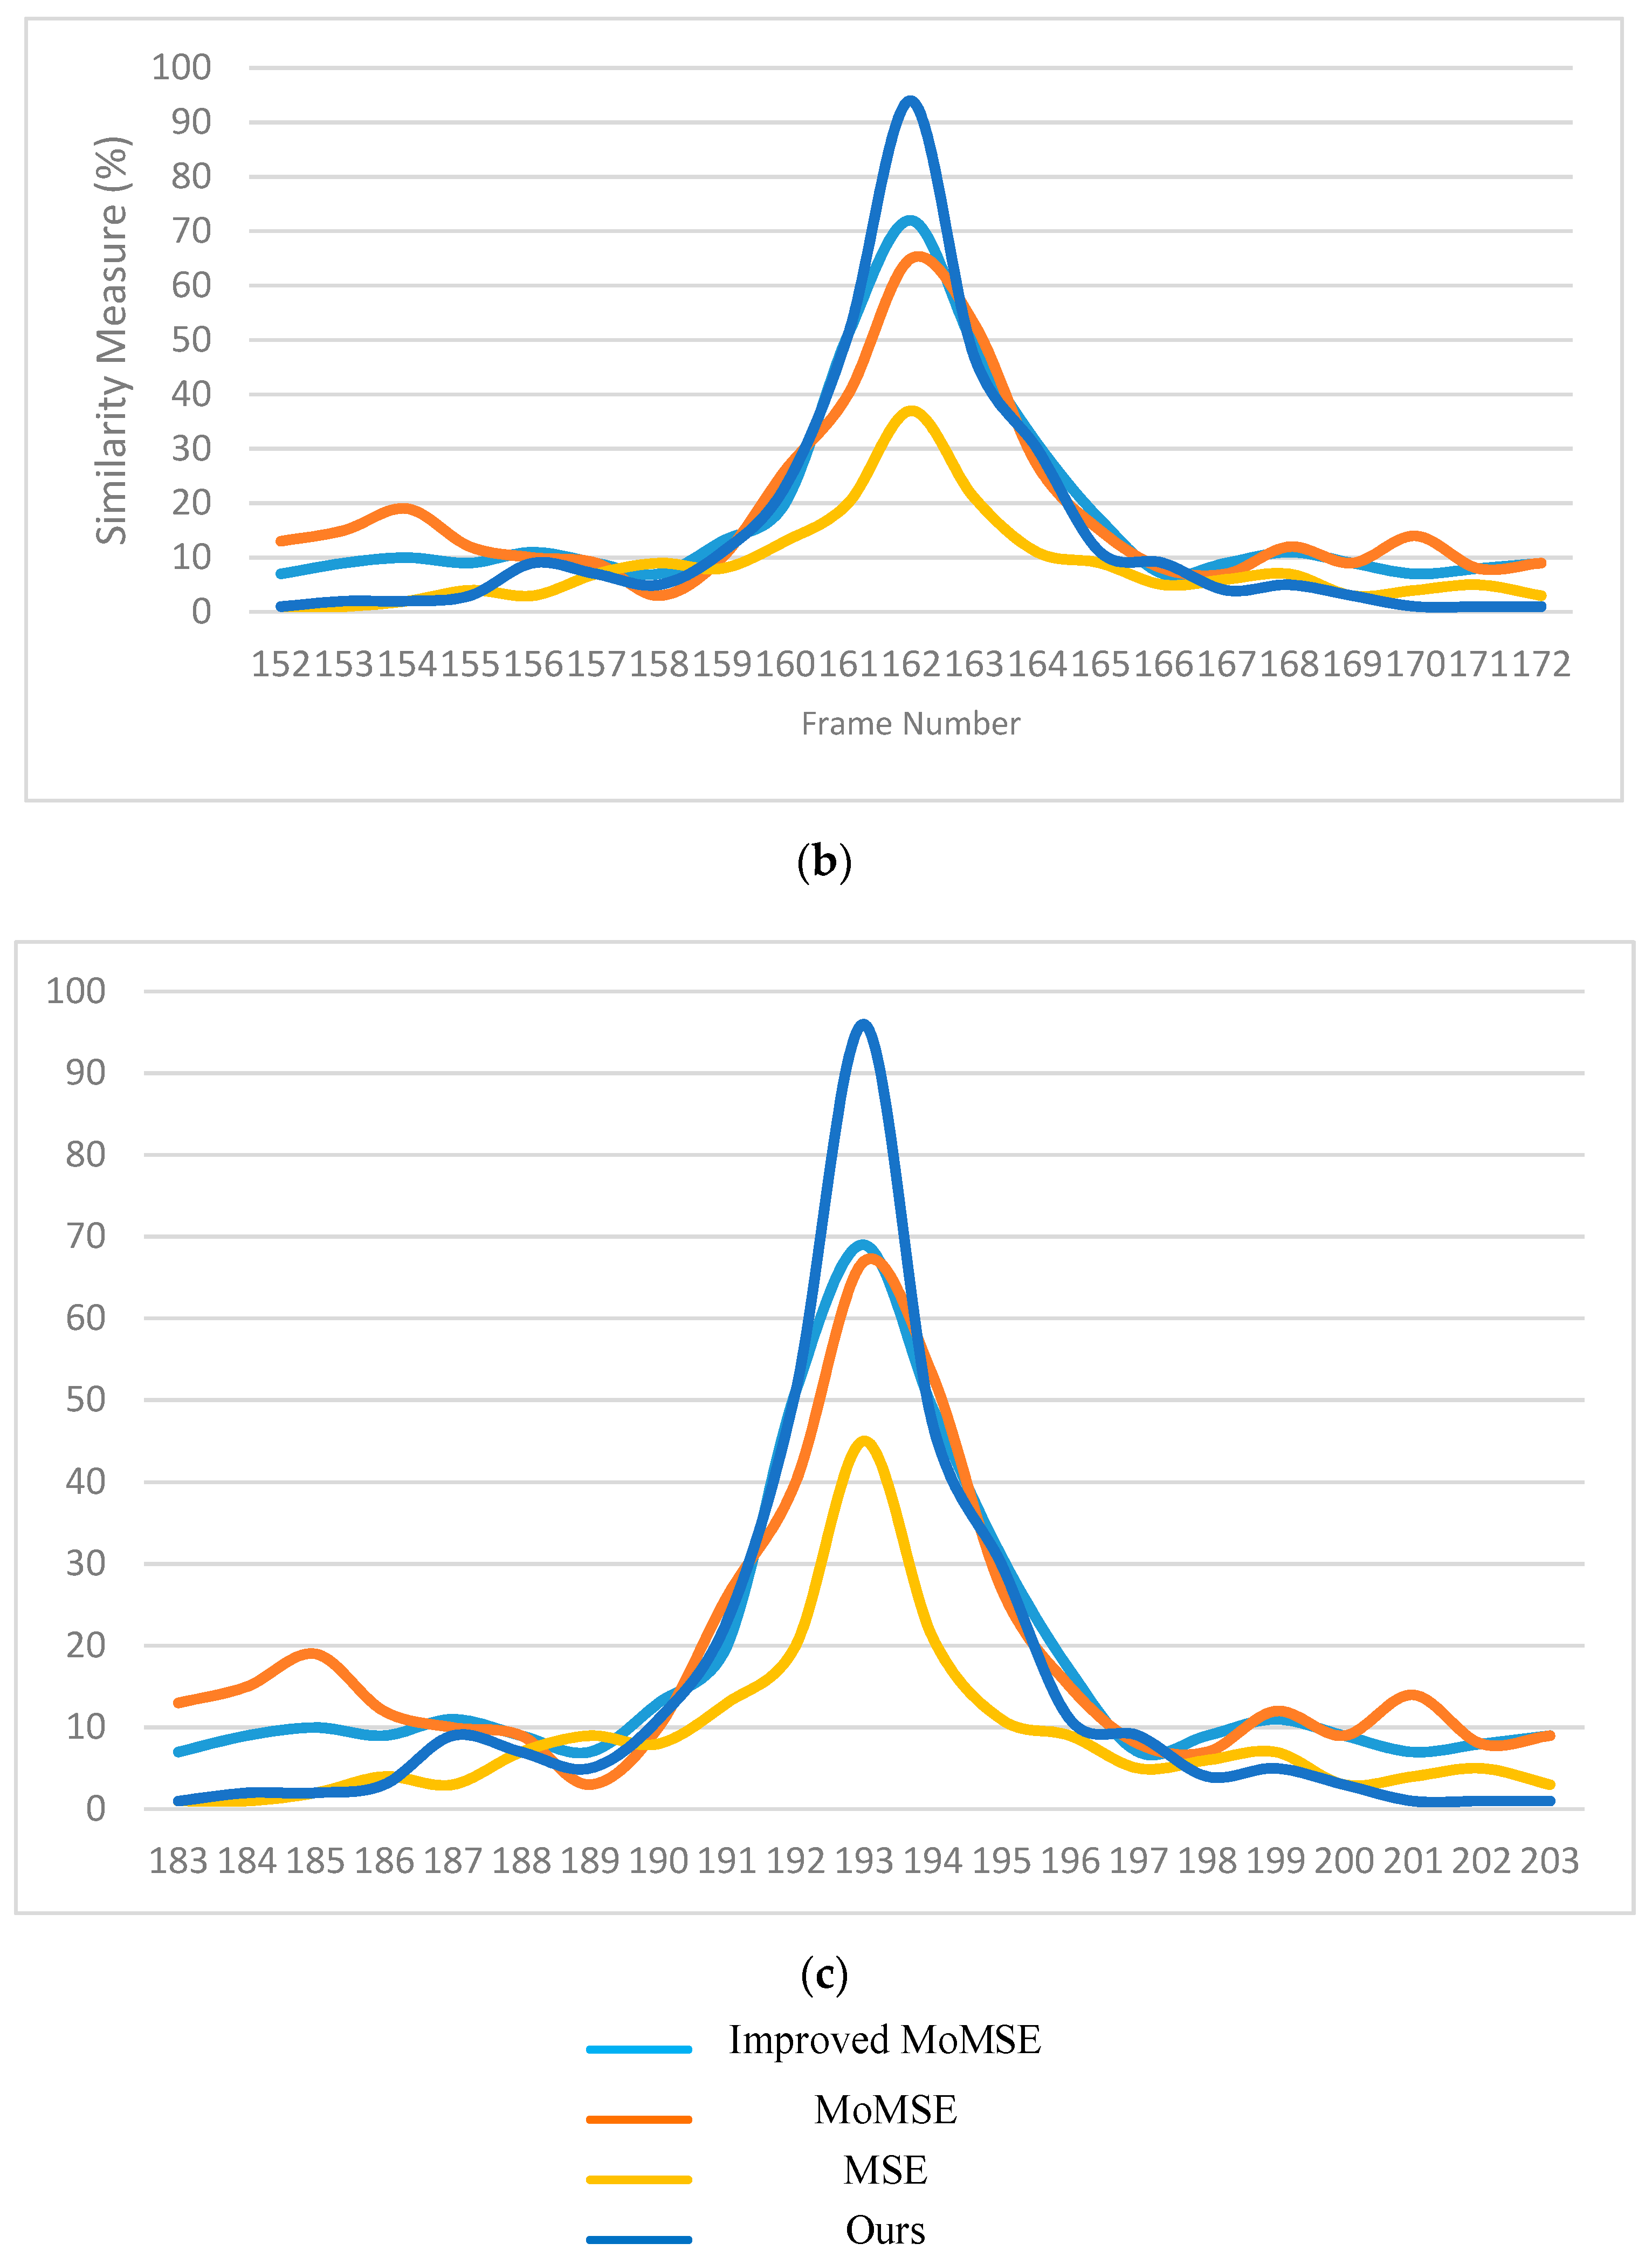
3.2. Comparison
3.3. Path Navigation
4. Conclusions
Author Contributions
Funding
Conflicts of Interest
References
- Lukomsky, G.Z.; Ovchinnikov, A.A.; Bilal, A. Complications of bronchoscopy: Comparison of rigid bronchoscopy under general anesthesia and flexible fiberoptic bronchoscopy under topical anesthesia. Clin. Investig. Comment. 1981, 79, 316–321. [Google Scholar]
- Khor, W.S.; Baker, B.; Amin, K.; Chan, A.; Patel, K.; Wong, J. Augmented and virtual reality in surgery—The digital surgical environment: Applications, limitations and legal pitfalls. Ann. Transl. Med. 2016, 4, 454. [Google Scholar] [CrossRef] [PubMed]
- Chinnock, C. Virtual reality in surgery and medicine. Hosp. Technol. Ser. 1994, 13, 1–48. [Google Scholar] [PubMed]
- Mori, K.; Urano, A.; Hasegawa, J.; Toriwaki, J.; Anno, H.; Katada, K. Virtualized endoscope system an application of virtual reality technology to diagnostic aid. IEICE Trans. Inf. Syst. 1996, E79-D, 809–819. [Google Scholar]
- Hong, L.; Muraki, S.; Kaufman, A.; Bartz, D.; He, T. Virtual voyage: Interactive navigation in the human colon. In Proceedings of the Conference on Computer Graphics and Interactive Techniques, Los Angeles, CA, USA, 1 October 1997; pp. 27–34. [Google Scholar]
- Fishman, E.K. 3D Image Processing: Techniques and Clinical Applications. Am. J. Roentgenol. 2002, 179, 1414. [Google Scholar] [CrossRef]
- Koizumi, N.; Sumiyama, K.; Suzuki, N.; Hattori, A.; Tajiri, H.; Uchiyama, A. Robot Vision; The MIT Press: Cambridge, MA, USA, 2002. [Google Scholar]
- Helferty, J.; Higgins, W. Technique for registering 3D virtual CT images to endoscopic video. In Proceedings of the 2001 International Conference on Image Processing (Cat. No.01CH37205), Thessaloniki, Greece, 7–10 October 2001; pp. 893–896. [Google Scholar]
- Merritt, S.A.; Rai, L.; Higgins, W.E. Real-time CT-video registration for continuous endoscopic guidance. In Proceedings of the Medical Imaging 2006: Physiology, Function, and Structure from Medical Images, San Diego, CA, USA, 12–14 February 2006; Volume 6143. [Google Scholar]
- Chung, A.; Deligianni, F.; Shah, P.L.; Wells, A.; Yang, G.-Z. Patient-specific bronchoscopy visualization through BRDF estimation and disocclusion correction. IEEE Trans. Med. Imaging 2006, 25, 503–513. [Google Scholar] [CrossRef]
- Deguchi, D.; Mori, K.; Feuerstein, M.; Kitasaka, T.; Calvin, R.; Suenaga, Y.M., Jr.; Takabatake, H.; Mori, M.; Natori, H. Selective image similarity measure for bronchoscope tracking based on image registration. Med. Image Anal. 2009, 13, 621–633. [Google Scholar] [CrossRef]
- Mori, K.; Deguchi, D.; Sugiyama, J.; Suenaga, Y.; Toriwaki, J.-I.; Maurer, C.R.; Takabatake, H.; Natori, H. Tracking of a bronchoscope using epipolar geometry analysis and intensity-based image registration of real and virtual endoscopic images. Med. Image Anal. 2002, 6, 321–336. [Google Scholar] [CrossRef]
- Mur-Artal, R.; Montiel, J.M.M.; Tardos, J.D. ORB-SLAM: A versatile and accurate monocular SLAM System. IEEE Trans. Robot. 2015, 31, 1147–1163. [Google Scholar] [CrossRef]
- Mahmoud, N.; Cirauqui, I.; Hostettler, A.; Doignon, C.; Soler, L.; Marescaux, J.; Montiel, J.M.M. ORBSLAM-based endoscope tracking and 3D reconstruction. In Public-Key Cryptography—PKC 2018; Springer Science and Business Media LLC: Berlin, Germany, 2017; Volume 10170, pp. 72–83. [Google Scholar]
- Wang, C.; Oda, M.; Hayashi, Y.; Villard, B.; Kitasaka, T.; Takabatake, H.; Mori, M.; Honma, H.; Natori, H.; Mori, K. A visual SLAM-based bronchoscope tracking scheme for bronchoscopic navigation. Int. J. Comput. Assist. Radiol. Surg. 2020, 15, 1–12. [Google Scholar] [CrossRef]
- Karami, E.; Prasad, S.; Shehata, M. Image matching using SIFT, SURF, BRIEF and ORB: Performance comparison. arxiv 2017, arXiv:1710.02726. [Google Scholar]
- Jang, J.-S.R. ANFIS: Adaptive-network-based fuzzy inference system. IEEE Trans. Syst. Man Cybern. 1993, 23, 665–685. [Google Scholar] [CrossRef]
- Alcantarilla, P.F.; Bartoli, A.; Davison, A.J. KAZE features. In Advances in Computational Intelligence; Springer Science and Business Media LLC: Berlin, Germany, 2012; Volume 7577, pp. 214–227. [Google Scholar]
- Bay, H.; Tuytelaars, T.; Gool, L.V. SURF: Speed Up Robust Features. In Proceedings of the European Conference on Computer Vision, Graz, Austria, 7–13 May 2006; pp. 404–417. [Google Scholar]
- Donoser, M.; Bischof, H. Efficient Maximally Stable Extremal Region (MSER) tracking. In Proceedings of the 2006 IEEE Computer Society Conference on Computer Vision and Pattern Recognition—Volume 2 (CVPR’06), New York, NY, USA, 17–22 June 2006. [Google Scholar]
- Porwik, P.; Lisowska, A. The Haar-wavelet transform in digital image processing: Its status and achievements. Mach. Graph. Vis. 2004, 13, 27–98. [Google Scholar]
- Jang, J.-S.; Sun, C.-T.; Mizutani, E. Neuro-Fuzzy and Soft Computing; Prentice Hall: Upper Saddle River, NJ, USA, 1997; pp. 239–240. [Google Scholar]
- Jang, J.-S. Input selection for ANFIS learning. In Proceedings of the IEEE 5th International Fuzzy Systems, New Orleans, LA, USA, 11 September 1996; Volume 2, pp. 1493–1499. [Google Scholar]
- Goyal, M.K.; Bharti, B.; Quilty, J.; Adamowski, J.; Pandey, A. Modeling of daily pan evaporation in subtropical climates using ANN, LS-SVR, Fuzzy Logic, and ANFIS. Expert Syst. Appl. 2014, 41, 5267–5276. [Google Scholar] [CrossRef]
- Şahin, M.; Erol, R. Prediction of attendance demand in european football games: Comparison of ANFIS, fuzzy logic, and ANN. Comput. Intell. Neurosci. 2018, 2018, 1–14. [Google Scholar] [CrossRef]
- Choi, I.H.; Pak, J.M.; Ahn, C.K.; Lee, S.-H.; Lim, M.-T.; Song, M.K. Arbitration algorithm of FIR filter and optical flow based on ANFIS for visual object tracking. Measurement 2015, 75, 338–353. [Google Scholar] [CrossRef]
- Mingqiang, Y.; Kidiyo, K.; Joseph, R. Shape matching and object recognition using chord contexts. 2008 Int. Conf. Vis. 2008, 24, 509–522. [Google Scholar]
- Rosen, J.; Richards, C.; Hannaford, B.; Sinanan, M. Hidden Markov models of minimally invasive surgery. Stud. Heal. Technol. Inform. 2000, 70, 279–285. [Google Scholar]
- Sonnhammer, E.L.; Von Heijne, G.; Krogh, A. A hidden Markov model for predicting transmembrane helices in protein sequences. In Proceedings of the International Conference on Intelligent Systems for Molecular Biology, Montréal, QC, Canada, 28 June–1 July 1998; Volume 6, pp. 175–182. [Google Scholar]
- 3DSlicer. Available online: https://www.slicer.org/ (accessed on 9 December 2017).
- BF-F260 Bronchovideoscope Brochure. Available online: https://ssd.olympus.eu/medical/en/medical_systems/contact___support/mediacentre/media_detail_100873.jsp (accessed on 3 June 2018).
- OpenCV Library. Available online: https://opencv.org (accessed on 10 September 2017).
- Matlab—MathWorks. Available online: https://www.mathworks.com/products/matlab.html (accessed on 10 September 2018).
- Gafour, Y.; Berrabah, D. New approach to improve the classification process of multi-class objects. Int. J. Organ. Collect. Intell. 2020, 10, 1–19. [Google Scholar] [CrossRef]
- Brehmer, K.; Wacker, B.; Modersitzki, J. A Novel Similarity Measure for Image Sequences; Springer Science and Business Media LLC: Berlin, Germany, 2018; pp. 47–56. [Google Scholar]
- LaValle, S.M.; Kuffner, J.J. Rapidly-exploring random trees: Progress and prospects. Algorithmic Comput. Robot. 2001, 303–307. [Google Scholar]
- Kavraki, L.; Kolountzakis, M.; Latombe, J.-C. Analysis of probabilistic roadmaps for path planning. Proc. IEEE Int. Conf. Robot. Autom. 2002, 14, 166–171. [Google Scholar] [CrossRef]


| Method | SURF | MSER | KAZE |
|---|---|---|---|
| Total feature points | 28 | 12 | 54 |
| Correct matches | 25 | 12 | 54 |
| Erroneous matches | 3 | 0 | 0 |
Publisher’s Note: MDPI stays neutral with regard to jurisdictional claims in published maps and institutional affiliations. |
© 2020 by the authors. Licensee MDPI, Basel, Switzerland. This article is an open access article distributed under the terms and conditions of the Creative Commons Attribution (CC BY) license (http://creativecommons.org/licenses/by/4.0/).
Share and Cite
Chien, J.-C.; Lee, J.-D.; Su, E.; Li, S.-H. A Bronchoscope Localization Method Using an Augmented Reality Co-Display of Real Bronchoscopy Images with a Virtual 3D Bronchial Tree Model. Sensors 2020, 20, 6997. https://doi.org/10.3390/s20236997
Chien J-C, Lee J-D, Su E, Li S-H. A Bronchoscope Localization Method Using an Augmented Reality Co-Display of Real Bronchoscopy Images with a Virtual 3D Bronchial Tree Model. Sensors. 2020; 20(23):6997. https://doi.org/10.3390/s20236997
Chicago/Turabian StyleChien, Jong-Chih, Jiann-Der Lee, Ellen Su, and Shih-Hong Li. 2020. "A Bronchoscope Localization Method Using an Augmented Reality Co-Display of Real Bronchoscopy Images with a Virtual 3D Bronchial Tree Model" Sensors 20, no. 23: 6997. https://doi.org/10.3390/s20236997
APA StyleChien, J.-C., Lee, J.-D., Su, E., & Li, S.-H. (2020). A Bronchoscope Localization Method Using an Augmented Reality Co-Display of Real Bronchoscopy Images with a Virtual 3D Bronchial Tree Model. Sensors, 20(23), 6997. https://doi.org/10.3390/s20236997