Enhancing Classification Performance of fNIRS-BCI by Identifying Cortically Active Channels Using the z-Score Method

 ,
, 

 ,
,  and
and
Abstract
1. Introduction
2. Materials and Methods
2.1. Subjects/Participants
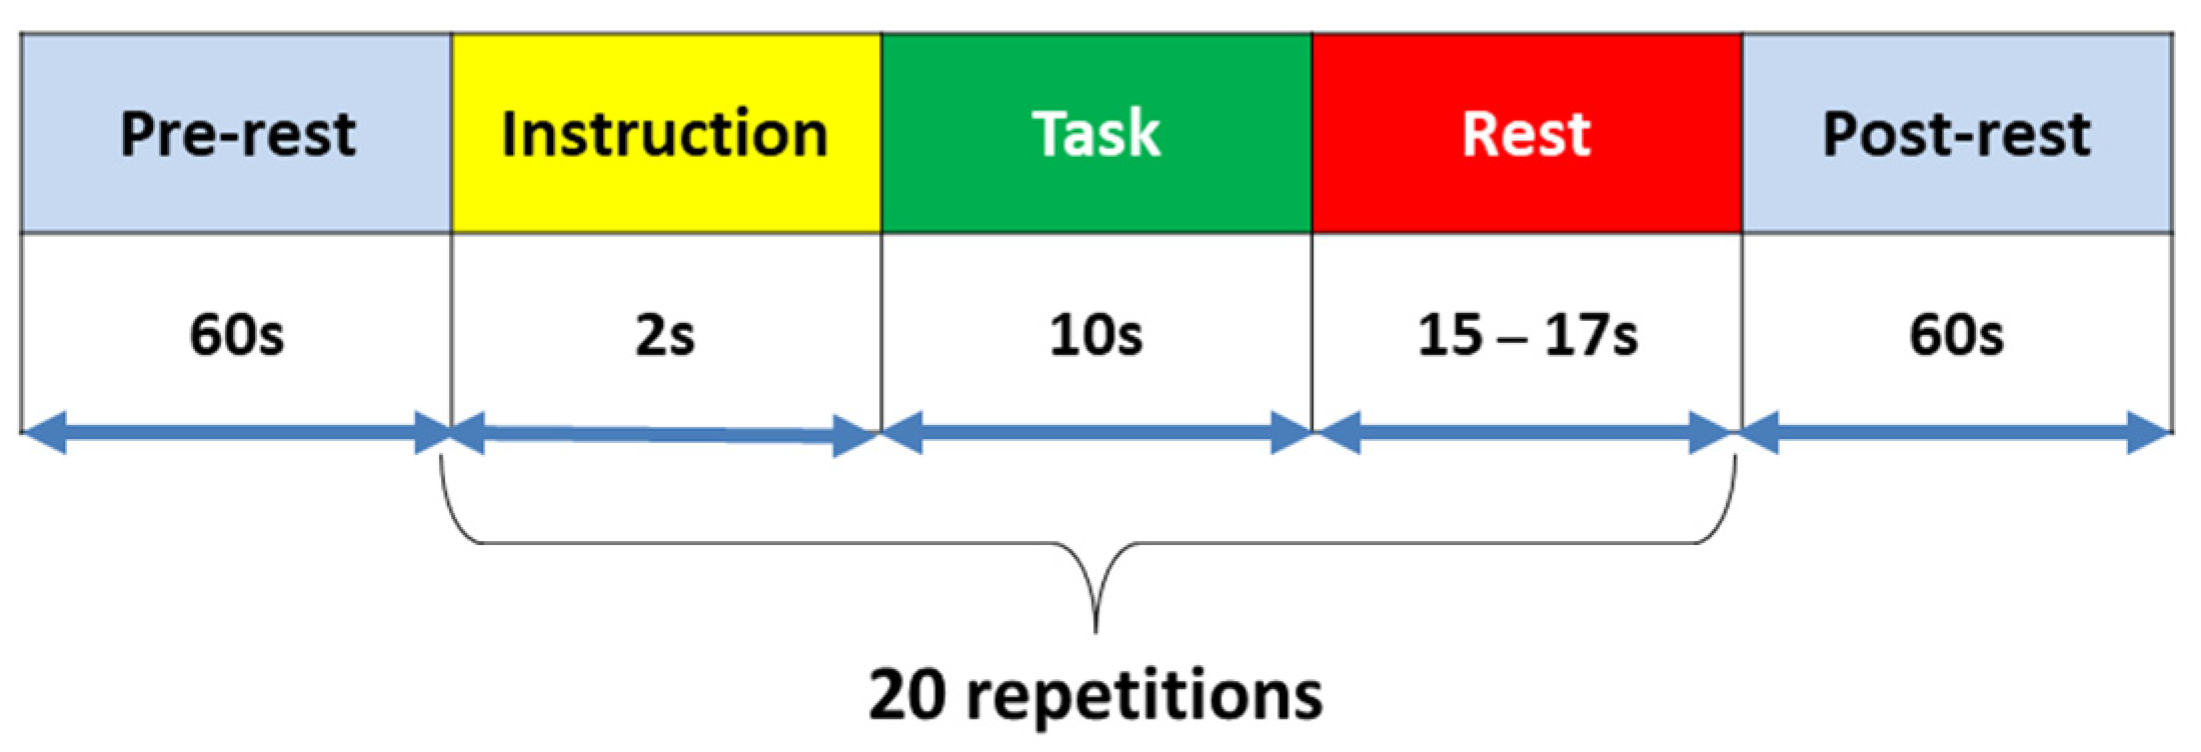
2.2. Experimental Paradigm/Protocol
2.2.1. Motor Imagery (MI)
2.2.2. Mental Arithmetic (MA)
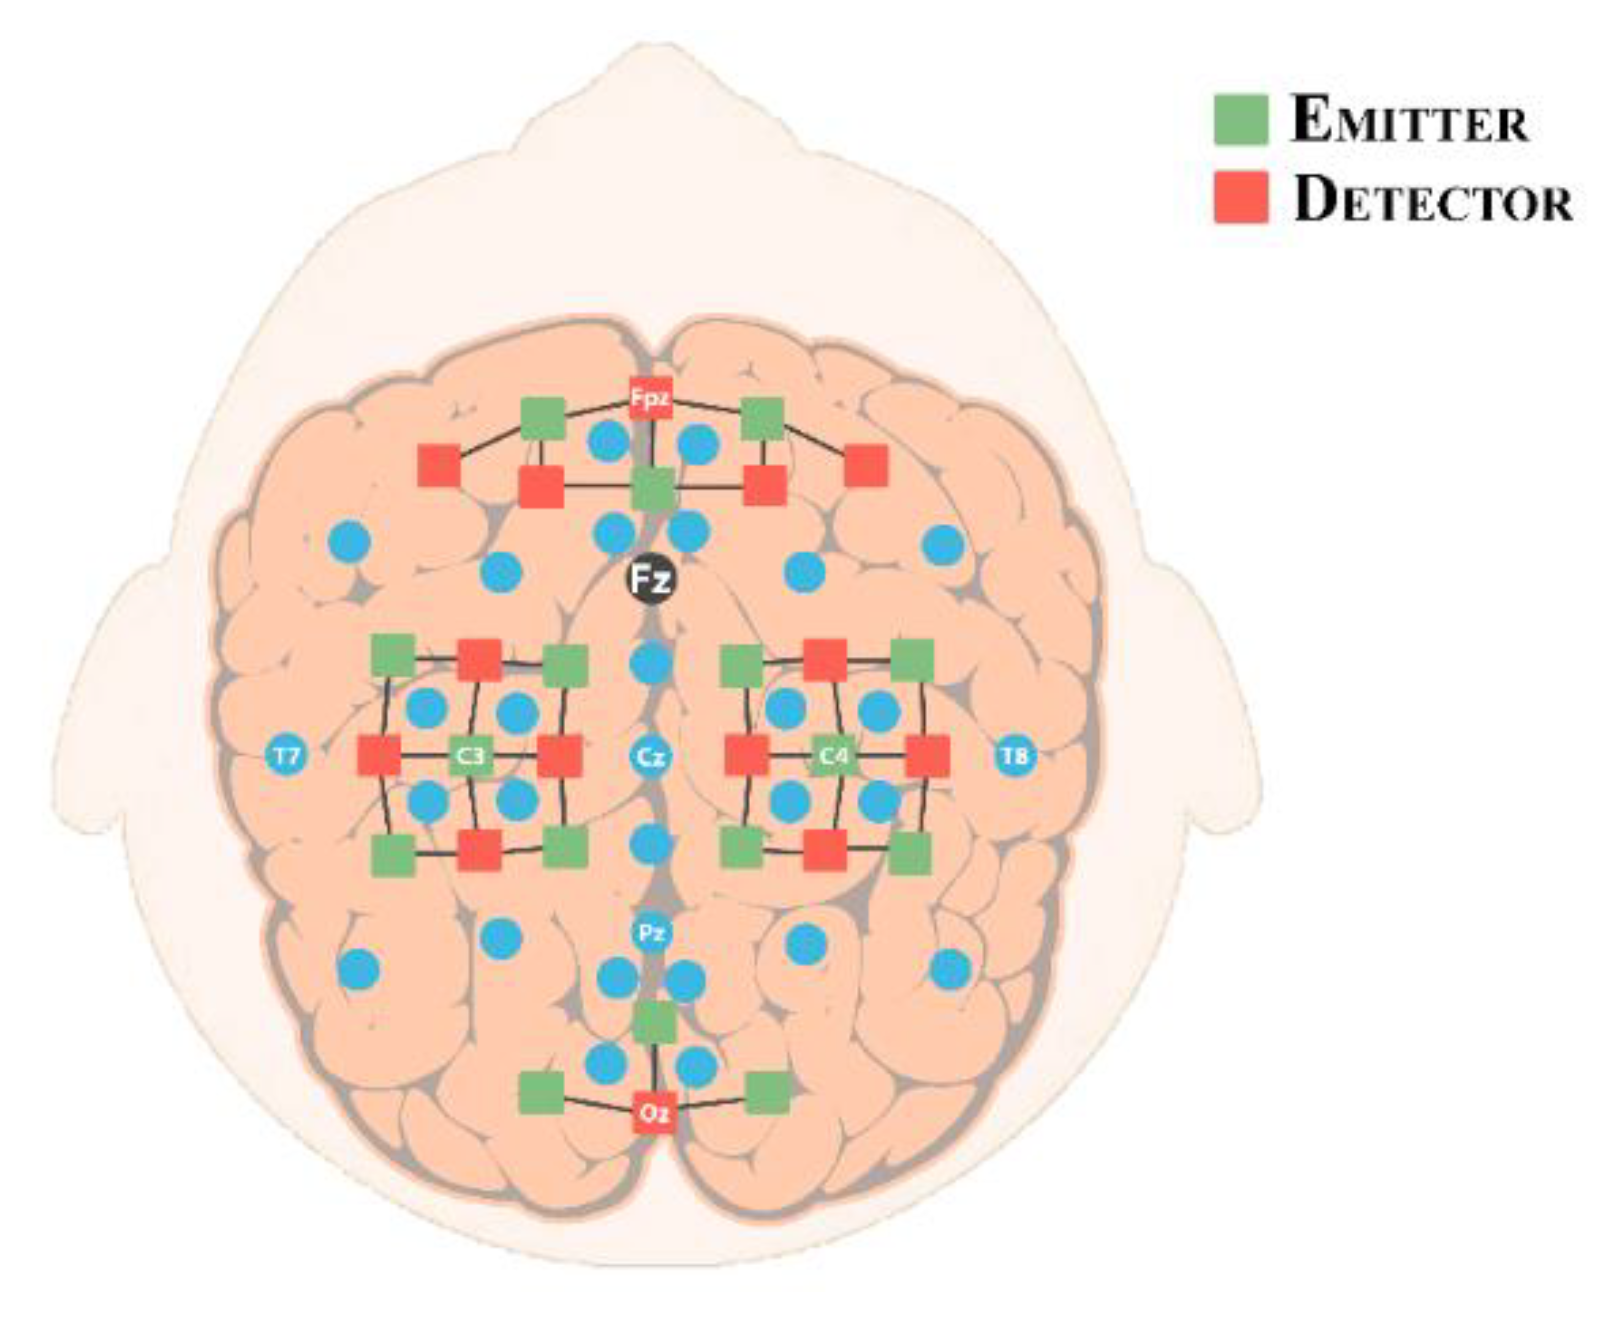
2.3. Experimental Setup/Optode Placement
2.4. Signal Acquisition
2.5. Signal Processing
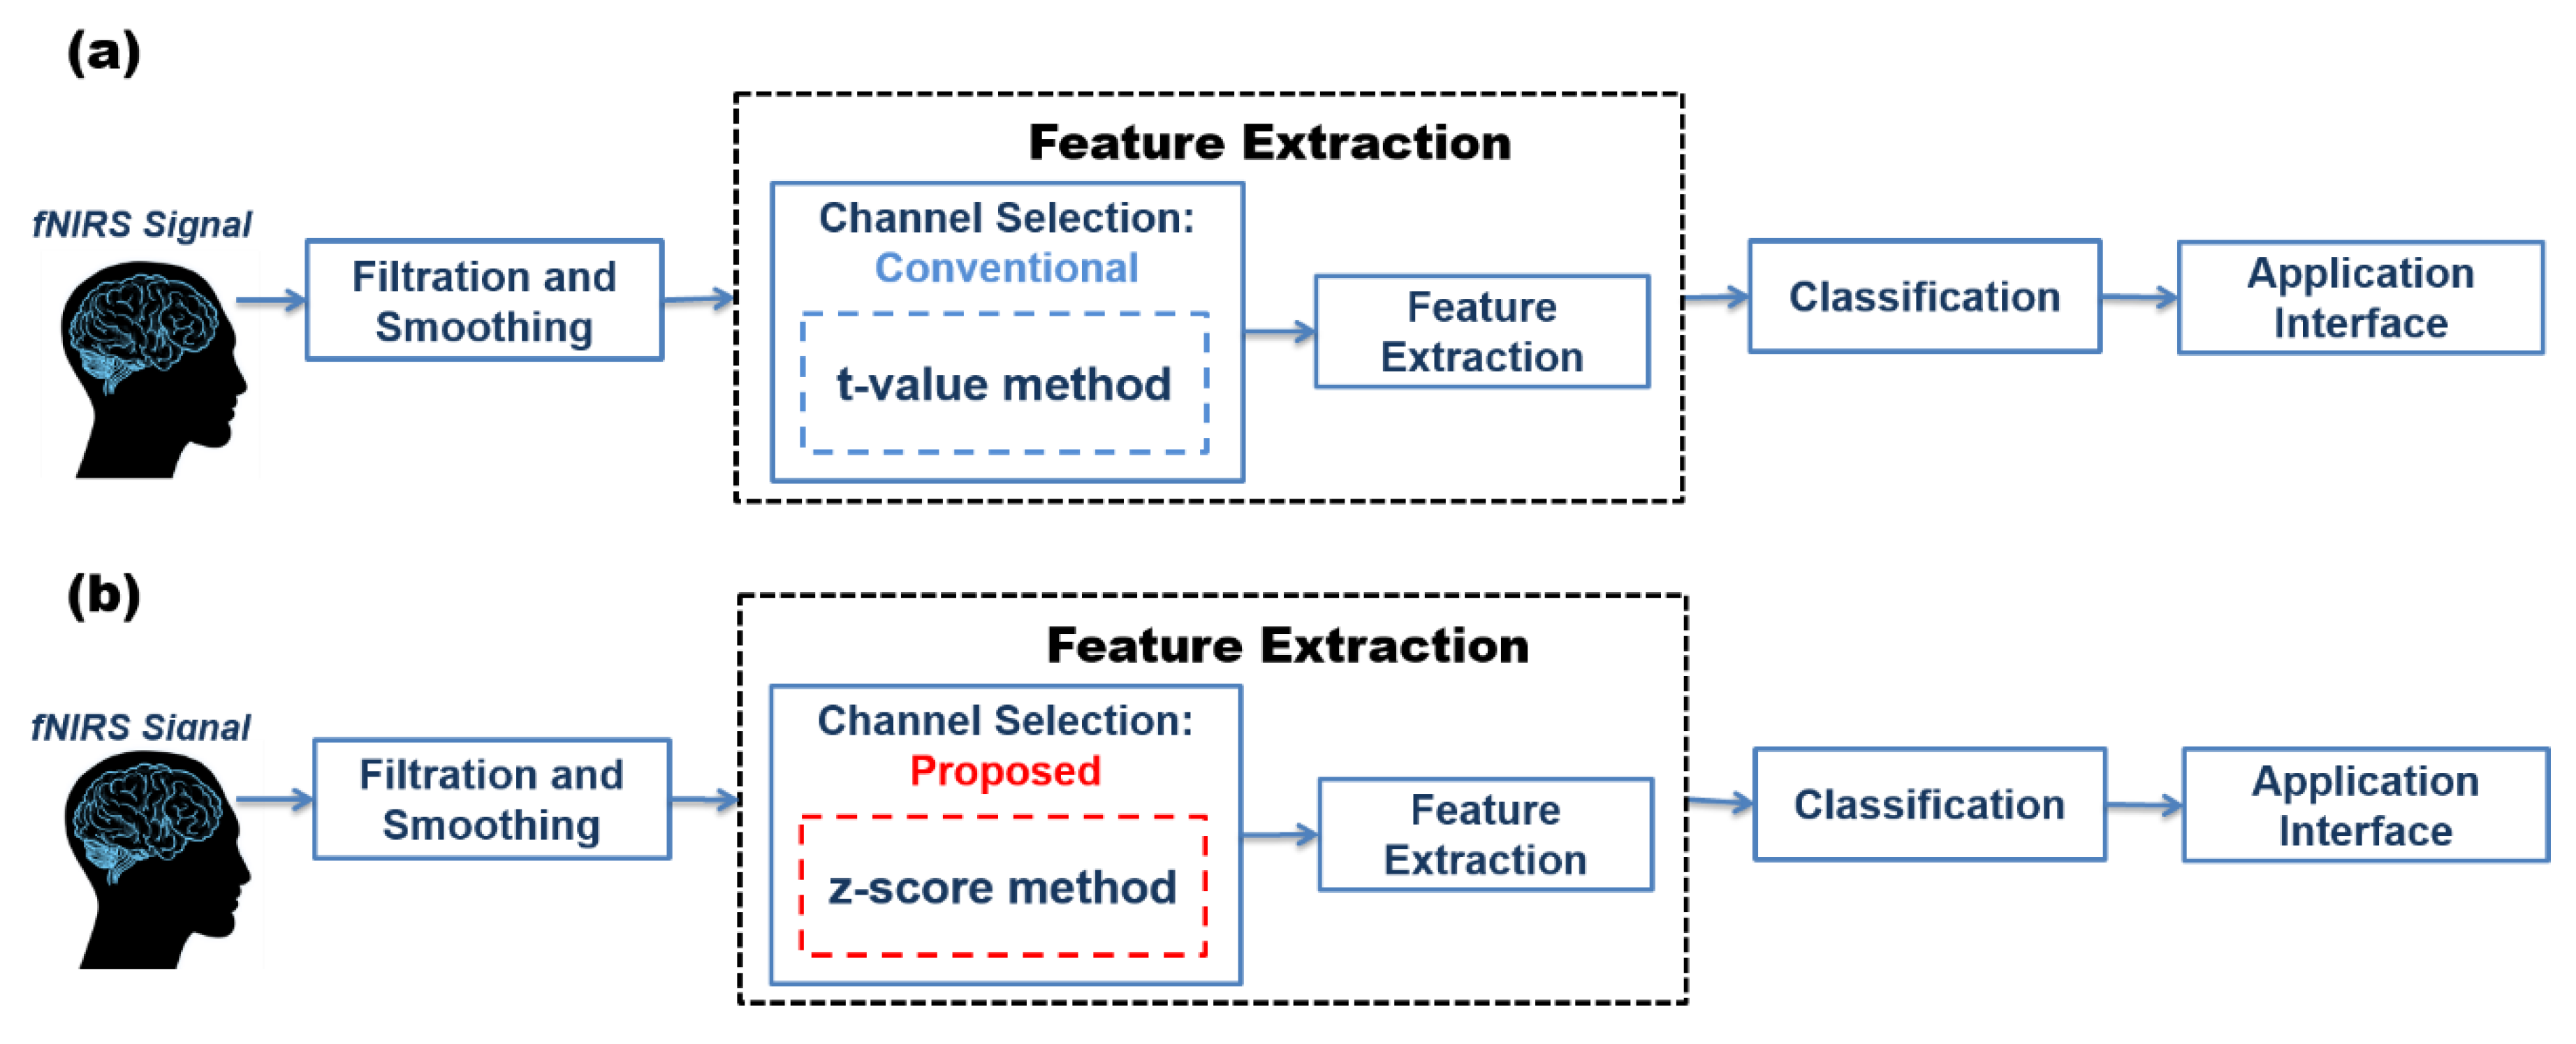
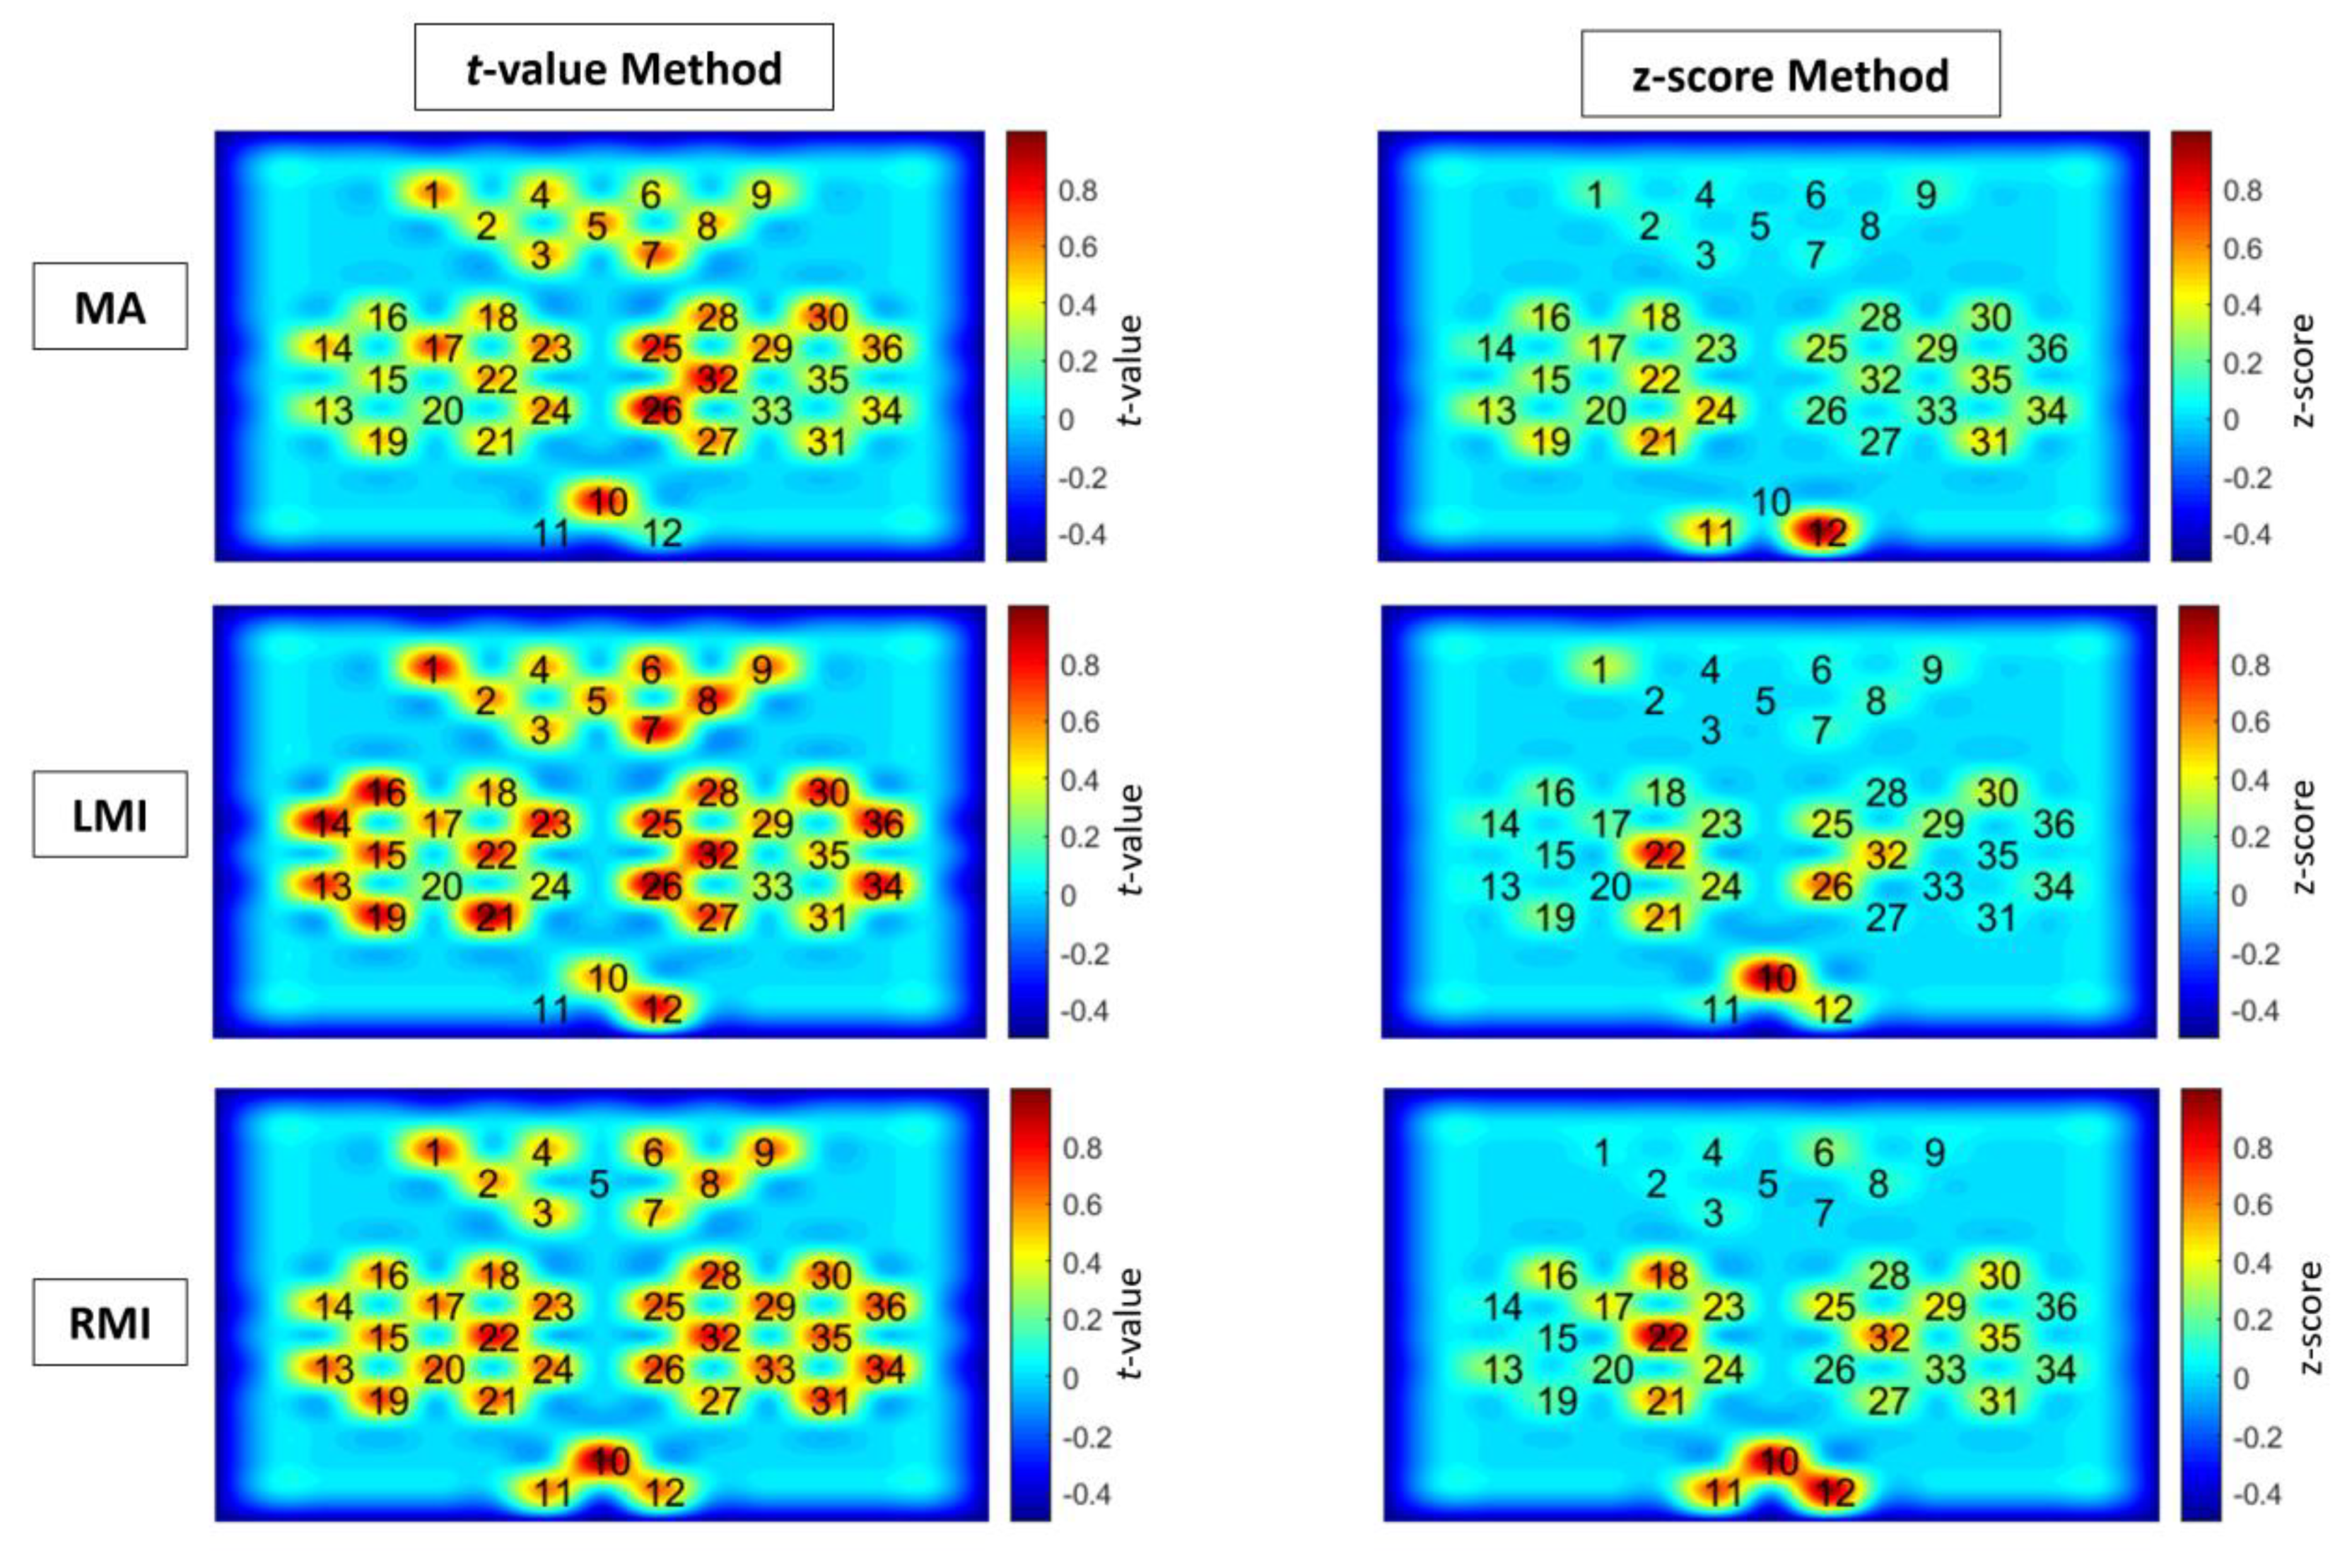
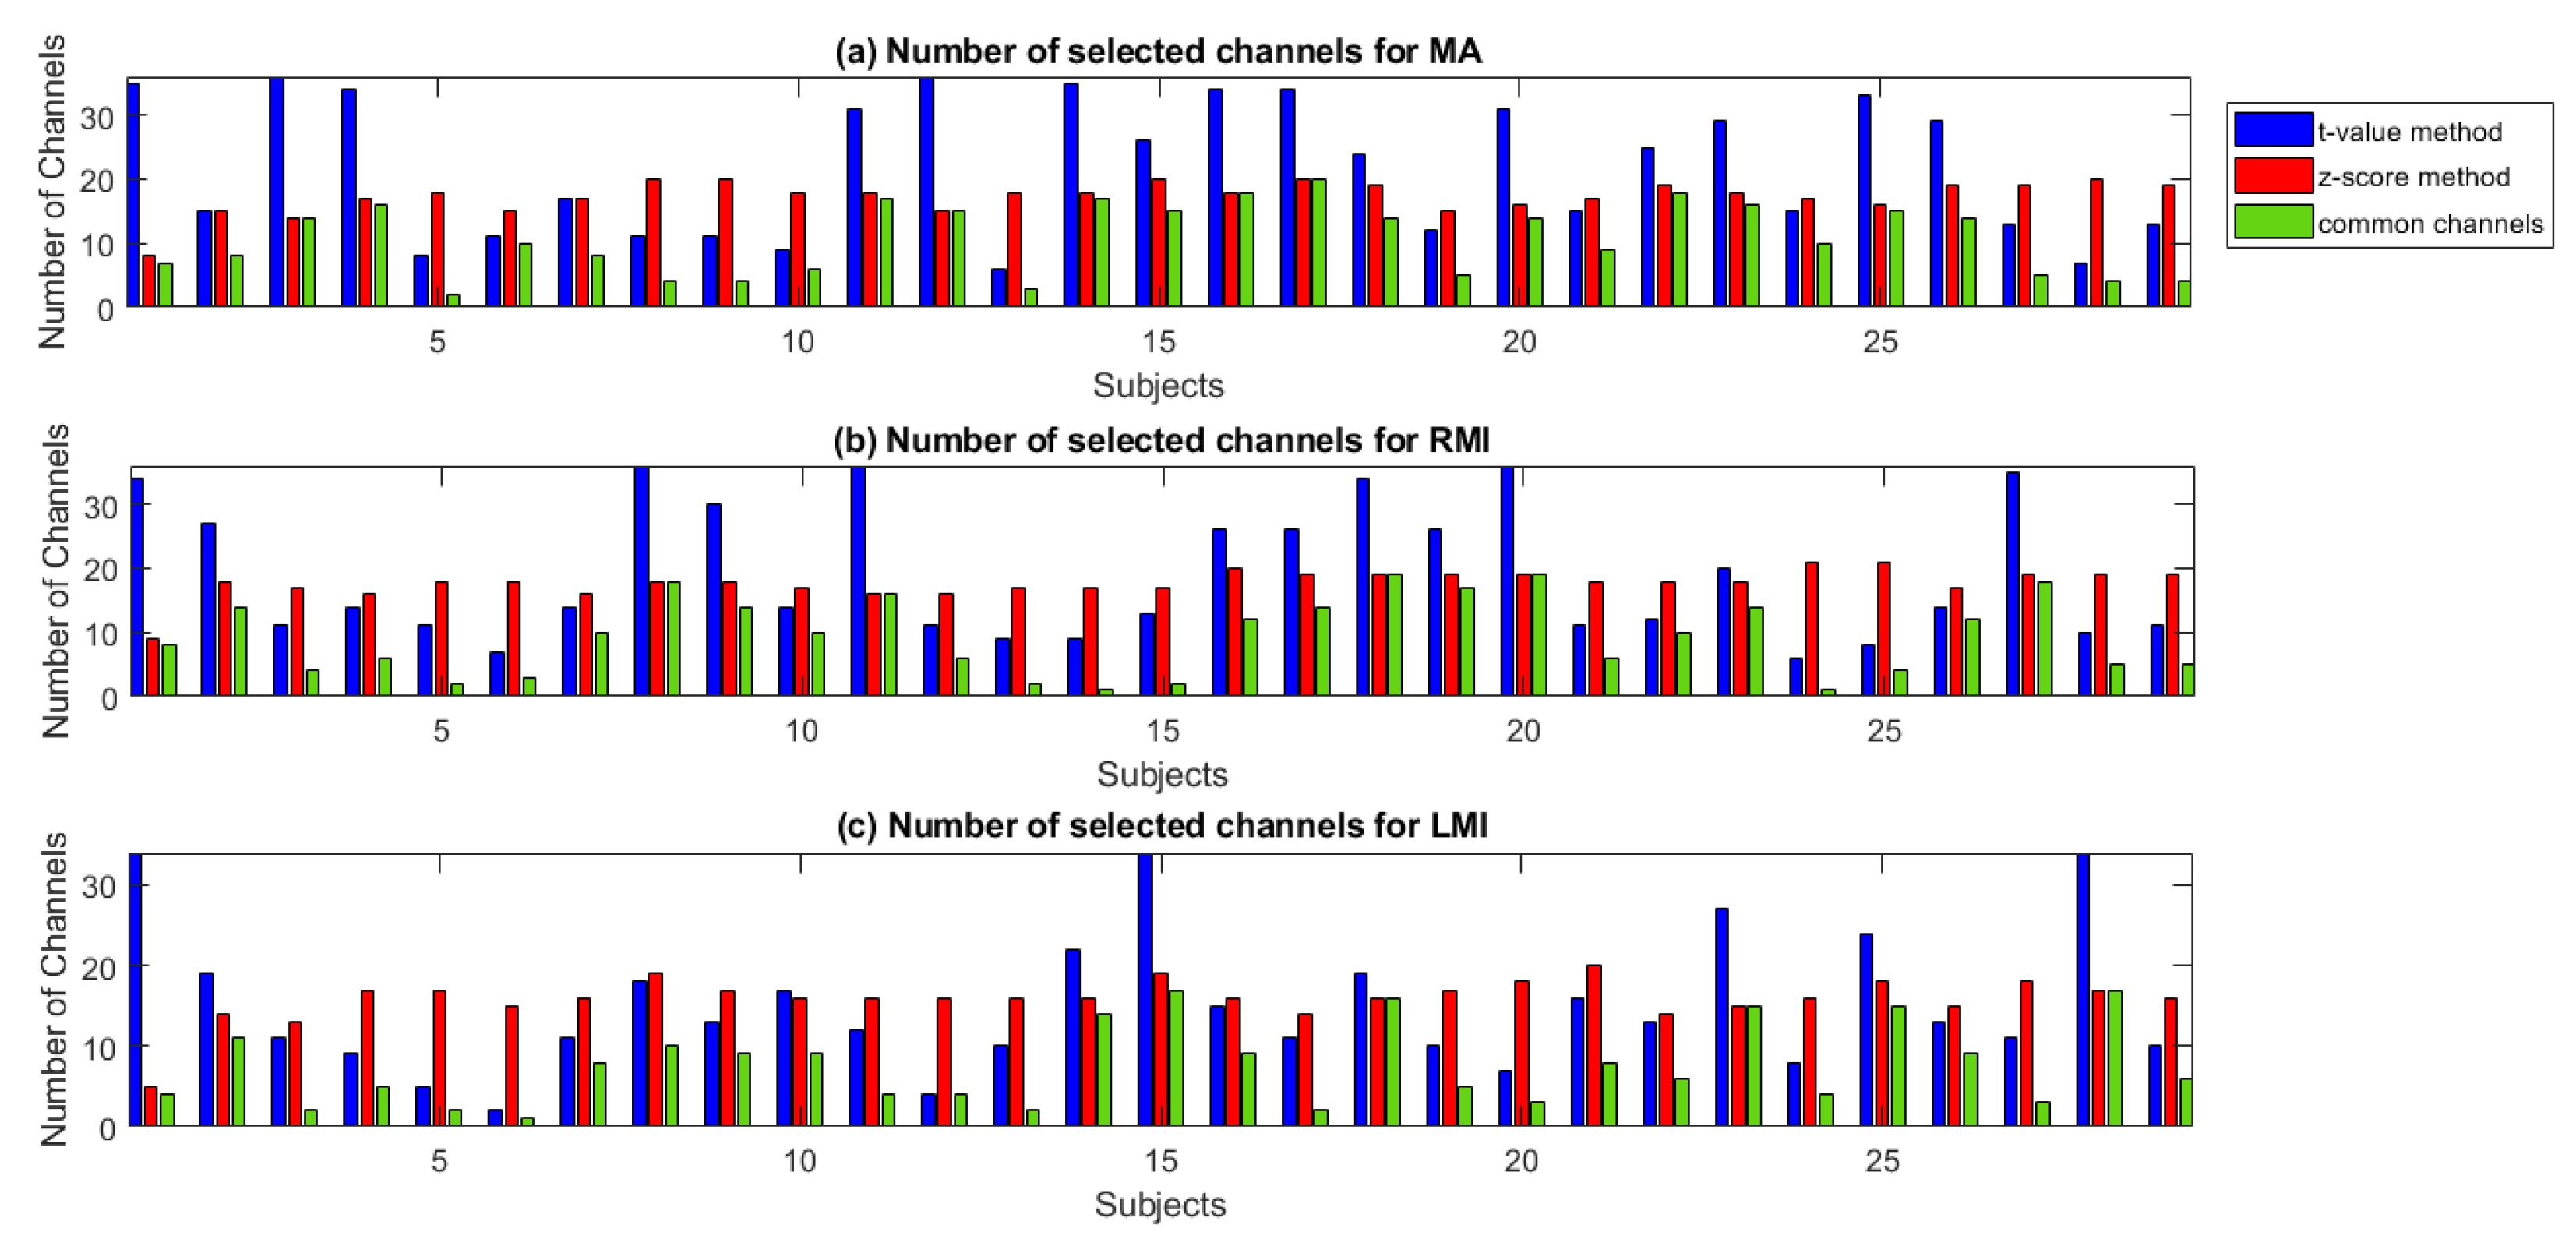
2.6. Channel Selection/Channel of Interest/Region of Interest
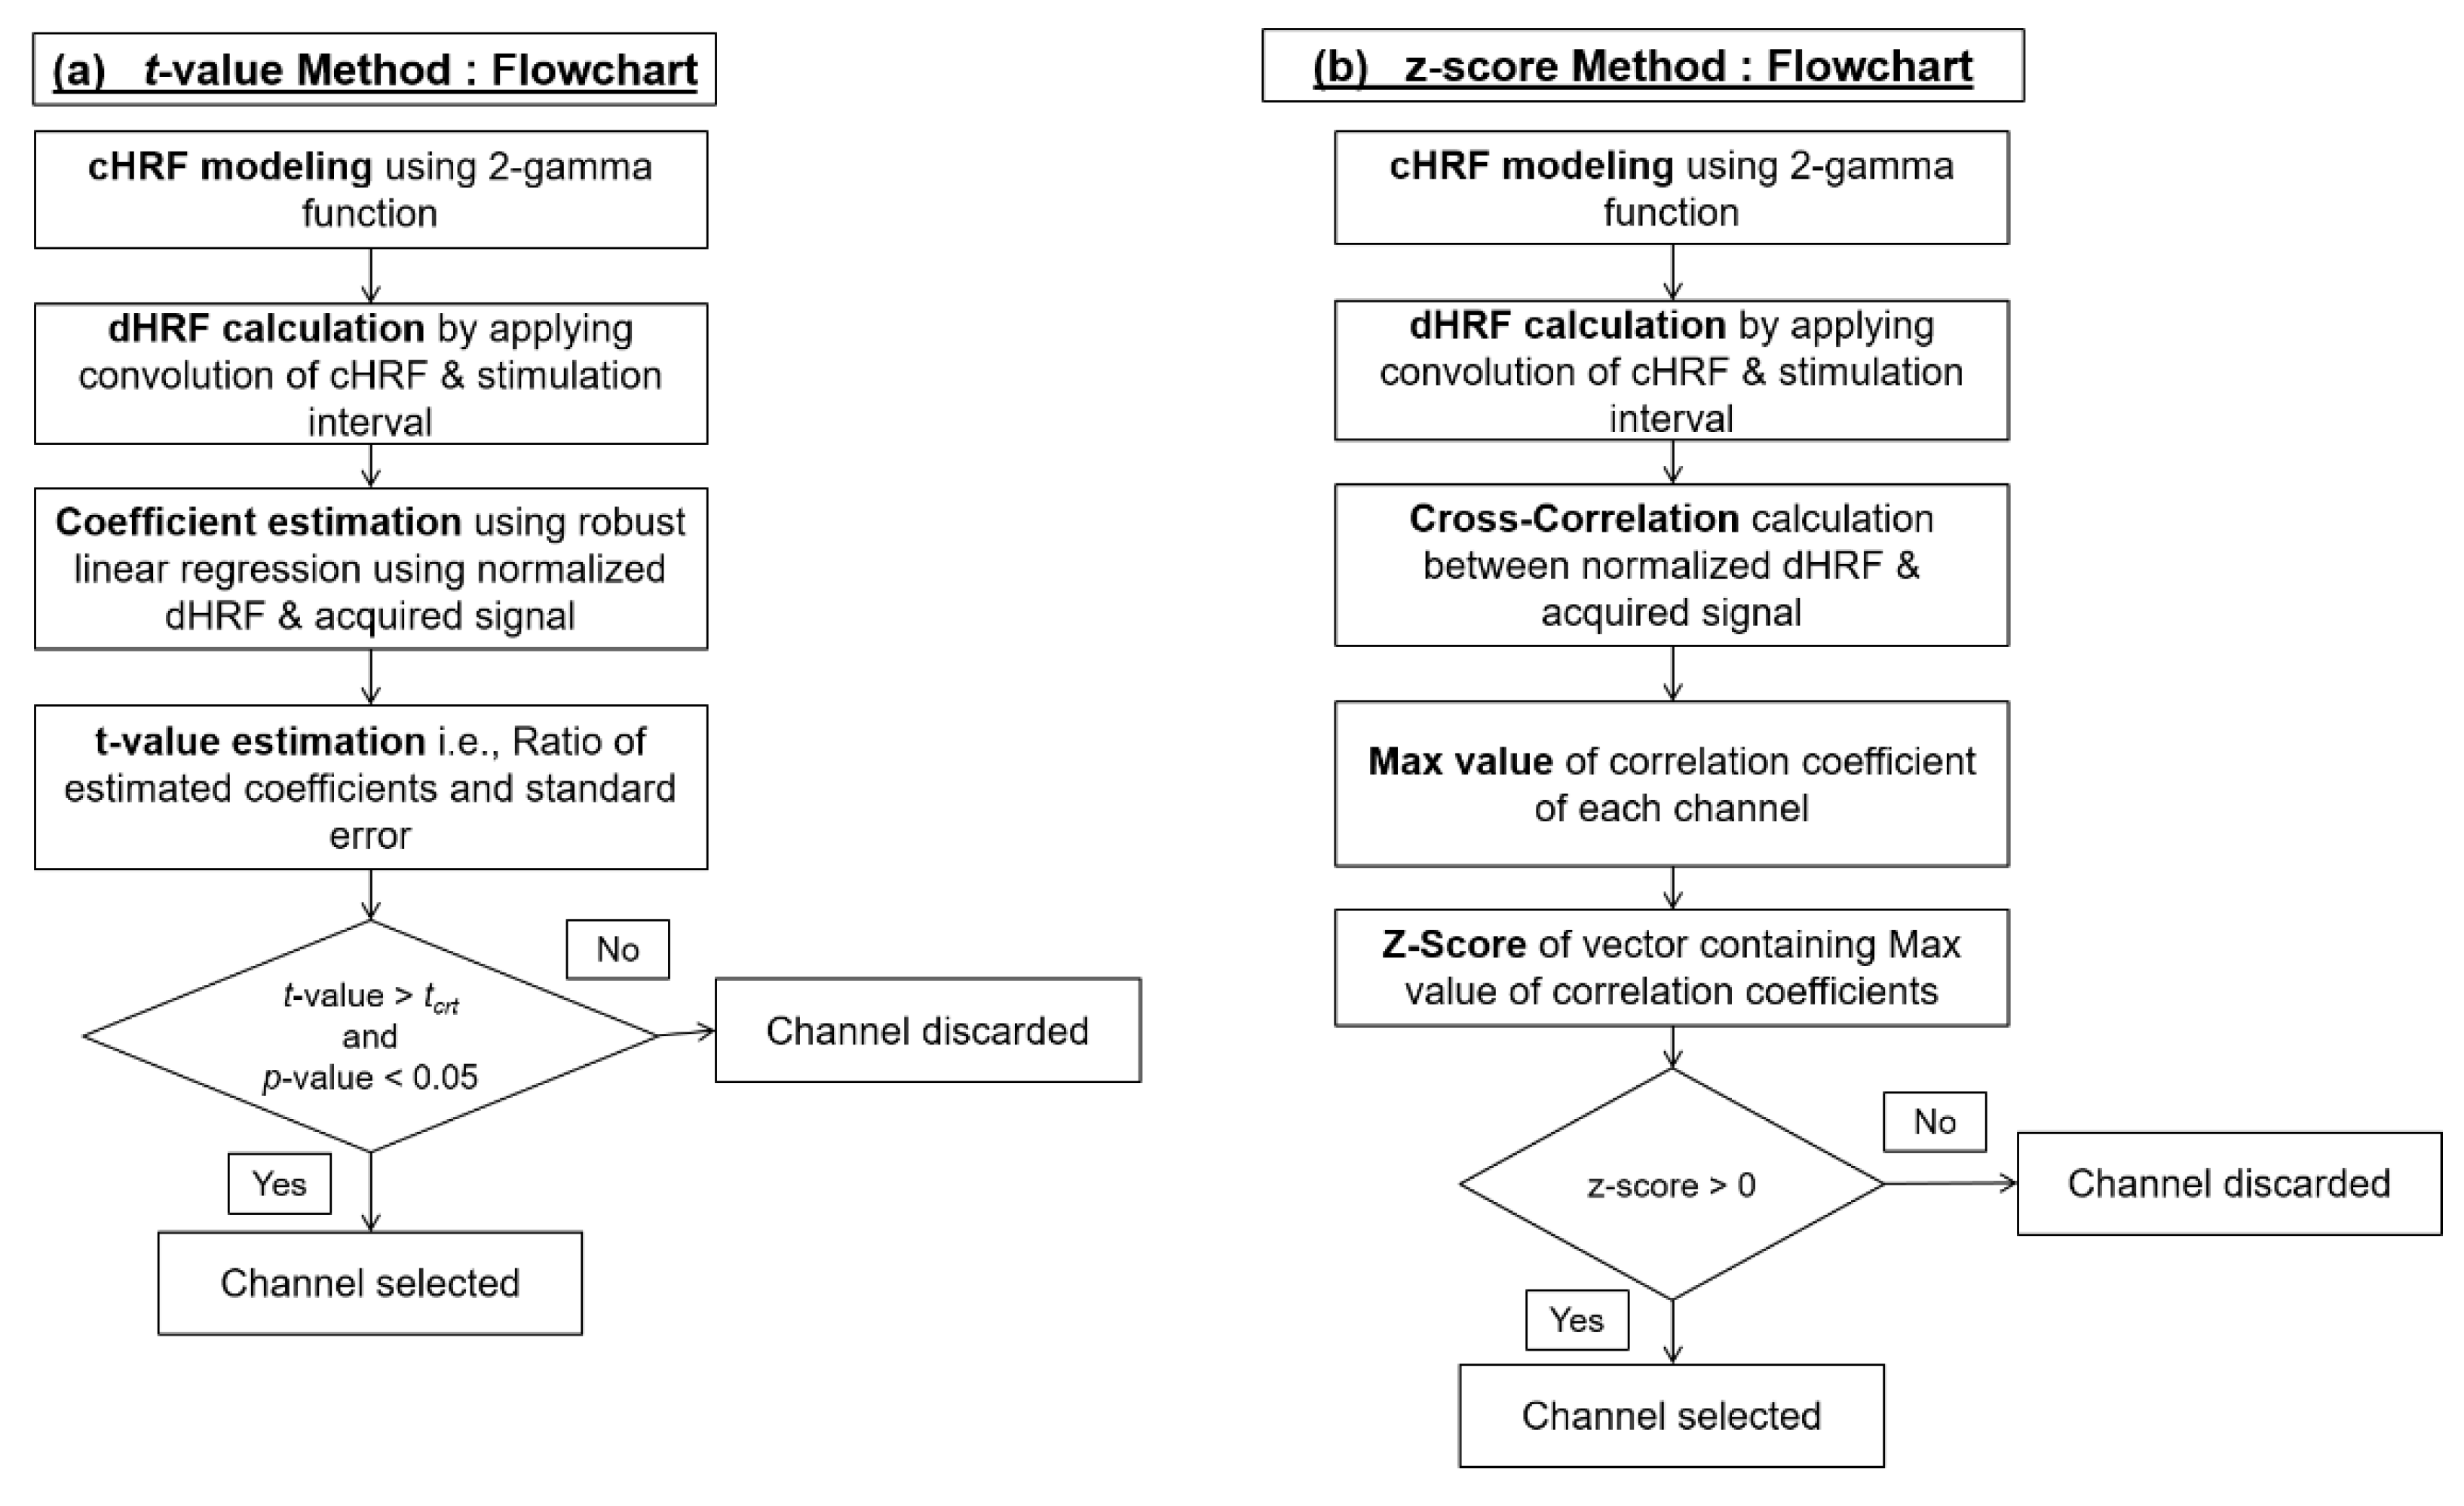
2.6.1. t-value Method
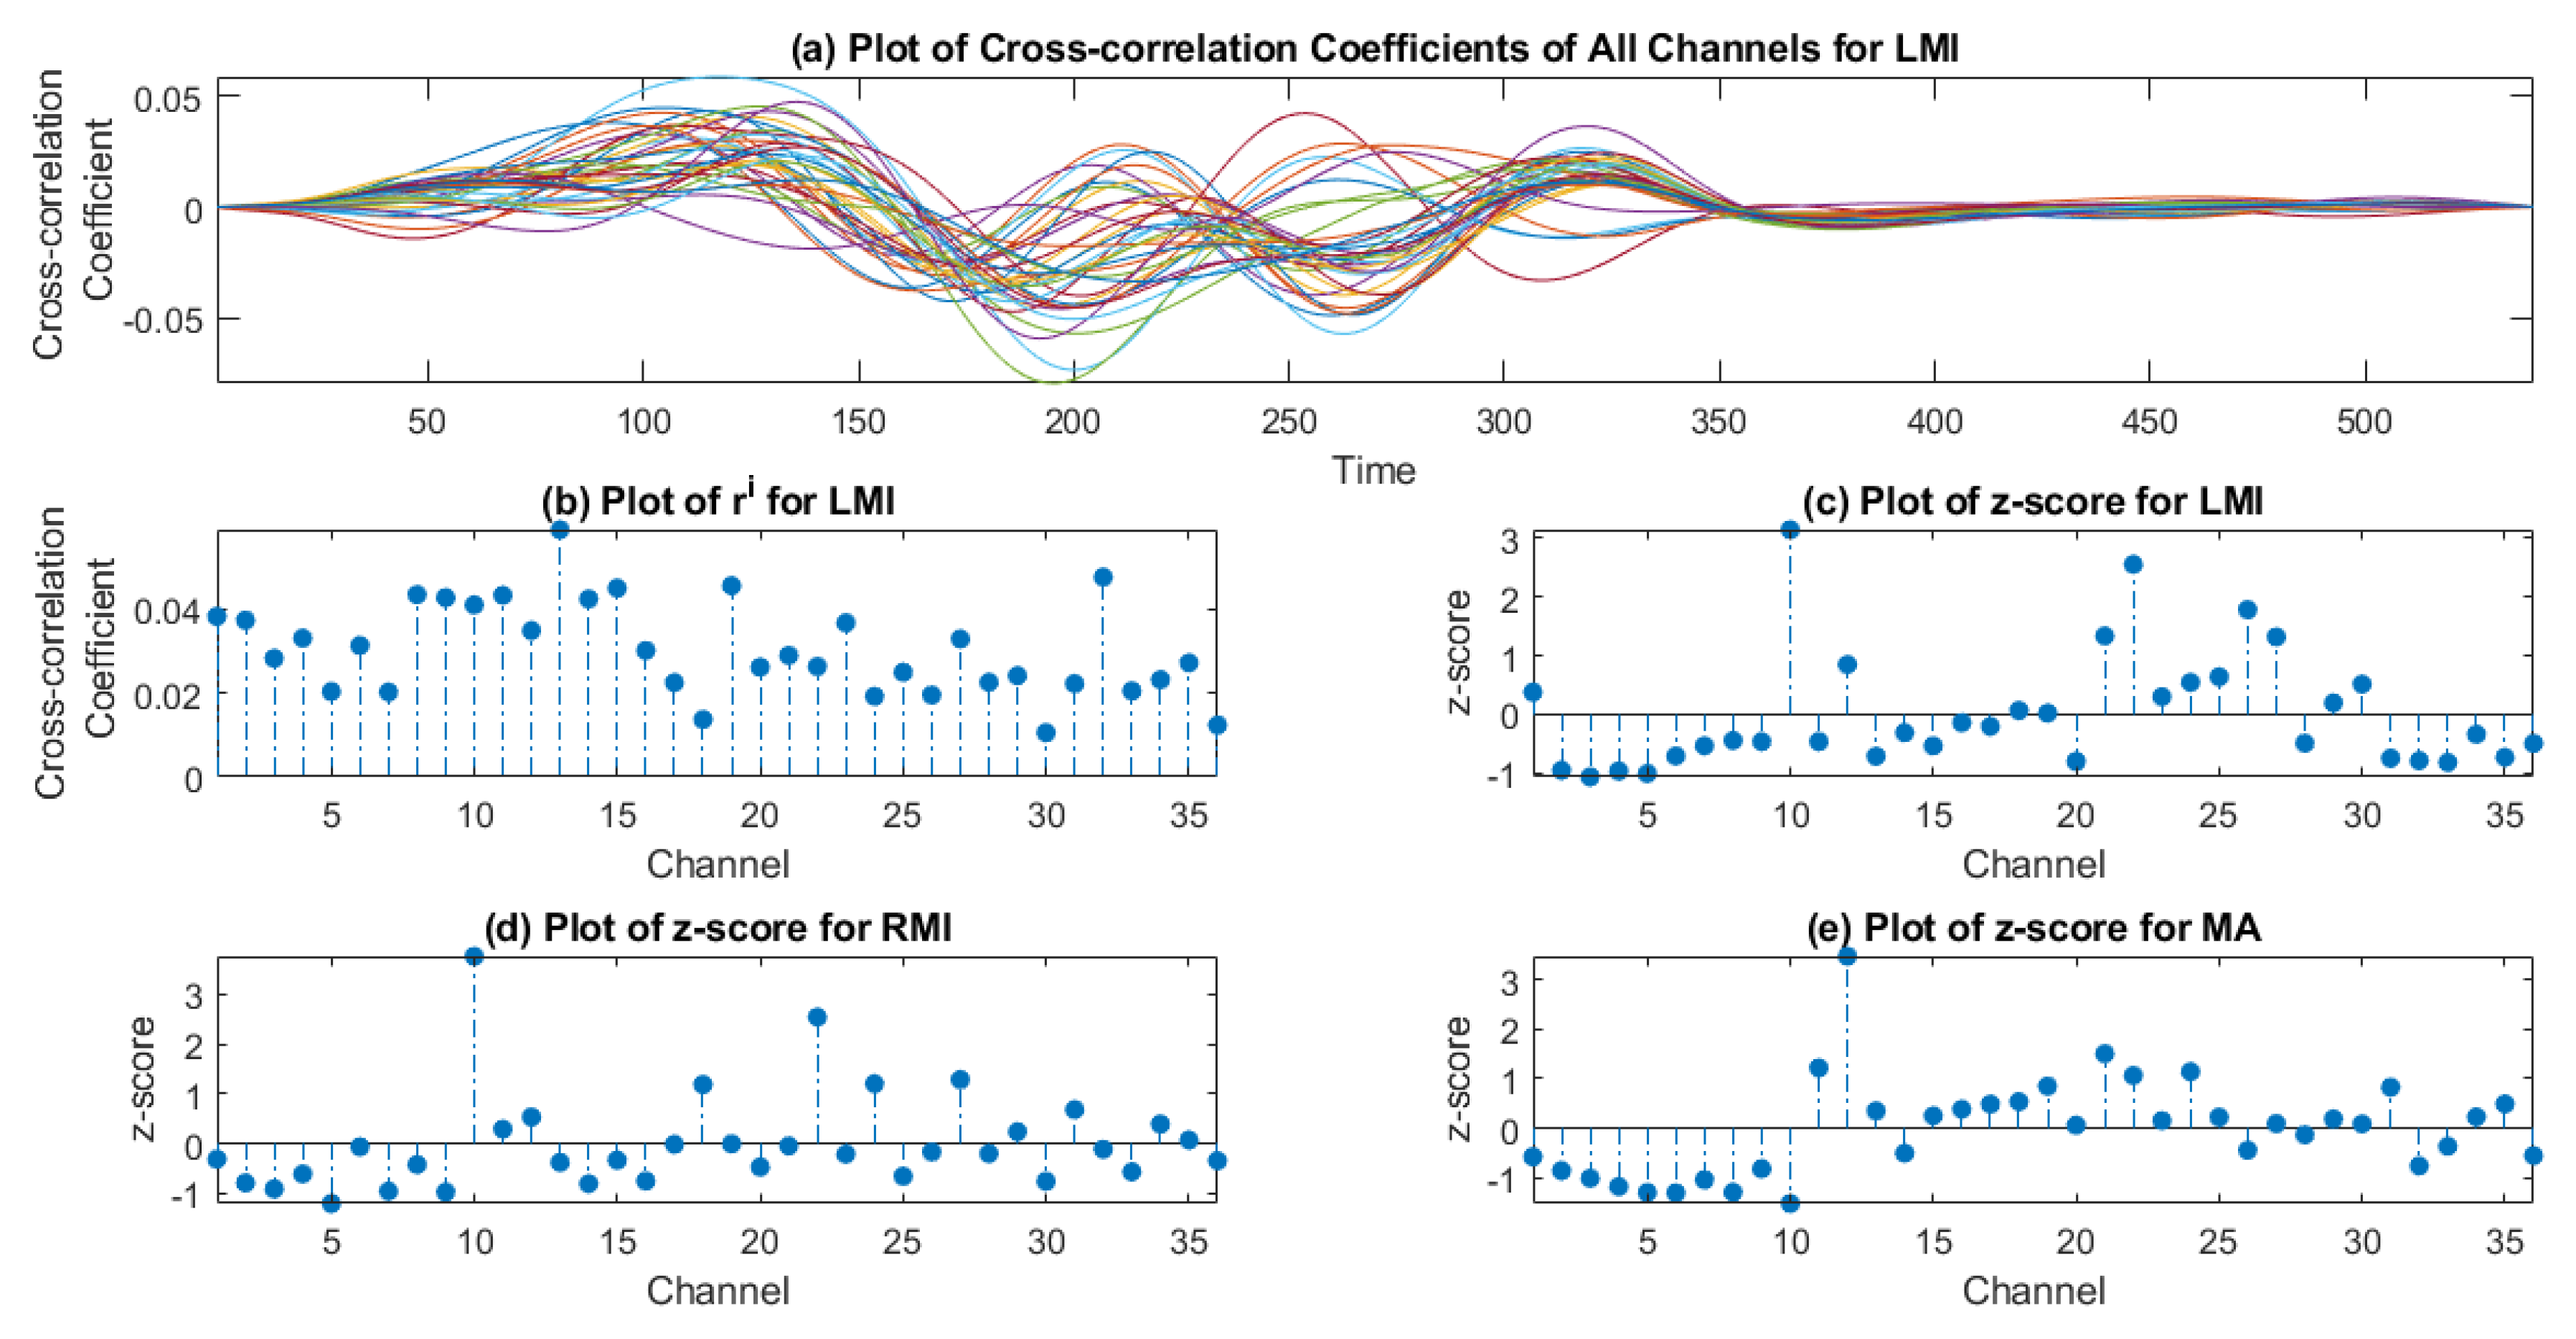
2.6.2. z-Score Method
2.7. Feature Extraction
2.7.1. Statistical Features
2.7.2. Normalization
2.8. Linear Discriminant Analysis (LDA)
3. Results
4. Validation
5. Discussion
6. Conclusions
Supplementary Materials
Author Contributions
Funding
Acknowledgments
Conflicts of Interest
References
- Wolpaw, J.R.; Birbaumer, N.; McFarland, D.J.; Pfurtscheller, G.; Vaughan, T.M. Brain-computer interfaces for communication and control. Clin. Neurophysiol. 2002, 113, 767–791. [Google Scholar] [CrossRef]
- Naseer, N.; Hong, K.-S. fNIRS-based brain-computer interfaces: A review. Front. Hum. Neurosci. 2015, 9, 1–15. [Google Scholar] [CrossRef]
- Curtin, A.; Tong, S.; Sun, J.; Wang, J.; Onaral, B.; Ayaz, H. A systematic review of integrated functional near-infrared spectroscopy (fNIRS) and transcranial magnetic stimulation (TMS) studies. Front. Neurosci. 2019, 13. [Google Scholar] [CrossRef] [PubMed]
- Pinti, P.; Aichelburg, C.; Gilbert, S.; Hamilton, A.; Hirsch, J.; Burgess, P.; Tachtsidis, I. A Review on the use of wearable functional near-infrared spectroscopy in naturalistic environments. Jpn. Psychol. Res. 2018, 60, 347–373. [Google Scholar] [CrossRef]
- Basura, G.J.; Hu, X.-S.; Juan, J.S.; Tessier, A.-M.; Kovelman, I. Human central auditory plasticity: A review of functional near-infrared spectroscopy (fNIRS) to measure cochlear implant performance and tinnitus perception. Laryngoscope Investig. Otolaryngol. 2018, 3, 463–472. [Google Scholar] [CrossRef] [PubMed]
- Ramadan, R.A.; Vasilakos, A.V. Brain computer interface: Control signals review. Neurocomputing 2017, 223, 26–44. [Google Scholar] [CrossRef]
- Liu, Y.; Piazza, E.A.; Simony, E.; Shewokis, P.A.; Onaral, B.; Hasson, U.; Ayaz, H. Measuring speaker–listener neural coupling with functional near infrared spectroscopy. Sci. Rep. 2017, 7, 43293. [Google Scholar] [CrossRef]
- Gateau, T.; Durantin, G.; Lancelot, F.; Scannella, S.; Dehais, F. Real-time state estimation in a flight simulator using fNIRS. PLoS ONE 2015, 10, e0121279. [Google Scholar] [CrossRef]
- McKendrick, R.; Parasuraman, R.; Ayaz, H. Wearable functional near infrared spectroscopy (fNIRS) and transcranial direct current stimulation (tDCS): Expanding vistas for neurocognitive augmentation. Front. Syst. Neurosci. 2015, 9, 27. [Google Scholar] [CrossRef]
- Ayaz, H.; Dehais, F. Neuroergonomics: The Brain at Work and in Everyday Life, 1st ed.; Academic Press: Cambridge, MA, USA; Elsevier: Amsterdam, The Netherlands, 2019. [Google Scholar]
- Delpy, D.T.; Cope, M.; van der Zee, P.; Arridge, S.; Wray, S.; Wyatt, J. Estimation of optical pathlength through tissue from direct time of flight measurement. Phys. Med. Biol. 1988, 33, 1433–1442. [Google Scholar] [CrossRef]
- Villringer, A.; Planck, J.; Hock, C.; Schleinkofer, L.; Dirnagl, U. Near infrared spectroscopy (NIRS): A new tool to study hemodynamic changes during activation of brain function in human adults. Neurosci. Lett. 1993, 154, 101–104. [Google Scholar] [CrossRef]
- Kopton, I.M.; Kenning, P. Near-infrared spectroscopy (NIRS) as a new tool for neuroeconomic research. Front. Hum. Neurosci. 2014, 8, 1–13. [Google Scholar] [CrossRef] [PubMed]
- Naseer, N.; Hong, K.S. Classification of functional near-infrared spectroscopy signals corresponding to the right- and left-wrist motor imagery for development of a brain-computer interface. Neurosci. Lett. 2013, 553, 84–89. [Google Scholar] [CrossRef] [PubMed]
- Naseer, N.; Hong, M.J.; Hong, K.S. Online binary decision decoding using functional near-infrared spectroscopy for the development of brain-computer interface. Exp. Brain Res. 2014, 232, 555–564. [Google Scholar] [CrossRef]
- Hong, K.S.; Naseer, N.; Kim, Y.H. Classification of prefrontal and motor cortex signals for three-class fNIRS-BCI. Neurosci. Lett. 2015, 587, 87–92. [Google Scholar] [CrossRef]
- Naseer, N.; Hong, K. Functional near-infrared spectroscopy based brain activity classification for development of a brain-computer interface. In Proceedings of the 2012 International Conference of Robotics and Artificial Intelligence, Rawalpindi, Pakistan, 22–23 October 2012; pp. 174–178. [Google Scholar]
- Naseer, N.; Hong, K.; Bhutta, M.R.; Khan, M.J. Improving classification accuracy of covert yes/no response decoding using support vector machines: An fNIRS study. In Proceedings of the 2014 International Conference on Robotics and Emerging Allied Technologies in Engineering (iCREATE), Islamabad, Pakistan, 22–24 April 2014; pp. 6–9. [Google Scholar]
- Gramann, K.; Fairclough, S.H.; Zander, T.O.; Ayaz, H. Editorial: Trends in neuroergonomics. Front. Hum. Neurosci. 2017, 11. [Google Scholar] [CrossRef]
- Franceschini, M.A.; Joseph, D.; Huppert, T.; Diamond, S.; Boas, D. Diffuse optical imaging of the whole head. J. Biomed. Opt. 2006, 11, 54007. [Google Scholar] [CrossRef]
- Khan, R.; Naseer, N.; Nazeer, H.; Khan, M.N. Control of a prosthetic leg based on walking intentions for gait rehabilitation: An fNIRS study. Front. Hum. Neurosci. 2018, 12. [Google Scholar] [CrossRef]
- Asgher, U.; Ahmad, R.; Naseer, N.; Ayaz, Y.; Khan, M.J.; Amjad, M.K. Assessment and classification of mental workload in the prefrontal cortex (PFC) using fixed-value modified beer-lambert law. IEEE Access 2019, 7, 143250–143262. [Google Scholar] [CrossRef]
- Bosworth, A.; Russell, M.; Jacob, R.J.K. Update of fNIRS as an input to brain-computer interfaces: A review of research from the tufts human-computer interaction laboratory. Photonics 2019, 6, 90. [Google Scholar] [CrossRef]
- Noori, F.M.; Naseer, N.; Qureshi, N.K.; Nazeer, H.; Khan, R.A. Optimal feature selection from fNIRS signals using genetic algorithms for BCI. Neurosci. Lett. 2017, 647, 61–66. [Google Scholar] [CrossRef]
- Qureshi, N.K.; Naseer, N.; Noori, F.M.; Nazeer, H.; Khan, R.A.; Saleem, S. Enhancing classification performance of functional near-infrared spectroscopy-brain-computer interface using adaptive estimation of general linear model coefficients. Front. Neurorobot. 2017, 11. [Google Scholar] [CrossRef] [PubMed]
- Nazeer, H.; Naseer, N.; Khan, R.A.; Noori, F.M.; Qureshi, N.K.; Khan, U.S.; Khan, M.J. Enhancing classification accuracy of fNIRS-BCI using features acquired from vector-based phase analysis. J. Neural Eng. 2020, 17, 56025. [Google Scholar] [CrossRef]
- Alotaiby, T.; El-Samie, F.E.A.; Alshebeili, S.A.; Ahmad, I. A review of channel selection algorithms for EEG signal processing. EURASIP J. Adv. Signal. Process. 2015, 2015, 66. [Google Scholar] [CrossRef]
- Qiu, Z.; Jin, J.; Lam, H.-K.; Zhang, Y.; Wang, X.; Cichocki, A. Improved SFFS method for channel selection in motor imagery based BCI. Neurocomputing 2016, 207, 519–527. [Google Scholar] [CrossRef]
- Shan, H.; Xu, H.; Zhu, S.; He, B. A novel channel selection method for optimal classification in different motor imagery BCI paradigms. Biomed. Eng. Online 2015, 14, 93. [Google Scholar] [CrossRef] [PubMed]
- Li, C.; Jia, T.; Xu, Q.; Ji, L.; Pan, Y. Brain-computer interface channel-selection strategy based on analysis of event-related desynchronization topography in stroke patients. J. Healthc. Eng. 2019, 2019, 3817124. [Google Scholar] [CrossRef]
- Tao, W.; Li, C.; Song, R.; Cheng, J.; Liu, Y.; Wan, F.; Chen, X. EEG-based emotion recognition via channel-wise attention and self attention. IEEE Trans. Affect. Comput. 2020, 70, 1. [Google Scholar] [CrossRef]
- Jin, J.; Liu, C.; Daly, I.; Miao, Y.; Li, S.; Wang, X.; Cichocki, A. Bispectrum-based channel selection for motor imagery based brain-computer interfacing. IEEE Trans. Neural Syst. Rehabil. Eng. 2020, 28, 2153–2163. [Google Scholar] [CrossRef]
- Rojas, R.F.; Huang, X.; Ou, K.L.; Lopez-Aparicio, J. Cross correlation analysis of multi-channel near infrared spectroscopy. Comput. Sci. Inf. Technol. 2016, 6, 23–33. [Google Scholar] [CrossRef]
- Verner, M.; Herrmann, M.J.; Troche, S.J.; Roebers, C.M.; Rammsayer, T.H. Cortical oxygen consumption in mental arithmetic as a function of task difficulty: A near-infrared spectroscopy approach. Front. Hum. Neurosci. 2013, 7, 217. [Google Scholar] [CrossRef] [PubMed]
- Song, X.; Pogue, B.W.; Jiang, S.; Doyley, M.M.; Dehghani, H.; Tosteson, T.D.; Paulsen, K.D. Automated region detection based on the contrast-to-noise ratio in near-infrared tomography. Appl. Opt. 2004, 43, 1053–1062. [Google Scholar] [CrossRef] [PubMed]
- Rivera, M.M.; Arentoft, A.; Kubo, G.K.; D’Aquila, E.; Scheiner, D.; Pizzirusso, M.; Sandoval, T.C.; Gollan, T.H. Neuropsychological, cognitive, and theoretical considerations for evaluation of bilingual individuals. Neuropsychol. Rev. 2008, 18, 255–268. [Google Scholar] [CrossRef]
- Al-Shargie, F.; Kiguchi, M.; Badruddin, N.; Dass, S.C.; Hani, A.F.M.; Tang, T.B. Mental stress assessment using simultaneous measurement of EEG and fNIRS. Biomed. Opt. Express 2016, 7, 3882. [Google Scholar] [CrossRef] [PubMed]
- Li, R.; Potter, T.; Huang, W.; Zhang, Y. Enhancing performance of a hybrid EEG-fNIRS system using channel selection and early temporal features. Front. Hum. Neurosci. 2017, 11, 1–11. [Google Scholar] [CrossRef]
- Hu, X.-S.; Hong, K.-S.; Ge, S.S.; Jeong, M.-Y. Kalman estimator- and general linear model-based on-line brain activation mapping by near-infrared spectroscopy. Biomed. Eng. Online 2010, 9, 82. [Google Scholar] [CrossRef] [PubMed]
- Hong, K.S.; Khan, M.J. Hybrid brain-computer interface techniques for improved classification accuracy and increased number of commands: A review. Front. Neurorobot. 2017, 11. [Google Scholar] [CrossRef]
- Nguyen, H.-D.; Hong, K.-S. Bundled-optode implementation for 3D imaging in functional near-infrared spectroscopy. Biomed. Opt. Express 2016, 7, 3491. [Google Scholar] [CrossRef]
- Lindquist, M.A.; Meng Loh, J.; Atlas, L.Y.; Wager, T.D. Modeling the hemodynamic response function in fMRI: Efficiency, bias and mis-modeling. Neuroimage 2009, 45, S187–S198. [Google Scholar] [CrossRef]
- Shan, Z.Y.; Wright, M.J.; Thompson, P.M.; McMahon, K.L.; Blokland, G.G.A.M.; de Zubicaray, G.I.; Martin, N.G.; Vinkhuyzen, A.A.E.; Reutens, D.C. Modeling of the hemodynamic responses in block design fMRI studies. J. Cereb. Blood Flow Metab. J. Int. Soc. Cereb. Blood Flow Metab. 2014, 34, 316–324. [Google Scholar] [CrossRef]
- Santosa, H.; Hong, M.J.; Hong, K.S. Lateralization of music processing with noises in the auditory cortex: An fNIRS study. Front. Behav. Neurosci. 2014, 8, 1–9. [Google Scholar] [CrossRef] [PubMed]
- Shin, J.; Von Luhmann, A.; Blankertz, B.; Kim, D.W.; Jeong, J.; Hwang, H.J.; Muller, K.R. Open access dataset for EEG+NIRS single-trial classification. IEEE Trans. Neural Syst. Rehabil. Eng. 2017, 25, 1735–1745. [Google Scholar] [CrossRef]
- Abdalmalak, A.; Milej, D.; Norton, L.; Debicki, D.B.; Gofton, T.; Diop, M.; Owen, A.M.; St. Lawrence, K. Single-session communication with a locked-in patient by functional near-infrared spectroscopy. Neurophotonics 2017, 4, 1. [Google Scholar] [CrossRef]
- Shin, J.; Kwon, J.; Choi, J.; Im, C.H. Performance enhancement of a brain-computer interface using high-density multi-distance NIRS. Sci. Rep. 2017, 7, 1–10. [Google Scholar] [CrossRef]
- Trakoolwilaiwan, T.; Behboodi, B.; Lee, J.; Kim, K.; Choi, J.-W. P10 Convolutional neural network for high-accuracy functional near- infrared spectroscopy in a brain—computer interface: Three-class classification of rest, right-, and left-hand motor execution. Neurophotonics 2017, 5. [Google Scholar] [CrossRef] [PubMed]
- Khan, R.A.; Naseer, N.; Saleem, S.; Qureshi, N.K.; Noori, F.M.; Khan, M.J. Cortical tasks-based optimal filter selection: An fNIRS study. J. Healthc. Eng. 2020, 2020, 1–15. [Google Scholar] [CrossRef]
- Gratton, G.; Brumback, C.R.; Gordon, B.A.; Pearson, M.A.; Low, K.A.; Fabiani, M. Effects of measurement method, wavelength, and source-detector distance on the fast optical signal. Neuroimage 2006, 32, 1576–1590. [Google Scholar] [CrossRef] [PubMed]
- Zhang, Q.; Brown, E.N.; Strangman, G.E. Adaptive filtering to reduce global interference in evoked brain activity detection: A human subject case study. J. Biomed. Opt. 2007, 12, 064009. [Google Scholar] [CrossRef]
- Abdelnour, A.F.; Huppert, T. Real-time imaging of human brain function by near-infrared spectroscopy using an adaptive general linear model. Neuroimage 2009, 46, 133–143. [Google Scholar] [CrossRef]
- Nicolas-Alonso, L.F.; Gomez-Gil, J. Brain computer interfaces, a review. Sensors 2012, 12, 1211–1279. [Google Scholar] [CrossRef]
- Noori, F.M.; Qureshi, N.K.; Khan, R.A.; Naseer, N. Feature selection based on modified genetic algorithm for optimization of functional near-infrared spectroscopy (fNIRS) signals for BCI. In Proceedings of the 2016 2nd International Conference on Robotics and Artificial Intelligence (ICRAI), Rawalpindi, Pakistan, 1–2 November 2016; pp. 50–53. [Google Scholar]
- Hong, K.S.; Khan, M.J.; Hong, M.J. Feature extraction and classification methods for hybrid fNIRS-EEG brain-computer interfaces. Front. Hum. Neurosci. 2018, 12, 1–25. [Google Scholar] [CrossRef] [PubMed]
- Khan, R.A.; Naseer, N.; Qureshi, N.K.; Noori, F.M.; Nazeer, H.; Khan, M.U. FNIRS-based neurorobotic interface for gait rehabilitation. J. Neuroeng. Rehabil. 2018, 15, 7. [Google Scholar] [CrossRef] [PubMed]
- Naseer, N.; Noori, F.M.; Qureshi, N.K.; Hong, K.S. Determining optimal feature-combination for LDA classification of functional near-infrared spectroscopy signals in brain-computer interface application. Front. Hum. Neurosci. 2016, 10, 1–10. [Google Scholar] [CrossRef]
- Navidi, W.C. Statistics for Engineers and Scientists; McGraw-Hill Higher Education: New York, NY, USA, 2008. [Google Scholar]
- Park, S.; Park, J.; Shin, J.; Jeong, J. Open Access fNIRS Dataset for Classification of the Unilateral Finger- and Foot-Tapping. Available online: https://figshare.com/articles/Open_access_fNIRS_dataset_for_classification_of_the_unilateral_finger-_and_foot-tapping/9783755/1 (accessed on 15 June 2020).
- Naseer, N.; Qureshi, N.K.; Noori, F.M.; Hong, K. Analysis of different classification techniques for two-class functional near-infrared spectroscopy-based brain-computer interface. Comput. Intell. Neurosci. 2016, 2016, 1–11. [Google Scholar] [CrossRef] [PubMed]
- Zafar, A.; Hong, K.S. Neuronal activation detection using vector phase analysis with dual threshold circles: A functional near-infrared spectroscopy study. Int. J. Neural Syst. 2018, 28. [Google Scholar] [CrossRef]
- Zafar, A.; Ghafoor, U.; Yaqub, M.A.; Hong, K.-S. Initial-dip-based classification for fNIRS-BCI. In Neural Imaging and Sensing 2019; Luo, Q., Ding, J., Fu, L., Eds.; SPIE: San Francisco, CA, USA, 2019; p. 60. [Google Scholar]
- Hong, K.S.; Santosa, H. Decoding four different sound-categories in the auditory cortex using functional near-infrared spectroscopy. Hear. Res. 2016, 333, 157–166. [Google Scholar] [CrossRef]
- Petrantonakis, P.C.; Kompatsiaris, I. Single-trial NIRS data classification for brain-computer interfaces using graph signal processing. IEEE Trans. Neural Syst. Rehabil. Eng. 2018, 26, 1700–1709. [Google Scholar] [CrossRef]
- Curtin, A.; Ayaz, H. The age of neuroergonomics: Towards ubiquitous and continuous measurement of brain function with fNIRS. Jpn. Psychol. Res. 2018, 60, 374–386. [Google Scholar] [CrossRef]
- Gateau, T.; Ayaz, H.; Dehais, F. In silico vs. over the clouds: On-the-fly mental state estimation of aircraft pilots, using a functional near infrared spectroscopy based passive-BCI. Front. Hum. Neurosci. 2018, 12, 187. [Google Scholar] [CrossRef]
- Khan, R.A.; Naseer, N.; Khan, M.J. Neuroergonomics; Elsevier: Amsterdam, The Netherlands, 2019; pp. 79–85. [Google Scholar]


| MA | LMI | RMI | |||||||
|---|---|---|---|---|---|---|---|---|---|
| z-Score Method | t-Value Method | All Channels | z-Score Method | t-Value Method | All Channels | z-Score Method | t-Value Method | All Channels | |
| (%) | |||||||||
| Sub 1 | 75 | 85 | 90 | 90 | 70 | 55 | 90 | 70 | 75 |
| Sub 2 | 90 | 70 | 80 | 85 | 80 | 90 | 85 | 65 | 75 |
| Sub 3 | 80 | 70 | 70 | 95 | 75 | 65 | 90 | 80 | 75 |
| Sub 4 | 95 | 80 | 80 | 85 | 70 | 75 | 85 | 80 | 65 |
| Sub 5 | 90 | 65 | 55 | 90 | 55 | 80 | 85 | 75 | 65 |
| Sub 6 | 90 | 45 | 55 | 95 | 80 | 85 | 90 | 60 | 65 |
| Sub 7 | 90 | 70 | 80 | 80 | 65 | 65 | 90 | 55 | 85 |
| Sub 8 | 90 | 60 | 90 | 90 | 80 | 85 | 85 | 85 | 85 |
| Sub 9 | 90 | 80 | 60 | 75 | 65 | 70 | 100 | 90 | 85 |
| Sub 10 | 85 | 80 | 85 | 80 | 70 | 75 | 85 | 80 | 70 |
| Sub 11 | 95 | 90 | 85 | 85 | 70 | 70 | 95 | 70 | 70 |
| Sub 12 | 90 | 75 | 75 | 95 | 80 | 80 | 75 | 65 | 65 |
| Sub 13 | 95 | 45 | 70 | 90 | 70 | 70 | 90 | 90 | 80 |
| Sub 14 | 90 | 70 | 70 | 95 | 85 | 90 | 95 | 65 | 65 |
| Sub 15 | 95 | 70 | 75 | 85 | 85 | 85 | 90 | 75 | 90 |
| Sub 16 | 75 | 75 | 70 | 90 | 80 | 75 | 90 | 60 | 80 |
| Sub 17 | 85 | 80 | 80 | 95 | 80 | 85 | 95 | 80 | 85 |
| Sub 18 | 85 | 90 | 90 | 90 | 70 | 85 | 90 | 90 | 90 |
| Sub 19 | 85 | 80 | 85 | 70 | 85 | 85 | 80 | 85 | 80 |
| Sub 20 | 95 | 95 | 85 | 95 | 50 | 80 | 95 | 60 | 60 |
| Sub 21 | 75 | 80 | 80 | 85 | 75 | 80 | 85 | 60 | 90 |
| Sub 22 | 85 | 75 | 85 | 80 | 60 | 70 | 95 | 80 | 75 |
| Sub 23 | 80 | 75 | 80 | 95 | 80 | 80 | 80 | 65 | 70 |
| Sub 24 | 95 | 60 | 80 | 80 | 70 | 85 | 90 | 35 | 75 |
| Sub 25 | 100 | 90 | 80 | 95 | 85 | 90 | 75 | 45 | 50 |
| Sub 26 | 90 | 85 | 90 | 80 | 80 | 70 | 95 | 70 | 75 |
| Sub 27 | 80 | 65 | 75 | 85 | 75 | 65 | 95 | 85 | 85 |
| Sub 28 | 100 | 60 | 70 | 95 | 85 | 85 | 90 | 75 | 90 |
| Sub 29 | 85 | 80 | 80 | 80 | 85 | 80 | 80 | 45 | 55 |
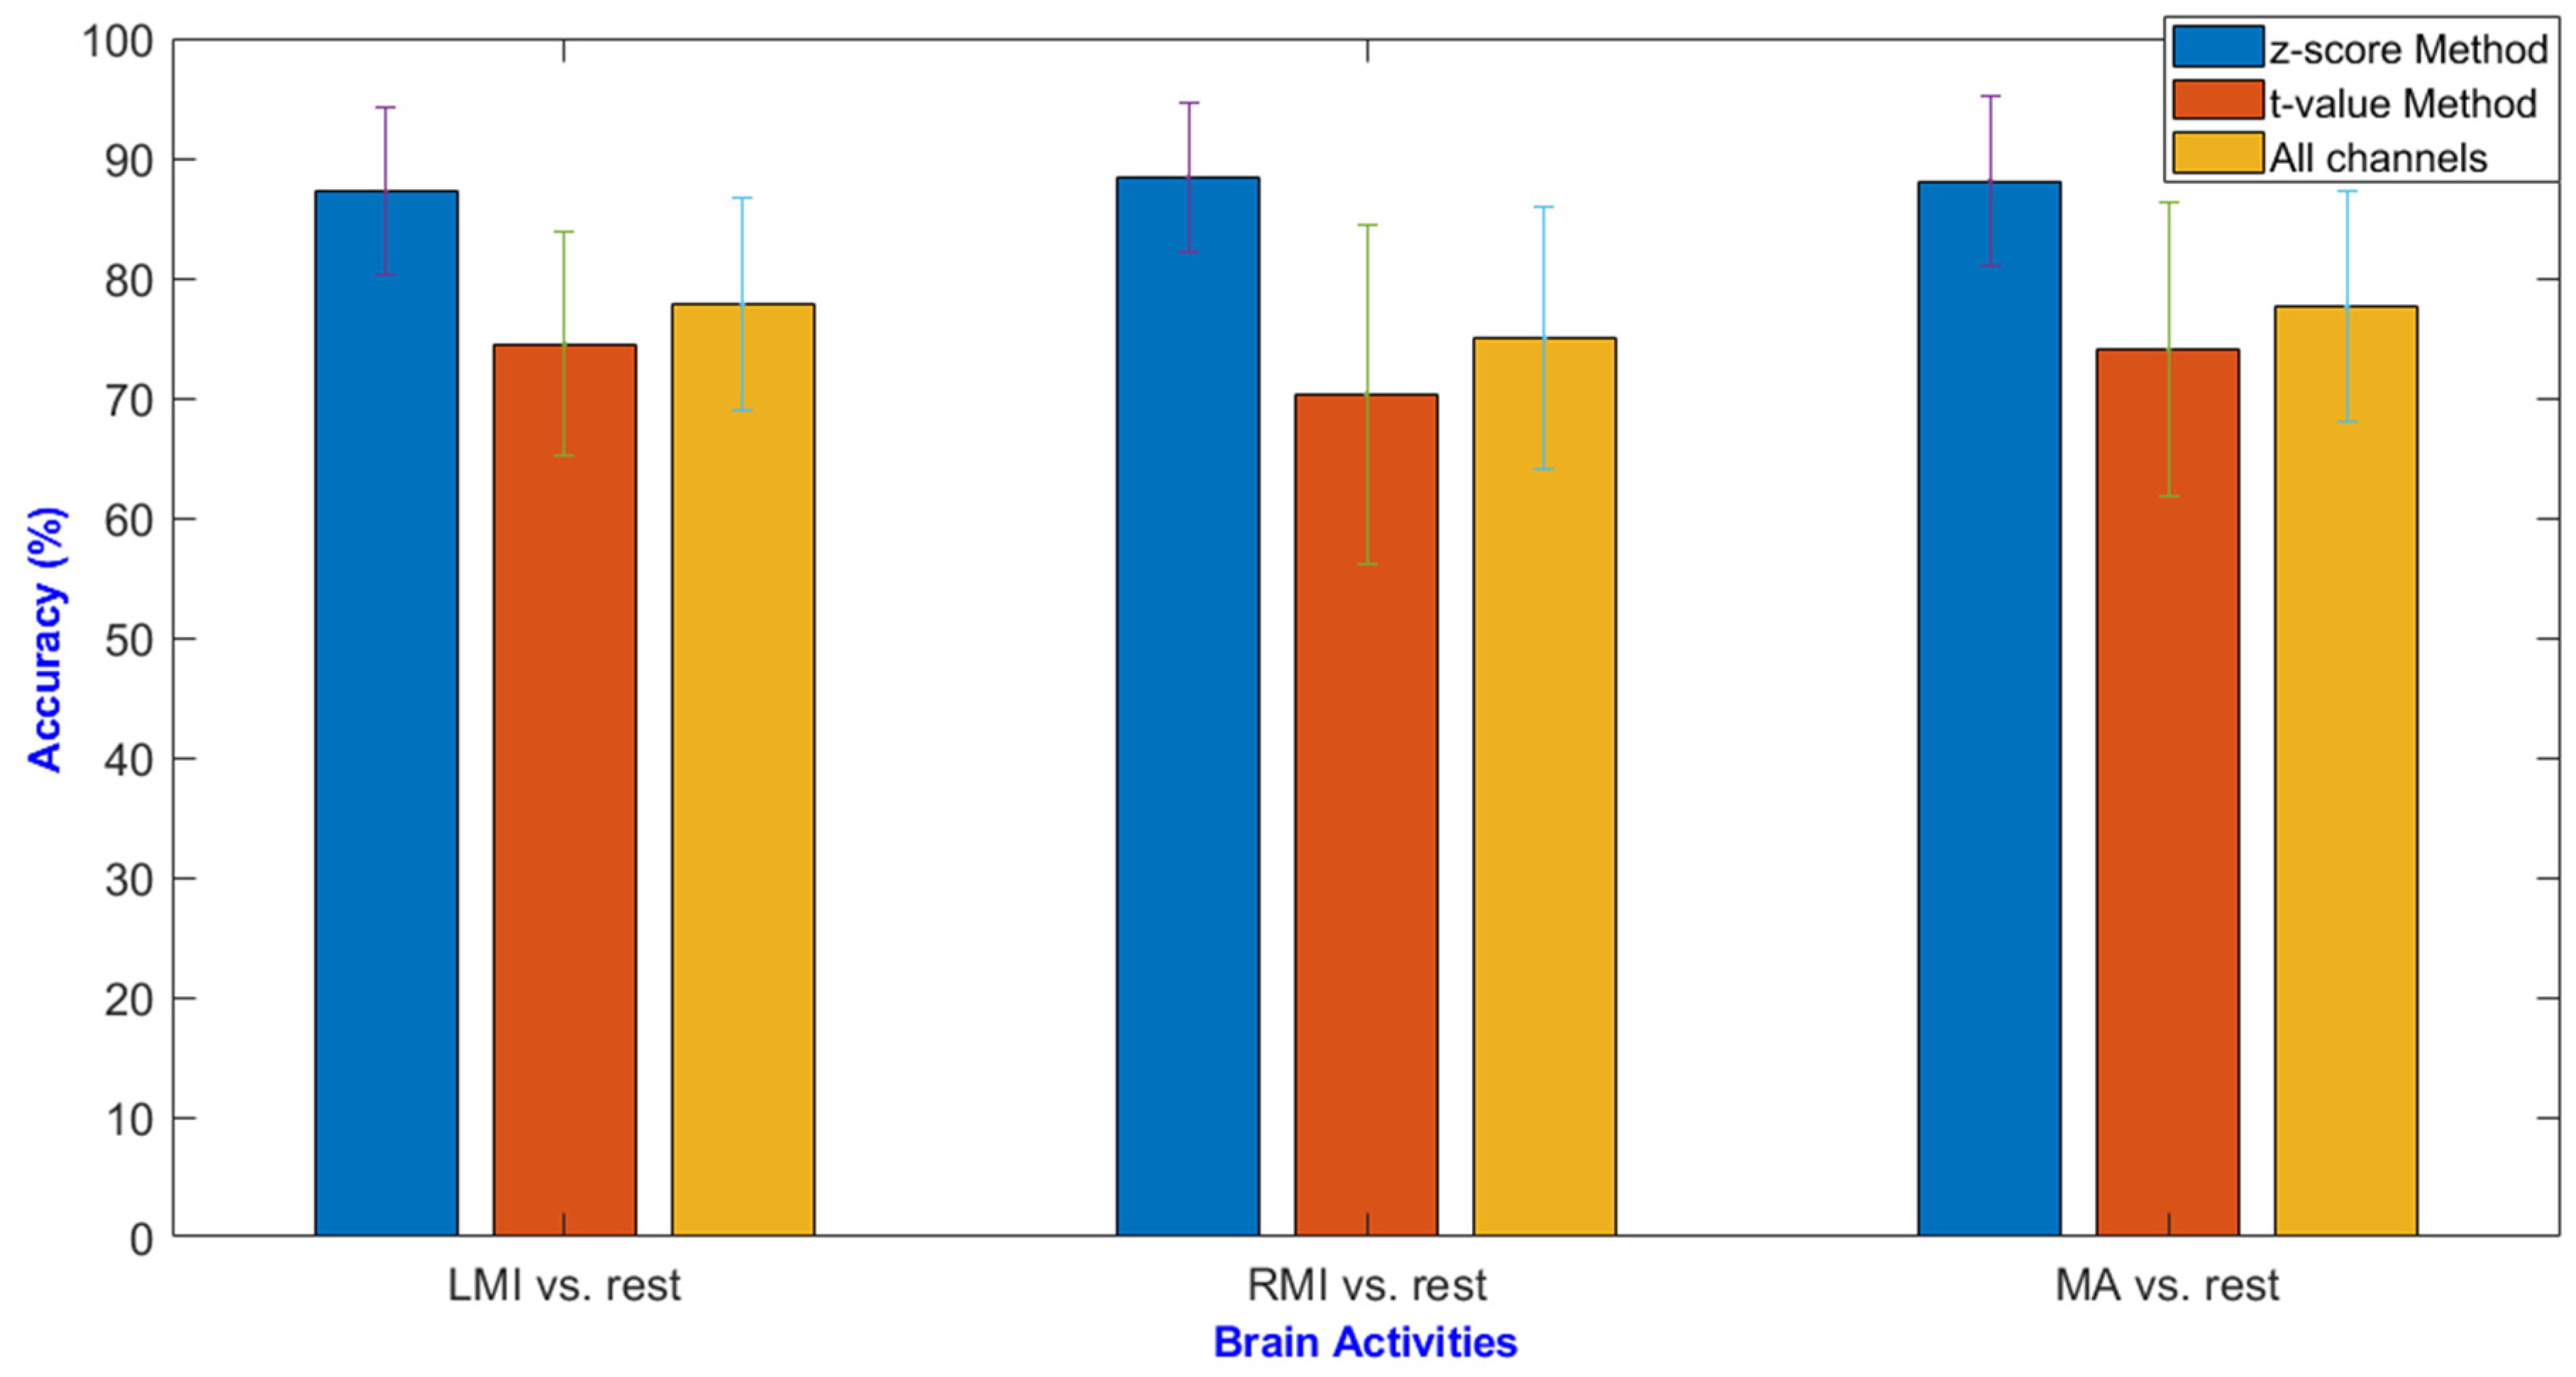
| Average | 88.1 | 74.0 | 77.6 | 87.2 | 74.5 | 77.8 | 88.4 | 70.3 | 75.0 |
| Bonferroni Correction Applied (p < 0. 0167) | |||
|---|---|---|---|
| LMI vs. Rest | RMI vs. Rest | MA vs. Rest | |
| z-score method vs. t-value method | 2.21 × 10⁻⁷ | 5.34 × 10⁻⁸ | 1.47 × 10⁻⁶ |
| z-score method vs. all channels | 3.50 × 10⁻⁵ | 3.54 × 10⁻⁷ | 1.37 × 10⁻⁵ |
Publisher’s Note: MDPI stays neutral with regard to jurisdictional claims in published maps and institutional affiliations. |
© 2020 by the authors. Licensee MDPI, Basel, Switzerland. This article is an open access article distributed under the terms and conditions of the Creative Commons Attribution (CC BY) license (http://creativecommons.org/licenses/by/4.0/).
Share and Cite
Nazeer, H.; Naseer, N.; Mehboob, A.; Khan, M.J.; Khan, R.A.; Khan, U.S.; Ayaz, Y. Enhancing Classification Performance of fNIRS-BCI by Identifying Cortically Active Channels Using the z-Score Method. Sensors 2020, 20, 6995. https://doi.org/10.3390/s20236995
Nazeer H, Naseer N, Mehboob A, Khan MJ, Khan RA, Khan US, Ayaz Y. Enhancing Classification Performance of fNIRS-BCI by Identifying Cortically Active Channels Using the z-Score Method. Sensors. 2020; 20(23):6995. https://doi.org/10.3390/s20236995
Chicago/Turabian StyleNazeer, Hammad, Noman Naseer, Aakif Mehboob, Muhammad Jawad Khan, Rayyan Azam Khan, Umar Shahbaz Khan, and Yasar Ayaz. 2020. "Enhancing Classification Performance of fNIRS-BCI by Identifying Cortically Active Channels Using the z-Score Method" Sensors 20, no. 23: 6995. https://doi.org/10.3390/s20236995
APA StyleNazeer, H., Naseer, N., Mehboob, A., Khan, M. J., Khan, R. A., Khan, U. S., & Ayaz, Y. (2020). Enhancing Classification Performance of fNIRS-BCI by Identifying Cortically Active Channels Using the z-Score Method. Sensors, 20(23), 6995. https://doi.org/10.3390/s20236995