1. Introduction
Non-destructive, image-based plant phenotyping methods have proven their benefits for quantitative analysis of plant images. Through a combination of new imaging technologies, robotic platforms (ground and aerial vehicles) [
1], and novel control algorithms to deploy robotic systems for covering large greenhouses and agricultural fields [
2], the capacity to take images of plants and crops has expanded dramatically in the last few years [
3]. However, a key requirement for image-based phenotyping tools is to automatically transform those pictures into reliable and accurate phenotypic measurements. In addition, these tools must be capable of measuring a wide variety of phenotypic traits to allow for flexibility and relevance to a wide range of scientific applications.
The number of leaves of a plant is considered to be one of the key phenotypic metrics related to its development and growth stages [
4], flowering time [
5], and yield potential. The conventional manual counting approach is costly, time-consuming, and laborious. Therefore, various machine learning approaches have been introduced recently to address the leaf counting problem. However, for many reasons, including plants’ rapid growth and leaf occlusion and illumination problems, automatic counting of plant leaves is also a challenging task [
6]. In the current machine learning community, deep learning neural networks have become widely used in many image-based tasks such as image classification and object detection and segmentation, among others [
7]. Consequently, deep learning methods have recently been utilized to also address this problem, i.e., prediction of the number of leaves.
1.1. Related Work
From a machine learning perspective, counting the number of leaves can be classified as belonging to one of the following categories [
8]; (i) learning a direct image-to-count regressor model [
9], or (ii) obtaining a per-leaf detection and segmentation, which automatically leads to the number of leaves in a rosette [
10].
Counting via direct regression methods: In these methods, the deep convolutional neural networks are used to integrate image feature extraction with regression in a single pipeline with the goal of leaf counting. In [
11], an open source deep learning tool, Deep Plant Phenomics, was introduced which implements deep convolutional neural networks for the purpose of leaf counting, mutant classification, and age regression from top-down images of plant rosettes. The authors of [
12] proposed a multi-input deep network, called Pheno-Deep Counter, that combines information coming from different imaging sources and can predict leaf count in rosette-shaped plants.
Counting via object detection and segmentation methods: There exists a number of works that implement object detection or segmentation networks in order to address the leaf counting problem. Object detection algorithms operate by simultaneously preforming object classification, as well as localization. They can do this in a single pass or use multiple networks in conjunction with one another. These networks offer superior accuracy as they count leaves on a leaf by leaf basis rather than from a whole plant perspective. There are several approaches within the field of object detection and localization, each with different strengths and weaknesses. Networks like You Only Look Once (YOLO) [
13] detect objects quickly but struggle with densely packed groups of objects. Conversely, networks like Region-based Convolutional Neural Network (R-CNN) [
14] are slower but can more easily discern tight groups of objects; however, the amorphous shapes of leaves also can lead to double detection of a leaf. Object detection and segmentation approaches give the unique opportunity to experiment with the pros and cons of different network structures to a greater degree than with the direct regression methods.
In [
15], a Recurrent Neural Network (RNN) architecture with an attention mechanism was proposed to compute instance segmentation jointly with counting. The performance of the method was shown on the CVPPP plant leaf dataset [
16], as one of the instance segmentation benchmarks. In [
17], the Mask R-CNN method was used for leaf segmentation and counting. The authors of [
18] proposed a data augmentation method, preserving the photorealistic appearance of plant leaves. The augmented data was then used as training set for a Mask R-CNN network.
1.2. Contributions of This Work
In most of the existing platforms and current literature, collected images of the plants are stored locally and later transferred to hard disks and processed offline for the purpose of decision-making (e.g., counting leaves). However, it is critical to develop platforms that can automatically collect and analyze images in real-time for leaf counting. To achieve this goal, we design a robotic platform which is capable of navigating between plant rows, capturing the top-view images, and then detecting and counting the number of leaves in real-time. We adapt, train, and apply a Tiny-YOLOv3 model to accurately count leaves in images acquired with our robotic platform. Using our trained model, a complete list of locations and dimensions of bounding boxes are generated to identify and count the number of leaves in images. Along with the YOLO model, we also provide a comparison with another state-of-the-art object detection method, namely, Faster R-CNN.
The second contribution of this work is the release of our training and testing data sets. The images used in the dataset have been captured over the course of one month from a group of 60 Arabidopsis plants and taken using a high-quality DSLR camera from a top down perspective. To obtain the labeled data, the images were taken and then each leaf was labeled with a bounding box representing its location.
The third contribution of this work lies in the implementation of transfer learning using Tiny-YOLOv3 to detect larger, mature leaves of the Arabidopsis plant, without retraining the entire model from scratch. The model is first trained on images with smaller leaves, organized by timestamp. This trained model is then used to detect, localize, and count larger leaves.
The remainder of this paper is structured as follows. In
Section 2, the structure of our proposed leaf counting network, Tiny-YOLOv3, as well as our proposed experimental setup are described. In
Section 3, the generated dataset, image processing and labeling, training procedure, as well as the implementation details are provided. Finally, in
Section 4, concluding remarks and directions for future research works are discussed.
3. Experiments and Results
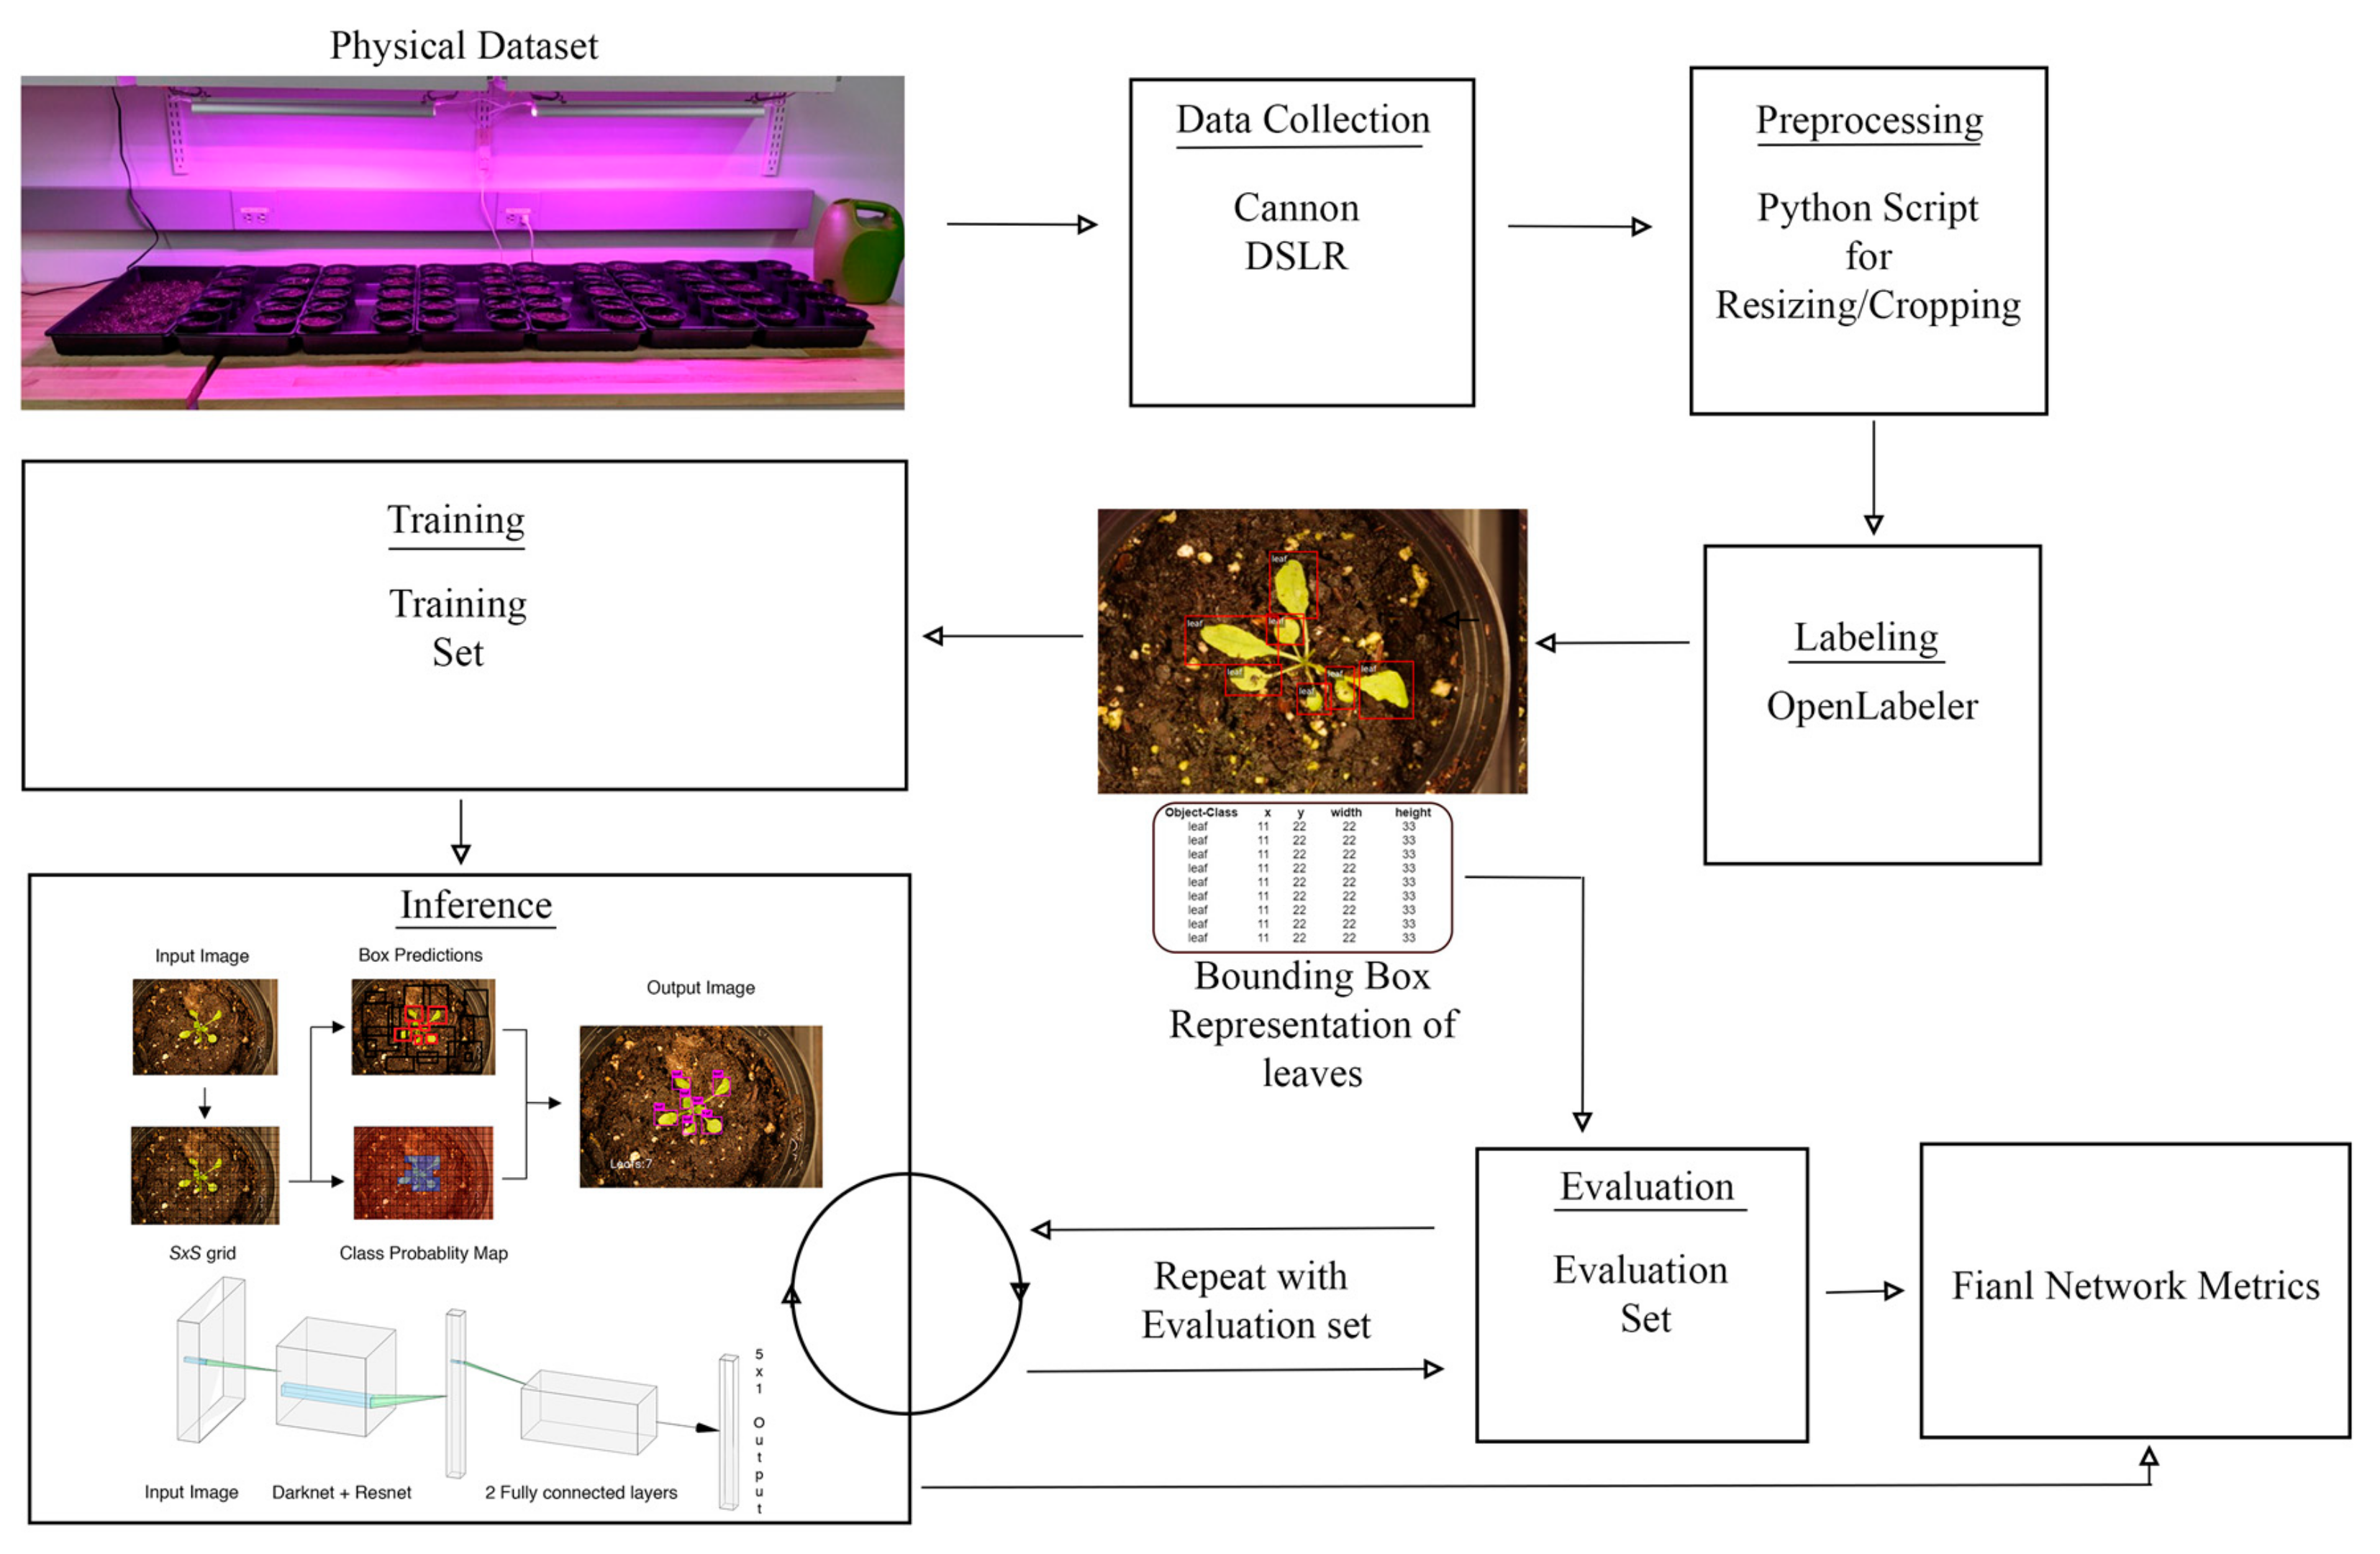
The whole pipeline of our proposed architecture is illustrated in
Figure 3 and will be described with more details in the following subsections.
3.1. Dataset
The candidate plant for our data set was
Arabidopsis thaliana [
27].
Arabidopsis was chosen for the following reasons. It is easy, very fast, and inexpensive to grow, and produces many seeds. Gathering large amounts of data in a reasonable time frame was a key factor in plant choice; by choosing a quickly growing plant, we were able to construct the dataset in only a few weeks. Finally, we chose
Arabidopsis for its tolerance to cold temperatures. By choosing a plant robust to cooler temperatures, we were able to build our dataset indoors and did not require any farm or greenhouse (controlled environment) space.
Our
Arabidopsis plants were grown indoors under red/blue LED grow lamps as shown in
Figure 3. The plants were grown in
plant batches for a total of 60 plants. The plants were watered every other day. The plants were photographed with a Cannon Rebel XS and stored in JPG format. The Canon camera was used to build the training and test datasets to analyze the performance of the YOLO and Faster R-CNN models. The grow lamps were kept on 24/7 to speed up the growth rate.
The data collection was done daily for weekdays only. The data collection period spanned a period of four weeks. Data collection began when the first leaves became visible and ended once the plants began to shoot up vertical stems for flower growth. Each plant was photographed individually from about six inches away, as shown in
Figure 4. The camera settings were as follows; 1/5”, F5.6, ISO800, and the camera was manually focused. Each plant was photographed twice per day ensuring that each photograph featured a distinct rotation and position.
To create the evaluation dataset, we grew another group of plants the same way as in the creation of the training dataset. We found this necessary because we were concerned about the datasets ability to generalize beyond the 60 plants used to create the training dataset. Using a new batch of plants ensured that any bias towards the individual plants in the dataset was avoided.
3.2. Image Preprocessing
Images were preprocessed in batches that coincided with the day they were taken. This was to ensure that any settings adjusted were functional for all the plants at that stage of growth. The first step in preprocessing was to crop each image to increase the leaf size relative to the whole picture. Each batch was cropped the same amount, but as the leaves got bigger and naturally filled the frame the cropping factor was decreased. The first batch of images was cropped by a factor of 0.5 in both axes and the last batch was not cropped at all. The next step in preprocessing was to pad each image to make it square. The images were padded with zeros. Finally, each image was downsampled with OpenCV library in Python to a size of .
3.3. Data Labeling
The images were labeled using OpenLabeler and the outputs were saved into an XML file using the VOC format. This allowed for easy conversion into other formats to utilize our dataset for various networks. Bounding boxes were drawn around every leaf. If the human labeler was ever uncertain about the bounding of a leaf, the default decision was to draw the box in a way that resulted in fewer leaves rather than more. For each of the labeled images, an additional text file was also generated that contained the annotated bounding boxes’ coordinates, as shown in
Figure 5.
The final dataset contains 1000 labeled images of labeled Arabidopsis plants containing several thousand labeled leaves. The evaluation set contains 36 labeled Arabidopsis plants.
3.4. Training Procedure
The best preforming Tiny-YOLO model was trained for a total of 160,000 batches over the course of two days. We preformed the training using a batch size of 24 with subdivisions of 8 in order to accommodate our low GPU memory. Other hyperparameters include momentum of 0.9, weight decay of 0.0005, burn in of 1000, and a learning rate of 0.001.
3.5. Implementation Details
We trained our deep neural network models using Darknet. The training was done on a Quadro P2000 with 5 GB of GDDR5 Memory. The CPU is an Intel CORE i7-7800x with 32 GB of memory. To demonstrate the efficacy of the developed platform and proposed model, we considered a greenhouse lab setup using the plants in test dataset. The robot autonomously navigates between the plants, captures pictures and runs inference to predict the number of leaves in each picture. An illustrative example of such processing and final outcome is shown in
Figure 6.
3.6. Evaluation Metrics
To evaluate the effectiveness and performance of our proposed approach, the following evaluation metrics, as in [
9] (now a consensus in the broad community), are utilized.
- (i)
Difference in count (DiC) =
- (ii)
Absolute difference in count =
- (iii)
Mean squared error (MSE) =
- (iv)
Percentage agreement (%) =
where
is the difference between the ground truth and algorithmic prediction (number of the estimated instances) and
is the indicator function, which returns zero if the error
, otherwise returns one [
28].
Moreover, the final output of the proposed object detection model is a list of bounding boxes that would ideally contain all of the leaves in an image and their relative locations. The main objective is that the number of boxes accurately match the number of leaves in an image. Denoting boxes as leaf or non-leaf can lead to the following potential scenarios; true positive (
TP)—correctly classifying a region as a leaf; false positive (
FP)—incorrectly classifying a background region as a leaf, as well as multiple detection of the same leaf; and false negative (
FN)—incorrectly classifying a leaf as a background region. In order to quantify
TP,
FP, and
FN, the average precision (AP) metric over the intersection over union (IOU) threshold of 0.5 is utilized. Note that IOU is defined as the intersection area of predicted and ground truth bounding boxes divided by the union area, which quantifies how close the predicted results are to ground truth labels. A threshold above 0.5 on IOU is considered as positive, while under 0.5 is considered as poor detection. It is the area under the recall–precision curve [
29], where
To visually compare the trained YOLO model’s performance on how well it detected leaves,
Figure 7 shows a lined scatter plot comparing the true number of leaves (blue) versus the detected number of leaves (red) in an image in the evaluation dataset. To clearly see where the blue and red points overlap, the points are lined and connected. Where both lines overlap at a point indicate that the model was correctly able to identify the true number of leaves. If the red line, which represents the algorithmic prediction, does not align with the blue line, which is the ground truth, then the model may have overestimated or underestimated the true leaf count.
In addition to computing precision and recall, the average accuracy of the models’ performance can be evaluated as
Using the precision and recall metrics above, the F1 score can be calculated as another way to analyze the accuracy of a model. Below is the formula for evaluating F1 score in terms of precision and recall.
Additionally, the true positive rate (TPR) and false positive rate (FPR) are also calculated. These metrics allow for a better insight to how well the trained model can correctly identify and localize the leaves in an image, and how often double detection or falsely identifying background as leaves occur, respectively. Ideally, the TPR should be very close to 100% and the FPR should be low and close to 0%.
Finally, the inference time will be utilized to measure the computational complexity. The inference time will be considered as the time it takes for the network to process one image. The time taken to load or initialize the network would not be taken into account.
3.7. Final Results and Comparison with Faster R-CNN
The above evaluation metrics obtained using our platform are summarized in
Table 1.
We further compare the results of the trained Tiny-YOLOv3 model with another state-of-the-art object detection method, Faster Region-based Convolutional Neural Networks (R-CNN) [
14]. Faster R-CNN is near real-time, as the network uses a Region Proposal Network (RPN) to produce object proposals from an input image without using selective search to extract region proposals like R-CNN [
30] and Fast R-CNN [
31]. This feature greatly reduces the computational time, as selective search algorithm takes a long time to generate region proposals.
The Faster R-CNN network has two main parts: the first being the RPN, which is a full convolutional network, that produces the region proposals on an input image; the second being the Fast R-CNN detector that classifies the region proposals from the RPN. As YOLO is a single network that does localization and identification in a single pass, we expect Faster R-CNN to result in slower training and inference time, and would have comparable performance in accuracy since Faster R-CNN can detect tight group of objects.
It is important to note that to obtain the results shown in
Table 1, we used the same Quadro P2000 desktop (that was also employed for training) to run both Tiny-YOLOv3 and Faster R-CNN networks on the test dataset. The Quadro P2000 desktop has 5 GB of GDDR5 Memory and the CPU is an Intel CORE i7-7800x with 32 GB of memory. First, the RPN is trained for 50 epochs for 1000 iterations per epoch. Then, its proposals are used to train the Fast R-CNN network for 50 epochs for 500 iterations per epoch. The total training time was approximately 2.5 days. Training the RPN before the detection network takes a longer amount of time to train since two networks must be trained separately, but an improved accuracy can be achieved.
As it is clear from
Table 1, the results of Tiny-YOLOv3 indicate that there is better overall real-time counting of leaves. Specifically, using YOLO, a lower mean-squared error (MSE), higher F1 Score, higher TPR, and lower FPR are achieved compared to Faster R-CNN. While Faster R-CNN provided a higher AP score, which indicates an increased ability to perform object detection and localization, Tiny-YOLOv3 has a significantly lower |DiC| value. This also shows that Tiny-YOLOv3 has higher accuracy and less false positive occurrences than Faster R-CNN. Last, Tiny-YOLOv3 can more quickly detect and localize leaves compared to Faster R-CNN, nearly 100 times faster. As such, Tiny-YOLOv3 can be deployed in the field to analyze plant condition in terms of leaf count in real time.
3.8. Transfer Learning of Models with New Datasets
In addition to training the Tiny-YOLOv3 network to detect leaves grown by the Arabidopsis thaliana plant, we also implemented a transfer learning method via Tiny-YOLOv3. The source task was to detect smaller leaves that were grown in the plants’ early stages and the target task was to detect larger leaves that were grown in the plants’ later stages, or more mature stages. The goal was to limit the time in retraining the model from scratch as the overall domain, the Arabidopsis thaliana plant leaves, changed in size over time as the plant grew.
To accomplish transfer learning, we partitioned our original dataset into two main domains: the source domain and target domain, organized by timestamp. The source domain contained a total of 600 images that were further divided into a training and testing set, with 480 and 120 images, respectively. Similarly, the target domain contained a total of 100 images divided into a training and testing set, with 80 and 20 images, respectively.
The source training set was trained for a total of 160,000 batches, with a batch size of 24, subdivisions of 8, momentum of 0.9, weight decay of 0.0005, burn in of 100, and a low learning rate of 0.001. The evaluation metrics obtained from using this platform are shown in
Table 2. The source trained model was tested on the 100 target training images to validate that the two source and target domains are different. Additionally, the source model should result in slightly worse results in the target training set if the two domains are different. The evaluation metrics obtained from using this platform are shown in
Table 3.
Based on the results in
Table 2 and
Table 3, it is observed that there is a slight reduction in accuracy and performance between the trained source model on its own test data and the target training data. Specifically, the absolute difference in count is nearly doubled and the false positive rate (FPR) is also doubled. Moreover, the F1 Score decreased slightly. This signifies that the source and target domains are slightly different but still similar. Thus, we can proceed to retrain and fine-tune the source model to perform better when presented with larger and more mature leaves.
The target training set was trained for an additional 10,000 batches on the already trained source model, for a total of 170,000 batches. By retraining all layers of the source model on the target training set, the model has more flexibility to improve its overall accuracy while not being trained for a long period of time. The total retraining time was less than 2 h. The evaluation metrics obtained from using this platform are shown in
Table 4.
From the results given in
Table 4, it is observed that there is a significant reduction in the mean-squared error (MSE) and FPR. This indicates that the model that was trained via transfer learning results in better detection of leaves that are actually present in the image. Thus, we can see that transfer learning does indeed result in better detection and localization of smaller, young leaves, and larger, older leaves. As such, training time can be significantly reduced even if the dataset is modified with the addition of new and similar images, as the original trained model can be used.
3.9. Discussion
In this work, an autonomous robotic platform was developed which is capable of predicting the number of leaves in real-time. However, the proposed approach has other potential applications in developing an intelligent system to help farm and greenhouse practitioners (experts and non-experts) to capture images of plants with mobile phones and provide real-time information about them.
It is noted that the growth conditions of the Arabidopsis thaliana for both the test set and the evaluation set were identical. The plants were grown indoor under LED lamps and were all watered on the same frequency. As such, there are small to no differences between each plant in terms of light reception, damage, insect infestation, and mineral nutrition. Thus, the model is biased towards the plants having constant and identical growing conditions. If additional plants of the same species were grown either outdoors with natural light, without LED lamps, or with different mineral nutrition, then the plants may have produced a variety of growth patterns. This variation would result in the model trying to detect potential differences in leaf shape, count, and even damage. As such, the model may fail due to plant condition variation and thereby would be subject to further performance analysis.
Additionally, we only tested one type of plant in this experiment. This species of plant is small, round, and their leaves are easily spread out and quite easy to localize, and leaf shape is larger in comparison to the overall plant size. If a different plant was used with different leaf shape, size, and clustering behavior, then the model would also be subject to different performance or even failure, and would allow for further performance analysis on the model’s ability for learning different plants’ leaves [
21].
Consequently, this proof-of-concept study can be eventually used in a wide range of applications by stakeholders ranging from farmers (to estimate the number of leaves and evaluate the plant growth stage and final yield) to agricultural researchers (working to improve crops).
4. Conclusions
In this work, we built an autonomous ground robotic device which is capable of near real-time leaf detection and counting. It was demonstrated that given a moderate amount of data on top-view images of plants, our trained model, Tiny-YOLOv3, is able to learn to localize and predict the number of plant’s leaves without any prior knowledge on that specific plant. We made our generated dataset publicly available, with the goal of promoting the use of object detection deep learning models within the plant phenotyping community.
Our ongoing work focuses on creating more robust algorithms to help automate the leaf counting process. By using more powerful platforms with more computational resources, as well as more powerful cameras, we aim to create an autonomous plant phenotyping system. Our solution will be able to first perform localization in real-time to detect potential crops to monitor. The system will then navigate the unknown terrains and map them while providing real-time feedback on the state of the crops in question. This information can then be processed on-board the robot in real-time and either be used to deploy another robot to address any issues or to farm managers for manual/visual inspection.


