Deep Neural Network for Slip Detection on Ice Surface


Abstract
1. Introduction
2. Literature Review
3. Materials and Methods
3.1. Testing Methodology
3.2. Data Collection
3.3. Neural Network Architecture
3.4. Experiment Setting and Model Configuration
- 60 trials of maxi-slips and 60 no-slip trials,
- 60 trials of midi-slips and 60 no-slip trials,
- 60 maxi-slips, 60 midi-slips and 120 no-slip trials,
- 60 mini-slips and 60 no-slip trials,
- 180 slips of all three types and 180 no-slip trials.
4. Results
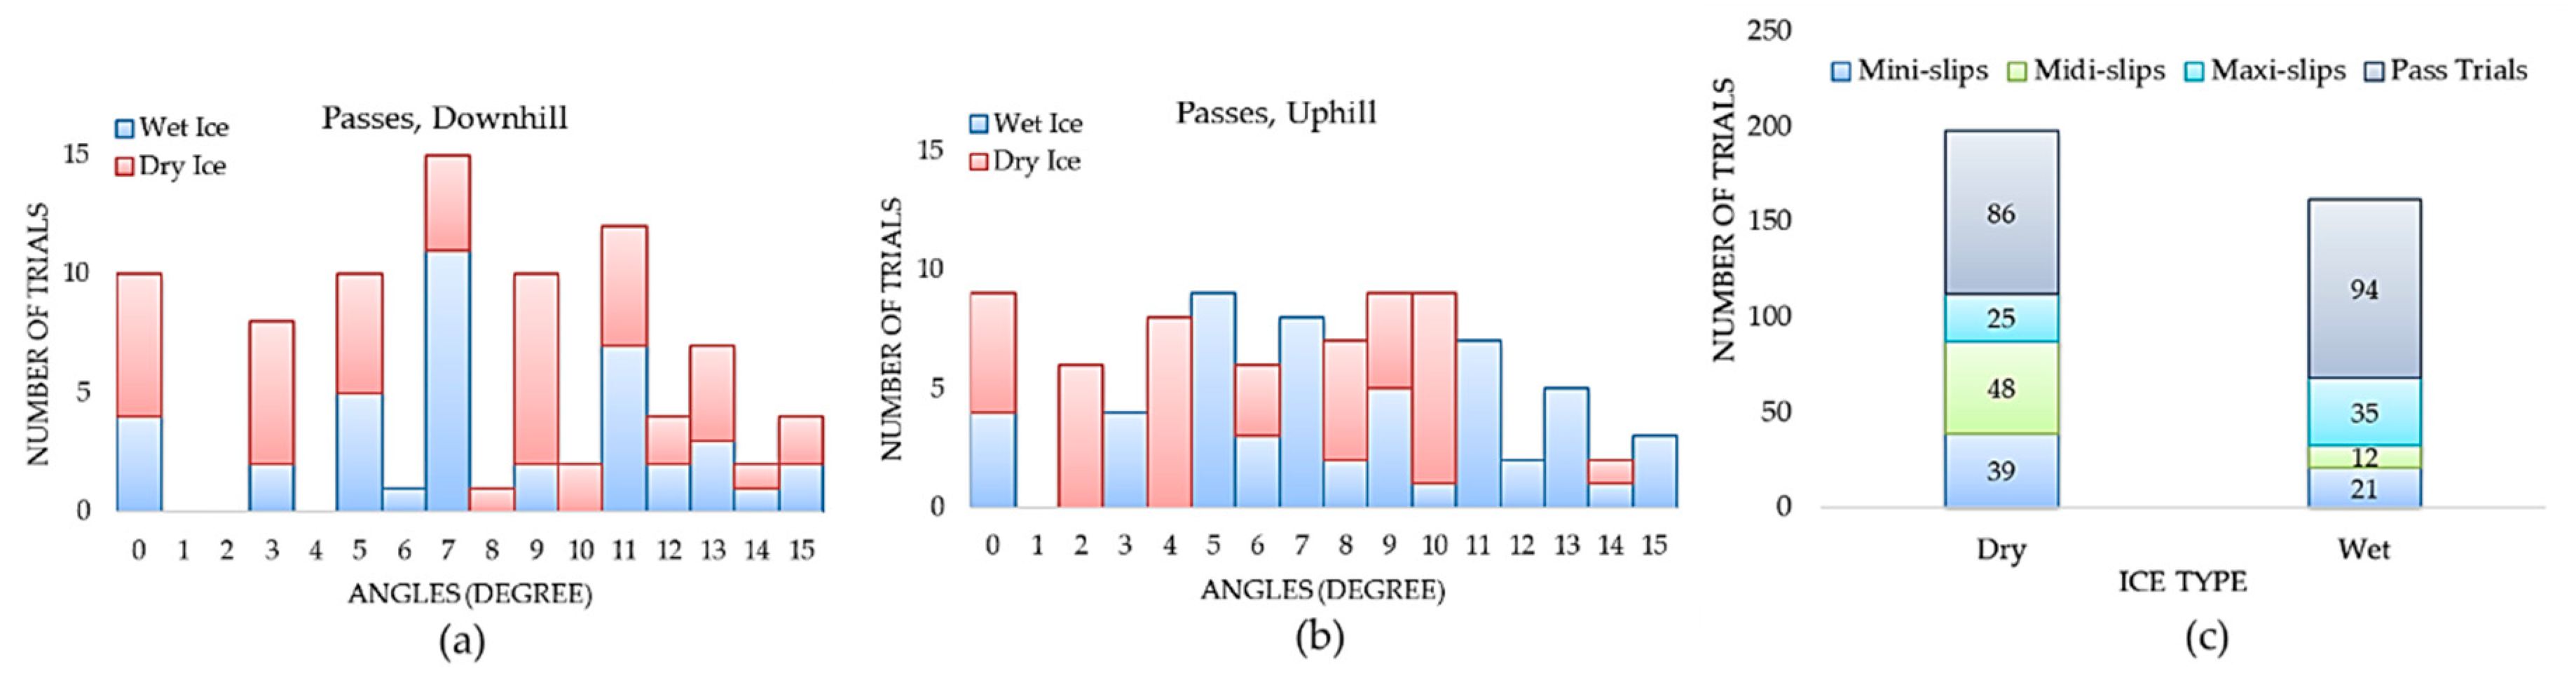
4.1. Data Analysis
4.2. Model Evaluation
4.2.1. Record-Wise Cross Validation Analysis (5-Fold)
4.2.2. Subject-Wise Cross Validation Analysis (Leave One Subject Out)
5. Future Work
5.1. Coverage Limitation
5.2. Data Processing and Population
5.3. Real Time Detection
6. Conclusions
Author Contributions
Funding
Acknowledgments
Conflicts of Interest
Ethical Statements
References
- World Health Organization. WHO Global Report on Falls Prevention in Older Age; World Health Organization: Geneva, Switzerland, 2008; ISBN 978-92-4-156353-6. [Google Scholar]
- Hsu, J.; Shaw, R.; Novak, A.; Li, Y.; Ormerod, M.; Newton, R.; Dutta, T.; Fernie, G. Slip resistance of winter footwear on snow and ice measured using maximum achievable incline. Ergonomics 2016, 59, 717–728. [Google Scholar] [CrossRef] [PubMed]
- McCrum, C.; Gerards, M.H.G.; Karamanidis, K.; Zijlstra, W.; Meijer, K. A systematic review of gait perturbation paradigms for improving reactive stepping responses and falls risk among healthy older adults. Eur. Rev. Aging Phys. Act. 2017, 14, 3. [Google Scholar] [CrossRef]
- Terroso, M.; Rosa, N.; Torres Marques, A.; Simoes, R. Physical consequences of falls in the elderly: A literature review from 1995 to 2010. Eur. Rev. Aging Phys. Act. 2014, 11, 51–59. [Google Scholar] [CrossRef]
- Abeysekera, J.; Gao, C. The identification of factors in the systematic evaluation of slip prevention on icy surfaces. Int. J. Ind. Ergon. 2001, 28, 303–313. [Google Scholar] [CrossRef]
- Verma, S.K.; Courtney, T.K.; Corns, H.L.; Huang, Y.-H.; Lombardi, D.A.; Chang, W.-R.; Brennan, M.J.; Perry, M.J. Factors associated with use of slip-resistant shoes in US limited-service restaurant workers. Inj. Prev. 2012, 18, 176–181. [Google Scholar] [CrossRef]
- Staal, C.; White, B.; Brasser, B.; LeForge, L.; Dlouhy, A.; Gabier, J. Reducing employee slips, trips, and falls during employee-assisted patient activities. Rehabil. Nurs. 2004, 29, 211–214. [Google Scholar]
- Radomsky, M.C.; Ramani, R.V.; Flick, J.P. Slips, Trips & Falls in Construction & Mining: Causes & Controls. Prof. Saf. 2001, 46, 30–37. [Google Scholar]
- Hsu, J.; Li, Y.; Dutta, T.; Fernie, G. Assessing the performance of winter footwear using a new maximum achievable incline method. Appl. Ergon. 2015, 50, 218–225. [Google Scholar] [CrossRef]
- Iraqi, A.; Cham, R.; Redfern, M.S.; Beschorner, K.E. Coefficient of friction testing parameters influence the prediction of human slips. Appl. Ergon. 2018, 70, 118–126. [Google Scholar] [CrossRef]
- Bagheri, Z.S.; Beltran, J.; Holyoke, P.; Sole, G.; Hutchinson, K.; Dutta, T. Reducing the risk of falls by 78% with a new generation of slip resistant winter footwear. In Advances in Social and Occupational Ergonomics, Proceedings of the AHFE 2019 International Conference on Social and Occupational Ergonomics, Washington, DC, USA, 24–28 July 2019; Springer: Berlin/Heidelberg, Germany, 2020; Volume 970, pp. 279–285. [Google Scholar]
- Noriaki, O. Development of a Novel Foot Slip Sensor Algorithm. Ph.D. Thesis, The Pennsylvania State University, University Park, PA, USA, 2015. [Google Scholar]
- Lim, T.-K.; Park, S.-M.; Lee, H.-C.; Lee, D.-E. Artificial Neural Network–Based Slip-Trip Classifier Using Smart Sensor for Construction Workplace. J. Constr. Eng. Manag. 2016, 142, 04015065. [Google Scholar] [CrossRef]
- Trkov, M.; Chen, K.; Yi, J.; Liu, T. Slip detection and prediction in human walking using only wearable inertial measurement units (IMUs). In Proceedings of the 2015 IEEE International Conference on Advanced Intelligent Mechatronics (AIM), Busan, Korea, 7–11 July 2015; pp. 854–859. [Google Scholar]
- Trkov, M.; Chen, K.; Yi, J.; Liu, T. Inertial Sensor-Based Slip Detection in Human Walking. IEEE Trans. Automat. Sci. Eng. 2019, 16, 1399–1411. [Google Scholar] [CrossRef]
- Hirvonen, M.; Leskinen, T.; Grönqvist, R.; Saario, J. Detection of near accidents by measurement of horizontal acceleration of the trunk. Int. J. Ind. Ergon. 1994, 14, 307–314. [Google Scholar] [CrossRef]
- Lincoln, L.S.; Bamberg, S.J.M. Insole sensor system for real-time detection of biped slip. In Proceedings of the 2010 Annual International Conference of the IEEE Engineering in Medicine and Biology, Buenos Aires, Argentina, 31 August–4 September 2010; pp. 1449–1452. [Google Scholar]
- Cen, D.J.Y. Development of a Slip Analysis Algorithm: Automating the Maximal Achievable Angle Footwear Slip Resistance Test. Master’s Thesis, Institute of Biomaterials and Biomedical Engineering University of Toronto, Toronto, ON, Canada, 2018. [Google Scholar]
- Janidarmian, M.; Roshan Fekr, A.; Radecka, K.; Zilic, Z. Multi-Objective Hierarchical Classification Using Wearable Sensors in a Health Application. IEEE Sens. J. 2017, 17, 1421–1433. [Google Scholar] [CrossRef]
- Janidarmian, M.; Roshan Fekr, A.; Radecka, K.; Zilic, Z.; Ross, L. Analysis of Motion Patterns for Recognition of Human Activities. In Proceedings of the 5th EAI International Conference on Wireless Mobile Communication and Healthcare-“Transforming Healthcare through Innovations in Mobile and Wireless Technologies”, London, UK, 14–16 October 2015; ICST: London, UK, 2015. [Google Scholar]
- Janidarmian, M.; Roshan Fekr, A.; Radecka, K.; Zilic, Z. A Comprehensive Analysis on Wearable Acceleration Sensors in Human Activity Recognition. Sensors 2017, 17, 529. [Google Scholar] [CrossRef]
- Liu, A.; Su, Y.; Nie, W.-Z.; Kankanhalli, M.S. Hierarchical Clustering Multi-Task Learning for Joint Human Action Grouping and Recognition. IEEE Trans. Pattern Anal. Mach. Intell. 2017, 39, 102–114. [Google Scholar] [CrossRef]
- Kuehne, H.; Jhuang, H.; Garrote, E.; Poggio, T.; Serre, T. HMDB: A large video database for human motion recognition. In Proceedings of the 2011 International Conference on Computer Vision, Barcelona, Spain, 6–13 November 2011; pp. 2556–2563. [Google Scholar]
- Min, S.; Yao, H.; Xie, H.; Zha, Z.-J.; Zhang, Y. Multi-Objective Matrix Normalization for Fine-grained Visual Recognition. IEEE Trans. Image Process 2020, 29, 4996–5009. [Google Scholar] [CrossRef]
- Andriluka, M.; Pishchulin, L.; Gehler, P.; Schiele, B. 2D Human Pose Estimation: New Benchmark and State of the Art Analysis. In Proceedings of the IEEE Conference on Computer Vision and Pattern Recognition (CVPR), Columbus, OH, USA, 23–28 June 2014. [Google Scholar]
- Huynh, N.; Fernie, G.; Fekr, A.R. A Novel Approach for Slip Resistance Evaluation of Winter Footwear based on Probability of Slipping and Cost Analysis. Submitt. Publ. Saf. Sci. 2020, in press. [Google Scholar]
- Redfern, M.S.; Cham, R.; Gielo-Perczak, K.; Grönqvist, R.; Hirvonen, M.; Lanshammar, H.; Marpet, M.; Iv, C.Y.-C.P.; Powers, C.J. Biomechanics of slips. Ergonomics 2001, 44, 1138–1166. [Google Scholar] [CrossRef]
- Strandberg, L.; Lanshammar, H. The Dynamics of Slipping Accidents. J. Occup. Accid. 1981, 3, 153–162. [Google Scholar] [CrossRef]
- Carreira, J.; Zisserman, A. Quo Vadis, Action Recognition? A New Model and the Kinetics Dataset. In Proceedings of the 2017 IEEE Conference on Computer Vision and Pattern Recognition (CVPR), Honolulu, HI, USA, 21–26 July 2017; pp. 4724–4733. [Google Scholar]
- Soomro, K.; Zamir, A.R.; Shah, M. UCF101: A Dataset of 101 Human Actions Classes from Videos in the Wild. arXiv 2012, arXiv:1212.0402. [Google Scholar]
- Wang, H.; Schmid, C. Action Recognition with Improved Trajectories. In Proceedings of the 2013 IEEE International Conference on Computer Vision, Sydney, Australia, 1–8 December 2013; pp. 3551–3558. [Google Scholar]
- Kingma, D.P.; Ba, J. Adam: A Method for Stochastic Optimization. arXiv 2017, arXiv:1412.6980. [Google Scholar]
- Weinshall, D.; Cohen, G.; Amir, D. Curriculum Learning by Transfer Learning: Theory and Experiments with Deep Networks. arXiv 2018, arXiv:1802.03796. [Google Scholar]
- Khan, N.M.; Hon, M.; Abraham, N. Transfer Learning with intelligent training data selection for prediction of Alzheimer’s Disease. arXiv 2017, arXiv:1906.01160. [Google Scholar] [CrossRef]
- Ruder, S. An overview of gradient descent optimization algorithms. arXiv 2017, arXiv:1609.04747. [Google Scholar]
- Reddi, S.J.; Kale, S.; Kumar, S. On the Convergence of Adam and Beyond. arXiv 2019, arXiv:1904.09237. [Google Scholar]
- Keskar, N.S.; Socher, R. Improving Generalization Performance by Switching from Adam to SGD. arXiv 2017, arXiv:1712.07628. [Google Scholar]
- Bouckaert, R.R. Efficient AUC learning curve calculation. In Proceedings of the Australian Conference on Artificial Intelligence, Hobart, Australia, 4–8 December 2006; Volume 4304, pp. 181–191. [Google Scholar]
- Perez, L.; Wang, J. The Effectiveness of Data Augmentation in Image Classification using Deep Learning. arXiv 2017, arXiv:1712.04621. [Google Scholar]
- Carreira, J.; Patraucean, V.; Mazare, L.; Zisserman, A.; Osindero, S. Massively Parallel Video Networks. arXiv 2018, arXiv:1806.03863. [Google Scholar]
- Available online: https://aws.amazon.com/deeplens/ (accessed on 12 November 2020).


| Subjects ID | Gender | Age | Height (cm) | Weight (kg) |
|---|---|---|---|---|
| sub1 | M | 35 | 175 | 75 |
| sub2 | M | 21 | 165 | 54 |
| sub3 | M | 20 | 183 | 75 |
| sub4 | M | 21 | 172 | 70 |
| sub5 | M | 35 | 175 | 75 |
| sub6 | M | 20 | 188 | 82 |
| sub7 | M | 25 | 188 | 93 |
| sub8 | M | 21 | 177 | 71 |
| sub9 | M | 23 | 188 | 106 |
| sub10 | F | 22 | 162 | 54 |
| sub11 | F | 21 | 167 | 55 |
| sub12 | F | 21 | 165 | 54 |
| sub13 | F | 22 | 162 | 54 |
| sub14 | F | 21 | 155 | 62 |
| sub15 | M | 30 | 192 | 56 |
| sub16 | F | 23 | 179 | 84 |
| sub17 | F | 26 | 170 | 62 |
| sub18 | F | 32 | 167 | 66 |
| Experiments | Accuracy | Sensitivity | Specificity | F1 Score | AUC |
|---|---|---|---|---|---|
| Experiment 1 | 0.97 ± 0.03 | 0.95 ± 0.07 | 1.00 ± 0.00 | 0.97 ± 0.04 | 0.99 ± 0.00 |
| Experiment 2 | 0.88 ± 0.05 | 0.80 ± 0.11 | 0.95 ± 0.04 | 0.86 ± 0.06 | 0.93 ± 0.02 |
| Experiment 3 | 0.93 ± 0.03 | 0.88 ± 0.05 | 0.98 ± 0.02 | 0.92 ± 0.03 | 0.95 ± 0.03 |
| Experiment 4 | 0.77 ± 0.04 | 0.73 ± 0.10 | 0.80 ± 0.11 | 0.76 ± 0.05 | 0.85 ± 0.04 |
| Experiment 5 | 0.86 ± 0.04 | 0.81 ± 0.08 | 0.91 ± 0.03 | 0.85 ± 0.04 | 0.90 ± 0.03 |
| Experiments | Accuracy | Recall | Specificity | F1 Score |
|---|---|---|---|---|
| Sub1 | 0.88 | 0.81 | 0.92 | 0.84 |
| Sub2 | 0.73 | 0.60 | 1.00 | 0.75 |
| Sub3 | 0.88 | 0.80 | 1.00 | 0.89 |
| Sub4 | 0.81 | 0.76 | 0.91 | 0.84 |
| Sub5 | 0.81 | 0.83 | 0.78 | 0.86 |
| Sub6 | 0.78 | 0.50 | 0.94 | 0.63 |
| Sub7 | 0.89 | 1.00 | 0.83 | 0.86 |
| Sub8 | 0.75 | 0.54 | 1.00 | 0.70 |
| Sub9 | 1.00 | NA | 1.00 | NA |
| Sub10 | 0.47 | 0.11 | 1.00 | 0.20 |
| Sub11 | 0.64 | 0.38 | 1.00 | 0.55 |
| Sub12 | 0.86 | 0.80 | 1.00 | 0.89 |
| Sub13 | 0.90 | 0.80 | 1.00 | 0.89 |
| Sub14 | 0.89 | 0.86 | 1.00 | 0.92 |
| Sub15 | 1.00 | 1.00 | 1.00 | 1.00 |
| Sub16 | 1.00 | 1.00 | 1.00 | 1.00 |
| Sub17 | 0.88 | 0.67 | 1.00 | 0.80 |
| Sub18 | 0.86 | NA | 0.86 | NA |
| Average | 0.84 ± 0.13 | 0.72 ± 0.23 | 0.96 ± 0.07 | 0.79 ± 0.19 |
Publisher’s Note: MDPI stays neutral with regard to jurisdictional claims in published maps and institutional affiliations. |
© 2020 by the authors. Licensee MDPI, Basel, Switzerland. This article is an open access article distributed under the terms and conditions of the Creative Commons Attribution (CC BY) license (http://creativecommons.org/licenses/by/4.0/).
Share and Cite
Wu, K.; He, S.; Fernie, G.; Roshan Fekr, A. Deep Neural Network for Slip Detection on Ice Surface. Sensors 2020, 20, 6883. https://doi.org/10.3390/s20236883
Wu K, He S, Fernie G, Roshan Fekr A. Deep Neural Network for Slip Detection on Ice Surface. Sensors. 2020; 20(23):6883. https://doi.org/10.3390/s20236883
Chicago/Turabian StyleWu, Kent, Suzy He, Geoff Fernie, and Atena Roshan Fekr. 2020. "Deep Neural Network for Slip Detection on Ice Surface" Sensors 20, no. 23: 6883. https://doi.org/10.3390/s20236883
APA StyleWu, K., He, S., Fernie, G., & Roshan Fekr, A. (2020). Deep Neural Network for Slip Detection on Ice Surface. Sensors, 20(23), 6883. https://doi.org/10.3390/s20236883