Multimodal Data Fusion in Learning Analytics: A Systematic Review


Abstract
1. Introduction
- RQ 1: What is the overall status of MMLA research? (Section 2.4)
- RQ 2: What types of multimodal data and learning indicators are used in MMLA? What are the relationships between multimodal data and learning indicators? (Section 5)
- RQ 3: How can multimodal data be integrated into MMLA? What are the main methods, key stages, and main features of data fusion in MMLA? (Section 6)
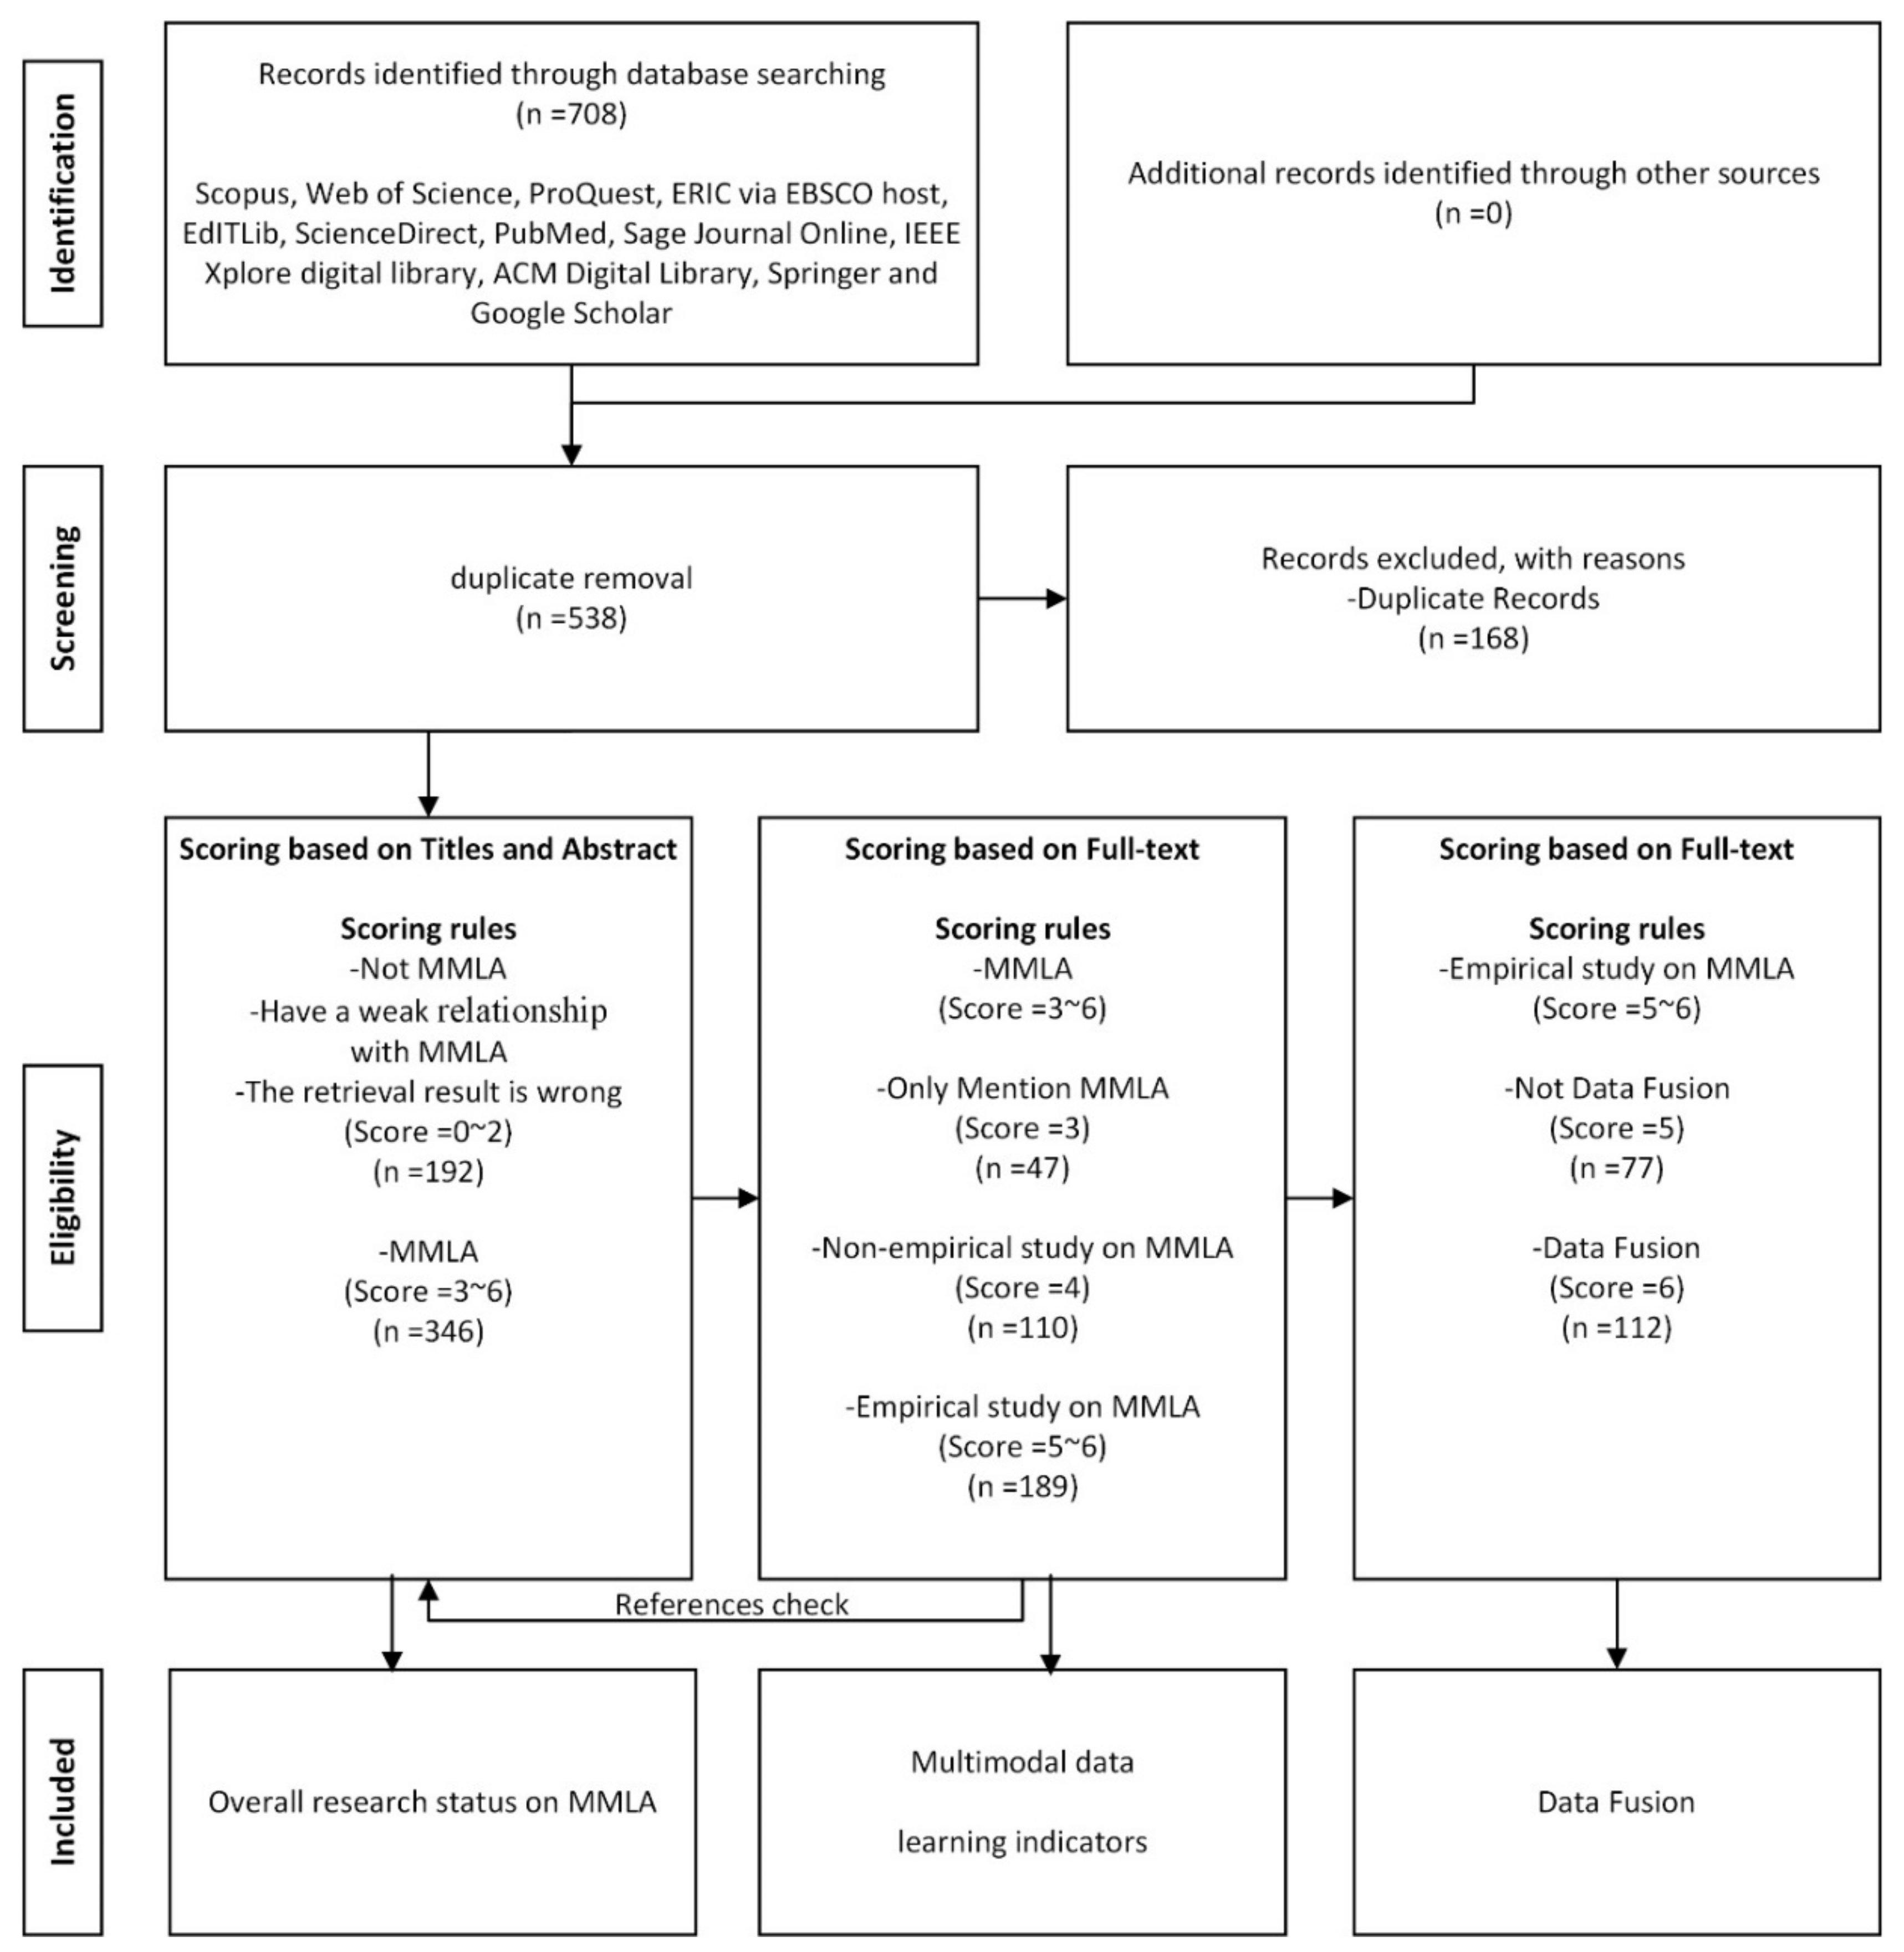
2. Survey Methods
2.1. Search Method
2.2. Inclusion and Exclusion Criteria
2.3. Scoring and Encoding
2.4. Overall Research Status (Q1)
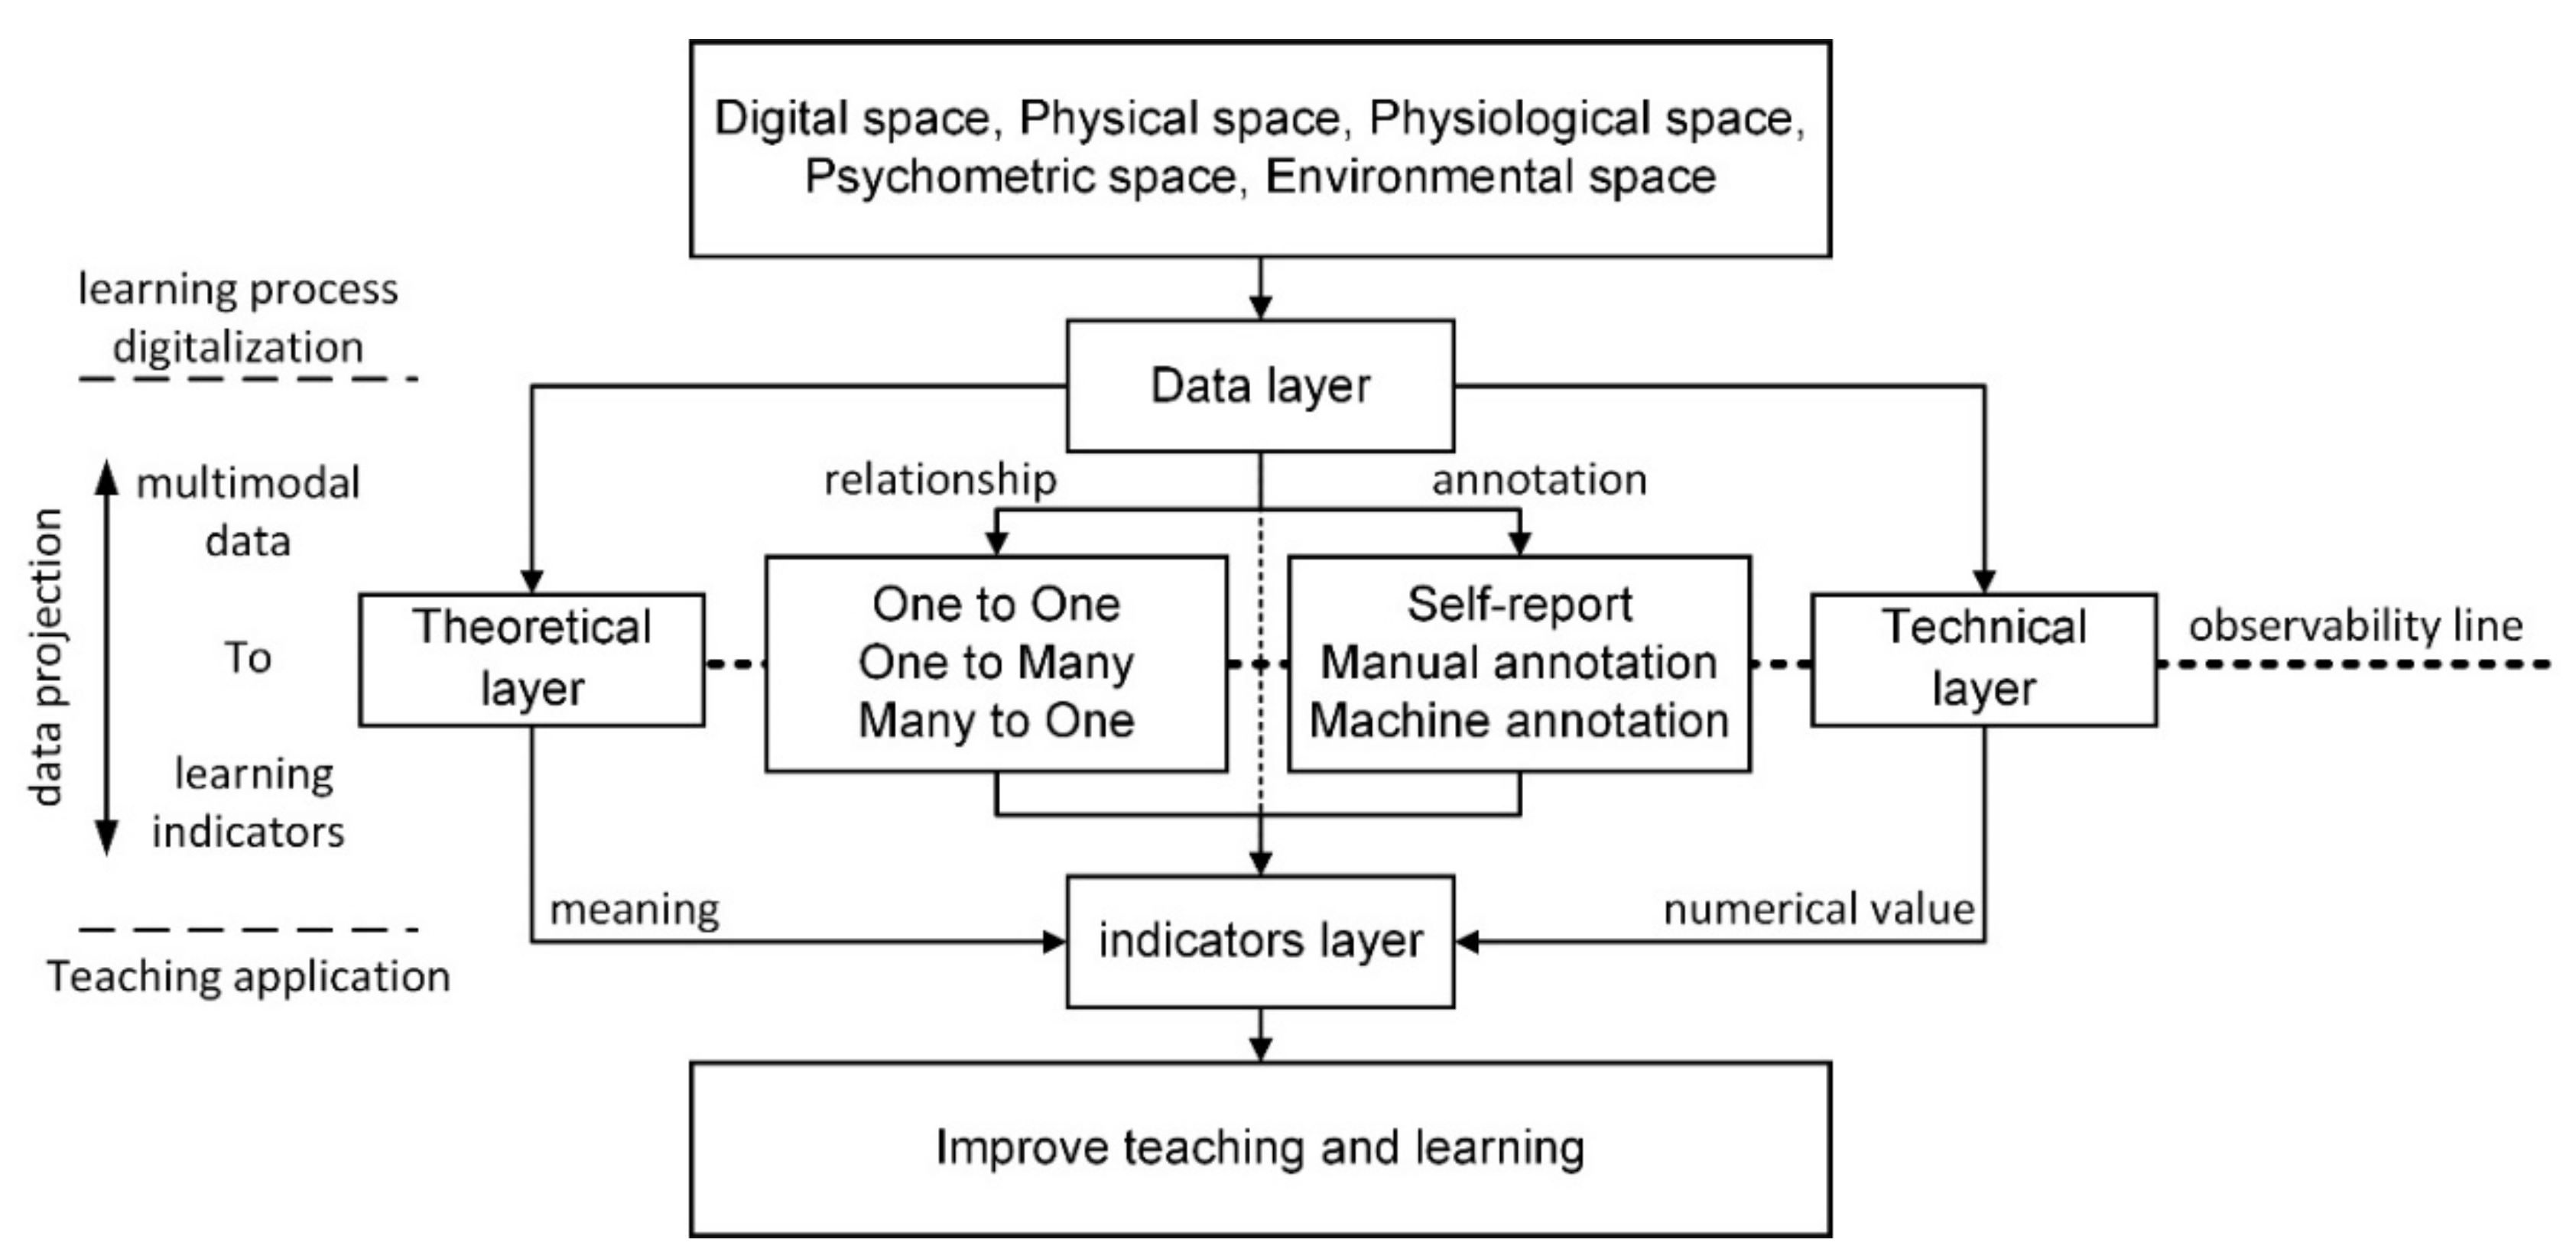
3. MMLA Conceptual Model
4. Multimodal Data, Learning Indicators and Their Relationships (Q2)
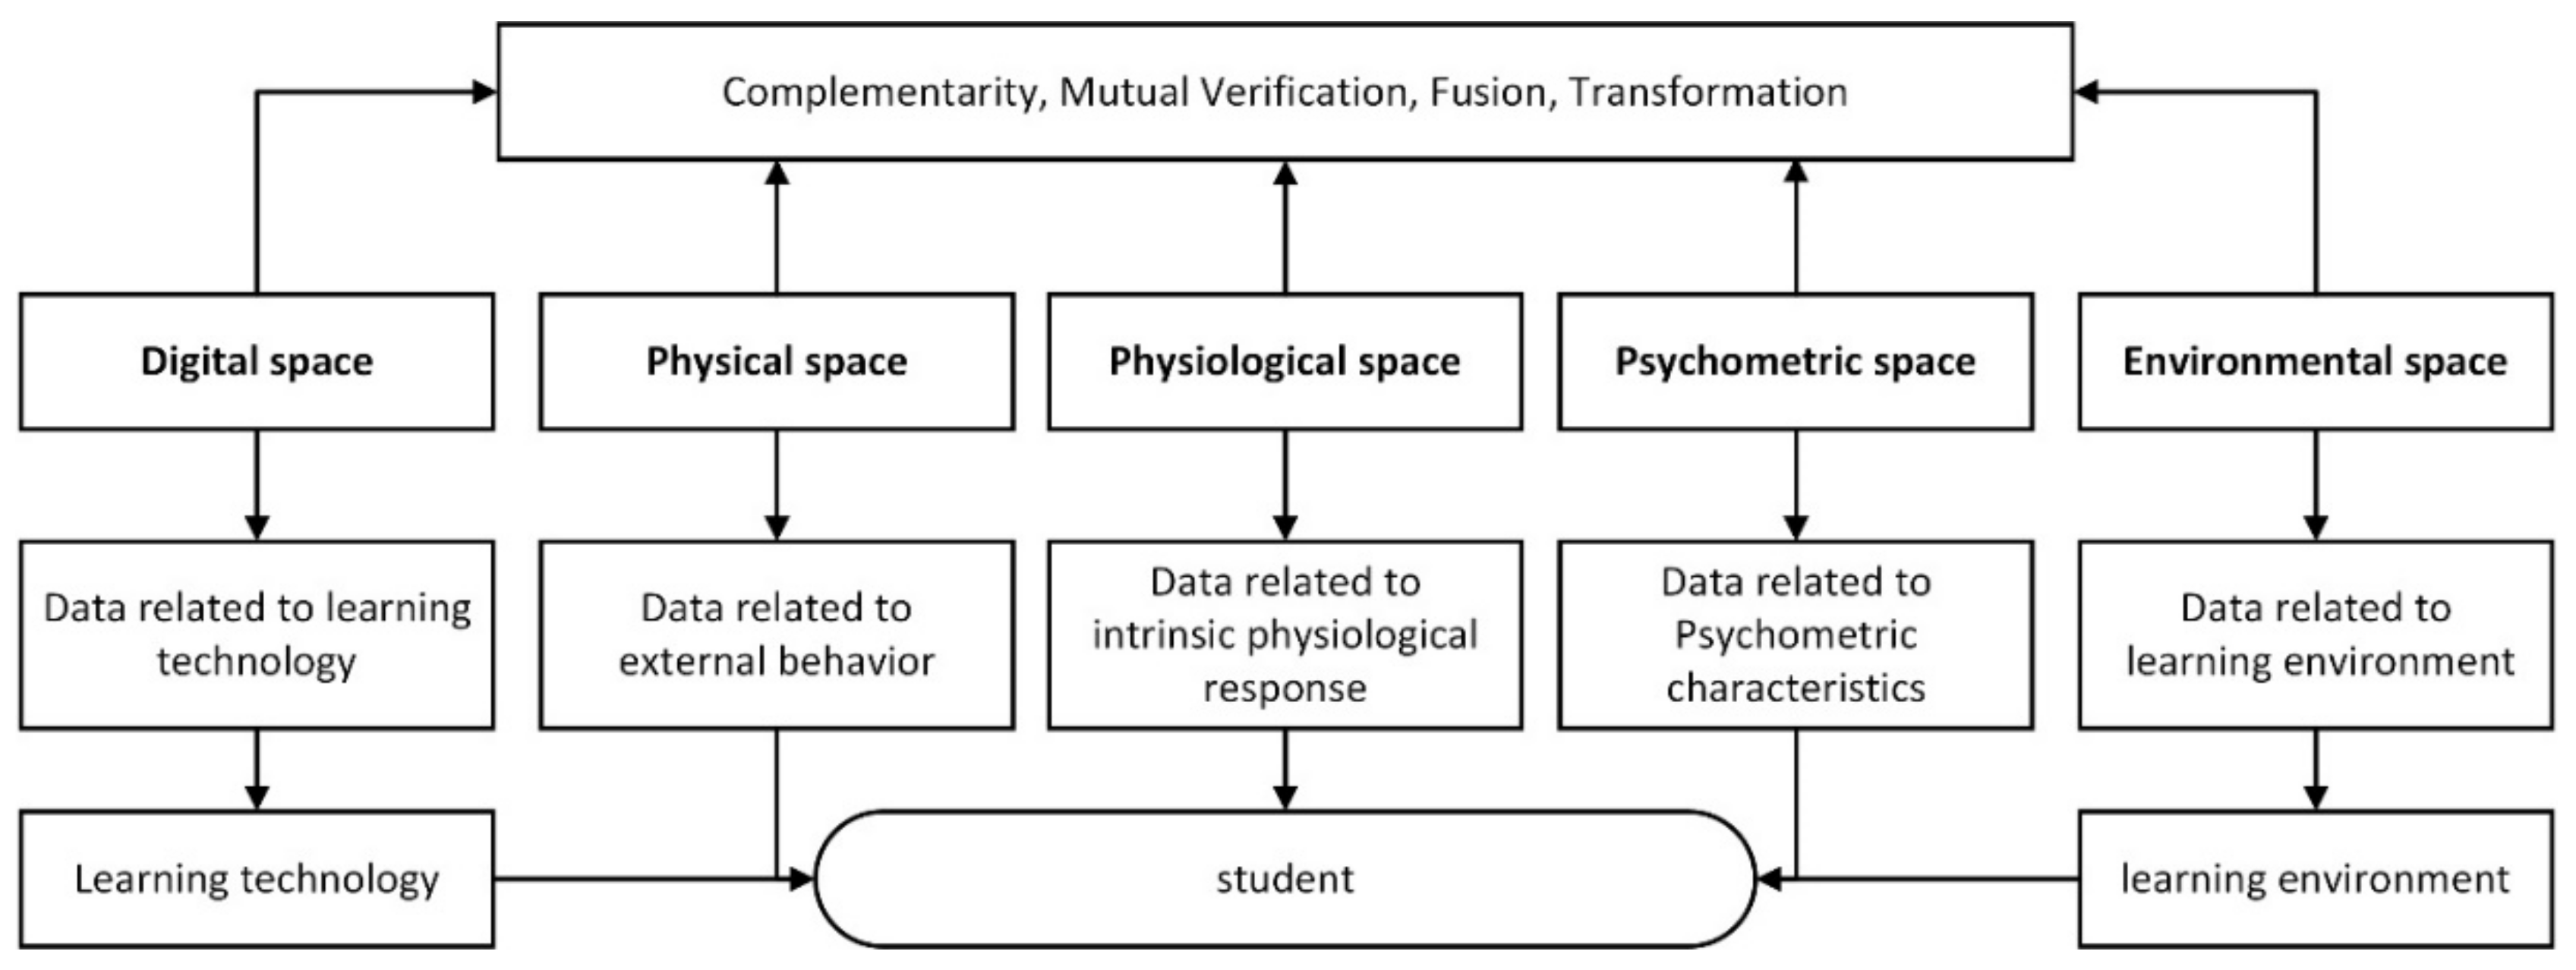
4.1. Multimodal Data
4.2. Learning Indicators
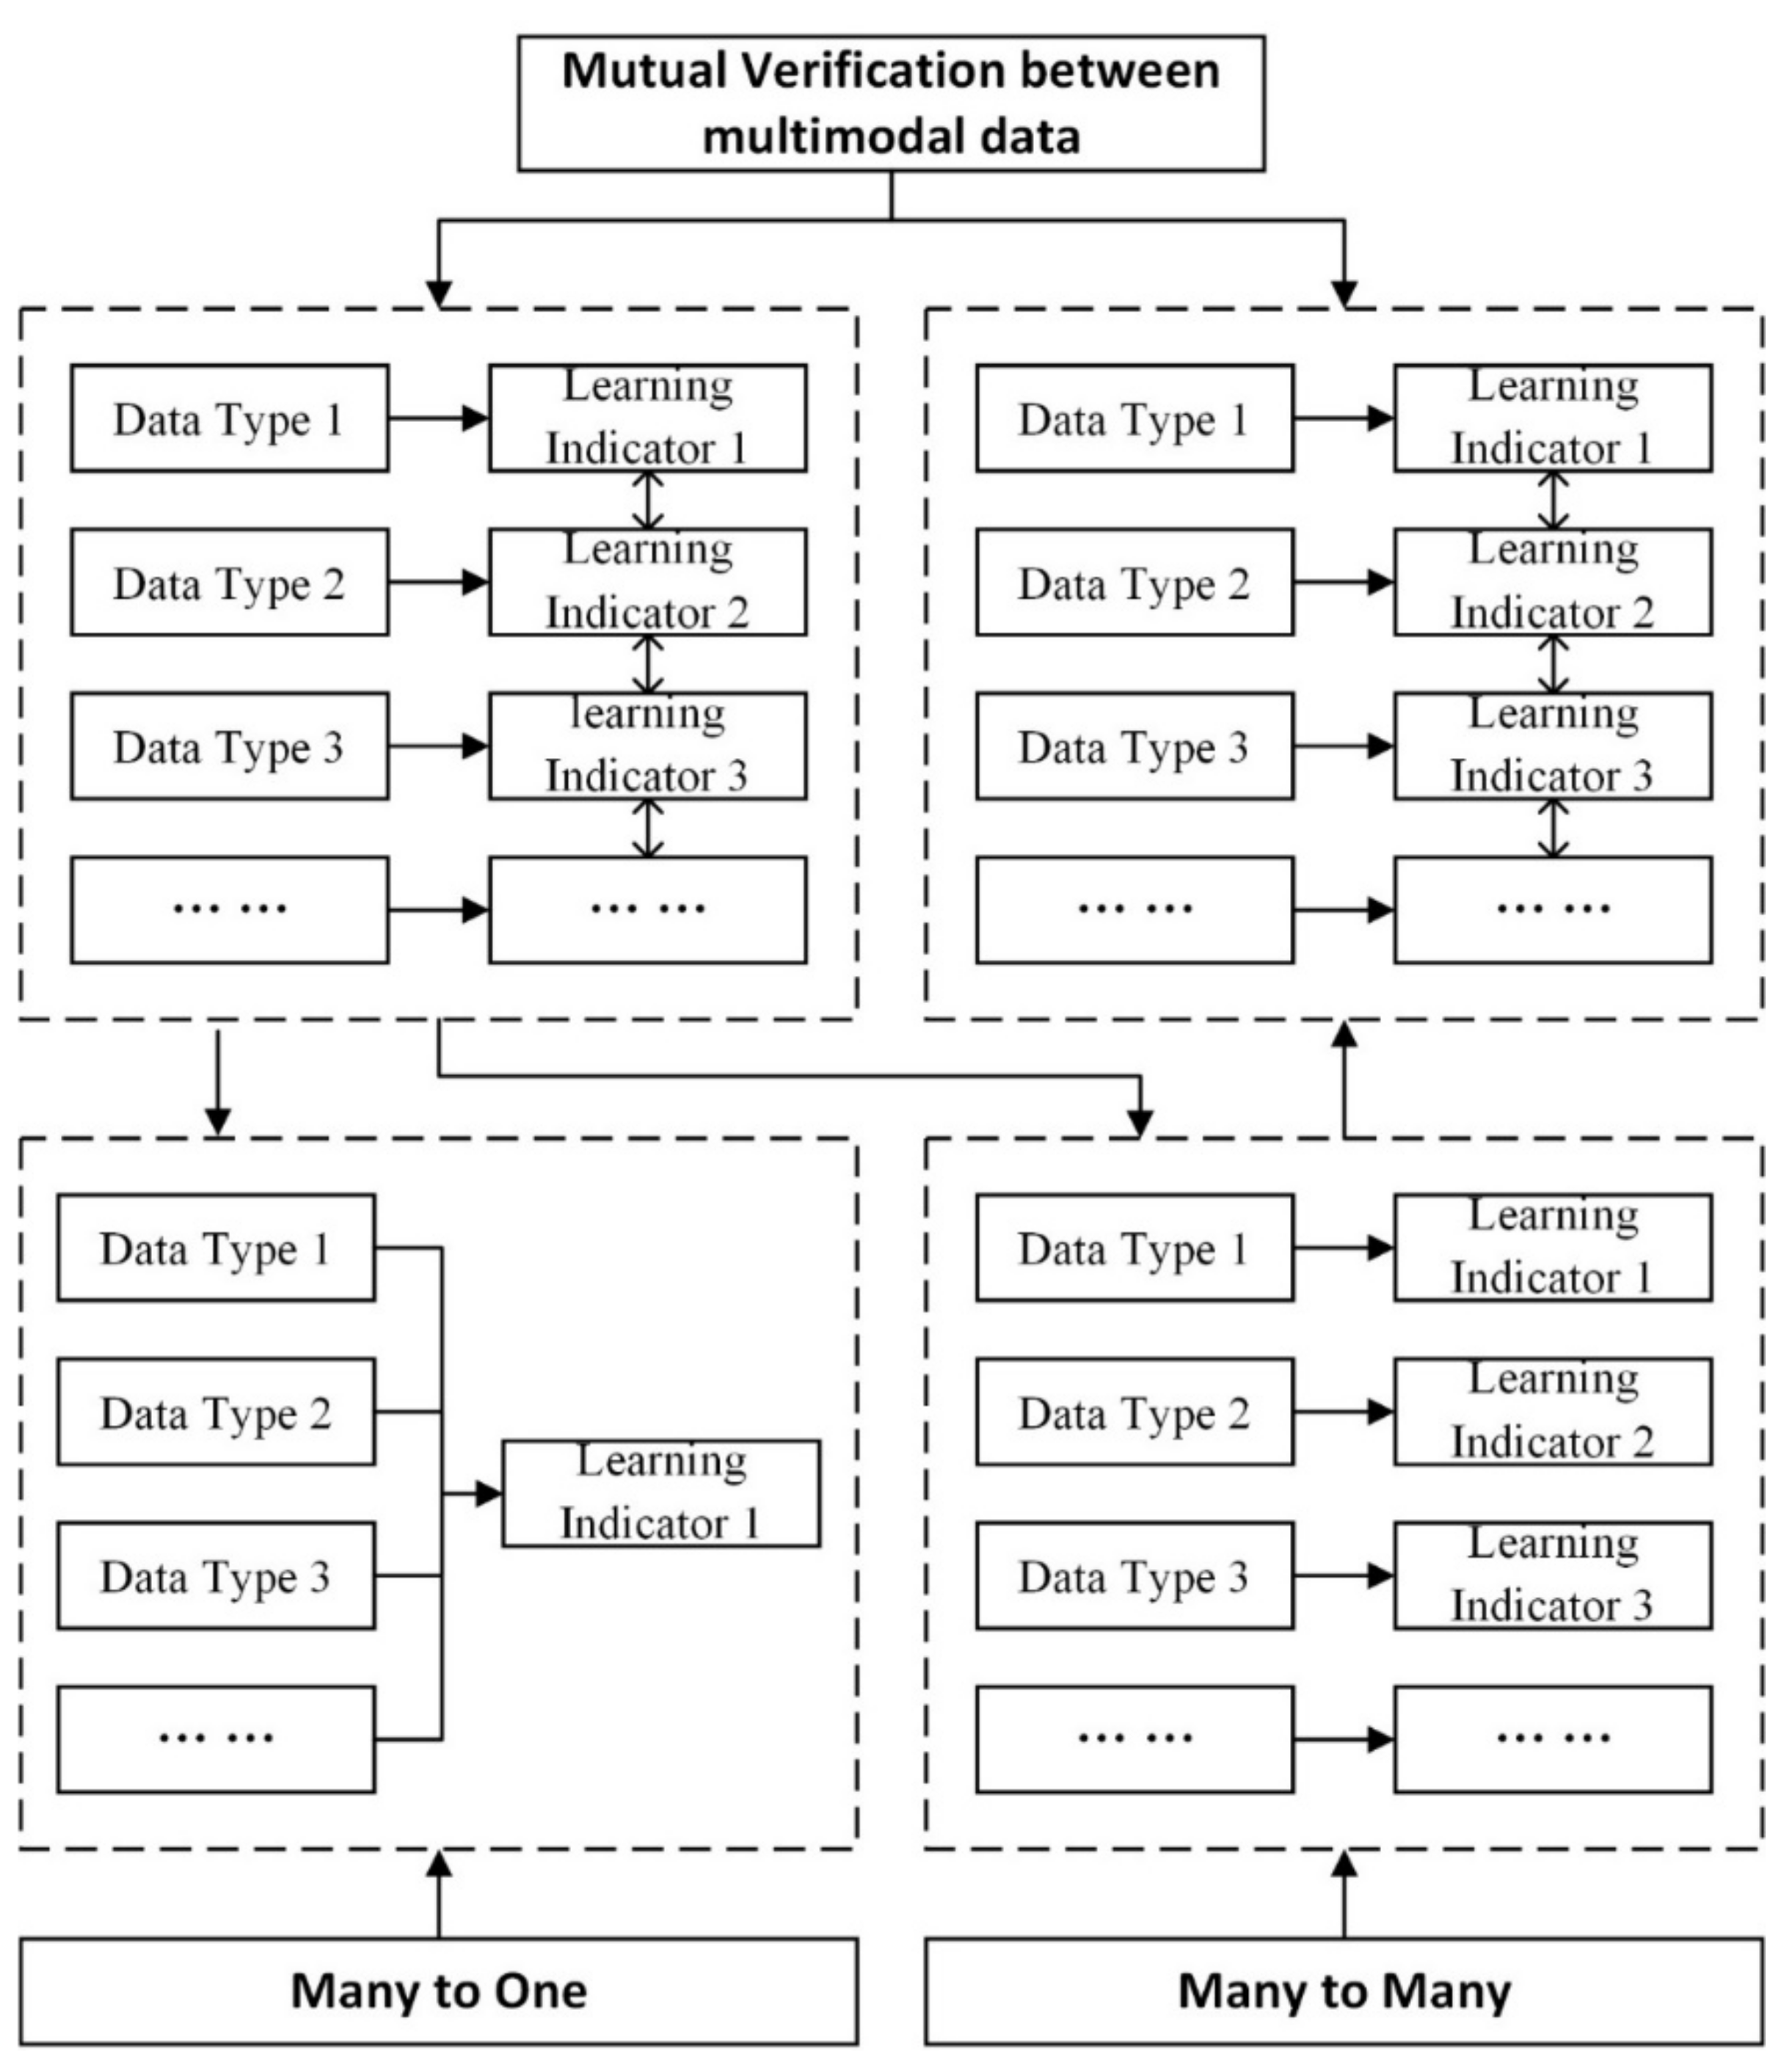
4.3. The Relationships between Multimodal Data and Learning Indicators
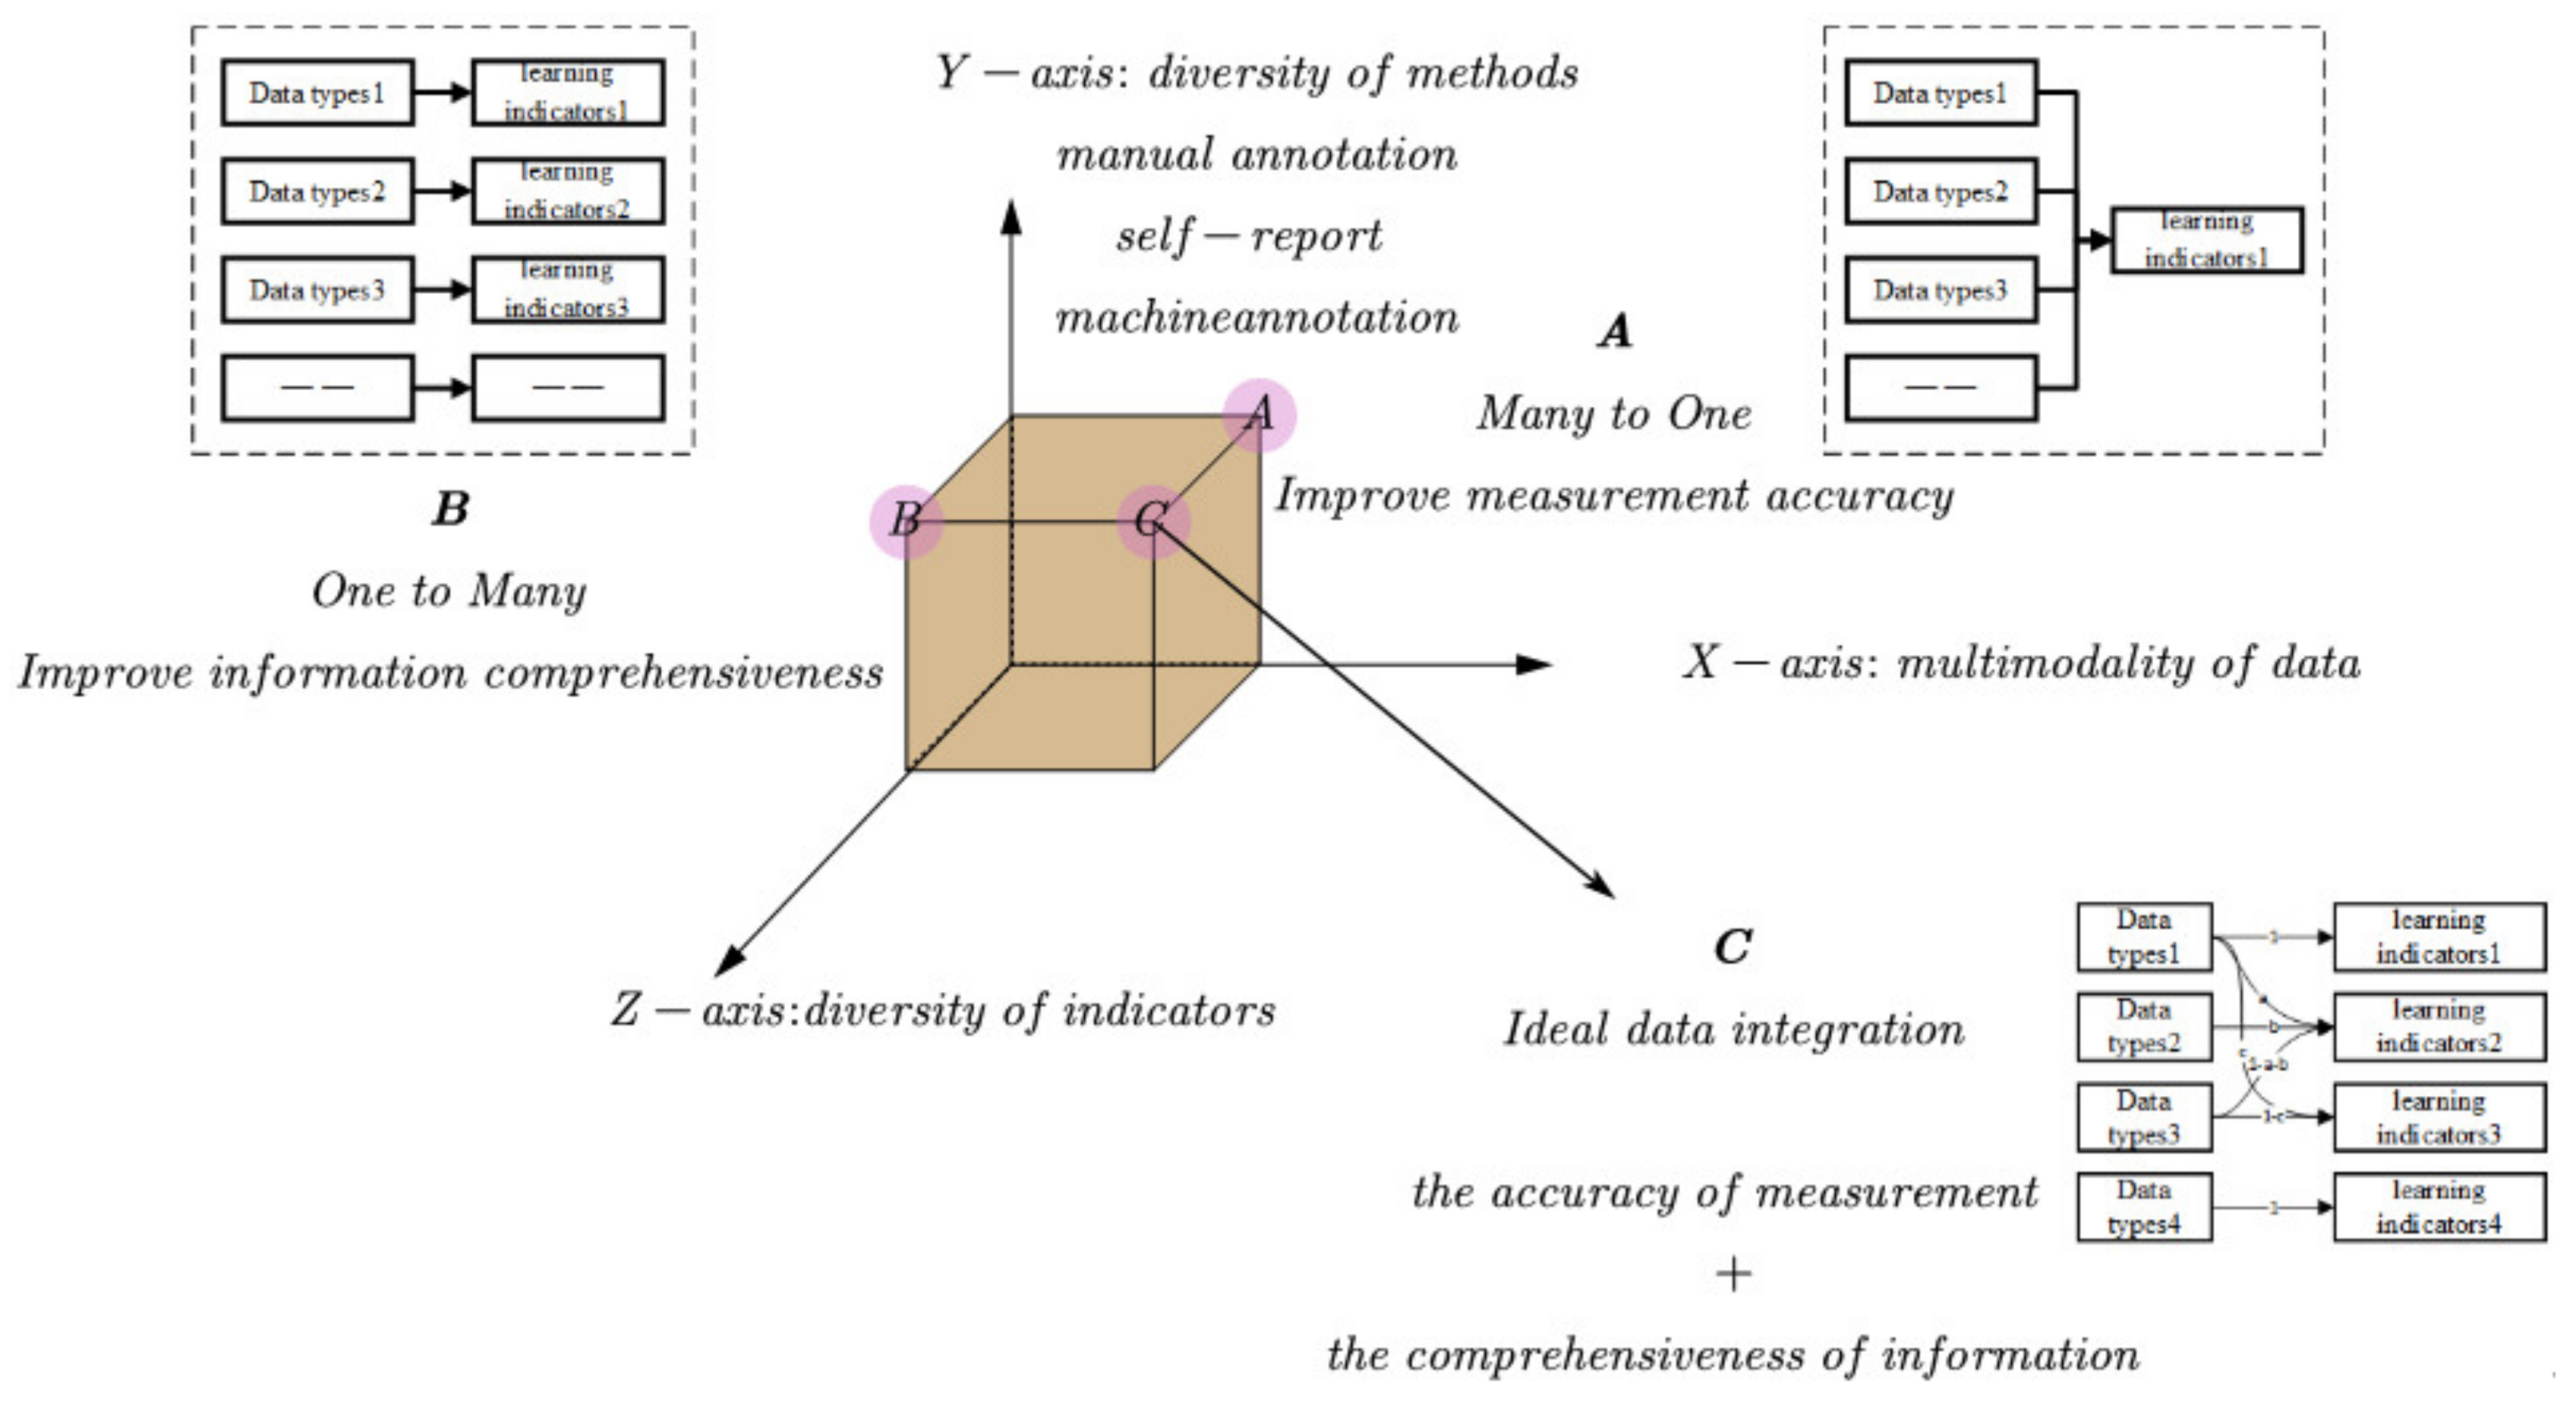
5. Data Fusion (Q3)
5.1. Integration Methods
5.1.1. “Many-to-One” (Improving Measurement Accuracy)
5.1.2. “Many-to-Many” (Improving Information Richness)
5.1.3. Multimodal Data Validation (Provides Empirical Evidence for Data Fusion)
5.1.4. Other Integration Methods
5.2. Summary of the Key Stages of Data Integration and Research Directions
6. Conclusions
Author Contributions
Funding
Conflicts of Interest
References
- Siemens, G.; Baker, R.S.J.d. Learning analytics and educational data mining: Towards communication and collaboration. In Proceedings of the 2nd International Conference on Learning Analytics and Knowledge (LAK 2012), New York, NY, USA, 29 April–2 May 2012; pp. 252–254. [Google Scholar]
- Schwendimann, B.A.; Rodríguez-Triana, M.J.; Vozniuk, A.; Prieto, L.P.; Boroujeni, M.S.; Holzer, A.; Gillet, D.; Dillenbourg, P. Perceiving Learning at a Glance: A Systematic Literature Review of Learning Dashboard Research. IEEE Trans. Learn. Technol. 2017, 10, 30–41. [Google Scholar] [CrossRef]
- Liu, R.; Stamper, J.; Davenport, J.; Crossley, S.; McNamara, D.; Nzinga, K.; Sherin, B. Learning linkages: Integrating data streams of multiple modalities and timescales. J. Comput. Assist. Learn. 2019, 35, 99–109. [Google Scholar] [CrossRef]
- Eradze, M.; Laanpere, M. Lesson Observation Data in Learning Analytics Datasets: Observata. In Proceedings of the 12th European Conference on Technology-Enhanced Learning (EC-TEL 2017), Tallinn, Estonia, 12–15 September 2017; pp. 504–508. [Google Scholar]
- Rodríguez-Triana, M.J.; Prieto, L.P.; Vozniuk, A.; Boroujeni, M.S.; Schwendimann, B.A.; Holzer, A.; Gillet, D. Monitoring, awareness and reflection in blended technology enhanced learning: A systematic review. Int. J. Technol. Enhanc. Learn. 2017, 9, 126–150. [Google Scholar] [CrossRef]
- Di Mitri, D. Digital Learning Projection. In Artificial Intelligence in Education; André, E., Baker, R., Hu, X., Rodrigo, M.M.T., du Boulay, B., Eds.; Lecture Notes in Computer Science; Springer International Publishing: Cham, Switzerland, 2017; Volume 10331, pp. 609–612. [Google Scholar]
- Di Mitri, D.; Schneider, J.; Specht, M.; Drachsler, H. From signals to knowledge: A conceptual model for multimodal learning analytics. J. Comput. Assist. Learn. 2018, 34, 338–349. [Google Scholar] [CrossRef]
- Ochoa, X.; Worsley, M. Editorial: Augmenting Learning Analytics with Multimodal Sensory Data. J. Learn. Anal. 2016, 3, 213–219. [Google Scholar] [CrossRef]
- Blikstein, P. Multimodal learning analytics. In Proceedings of the Third International Conference on Learning Analytics and Knowledge, Leuven, Belgium, 8–12 April 2013; pp. 102–106. [Google Scholar]
- Spikol, D.; Prieto, L.P.; Rodríguez-Triana, M.J.; Worsley, M.; Ochoa, X.; Cukurova, M. Current and future multimodal learning analytics data challenges. In Proceedings of the Seventh International Learning Analytics & Knowledge Conference (LAK ’17), Vancouver, BC, Canada, 13–17 March 2017; pp. 518–519. [Google Scholar]
- Cukurova, M. A Syllogism for Designing Collaborative Learning Technologies in the Age of AI and Multimodal Data. In Proceedings of the Lifelong Technology-Enhanced Learning, Leeds, UK, 3–5 September 2018; Pammer-Schindler, V., Pérez-Sanagustín, M., Drachsler, H., Elferink, R., Scheffel, M., Eds.; Springer International Publishing: Cham, Switzerland, 2018; pp. 291–296. [Google Scholar]
- Peffer, M.E. Combining Multimodal Learning Analytics with Backward Design to Assess Learning. In Proceedings of the 8th International Conference on Learning Analytics & Knowledge (LAK18), Sydney, Australia, 5–9 March 2018; pp. 1–5. [Google Scholar]
- Prieto, L.P.; Rodríguez-Triana, M.J.; Martínez-Maldonado, R.; Dimitriadis, Y.; Gašević, D. Orchestrating learning analytics (OrLA): Supporting inter-stakeholder communication about adoption of learning analytics at the classroom level. Australas. J. Educ. Technol. 2019, 35, 14–33. [Google Scholar] [CrossRef]
- Haider, F.; Luz, S.; Campbell, N. Data Collection and Synchronisation: Towards a Multiperspective Multimodal Dialogue System with Metacognitive Abilities. In Dialogues with Social Robots: Enablements, Analyses, and Evaluation; Jokinen, K., Wilcock, G., Eds.; Lecture Notes in Electrical Engineering; Springer: Singapore, 2017; pp. 245–256. ISBN 978-981-10-2585-3. [Google Scholar]
- Turker, A.; Dalsen, J.; Berland, M.; Steinkuehler, C. Challenges to Multimodal Data Set Collection in Games-based Learning Environments. In Proceedings of the Sixth Multimodal Learning Analytics (MMLA) Workshop, Vancouver, BC, Canada, 13–17 March 2017; pp. 1–7. [Google Scholar]
- Chua, Y.H.V.; Rajalingam, P.; Tan, S.C.; Dauwels, J. EduBrowser: A Multimodal Automated Monitoring System for Co-located Collaborative Learning. In Proceedings of the Learning Technology for Education Challenges, Zamora, Spain, 15–18 July 2019; pp. 125–138. [Google Scholar]
- Lahbi, Z.; Sabbane, M. U-Edu: Multimodal learning activities analytics model for learner feedback in ubiquitous education system. Int. J. Adv. Trends Comput. Sci. Eng. 2019, 8, 2551–2555. [Google Scholar] [CrossRef]
- Shankar, S.K.; Rodríguez-Triana, M.J.; Ruiz-Calleja, A.; Prieto, L.P.; Chejara, P.; Martínez-Monés, A. Multimodal Data Value Chain (M-DVC): A Conceptual Tool to Support the Development of Multimodal Learning Analytics Solutions. Revista Iberoamericana de Tecnologias del Aprendizaje 2020, 15, 113–122. [Google Scholar] [CrossRef]
- Bannert, M.; Molenar, I.; Azevedo, R.; Järvelä, S.; Gašević, D. Relevance of learning analytics to measure and support students’ learning in adaptive educational technologies. In Proceedings of the Seventh International Learning Analytics & Knowledge Conference (LAK ’17), Vancouver, BC, Canada, 13–17 March 2017; pp. 568–569. [Google Scholar]
- Martinez-Maldonado, R.; Kay, J.; Buckingham Shum, S.; Yacef, K. Collocated Collaboration Analytics: Principles and Dilemmas for Mining Multimodal Interaction Data. Hum. Comput. Interact. 2019, 34, 1–50. [Google Scholar] [CrossRef]
- Samuelsen, J.; Chen, W.; Wasson, B. Integrating multiple data sources for learning analytics—Review of literature. Res. Pract. Technol. Enhanc. Learn. 2019, 14, 11. [Google Scholar] [CrossRef]
- Liu, R.; Stamper, J.; Davenport, J. A novel method for the in-depth multimodal analysis of student learning trajectories in intelligent tutoring systems. J. Learn. Anal. 2018, 5, 41–54. [Google Scholar] [CrossRef]
- Mitri, D.D.; Schneider, J.; Specht, M.; Drachsler, H. The Big Five: Addressing Recurrent Multimodal Learning Data Challenges. In Proceedings of the Companion Proceedings of the 8th International Conference on Learning Analytics and Knowledge: Towards User-Centred Learning Analytics, Sydney, Australia, 5–9 March 2018; pp. 420–424. [Google Scholar]
- Oviatt, S. Ten Opportunities and Challenges for Advancing Student-Centered Multimodal Learning Analytics. In Proceedings of the 20th ACM International Conference on Multimodal Interaction, Boulder, CO, USA, 16–20 October 2018; pp. 87–94. [Google Scholar]
- Worsley, M. Multimodal learning analytics’ past, present, and, potential futures. In Proceedings of the 8th International Conference on Learning Analytics & Knowledge (LAK18), Sydney, Australia, 5–9 March 2018. [Google Scholar]
- Shankar, S.K.; Prieto, L.P.; Rodríguez-Triana, M.J.; Ruiz-Calleja, A. A Review of Multimodal Learning Analytics Architectures. In Proceedings of the 2018 IEEE 18th International Conference on Advanced Learning Technologies (ICALT), Mumbai, India, 9–13 July 2018; pp. 212–214. [Google Scholar]
- Crescenzi-Lanna, L. Multimodal Learning Analytics research with young children: A systematic review. Br. J. Educ. Technol. 2020, 51, 1485–1504. [Google Scholar] [CrossRef]
- Moher, D.; Liberati, A.; Tetzlaff, J.; Altman, D.G.; Group, T.P. Preferred Reporting Items for Systematic Reviews and Meta-Analyses: The PRISMA Statement. PLoS Med. 2009, 6, e1000097. [Google Scholar] [CrossRef] [PubMed]
- Bond, M. Facilitating student engagement through the flipped learning approach in K-12: A systematic review. Comput. Educ. 2020, 151, 103819. [Google Scholar] [CrossRef]
- Crompton, H.; Burke, D. Mobile learning and pedagogical opportunities: A configurative systematic review of PreK-12 research using the SAMR framework. Comput. Educ. 2020, 156, 103945. [Google Scholar] [CrossRef]
- Diacopoulos, M.M.; Crompton, H. A systematic review of mobile learning in social studies. Comput. Educ. 2020, 154, 103911. [Google Scholar] [CrossRef]
- Hooshyar, D.; Pedaste, M.; Saks, K.; Leijen, Ä.; Bardone, E.; Wang, M. Open learner models in supporting self-regulated learning in higher education: A systematic literature review. Comput. Educ. 2020, 154, 103878. [Google Scholar] [CrossRef]
- Papadopoulos, I.; Lazzarino, R.; Miah, S.; Weaver, T.; Thomas, B.; Koulouglioti, C. A systematic review of the literature regarding socially assistive robots in pre-tertiary education. Comput. Educ. 2020, 155, 103924. [Google Scholar] [CrossRef]
- Eradze, M.; Rodriguez Triana, M.J.; Laanpere, M. How to Aggregate Lesson Observation Data into Learning Analytics Datasets? Available online: https://infoscience.epfl.ch/record/229372 (accessed on 17 March 2020).
- Eradze, M.; Rodríguez-Triana, M.J.; Laanpere, M. Semantically Annotated Lesson observation Data in Learning Analytics Datasets: A Reference Model. Interacti. Des. Archit. J. 2017, 33, 91–95. [Google Scholar]
- Henrie, C.R.; Bodily, R.; Larsen, R.; Graham, C.R. Exploring the potential of LMS log data as a proxy measure of student engagement. J. Comput. High. Educ. 2018, 30, 344–362. [Google Scholar] [CrossRef]
- Spikol, D.; Ruffaldi, E.; Dabisias, G.; Cukurova, M. Supervised machine learning in multimodal learning analytics for estimating success in project-based learning. J. Comput. Assist. Learn. 2018, 34, 366–377. [Google Scholar] [CrossRef]
- Okur, E.; Alyuz, N.; Aslan, S.; Genc, U.; Tanriover, C.; Arslan Esme, A. Behavioral Engagement Detection of Students in the Wild. In Proceedings of the Artificial Intelligence in Education, Wuhan, China, 28 June–1 July 2017; André, E., Baker, R., Hu, X., Rodrigo, M.M.T., du Boulay, B., Eds.; Springer International Publishing: Cham, Switzerland, 2017; pp. 250–261. [Google Scholar]
- Su, Y.-S.; Ding, T.-J.; Lai, C.-F. Analysis of Students Engagement and Learning Performance in a Social Community Supported Computer Programming Course. Eurasia J. Math. Sci. Technol. Ed. 2017, 13, 6189–6201. [Google Scholar] [CrossRef]
- Suero Montero, C.; Suhonen, J. Emotion analysis meets learning analytics: Online learner profiling beyond numerical data. In Proceedings of the 14th Koli Calling International Conference on Computing Education Research, Koli, Finland, 20–23 November 2014; pp. 165–169. [Google Scholar]
- Oviatt, S.; Hang, K.; Zhou, J.; Yu, K.; Chen, F. Dynamic Handwriting Signal Features Predict Domain Expertise. ACM Trans. Interact. Intell. Syst. 2018, 8, 1–21. [Google Scholar] [CrossRef]
- Loup-Escande, E.; Frenoy, R.; Poplimont, G.; Thouvenin, I.; Gapenne, O.; Megalakaki, O. Contributions of mixed reality in a calligraphy learning task: Effects of supplementary visual feedback and expertise on cognitive load, user experience and gestural performance. Comput. Hum. Behav. 2017, 75, 42–49. [Google Scholar] [CrossRef]
- Hsiao, I.-H.; Huang, P.-K.; Murphy, H. Integrating Programming Learning Analytics Across Physical and Digital Space. IEEE Trans. Emerg. Top. Comput. 2020, 8, 206–217. [Google Scholar] [CrossRef]
- Paredes, Y.V.; Azcona, D.; Hsiao, I.-H.; Smeaton, A. Learning by Reviewing Paper-Based Programming Assessments. In Proceedings of the Lifelong Technology-Enhanced Learning; Pammer-Schindler, V., Pérez-Sanagustín, M., Drachsler, H., Elferink, R., Scheffel, M., Eds.; Springer International Publishing: Cham, Switzerland, 2018; pp. 510–523. [Google Scholar]
- Sharma, K.; Dillenbourg, P.; Giannakos, M. Stimuli-Based Gaze Analytics to Enhance Motivation and Learning in MOOCs. In Proceedings of the 2019 IEEE 19th International Conference on Advanced Learning Technologies (ICALT), Macei, Brazil, 15–18 July 2019; pp. 199–203. [Google Scholar]
- D’Angelo, S.; Begel, A. Improving Communication Between Pair Programmers Using Shared Gaze Awareness. In Proceedings of the 2017 CHI Conference on Human Factors in Computing Systems, Denver, CO, USA, 6–11 May 2017; pp. 6245–6290. [Google Scholar]
- Schneider, B.; Sharma, K.; Cuendet, S.; Zufferey, G.; Dillenbourg, P.; Pea, R. Leveraging mobile eye-trackers to capture joint visual attention in co-located collaborative learning groups. Int. J. Comput.-Support. Collab. Learn. 2018, 13, 241–261. [Google Scholar] [CrossRef]
- Ding, Y.; Zhang, Y.; Xiao, M.; Deng, Z. A Multifaceted Study on Eye Contact based Speaker Identification in Three-party Conversations. In Proceedings of the 2017 CHI Conference on Human Factors in Computing Systems, Denver, CO, USA, 6–11 May 2017; pp. 3011–3021. [Google Scholar]
- Noel, R.; Riquelme, F.; Lean, R.M.; Merino, E.; Cechinel, C.; Barcelos, T.S.; Villarroel, R.; Muñoz, R. Exploring Collaborative Writing of User Stories with Multimodal Learning Analytics: A Case Study on a Software Engineering Course. IEEE Access 2018. [Google Scholar] [CrossRef]
- Paans, C.; Molenaar, I.; Segers, E.; Verhoeven, L. Temporal variation in children’s self-regulated hypermedia learning. Comput. Hum. Behav. 2019, 96, 246–258. [Google Scholar] [CrossRef]
- Martin, K.; Wang, E.Q.; Bain, C.; Worsley, M. Computationally Augmented Ethnography: Emotion Tracking and Learning in Museum Games. In Proceedings of the Advances in Quantitative Ethnography, Madison, WI, USA, 20–22 October 2019; pp. 141–153. [Google Scholar]
- Monkaresi, H.; Bosch, N.; Calvo, R.A.; D’Mello, S.K. Automated Detection of Engagement Using Video-Based Estimation of Facial Expressions and Heart Rate. IEEE Trans. Affect. Comput. 2017, 8, 15–28. [Google Scholar] [CrossRef]
- Watanabe, E.; Ozeki, T.; Kohama, T. Analysis of interactions between lecturers and students. In Proceedings of the 8th International Conference on Learning Analytics and Knowledge-LAK ’18, Sydney, Australia, 5–9 March 2018; pp. 370–374. [Google Scholar]
- Ngoc Anh, B.; Tung Son, N.; Truong Lam, P.; Phuong Chi, L.; Huu Tuan, N.; Cong Dat, N.; Huu Trung, N.; Umar Aftab, M.; Van Dinh, T. A Computer-Vision Based Application for Student Behavior Monitoring in Classroom. Appl. Sci. 2019, 9, 4729. [Google Scholar] [CrossRef]
- Abdelrahman, Y.; Velloso, E.; Dingler, T.; Schmidt, A.; Vetere, F. Cognitive Heat: Exploring the Usage of Thermal Imaging to Unobtrusively Estimate Cognitive Load. Proc. ACM Interact. Mob. Wearable Ubiquitous Technol. 2017, 1, 33:1–33:20. [Google Scholar] [CrossRef]
- Cukurova, M.; Zhou, Q.; Spikol, D.; Landolfi, L. Modelling collaborative problem-solving competence with transparent learning analytics: Is video data enough? In Proceedings of the Tenth International Conference on Learning Analytics & Knowledge, Frankfurt, Germany, 23–27 March 2020; pp. 270–275. [Google Scholar]
- Asadipour, A.; Debattista, K.; Chalmers, A. Visuohaptic augmented feedback for enhancing motor skills acquisition. Vis. Comput. 2017, 33, 401–411. [Google Scholar] [CrossRef]
- Ou, L.; Andrade, A.; Alberto, R.; van Helden, G.; Bakker, A. Using a cluster-based regime-switching dynamic model to understand embodied mathematical learning. In Proceedings of the Tenth International Conference on Learning Analytics & Knowledge, Frankfurt, Germany, 23–27 March 2020; pp. 496–501. [Google Scholar]
- Sriramulu, A.; Lin, J.; Oviatt, S. Dynamic Adaptive Gesturing Predicts Domain Expertise in Mathematics. In Proceedings of the 2019 International Conference on Multimodal Interaction (ICMI’ 19), Suzhou, China, 14–18 October 2019; pp. 105–113. [Google Scholar]
- Rosen, D.; Palatnik, A.; Abrahamson, D. A Better Story: An Embodied-Design Argument for Generic Manipulatives. In Using Mobile Technologies in the Teaching and Learning of Mathematics; Calder, N., Larkin, K., Sinclair, N., Eds.; Mathematics Education in the Digital Era; Springer International Publishing: Cham, Switzerland, 2018; pp. 189–211. [Google Scholar]
- Di Mitri, D.; Scheffel, M.; Drachsler, H.; Börner, D.; Ternier, S.; Specht, M. Learning pulse: A machine learning approach for predicting performance in self-regulated learning using multimodal data. In Proceedings of the Seventh International Learning Analytics & Knowledge Conference (LAK ’17), Vancouver, BC, Canada, 13–17 March 2017; pp. 188–197. [Google Scholar]
- Junokas, M.J.; Lindgren, R.; Kang, J.; Morphew, J.W. Enhancing multimodal learning through personalized gesture recognition. J. Comput. Assist. Learn. 2018, 34, 350–357. [Google Scholar] [CrossRef]
- Ibrahim-Didi, K.; Hackling, M.W.; Ramseger, J.; Sherriff, B. Embodied Strategies in the Teaching and Learning of Science. In Quality Teaching in Primary Science Education: Cross-Cultural Perspectives; Hackling, M.W., Ramseger, J., Chen, H.-L.S., Eds.; Springer International Publishing: Cham, Switzerland, 2017; pp. 181–221. ISBN 978-3-319-44383-6. [Google Scholar]
- Martinez-Maldonado, R. “I Spent More Time with that Team”: Making Spatial Pedagogy Visible Using Positioning Sensors. In Proceedings of the 9th International Conference on Learning Analytics & Knowledge-LAK19, Tempe, AZ, USA, 4–8 March 2019; pp. 21–25. [Google Scholar]
- Healion, D.; Russell, S.; Cukurova, M.; Spikol, D. Tracing physical movement during practice-based learning through multimodal learning analytics. In Proceedings of the Seventh International Learning Analytics & Knowledge Conference (LAK ’17), Vancouver, BC, Canada, 13–17 March 2017; pp. 588–589. [Google Scholar]
- An, P.; Bakker, S.; Ordanovski, S.; Paffen, C.L.E.; Taconis, R.; Eggen, B. Dandelion Diagram: Aggregating Positioning and Orientation Data in the Visualization of Classroom Proxemics. In Proceedings of the Extended Abstracts of the 2020 CHI Conference on Human Factors in Computing Systems, Honolulu, HI, USA, 25–30 April 2020; pp. 1–8. [Google Scholar]
- Mills, C.; Fridman, I.; Soussou, W.; Waghray, D.; Olney, A.M.; D’Mello, S.K. Put your thinking cap on: Detecting cognitive load using EEG during learning. In Proceedings of the Seventh International Learning Analytics & Knowledge Conference (LAK ’17), Vancouver, BC, Canada, 13–17 March 2017; pp. 80–89. [Google Scholar]
- Tzirakis, P.; Trigeorgis, G.; Nicolaou, M.A.; Schuller, B.W.; Zafeiriou, S. End-to-End Multimodal Emotion Recognition Using Deep Neural Networks. IEEE J. Sel. Top. Signal Process. 2017, 11, 1301–1309. [Google Scholar] [CrossRef]
- Pijeira-Díaz, H.J.; Drachsler, H.; Kirschner, P.A.; Järvelä, S. Profiling sympathetic arousal in a physics course: How active are students? J. Comput. Assist. Learn. 2018, 34, 397–408. [Google Scholar] [CrossRef]
- Edwards, A.A.; Massicci, A.; Sridharan, S.; Geigel, J.; Wang, L.; Bailey, R.; Alm, C.O. Sensor-based Methodological Observations for Studying Online Learning. In Proceedings of the 2017 ACM Workshop on Intelligent Interfaces for Ubiquitous and Smart Learning, Limassol, Cyprus, 13 March 2017; pp. 25–30. [Google Scholar]
- Yin, Z.; Zhao, M.; Wang, Y.; Yang, J.; Zhang, J. Recognition of emotions using multimodal physiological signals and an ensemble deep learning model. Comput. Methods Programs Biomed. 2017, 140, 93–110. [Google Scholar] [CrossRef]
- Ahonen, L.; Cowley, B.U.; Hellas, A.; Puolamäki, K. Biosignals reflect pair-dynamics in collaborative work: EDA and ECG study of pair-programming in a classroom environment. Sci. Rep. 2018, 8, 1–16. [Google Scholar] [CrossRef]
- Pham, P.; Wang, J. AttentiveLearner2: A Multimodal Approach for Improving MOOC Learning on Mobile Devices. In Artificial Intelligence in Education; André, E., Baker, R., Hu, X., Rodrigo, M.M.T., du Boulay, B., Eds.; Lecture Notes in Computer Science; Springer International Publishing: Cham, Switzerland, 2017; Volume 10331, pp. 561–564. [Google Scholar]
- Chejara, P.; Prieto, L.P.; Ruiz-Calleja, A.; Rodríguez-Triana, M.J.; Shankar, S.K. Exploring the Triangulation of Dimensionality Reduction When Interpreting Multimodal Learning Data from Authentic Settings. In Proceedings of the Transforming Learning with Meaningful Technologies; Scheffel, M., Broisin, J., Pammer-Schindler, V., Ioannou, A., Schneider, J., Eds.; Springer International Publishing: Cham, Switzerland, 2019; pp. 664–667. [Google Scholar]
- Kim, J.; Meltzer, C.; Salehi, S.; Blikstein, P. Process Pad: A multimedia multi-touch learning platform. In Proceedings of the ACM International Conference on Interactive Tabletops and Surfaces (ITS ’11), Kobe, Japan, 13–16 November 2011; pp. 272–273. [Google Scholar]
- Cukurova, M.; Luckin, R.; Mavrikis, M.; Millán, E. Machine and Human Observable Differences in Groups’ Collaborative Problem-Solving Behaviours. In Proceedings of the Data Driven Approaches in Digital Education, Tallinn, Estonia, 12–15 September 2017; pp. 17–29. [Google Scholar]
- Spikol, D.; Avramides, K.; Cukurova, M.; Vogel, B.; Luckin, R.; Ruffaldi, E.; Mavrikis, M. Exploring the interplay between human and machine annotated multimodal learning analytics in hands-on STEM activities. In Proceedings of the Sixth International Conference on Learning Analytics & Knowledge, Edinburgh, UK, 25–29 April 2016; pp. 522–523. [Google Scholar]
- Worsley, M.A.B. Multimodal Learning Analytics for the Qualitative Researcher. In Proceedings of the 2018 International Conference of the Learning Sciences, London, UK, 23–27 June 2018; pp. 1109–1112. [Google Scholar]
- Ez-zaouia, M.; Lavoué, E. EMODA: A tutor oriented multimodal and contextual emotional dashboard. In Proceedings of the Seventh International Learning Analytics & Knowledge Conference (LAK ’17), Vancouver, BC, Canada, 13–17 March 2017; pp. 429–438. [Google Scholar]
- Martinez-Maldonado, R.; Echeverria, V.; Fernandez Nieto, G.; Buckingham Shum, S. From Data to Insights: A Layered Storytelling Approach for Multimodal Learning Analytics. In Proceedings of the 2020 CHI Conference on Human Factors in Computing Systems, Honolulu, HI, USA, 25–30 April 2020; pp. 1–15. [Google Scholar]
- Praharaj, S.; Scheffel, M.; Drachsler, H.; Specht, M. Multimodal Analytics for Real-Time Feedback in Co-located Collaboration. In Proceedings of the Lifelong Technology-Enhanced Learning, Leeds, UK, 3–5 September 2018; pp. 187–201. [Google Scholar]
- Zaletelj, J.; Košir, A. Predicting students’ attention in the classroom from Kinect facial and body features. EURASIP J. Image Video Process. 2017, 2017, 80. [Google Scholar] [CrossRef]
- Thomas, C. Multimodal Teaching and Learning Analytics for Classroom and Online Educational Settings. In Proceedings of the 20th ACM International Conference on Multimodal Interaction, Boulder, CO, USA, 20–26 October 2018; pp. 542–545. [Google Scholar]
- Sommer, S.; Hinojosa, L.; Traut, H.; Polman, J.; Weidler-Lewis, J. Integrating Eye-Tracking Activities Into a Learning Environment to Promote Collaborative Meta-Semiotic Reflection and Discourse. In Proceedings of the 12th International Conference on Computer Supported Collaborative Learning (CSCL) 2017, Philadelphia, PA, USA, 11–12 February 2017; pp. 1–4. [Google Scholar]
- Martinez-Maldonado, R.; Echeverria, V.; Santos, O.C.; Santos, A.D.P.D.; Yacef, K. Physical learning analytics: A multimodal perspective. In Proceedings of the 8th International Conference on Learning Analytics and Knowledge (LAK’18), Sydney, Australia, 5–9 March 2018; pp. 375–379. [Google Scholar]
- Spikol, D.; Ruffaldi, E.; Cukurova, M. Using Multimodal Learning Analytics to Identify Aspects of Collaboration in Project-Based Learning. In Proceedings of the 12th International Conference on Computer Supported Collaborative Learning, Philadelphia, PA, USA, 18–22 June 2017; pp. 263–270. [Google Scholar]
- Duijzer, C.A.C.G.; Shayan, S.; Bakker, A.; Van der Schaaf, M.F.; Abrahamson, D. Touchscreen Tablets: Coordinating Action and Perception for Mathematical Cognition. Front. Psychol. 2017, 8. [Google Scholar] [CrossRef]
- Paredes, Y.V.; Hsiao, I.; Lin, Y. Personalized guidance on how to review paper-based assessments. In Proceedings of the 26th International Conference on Computers in Education, Main Conference Proceedings, Manila, Philppines, 26–30 November 2018; pp. 257–265. [Google Scholar]
- Larmuseau, C.; Vanneste, P.; Desmet, P.; Depaepe, F. Multichannel data for understanding cognitive affordances during complex problem solving. In Proceedings of the 9th International Conference on Learning Analytics & Knowledge (LAK ’19), Tempe, AZ, USA, 4–8 March 2019; pp. 61–70. [Google Scholar]
- Sonnenberg, C.; Bannert, M. Using Process Mining to examine the sustainability of instructional support: How stable are the effects of metacognitive prompting on self-regulatory behavior? Comput. Hum. Behav. 2019, 96, 259–272. [Google Scholar] [CrossRef]
- Cukurova, M.; Luckin, R.; Millán, E.; Mavrikis, M. The NISPI framework: Analysing collaborative problem-solving from students’ physical interactions. Comput. Educ. 2018, 116, 93–109. [Google Scholar] [CrossRef]
- Gorham, T.; Jubaed, S.; Sanyal, T.; Starr, E.L. Assessing the efficacy of VR for foreign language learning using multimodal learning analytics. In Professional Development in CALL: A Selection of Papers; Research-Publishing.Net: Voillans, France, 2019; pp. 101–116. [Google Scholar]
- Sun, B.; Lai, S.; Xu, C.; Xiao, R.; Wei, Y.; Xiao, Y. Differences of online learning behaviors and eye-movement between students having different personality traits. In Proceedings of the 1st ACM SIGCHI International Workshop on Multimodal Interaction for Education, Glasgow, UK, 13 November 2017; pp. 71–75. [Google Scholar]
- Munshi, A.; Biswas, G. Personalization in OELEs: Developing a Data-Driven Framework to Model and Scaffold SRL Processes. In Artificial Intelligence in Education; Isotani, S., Millán, E., Ogan, A., Hastings, P., McLaren, B., Luckin, R., Eds.; Lecture Notes in Computer Science; Springer International Publishing: Cham, Switzerland, 2019; Volume 11626, pp. 354–358. [Google Scholar]
- Andrade, A.; Maddox, B.; Edwards, D.; Chopade, P.; Khan, S. Quantitative Multimodal Interaction Analysis for the Assessment of Problem-Solving Skills in a Collaborative Online Game. In Proceedings of the Advances in Quantitative Ethnography, Madison, WI, USA, 20–22 October 2019; pp. 281–290. [Google Scholar]
- Aslan, S.; Alyuz, N.; Tanriover, C.; Mete, S.E.; Okur, E.; D’Mello, S.K.; Arslan Esme, A. Investigating the Impact of a Real-time, Multimodal Student Engagement Analytics Technology in Authentic Classrooms. In Proceedings of the 2019 CHI Conference on Human Factors in Computing Systems (CHI ’19), Glasgow, UK, 4–9 May 2019; pp. 1–12. [Google Scholar]
- Dindar, M.; Malmberg, J.; Järvelä, S.; Haataja, E.; Kirschner, P.A. Matching self-reports with electrodermal activity data: Investigating temporal changes in self-regulated learning. Educ. Inf. Technol. 2020, 25, 1785–1802. [Google Scholar] [CrossRef]
- Giannakos, M.N.; Sharma, K.; Pappas, I.O.; Kostakos, V.; Velloso, E. Multimodal data as a means to understand the learning experience. Int. J. Inf. Manag. 2019, 48, 108–119. [Google Scholar] [CrossRef]
- Burnik, U.; Zaletelj, J.; Košir, A. Video-based learners’ observed attention estimates for lecture learning gain evaluation. Multimed. Tools Appl. 2018, 77, 16903–16926. [Google Scholar] [CrossRef]
- Spikol, D.; Ruffaldi, E.; Landolfi, L.; Cukurova, M. Estimation of Success in Collaborative Learning Based on Multimodal Learning Analytics Features. In Proceedings of the 2017 IEEE 17th International Conference on Advanced Learning Technologies (ICALT), Timisoara, Romania, 3–7 July 2017; pp. 269–273. [Google Scholar]
- Dich, Y.; Reilly, J.; Schneider, B. Using Physiological Synchrony as an Indicator of Collaboration Quality, Task Performance and Learning. In Artificial Intelligence in Education; Penstein Rosé, C., Martínez-Maldonado, R., Hoppe, H.U., Luckin, R., Mavrikis, M., Porayska-Pomsta, K., McLaren, B., du Boulay, B., Eds.; Lecture Notes in Computer Science; Springer International Publishing: Cham, Switzerland, 2018; Volume 10947, pp. 98–110. [Google Scholar]
- Gan, T.; Li, J.; Wong, Y.; Kankanhalli, M.S. A Multi-sensor Framework for Personal Presentation Analytics. ACM Trans. Multimed. Comput. Commun. Appl. 2019, 15, 1–21. [Google Scholar] [CrossRef]
- Di Mitri, D.; Schneider, J.; Specht, M.; Drachsler, H. Detecting Mistakes in CPR Training with Multimodal Data and Neural Networks. Sensors 2019, 19, 3099. [Google Scholar] [CrossRef] [PubMed]
- Nourbakhsh, N.; Chen, F.; Wang, Y.; Calvo, R.A. Detecting Users’ Cognitive Load by Galvanic Skin Response with Affective Interference. ACM Trans. Interact. Intell. Syst. 2017, 7, 12:1–12:20. [Google Scholar] [CrossRef]
- Kim, Y.; Butail, S.; Tscholl, M.; Liu, L.; Wang, Y. An exploratory approach to measuring collaborative engagement in child robot interaction. In Proceedings of the Tenth International Conference on Learning Analytics & Knowledge, Frankfurt, Germany, 23–27 March 2020; pp. 209–217. [Google Scholar]
- Reilly, J.M.; Ravenell, M.; Schneider, B. Exploring Collaboration Using Motion Sensors and Multi-Modal Learning Analytics. In Proceedings of the International Educational Data Mining (EDM), Raleigh, NC, USA, 16–20 July 2018; pp. 1–7. [Google Scholar]
- Malmberg, J.; Järvelä, S.; Holappa, J.; Haataja, E.; Huang, X.; Siipo, A. Going beyond what is visible: What multichannel data can reveal about interaction in the context of collaborative learning? Comput. Hum. Behav. 2019, 96, 235–245. [Google Scholar] [CrossRef]
- Hutt, S.; Mills, C.; Bosch, N.; Krasich, K.; Brockmole, J.; D’Mello, S. “Out of the Fr-Eye-ing Pan”: Towards Gaze-Based Models of Attention during Learning with Technology in the Classroom. In Proceedings of the 25th Conference on User Modeling, Adaptation and Personalization, Bratislava, Slovakia, 9–12 July 2017; pp. 94–103. [Google Scholar]
- Mu, S.; Cui, M.; Wang, X.J.; Qiao, J.X.; Tang, D.M. Learners’ attention preferences of information in online learning: An empirical study based on eye-tracking. Interact. Technol. Smart Educ. 2019, 16, 186–203. [Google Scholar] [CrossRef]
- Sharma, K.; Papamitsiou, Z.; Giannakos, M. Building pipelines for educational data using AI and multimodal analytics: A “grey-box” approach. Br. J. Educ. Technol. 2019, 50, 3004–3031. [Google Scholar] [CrossRef]
- Zheng, W.-L.; Liu, W.; Lu, Y.; Lu, B.-L.; Cichocki, A. EmotionMeter: A Multimodal Framework for Recognizing Human Emotions. IEEE Trans. Cybern. 2019, 49, 1110–1122. [Google Scholar] [CrossRef] [PubMed]
- Taub, M.; Mudrick, N.V.; Azevedo, R.; Millar, G.C.; Rowe, J.; Lester, J. Using multi-channel data with multi-level modeling to assess in-game performance during gameplay with Crystal Island. Comput. Hum. Behav. 2017, 76, 641–655. [Google Scholar] [CrossRef]
- Viswanathan, S.A.; Van Lehn, K. High Accuracy Detection of Collaboration from Log Data and Superficial Speech Features. In Proceedings of the 12th International Conference on Computer Supported Collaborative Learning (CSCL) 2017, Philadelphia, PA, USA, 18–22 June 2017; pp. 1–8. [Google Scholar]
- Vrzakova, H.; Amon, M.J.; Stewart, A.; Duran, N.D.; D’Mello, S.K. Focused or stuck together: Multimodal patterns reveal triads’ performance in collaborative problem solving. In Proceedings of the Tenth International Conference on Learning Analytics & Knowledge, Frankfurt, Germany, 23–27 March 2020; pp. 295–304. [Google Scholar]
- Romano, G.; Schneider, J.; Drachsler, H. Dancing Salsa with Machines—Filling the Gap of Dancing Learning Solutions. Sensors 2019, 19, 3661. [Google Scholar] [CrossRef] [PubMed]
- Andrade, A.; Danish, J.; Maltest, A. A Measurement Model of Gestures in an Embodied Learning Environment: Accounting for Temporal Dependencies. J. Learn. Anal. 2017, 4, 18–45. [Google Scholar] [CrossRef]
- Donnelly, P.J.; Blanchard, N.; Olney, A.M.; Kelly, S.; Nystrand, M.; D’Mello, S.K. Words matter: Automatic detection of teacher questions in live classroom discourse using linguistics, acoustics, and context. In Proceedings of the Seventh International Learning Analytics & Knowledge Conference, Vancouver, BC, Canada, 13–17 March 2017; pp. 218–227. [Google Scholar]
- Mudrick, N.V.; Azevedo, R.; Taub, M. Integrating metacognitive judgments and eye movements using sequential pattern mining to understand processes underlying multimedia learning. Comput. Hum. Behav. 2019, 96, 223–234. [Google Scholar] [CrossRef]
- Bosch, N.; Mills, C.; Wammes, J.D.; Smilek, D. Quantifying Classroom Instructor Dynamics with Computer Vision. In Proceedings of the Artificial Intelligence in Education; Penstein-Rosé, C., Martínez-Maldonado, R., Hoppe, H.U., Luckin, R., Mavrikis, M., Porayska-Pomsta, K., McLaren, B., du Boulay, B., Eds.; Springer International Publishing: Cham, Switzerland, 2018; pp. 30–42. [Google Scholar]
- Schneider, B. A Methodology for Capturing Joint Visual Attention Using Mobile Eye-Trackers. J. Vis. Exp. JoVE 2020. [Google Scholar] [CrossRef]
- Cukurova, M.; Kent, C.; Luckin, R. Artificial intelligence and multimodal data in the service of human decision-making: A case study in debate tutoring. Br. J. Educ. Technol. 2019, 50, 3032–3046. [Google Scholar] [CrossRef]
- Starr, E.L.; Reilly, J.M.; Schneider, B. Toward Using Multi-Modal Learning Analytics to Support and Measure Collaboration in Co-Located Dyads. In Proceedings of the 13th International Conference of the Learning Sciences (ICLS) 2018, London, UK, 23–27 June 2018; pp. 1–8. [Google Scholar]
- Vujovic, M.; Tassani, S.; Hernández-Leo, D. Motion Capture as an Instrument in Multimodal Collaborative Learning Analytics. In Proceedings of the Transforming Learning with Meaningful Technologies, Delft, The Netherlands, 16–19 September 2019; pp. 604–608. [Google Scholar]
- Cornide-Reyes, H.; Noël, R.; Riquelme, F.; Gajardo, M.; Cechinel, C.; Mac Lean, R.; Becerra, C.; Villarroel, R.; Munoz, R. Introducing Low-Cost Sensors into the Classroom Settings: Improving the Assessment in Agile Practices with Multimodal Learning Analytics. Sensors 2019, 19, 3291. [Google Scholar] [CrossRef]
- Riquelme, F.; Munoz, R.; Mac Lean, R.; Villarroel, R.; Barcelos, T.S.; de Albuquerque, V.H.C. Using multimodal learning analytics to study collaboration on discussion groups. Univers. Access Inf. Soc. 2019, 18, 633–643. [Google Scholar] [CrossRef]
- Sullivan, F.R.; Keith, P.K. Exploring the potential of natural language processing to support microgenetic analysis of collaborative learning discussions. Br. J. Educ. Technol. 2019, 50, 3047–3063. [Google Scholar] [CrossRef]
- Davidsen, J.; Ryberg, T. “This is the size of one meter”: Children’s bodily-material collaboration. Int. J. Comput.-Support. Collab. Learn. 2017, 12, 65–90. [Google Scholar] [CrossRef]
- Järvelä, S.; Malmberg, J.; Haataja, E.; Sobocinski, M.; Kirschner, P.A. What multimodal data can tell us about the students’ regulation of their learning process? Learn. Instr. 2019, 101203. [Google Scholar] [CrossRef]
- Limbu, B.H.; Jarodzka, H.; Klemke, R.; Specht, M. Can You Ink While You Blink? Assessing Mental Effort in a Sensor-Based Calligraphy Trainer. Sensors 2019, 19, 3244. [Google Scholar] [CrossRef] [PubMed]
- Worsley, M. (Dis)engagement matters: Identifying efficacious learning practices with multimodal learning analytics. In Proceedings of the 8th International Conference on Learning Analytics and Knowledge-LAK ’18, Sydney, Australia, 5–9 March 2018; pp. 365–369. [Google Scholar]
- Furuichi, K.; Worsley, M. Using Physiological Responses To Capture Unique Idea Creation In Team Collaborations. In Proceedings of the Companion of the 2018 ACM Conference on Computer Supported Cooperative Work and Social Computing (CSCW ’18), Jersey City, NJ, USA, 3–7 November 2018; pp. 369–372. [Google Scholar]
- Beardsley, M.; Hernández-Leo, D.; Ramirez-Melendez, R. Seeking reproducibility: Assessing a multimodal study of the testing effect. J. Comput. Assist. Learn. 2018, 34, 378–386. [Google Scholar] [CrossRef]
- Minematsu, T.; Tamura, K.; Shimada, A.; Konomi, S.; Taniguchi, R. Analytics of Reading Patterns Based on Eye Movements in an e-Learning System. In Proceedings of the Society for Information Technology & Teacher Education International Conference, Waynesville, NC, USA, 18 March 2019; pp. 1054–1059. [Google Scholar]
- Pham, P.; Wang, J. Understanding Emotional Responses to Mobile Video Advertisements via Physiological Signal Sensing and Facial Expression Analysis. In Proceedings of the 22nd International Conference on Intelligent User Interfaces, Limassol, Cyprus, 13–16 March 2017; pp. 67–78. [Google Scholar]
- Pham, P.; Wang, J. Predicting Learners’ Emotions in Mobile MOOC Learning via a Multimodal Intelligent Tutor. In Proceedings of the Intelligent Tutoring Systems; Nkambou, R., Azevedo, R., Vassileva, J., Eds.; Springer International Publishing: Cham, Switzerland, 2018; pp. 150–159. [Google Scholar]
- Amon, M.J.; Vrzakova, H.; D’Mello, S.K. Beyond Dyadic Coordination: Multimodal Behavioral Irregularity in Triads Predicts Facets of Collaborative Problem Solving. Cogn. Sci. 2019, 43, e12787. [Google Scholar] [CrossRef]
- Cukurova, M.; Kent, C.; Luckin, R. The Value of Multimodal Data in Classification of Social and Emotional Aspects of Tutoring. In Artificial Intelligence in Education; Isotani, S., Millán, E., Ogan, A., Hastings, P., McLaren, B., Luckin, R., Eds.; Lecture Notes in Computer Science; Springer International Publishing: Cham, Switzerland, 2019; Volume 11626, pp. 46–51. ISBN 978-3-030-23206-1. [Google Scholar]
- Worsley, M.; Blikstein, P. A Multimodal Analysis of Making. Int. J. Artif. Intell. Educ. 2018, 28, 385–419. [Google Scholar] [CrossRef]
- Prieto, L.P.; Sharma, K.; Kidzinski, Ł.; Rodríguez-Triana, M.J.; Dillenbourg, P. Multimodal teaching analytics: Automated extraction of orchestration graphs from wearable sensor data. J. Comput. Assist. Learn. 2018, 34, 193–203. [Google Scholar] [CrossRef]
- Prieto, L.P.; Sharma, K.; Kidzinski, Ł.; Dillenbourg, P. Orchestration Load Indicators and Patterns: In-the-Wild Studies Using Mobile Eye-Tracking. IEEE Trans. Learn. Technol. 2018, 11, 216–229. [Google Scholar] [CrossRef]
- Thomas, C.; Jayagopi, D.B. Predicting student engagement in classrooms using facial behavioral cues. In Proceedings of the 1st ACM SIGCHI International Workshop on Multimodal Interaction for Education, Glasgow, UK, 13 November 2017; pp. 33–40. [Google Scholar]
- Ashwin, T.S.; Guddeti, R.M.R. Unobtrusive Students’ Engagement Analysis in Computer Science Laboratory Using Deep Learning Techniques. In Proceedings of the 2018 IEEE 18th International Conference on Advanced Learning Technologies (ICALT), Mumbai, India, 9–13 July 2018; pp. 436–440. [Google Scholar]
- Sharma, K.; Papamitsiou, Z.; Olsen, J.K.; Giannakos, M. Predicting learners’ effortful behaviour in adaptive assessment using multimodal data. In Proceedings of the Tenth International Conference on Learning Analytics & Knowledge, Frankfurt, Germany, 23–27 March 2020; pp. 480–489. [Google Scholar]
- Viswanathan, S.A.; VanLehn, K. Using the Tablet Gestures and Speech of Pairs of Students to Classify Their Collaboration. IEEE Trans. Learn. Technol. 2018, 11, 230–242. [Google Scholar] [CrossRef]
- Grawemeyer, B.; Mavrikis, M.; Holmes, W.; Gutiérrez-Santos, S.; Wiedmann, M.; Rummel, N. Affective learning: Improving engagement and enhancing learning with affect-aware feedback. User Model. User-Adapt. Interact. 2017, 27, 119–158. [Google Scholar] [CrossRef]
- Alyuz, N.; Okur, E.; Genc, U.; Aslan, S.; Tanriover, C.; Esme, A.A. An unobtrusive and multimodal approach for behavioral engagement detection of students. In Proceedings of the 1st ACM SIGCHI International Workshop on Multimodal Interaction for Education, Glasgow, UK, 13 November 2017; pp. 26–32. [Google Scholar]
- Hanani, A.; Al-Amleh, M.; Bazbus, W.; Salameh, S. Automatic Estimation of Presentation Skills Using Speech, Slides and Gestures. In Proceedings of the Speech and Computer, Hatfield, UK, 12–16 September 2017; pp. 182–191. [Google Scholar]
- Fwa, H.L.; Marshall, L. Modeling engagement of programming students using unsupervised machine learning technique. GSTF J. Comput. 2018. [Google Scholar] [CrossRef]
- Larmuseau, C.; Cornelis, J.; Lancieri, L.; Desmet, P.; Depaepe, F. Multimodal learning analytics to investigate cognitive load during online problem solving. Br. J. Educ. Technol. 2020, 51, 1548–1562. [Google Scholar] [CrossRef]
- Min, W.; Park, K.; Wiggins, J.; Mott, B.; Wiebe, E.; Boyer, K.E.; Lester, J. Predicting Dialogue Breakdown in Conversational Pedagogical Agents with Multimodal LSTMs. In Artificial Intelligence in Education; Isotani, S., Millán, E., Ogan, A., Hastings, P., McLaren, B., Luckin, R., Eds.; Lecture Notes in Computer Science; Springer International Publishing: Cham, Switzerland, 2019; Volume 11626, pp. 195–200. [Google Scholar]
- Nihei, F.; Nakano, Y.I.; Takase, Y. Predicting meeting extracts in group discussions using multimodal convolutional neural networks. In Proceedings of the 19th ACM International Conference on Multimodal Interaction, Glasgow, UK, 13–17 November 2017; pp. 421–425. [Google Scholar]
- Kaur, A.; Mustafa, A.; Mehta, L.; Dhall, A. Prediction and Localization of Student Engagement in the Wild. In Proceedings of the 2018 Digital Image Computing: Techniques and Applications (DICTA), Canberra, Australia, 10–13 December 2018; pp. 1–8. [Google Scholar]
- Mihoub, A.; Lefebvre, G. Social Intelligence Modeling using Wearable Devices. In Proceedings of the 22nd International Conference on Intelligent User Interfaces, Limassol, Cyprus, 13–16 March 2017; pp. 331–341. [Google Scholar]
- Smith, C.; King, B.; Gonzalez, D. Using Multimodal Learning Analytics to Identify Patterns of Interactions in a Body-Based Mathematics Activity. J. Interact. Learn. Res. 2016, 27, 355–379. [Google Scholar]
- Schneider, J.; Börner, D.; van Rosmalen, P.; Specht, M. Presentation Trainer: What experts and computers can tell about your nonverbal communication. J. Comput. Assist. Learn. 2017, 33, 164–177. [Google Scholar] [CrossRef]
- Schneider, J.; Romano, G.; Drachsler, H. Beyond Reality—Extending a Presentation Trainer with an Immersive VR Module. Sensors 2019, 19, 3457. [Google Scholar] [CrossRef]
- Schneider, J.; Börner, D.; van Rosmalen, P.; Specht, M. Do You Know What Your Nonverbal Behavior Communicates?–Studying a Self-reflection Module for the Presentation Trainer. In Proceedings of the Immersive Learning Research Network, Coimbra, Portugal, 26–29 June 2017; pp. 93–106. [Google Scholar]
- Praharaj, S. Co-located Collaboration Analytics. In Proceedings of the 2019 International Conference on Multimodal Interaction, Suzhou, China, 14–18 October 2019; pp. 473–476. [Google Scholar]
- Praharaj, S.; Scheffel, M.; Drachsler, H.; Specht, M. MULTIFOCUS: MULTImodal Learning Analytics For Co-located Collaboration Understanding and Support. In Proceedings of the European Conference on Technology Enhanced Learning, Leeds, UK, 3–6 September 2018; pp. 1–6. [Google Scholar]
- Praharaj, S.; Scheffel, M.; Drachsler, H.; Specht, M. Group Coach for Co-located Collaboration. In Proceedings of the Transforming Learning with Meaningful Technologies, Delft, The Netherlands, 16–19 September 2019; pp. 732–736. [Google Scholar]
- Buckingham Shum, S.; Echeverria, V.; Martinez-Maldonado, R. The Multimodal Matrix as a Quantitative Ethnography Methodology. In Proceedings of the Advances in Quantitative Ethnography, Madison, WI, USA, 20–22 October 2019; pp. 26–40. [Google Scholar]
- Echeverria, V.; Martinez-Maldonado, R.; Buckingham Shum, S. Towards Collaboration Translucence: Giving Meaning to Multimodal Group Data. In Proceedings of the 2019 CHI Conference on Human Factors in Computing Systems (CHI ’19), Glasgow, Scotland, 4–9 May 2019; pp. 1–16. [Google Scholar]
- Martinez-Maldonado, R.; Elliott, D.; Axisa, C.; Power, T.; Echeverria, V.; Shum, S.B. Designing translucent learning analytics with teachers: An elicitation process. Interact. Learn. Environ. 2020, 36, 1–15. [Google Scholar] [CrossRef]
- Martinez-Maldonado, R.; Echeverria, V.; Elliott, D.; Axisa, C.; Power, T.; Shum, B. Making the Design of CSCL Analytics Interfaces a Co-design Process: The Case of Multimodal Teamwork in Healthcare. In Proceedings of the 13th International Conference on Computer Supported Collaborative Learning (CSCL) 2019, Lyon, France, 15–19 July 2019; pp. 859–860. [Google Scholar]
- Martinez-Maldonado, R.; Pechenizkiy, M.; Buckingham Shum, S.; Power, T.; Hayes, C.; Axisa, C. Modelling Embodied Mobility Teamwork Strategies in a Simulation-Based Healthcare Classroom. In Proceedings of the 25th Conference on User Modeling, Adaptation and Personalization, Bratislava, Slovakia, 9–12 July 2017; pp. 308–312. [Google Scholar]
- Martinez-Maldonado, R.; Power, T.; Hayes, C.; Abdiprano, A.; Vo, T.; Buckingham Shum, S. Analytics meet patient manikins: Challenges in an authentic small-group healthcare simulation classroom. In Proceedings of the Seventh International Learning Analytics & Knowledge Conference (LAK ’17), Vancouver, BC, Canada, 13–17 March 2017; pp. 90–94. [Google Scholar]
- Di Mitri, D. Multimodal Tutor for CPR. In Artificial Intelligence in Education; Penstein Rosé, C., Martínez-Maldonado, R., Hoppe, H.U., Luckin, R., Mavrikis, M., Porayska-Pomsta, K., McLaren, B., du Boulay, B., Eds.; Lecture Notes in Computer Science; Springer International Publishing: Cham, Switzerland, 2018; Volume 10948, pp. 513–516. ISBN 978-3-319-93845-5. [Google Scholar]
- Okada, M.; Kuroki, Y.; Tada, M. Multimodal analytics to understand self-regulation process of cognitive and behavioral strategies in real-world learning. IEICE Trans. Inf. Syst. 2020, E103D, 1039–1054. [Google Scholar] [CrossRef]
- Okada, M.; Kuroki, Y.; Tada, M. Multimodal Method to Understand Real-world Learning Driven by Internal Strategies; Association for the Advancement of Computing in Education (AACE): Waynesville, NC, USA, 2016; pp. 1248–1257. [Google Scholar]
- Chikersal, P.; Tomprou, M.; Kim, Y.J.; Woolley, A.W.; Dabbish, L. Deep Structures of Collaboration: Physiological Correlates of Collective Intelligence and Group Satisfaction. In Proceedings of the 2017 ACM Conference on Computer Supported Cooperative Work and Social Computing, Portland, OR, USA, 25 February–1 March 2017; pp. 873–888. [Google Scholar]
- Van Ginkel, S.; Gulikers, J.; Biemans, H.; Noroozi, O.; Roozen, M.; Bos, T.; van Tilborg, R.; van Halteren, M.; Mulder, M. Fostering oral presentation competence through a virtual reality-based task for delivering feedback. Comput. Educ. 2019, 134, 78–97. [Google Scholar] [CrossRef]
- Tamura, K.; Lu, M.; Konomi, S.; Hatano, K.; Inaba, M.; Oi, M.; Okamoto, T.; Okubo, F.; Shimada, A.; Wang, J.; et al. Integrating Multimodal Learning Analytics and Inclusive Learning Support Systems for People of All Ages. In Proceedings of the Cross-Cultural Design. Culture and Society, Orlando, FL, USA, 26–31 July 2019; pp. 469–481. [Google Scholar]
- Dias Pereira dos Santos, A.; Yacef, K.; Martinez-Maldonado, R. Let’s Dance: How to Build a User Model for Dance Students Using Wearable Technology. In Proceedings of the 25th Conference on User Modeling, Adaptation and Personalization, Bratislava, Slovakia, 9–12 July 2017; pp. 183–191. [Google Scholar]
- Prieto-Alvarez, C.G.; Martinez-Maldonado, R.; Shum, S.B. Mapping learner-data journeys: Evolution of a visual co-design tool. In Proceedings of the 30th Australian Conference on Computer-Human Interaction, Melbourne, Australia, 4–7 December 2018; pp. 205–214. [Google Scholar]
- Sharma, K.; Papamitsiou, Z.; Giannakos, M.N. Modelling Learners’ Behaviour: A Novel Approach Using GARCH with Multimodal Data. In Proceedings of the Transforming Learning with Meaningful Technologies, Delft, The Netherlands, 16–19 September 2019; pp. 450–465. [Google Scholar]
- Ochoa, X.; Chiluiza, K.; Granda, R.; Falcones, G.; Castells, J.; Guamán, B. Multimodal Transcript of Face-to-Face Group-Work Activity Around Interactive Tabletops. In Proceedings of the CrossMMLA@ LAK, Sydney, Australia, 5–9 March 2018; pp. 1–6. [Google Scholar]
- Ochoa, X.; Domínguez, F.; Guamán, B.; Maya, R.; Falcones, G.; Castells, J. The RAP system: Automatic feedback of oral presentation skills using multimodal analysis and low-cost sensors. In Proceedings of the 8th International Conference on Learning Analytics and Knowledge-LAK ’18, Sydney, Australia, 5–9 March 2018; pp. 360–364. [Google Scholar]
- Roque, F.; Cechinel, C.; Weber, T.O.; Lemos, R.; Villarroel, R.; Miranda, D.; Munoz, R. Using Depth Cameras to Detect Patterns in Oral Presentations: A Case Study Comparing Two Generations of Computer Engineering Students. Sensors 2019, 19, 3493. [Google Scholar] [CrossRef]
- Huang, K.; Bryant, T.; Schneider, B. Identifying Collaborative Learning States Using Unsupervised Machine Learning on Eye-Tracking, Physiological and Motion Sensor Data. In Proceedings of the 12th International Conference on Educational Data Mining (EDM), Montreal, QC, Canada, 2–5 July 2019. [Google Scholar]
- Reilly, J.M.; Schneider, B. Predicting the Quality of Collaborative Problem Solving through Linguistic Analysis of Discourse; International Educational Data Mining Society: Montreal, QC, Canada, 2019; pp. 149–157. [Google Scholar]
- Schneider, B. Unpacking Collaborative Learning Processes During Hands-on Activities Using Mobile Eye-Trackers. In Proceedings of the 13th International Conference on Computer Supported Collaborative Learning (CSCL) 2019, Lyon, France, 17–21 June 2019; pp. 70–79. [Google Scholar]
- Schneider, B.; Dich, Y.; Radu, I. Unpacking the relationship between existing and new measures of physiological synchrony and collaborative learning: A mixed methods study. Int. J. Comput. Support. Collab. Learn. 2020, 15, 89–113. [Google Scholar] [CrossRef]
- Andrade, A. Understanding student learning trajectories using multimodal learning analytics within an embodied-interaction learning environment. In Proceedings of the Seventh International Learning Analytics & Knowledge Conference (LAK ’17), Vancouver, BC, Canada, 13–17 March 2017; pp. 70–79. [Google Scholar]
- Limbu, B.; Schneider, J.; Klemke, R.; Specht, M. Augmentation of practice with expert performance data: Presenting a calligraphy use case. In Proceedings of the 3rd International Conference on Smart Learning Ecosystem and Regional Development—The Interplay of Data, Technology, Place and People, Aalborg, Denmark, 22–24 May 2018; pp. 23–25. [Google Scholar]
- Larmuseau, C.; Vanneste, P.; Cornelis, J.; Desmet, P.; Depaepe, F. Combining physiological data and subjective measurements to investigate cognitive load during complex learning. Frontline Learn. Res. 2019, 7, 57–74. [Google Scholar] [CrossRef]
- Hassib, M.; Khamis, M.; Friedl, S.; Schneegass, S.; Alt, F. Brainatwork: Logging cognitive engagement and tasks in the workplace using electroencephalography. In Proceedings of the 16th International Conference on Mobile and Ubiquitous Multimedia, Stuttgart, Germany, 26–29 November 2017; pp. 305–310. [Google Scholar]
- Olsen, J.; Sharma, K.; Aleven, V.; Rummel, N. Combining Gaze, Dialogue, and Action from a Collaborative Intelligent Tutoring System to Inform Student Learning Processes. In Proceedings of the 13th International Conference of the Learning Sciences (ICLS) 2018, London, UK, 23–27 June 2018; pp. 689–696. [Google Scholar]
- Zhu, G.; Xing, W.; Costa, S.; Scardamalia, M.; Pei, B. Exploring emotional and cognitive dynamics of Knowledge Building in grades 1 and 2. User Model. User Adapt. Interact. 2019, 29, 789–820. [Google Scholar] [CrossRef]
- Maurer, B.; Krischkowsky, A.; Tscheligi, M. Exploring Gaze and Hand Gestures for Non-Verbal In-Game Communication. In Proceedings of the Extended Abstracts Publication of the Annual Symposium on Computer-Human Interaction in Play, Amsterdam, The Netherlands, 15–18 October 2017; pp. 315–322. [Google Scholar]
- Srivastava, N. Using contactless sensors to estimate learning difficulty in digital learning environments. UbiCompISWC 19 2019. [Google Scholar] [CrossRef]
- Sharma, K.; Leftheriotis, I.; Giannakos, M. Utilizing Interactive Surfaces to Enhance Learning, Collaboration and Engagement: Insights from Learners’ Gaze and Speech. Sensors 2020, 20, 1964. [Google Scholar] [CrossRef] [PubMed]
- Howard, S.K.; Thompson, K.; Yang, J.; Ma, J.; Pardo, A.; Kanasa, H. Capturing and Visualizing: Classroom Analytics for Physical and Digital Collaborative Learning Processes. Proceeding of the 12th International Conference on Computer Supported Collaborative Learning, Philadelphia, PA, USA, 18–22 June 2017; pp. 801–802. [Google Scholar]
- Muñoz-Soto, R.; Villarroel, R.; Barcelos, T.; de Souza, A.A.; Merino, E.; Guiñez, R.; Silva, L.A. Development of a Software that Supports Multimodal Learning Analytics: A Case Study on Oral Presentations. J. Univers Comput. Sci. 2018, 24, 149–170. [Google Scholar]


| Inclusion Criteria | Exclusion Criteria |
|---|---|
| The following search keywords are included in the title, abstract, or keywords |
|
|
|
|
|
|
|
|
| Scoring Rules | Score | RQ | |||
|---|---|---|---|---|---|
| Title and Abstract | The topic has nothing with MMLA | (Score = 0) | |||
| The topic has a little with MMLA | (Score = 1~2) | ||||
| MMLA | (Score = 3~6) | Q1 & Q2 & Q3 | |||
| Full-text | 3.1 Only mentioned MMLA | (Score = 3) | Q1 | ||
| 3.2 Non-empirical study on MMLA, such as its review and theory | (Score = 4) | Q1 | |||
| 3.3 An empirical study on MMLA | (Score = 5~6) | Q2 | |||
| Without Data Fusion | (Score = 5) | ||||
| With Data Fusion | (Score = 6) | Q3 | |||
| Type | Multimodal Data and Code | Case Studies | Author |
|---|---|---|---|
| Digital space | |||
| Clickstream | Log data LOG | Log data as a proxy measure of student engagement | [36] |
| Interactions in STEAM by a physical computing platform | [37] | ||
| Mouse MO | Behavioral engagement detection of students | [38] | |
| Keystrokes KS | Surrogate measure for the effort put in by the student | [39] | |
| Qualitative data | Text TE | Learners’ emotions from pedagogical texts | [40] |
| Handwriting Dynamic Handwriting Signal Features HW | Dynamic handwriting signal to predict domain expertise | [41] | |
| A sensitive measure of handwriting performance | [42] | ||
| Digital footnote DF | Analyzing students’ reviewing behavior | [43,44] | |
| Physical space | |||
| Eye | Eye movement EM | Students/teacher co-attention (i.e., with-me-ness) | [45] |
| Improving communication between pair programmers | [46] | ||
| Eye Contact EC | Joint Visual Attention | [47] | |
| Eye contact in three-party conversations | [48] | ||
| Mouth | Audio AU | Exploring collaborative writing of user stories | [49] |
| Think-aloud protocols used in cognitive and metacognitive activities | [50] | ||
| Face | Facial Expression FE | Investigating emotional variation during interaction | [51] |
| Automated detection of engagement | [52] | ||
| Facial Region FR | behaviors of lecturers and students | [53] | |
| Student behavior monitoring systems | [54] | ||
| facial temperature FT | Assess the effect of different levels of cognitive load on facial temperature | [55] | |
| Head | Head Region HER | behavioral engagement detection of students | [38] |
| Modeling collaborative problem-solving competence | [56] | ||
| Hand | Hand HA | data glove which captures pressure sensitivity designed to provide feedback for palpation tasks | [57] |
| Using hand motion to understand embodied mathematical learning | [58] | ||
| Arms | Arms AR | Dynamic adaptive gesturing predicts domain expertise in mathematics | [59] |
| Embodied learning behavior in the mathematics curriculum | [60] | ||
| Leg | step count SC | Step counts are used to predicting learning performance in ubiquitous learning | [61] |
| Body | Body posture BL | Enhancing multimodal learning through personalized gesture recognition | [62] |
| Embodied strategies in the teaching and learning of science | [63] | ||
| Body Movement and Location MP | Making spatial pedagogy visible using positioning sensors | [64] | |
| Tracing students’ physical movement during practice-based learning | [65] | ||
| Orientation OR | Aggregating positioning and orientation in the visualization of classroom proxemics | [66] | |
| Physiological space | |||
| Brain | Electroencephalogram EEG | Detecting cognitive load using EEG during learning | [67] |
| Multimodal emotion recognition | [68] | ||
| Skin | electrodermal activity EDA | Profiling sympathetic arousal in a physics course | [69] |
| galvanic skin response GSR | The difficulty of learning materials | [70] | |
| skin temperature ST | Recognition of emotions | [71] | |
| Heart | Electrocardiogram ECG | EDA and ECG study of pair-programming in a classroom environment | [72] |
| Multimodal emotion recognition | [68] | ||
| Photoplethysmography PPG | Recognition of emotions | [73] | |
| heart rate /variability HR/HRV | Automated detection of engagement | [52] | |
| Blood | blood volume pulse BVP | Recognition of emotions | [71] |
| Lung | Breathe respiration BR | Recognition of emotions | [71] |
| Psychometric space | |||
| Motivation PS | Motivation coming from the questionnaire | [45] | |
| Environmental space | |||
| Weather condition WC | Predicting performance in self-regulated learning using multimodal data, such as (1) Temperature, (2) Pressure, (3) Precipitation, (4) Weather type | [61] | |
| Score | Num. of Articles | Percentage | Remarks |
|---|---|---|---|
| 3 | 47 | 3.36% | Only Mention MMLA |
| 4 | 110 | 35.26% | Non-empirical study on MMLA |
| 5 | 77 | 24.68% | An empirical study on MMLA BUT without Data Fusion |
| 6 | 112 | 37.90% | An empirical study on MMLA AND Data Fusion |
| Learning Indicator | Behavior | Attention | Cognition Metacognition | Emotion | Collaboration | Engagement | Learning Performance | |
|---|---|---|---|---|---|---|---|---|
| Multimodal Data | ||||||||
| Digital space | [41] [43,44] | [112] | [40] | [95] [113] | [36] [38] [39] | [61] [98] [114] [37] [41] | ||
| Physical space | [53] [115] [116] [92] [42] [62] [63] [103] [117] [53] [64] | [93] [118] [108] [119] [82] [45] [120] | [84] [112] [50] [90] | [73] [111] [121] [51] [79] [68] | [122] [47] [48] [123] [49] [124] [125] [126] [91] [127] [107] [65] [128] [95] [113] [46] | [52] [110] [38] [129] [130] [83] [38] [60] | [70] [98] [37] [98] [114] [37] [59] [61] | |
| Physiological space | [67] [69] [131] [89] | [111] [68] [71] [73] [68] | [72] [107] [128] [122] [131] [72] | [52] [110] [130] | [132] [98] [70] [61] | |||
| Physiological space | [99] [70] | [89] | [121] [79] | [70] [129] [52] | [61] | |||
| Integration Methods | Data Type | Learning Indicators | Author |
|---|---|---|---|
| Many-to-One | FE, PPG | Emotion | [73,134,135] |
| AU, FA, LOG, HA | Learning performance | [37,86,100] | |
| LOG, AU, BL, SR | Collaboration | [114,136] | |
| PS, AU | Emotion | [121,137] | |
| AU, FE, BL, EDA, VO | Collaboration, engagement, learning performance | [78,130,138] | |
| EM, AU, VB, MP | Teaching behavior | [139,140] | |
| FE, HER, EM | Engagement | [83,141] | |
| FR, HER, BL | Engagement | [99,142] | |
| AR, HER, FR | Collaboration | [56,76,91] | |
| FE, EM, EEG, EDA, BVP, HR, TEMP | Engagement | [110,143] | |
| AU, LOG | Collaboration | [113,144] | |
| AU, LOG | Emotion | [145] | |
| AU, VB | Engagement | [105] | |
| FR, MO, LOG | Engagement | [146] | |
| FE, HR, LBP-TOP | Engagement | [52] | |
| AU, LOG, BL | Oral presentations | [147] | |
| PS, AU, FE | Emotion | [79] | |
| EM, EEG | Emotion | [111] | |
| AU, FE, ECG, EDA | Emotion | [68] | |
| VB, LOG | Cognition | [74] | |
| FE, HER, LOG | Engagement | [96] | |
| SC, LOG, HR, EN | Learning performance | [61] | |
| HER, LOG | Engagement | [148] | |
| PE, PS, AU, FE, BL, EM, EEG, BVP, GSA | Learning performance | [98] | |
| GSR, ST, HR, HRV, PD | Cognitive load | [149] | |
| AU, EM, LOG | Dialogue failure in human-computer interaction | [150] | |
| AU, HAR, FR | Collaboration | [151] | |
| HAR, EC, FR | Engagement | [152] | |
| BL, MP, LOG | Attention | [119] | |
| AU, FE, EM, LOG | Collaboration | [95] | |
| EEG, EOG, ST, GSR, BVP | Emotion | [71] | |
| AU, EC, AR, MP | Oral presentations | [153] | |
| AU, BL, LOG | Embodied learning behavior | [154] | |
| Many-to-Many | FE, BL, AU, EC | Oral presentations | [155,156,157] |
| BL, AU | Collaboration | [81,158,159,160] | |
| MP, AU, LOG, EDA, PS | Medical operation skills | [80,161,162,163,164,165,166] | |
| BL, EMG, LOG | Medical operation skills | [103,167] | |
| AU, EM, MP, BL | Embodied learning behavior | [168,169] | |
| FA, EC, MP | Face-to-face classroom | [54] | |
| AU, HER, HA, AR, MP | Oral presentations | [102] | |
| FE, HER, AR, LE, MP | Dancing skills | [115] | |
| FA, EDA, HR | - | [170] | |
| AU, MP, BL, LOG | Oral presentations | [171] | |
| EM, EEG | Attention, cognition | [172] | |
| - | Dancing skills | [173] | |
| AU, BL, MP, LOG | - | [174] | |
| EM, EEG | Adaptive self-assessment activity | [175] | |
| AU, VB, LOG | - | [176] | |
| EM, LOG | Open-ended learning environments | [94] | |
| BL, EC, AU, LOG | Oral presentations | [177] | |
| MP, FE, AU | Oral presentations | [178] | |
| Mutual Verification between multimodal data | VO, FE, EDA | Collaboration, emotion | [107,128] |
| BL,EDA,EM,AU, BVP, IBI, EDA,HR | Collaboration | [101,106,122,179,180,181,182] | |
| LOG, SR, AU | Online learning | [3,22] | |
| FR, EC | Embodied learning behavior | [116,183] | |
| PS, EM, LOG | Calligraphy training | [129,184] | |
| PS, GSR, ST, LOG | Online learning problem solving | [89,185] | |
| BL, MP, AU | Collaboration | [127] | |
| HER, AR | Language learning | [92] | |
| EDA, ECG | Collaboration | [72] | |
| EEG, LOG | Cognition | [186] | |
| - | Collaboration | [187] | |
| MP, OR | Teaching behavior | [66] | |
| VB, ONLINE | Emotion | [188] | |
| EM, BL | Collaboration | [189] | |
| EDA, PS | - | [97] | |
| EC, MP | Collaboration | [123] | |
| FE, EM, GSR | Learning performance | [70] | |
| EM, FA, LOG | Learning difficulties | [190] | |
| EM, LOG | Cognition | [112] | |
| EM, AU, LOG | Engagement, collaboration, learning performance | [191] |
Publisher’s Note: MDPI stays neutral with regard to jurisdictional claims in published maps and institutional affiliations. |
© 2020 by the authors. Licensee MDPI, Basel, Switzerland. This article is an open access article distributed under the terms and conditions of the Creative Commons Attribution (CC BY) license (http://creativecommons.org/licenses/by/4.0/).
Share and Cite
Mu, S.; Cui, M.; Huang, X. Multimodal Data Fusion in Learning Analytics: A Systematic Review. Sensors 2020, 20, 6856. https://doi.org/10.3390/s20236856
Mu S, Cui M, Huang X. Multimodal Data Fusion in Learning Analytics: A Systematic Review. Sensors. 2020; 20(23):6856. https://doi.org/10.3390/s20236856
Chicago/Turabian StyleMu, Su, Meng Cui, and Xiaodi Huang. 2020. "Multimodal Data Fusion in Learning Analytics: A Systematic Review" Sensors 20, no. 23: 6856. https://doi.org/10.3390/s20236856
APA StyleMu, S., Cui, M., & Huang, X. (2020). Multimodal Data Fusion in Learning Analytics: A Systematic Review. Sensors, 20(23), 6856. https://doi.org/10.3390/s20236856