AC/DC Current Sensor for Rotating Applications

 ,
,  ,
,  and
and
Abstract
1. Introduction
- Ohm’s law;
- Faraday’s law;
- Magnetic field sensors;
- Faraday effect.
- Static excitation system:This type of excitation system has no rotating component. It comprises a controlled rectifier to produce the DC excitation current for the field winding of the synchronous machine. The rectified voltage feeds, through slip rings, the field winding. The power supply of this controlled rectifier normally comes from a transformer fed from the synchronous generator terminals.
- Brushless excitation system:This excitation system has some rotating components, installed in the rotor of the SG. It comprises an auxiliary synchronous generator (ASG), normally known as exciter, and a rotating diodes bridge. The exciter has its field winding in its stator and its armature winding in its rotor. It is placed in the same shaft and rotates at the same speed of the main SG. The voltage that appears in the ASG armature winding is rectified by the rotating diode bridge and feeds the field winding of the main SG. As both machines rotate at the same speed, the connection between them, that feeds the rectified armature current of the ASG to the field winding of the main SG, does not have slip rings. It is brushless. The number of pair poles of the exciter is normally greater than the main synchronous machine. Therefore, its rated frequency is greater as well. This is normally done to reduce the ripple of the field current supplied.
2. Materials and Methods
3. Results
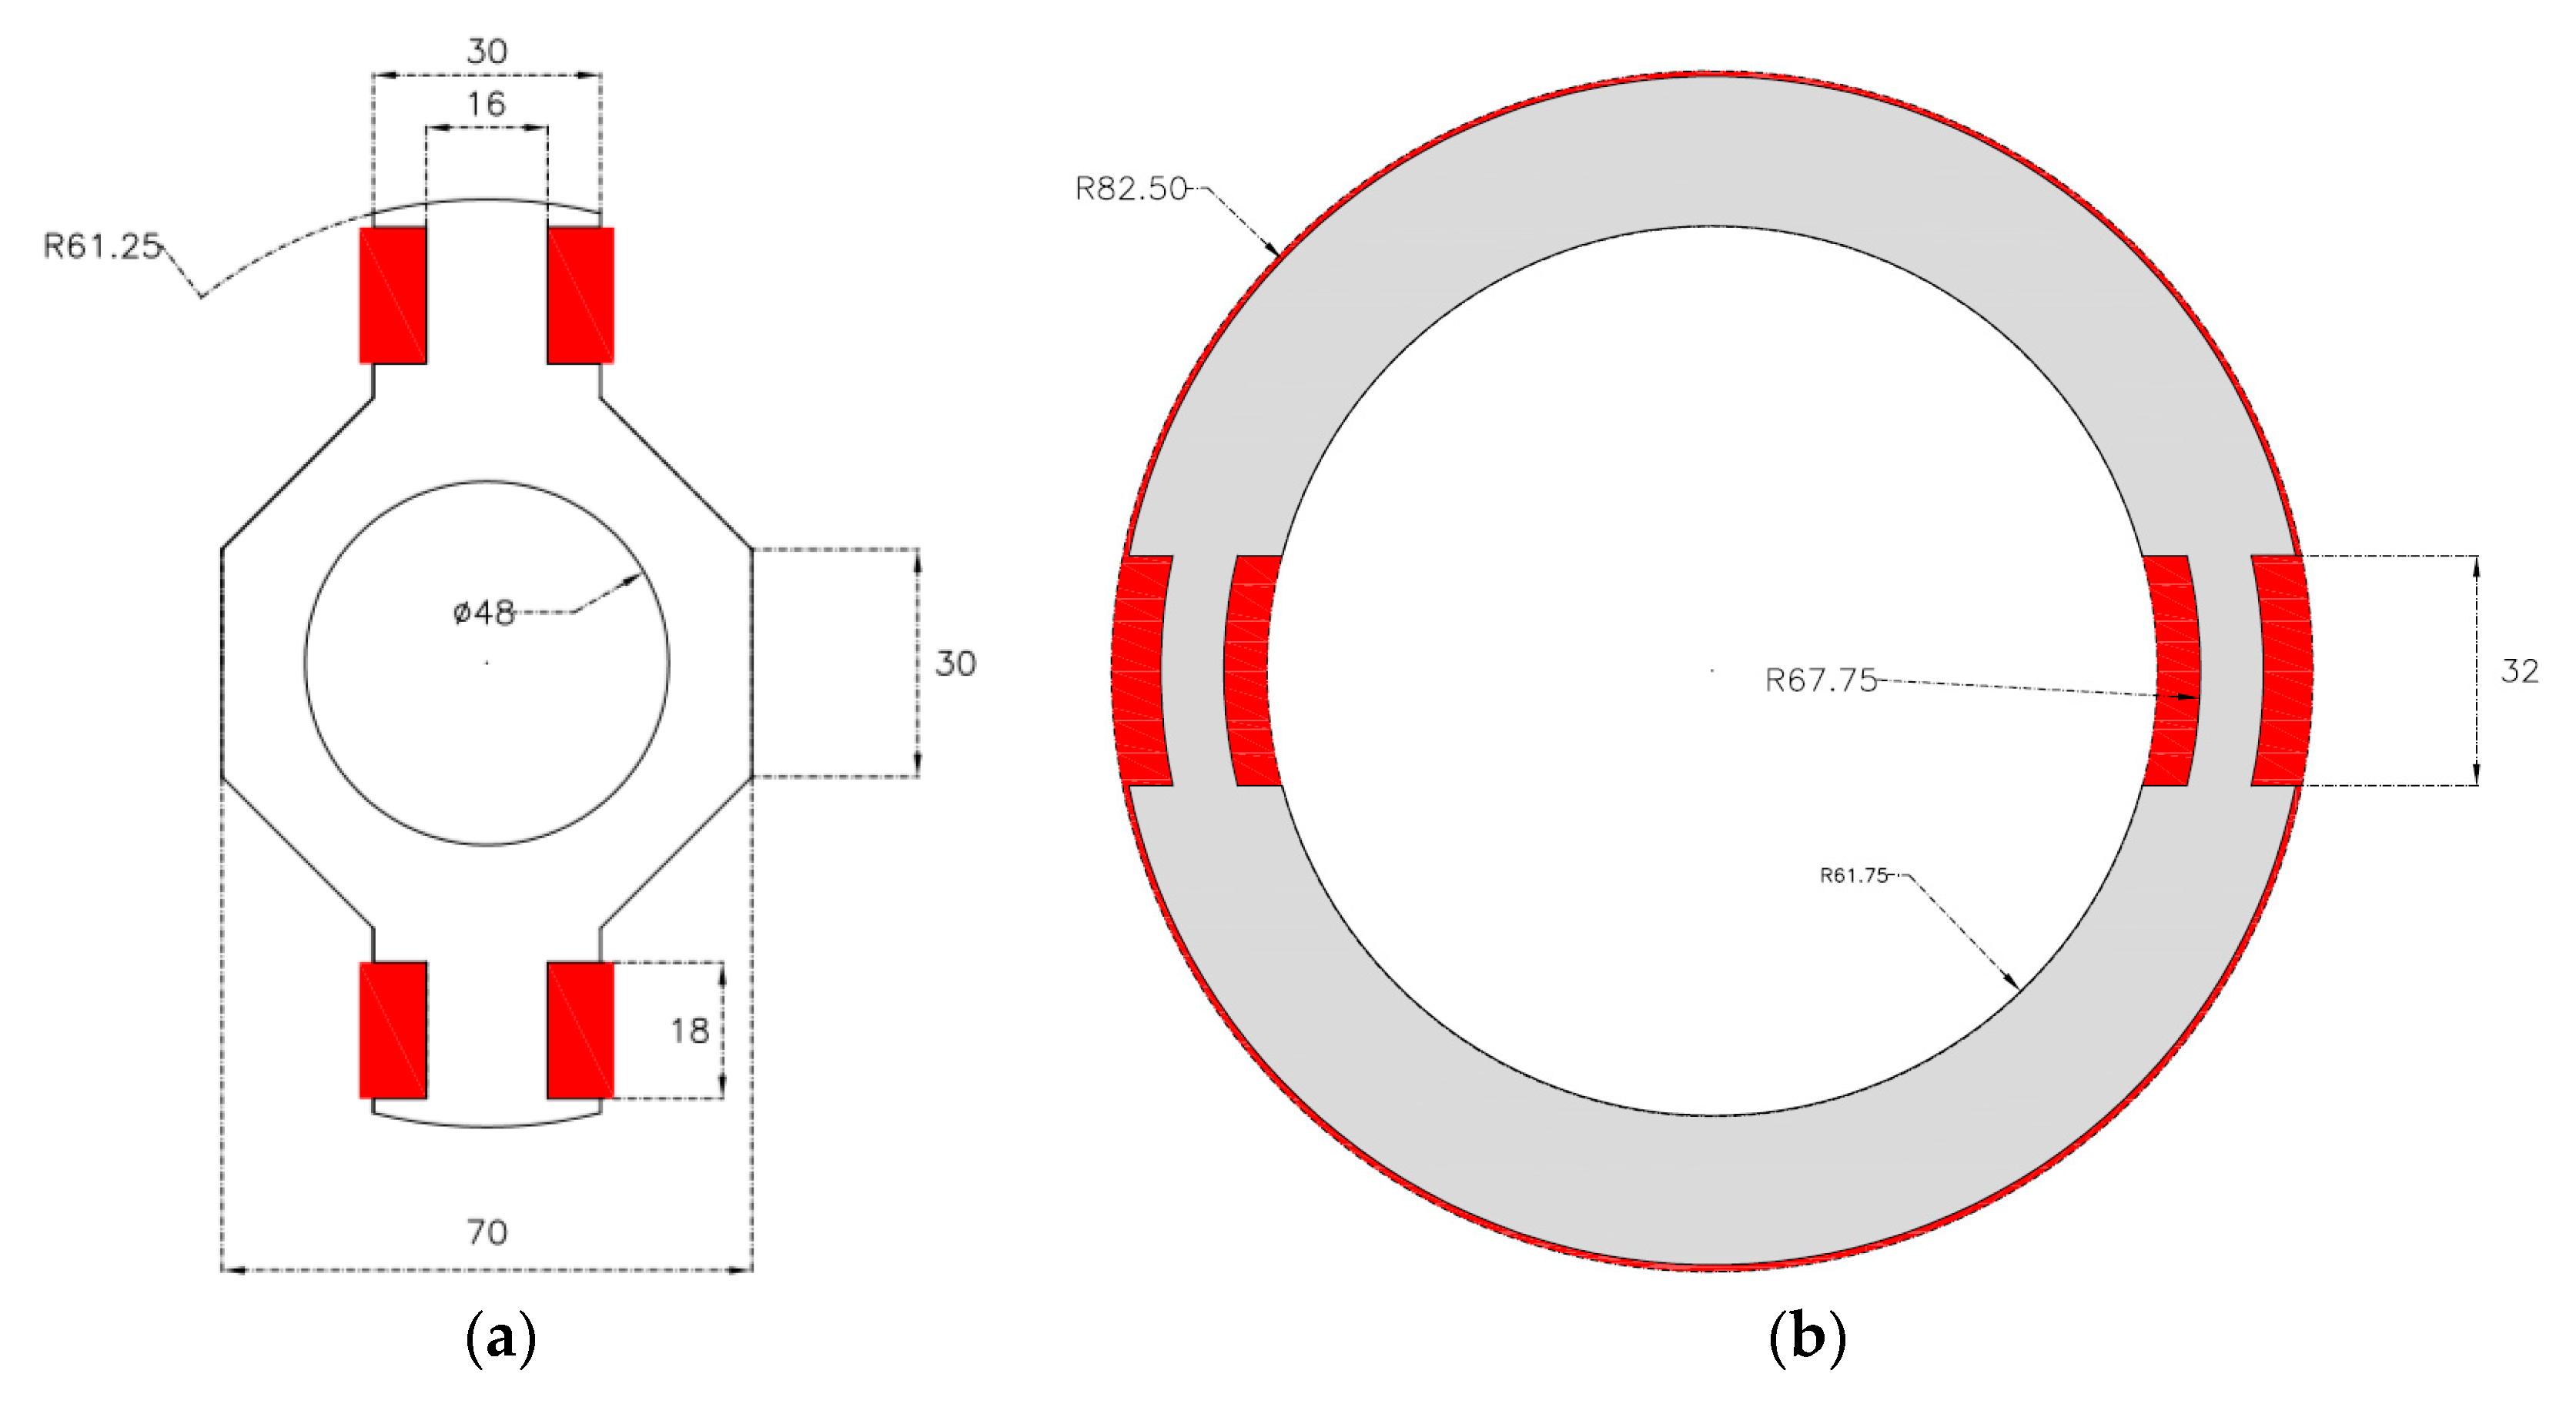
3.1. FEM Simulations
- : Current flowing through rotor winding;
- : Direct current;
- : Alternating current;
- : frequency;
- : time.
3.1.1. Simulations with DC Current
Sensor Saturation
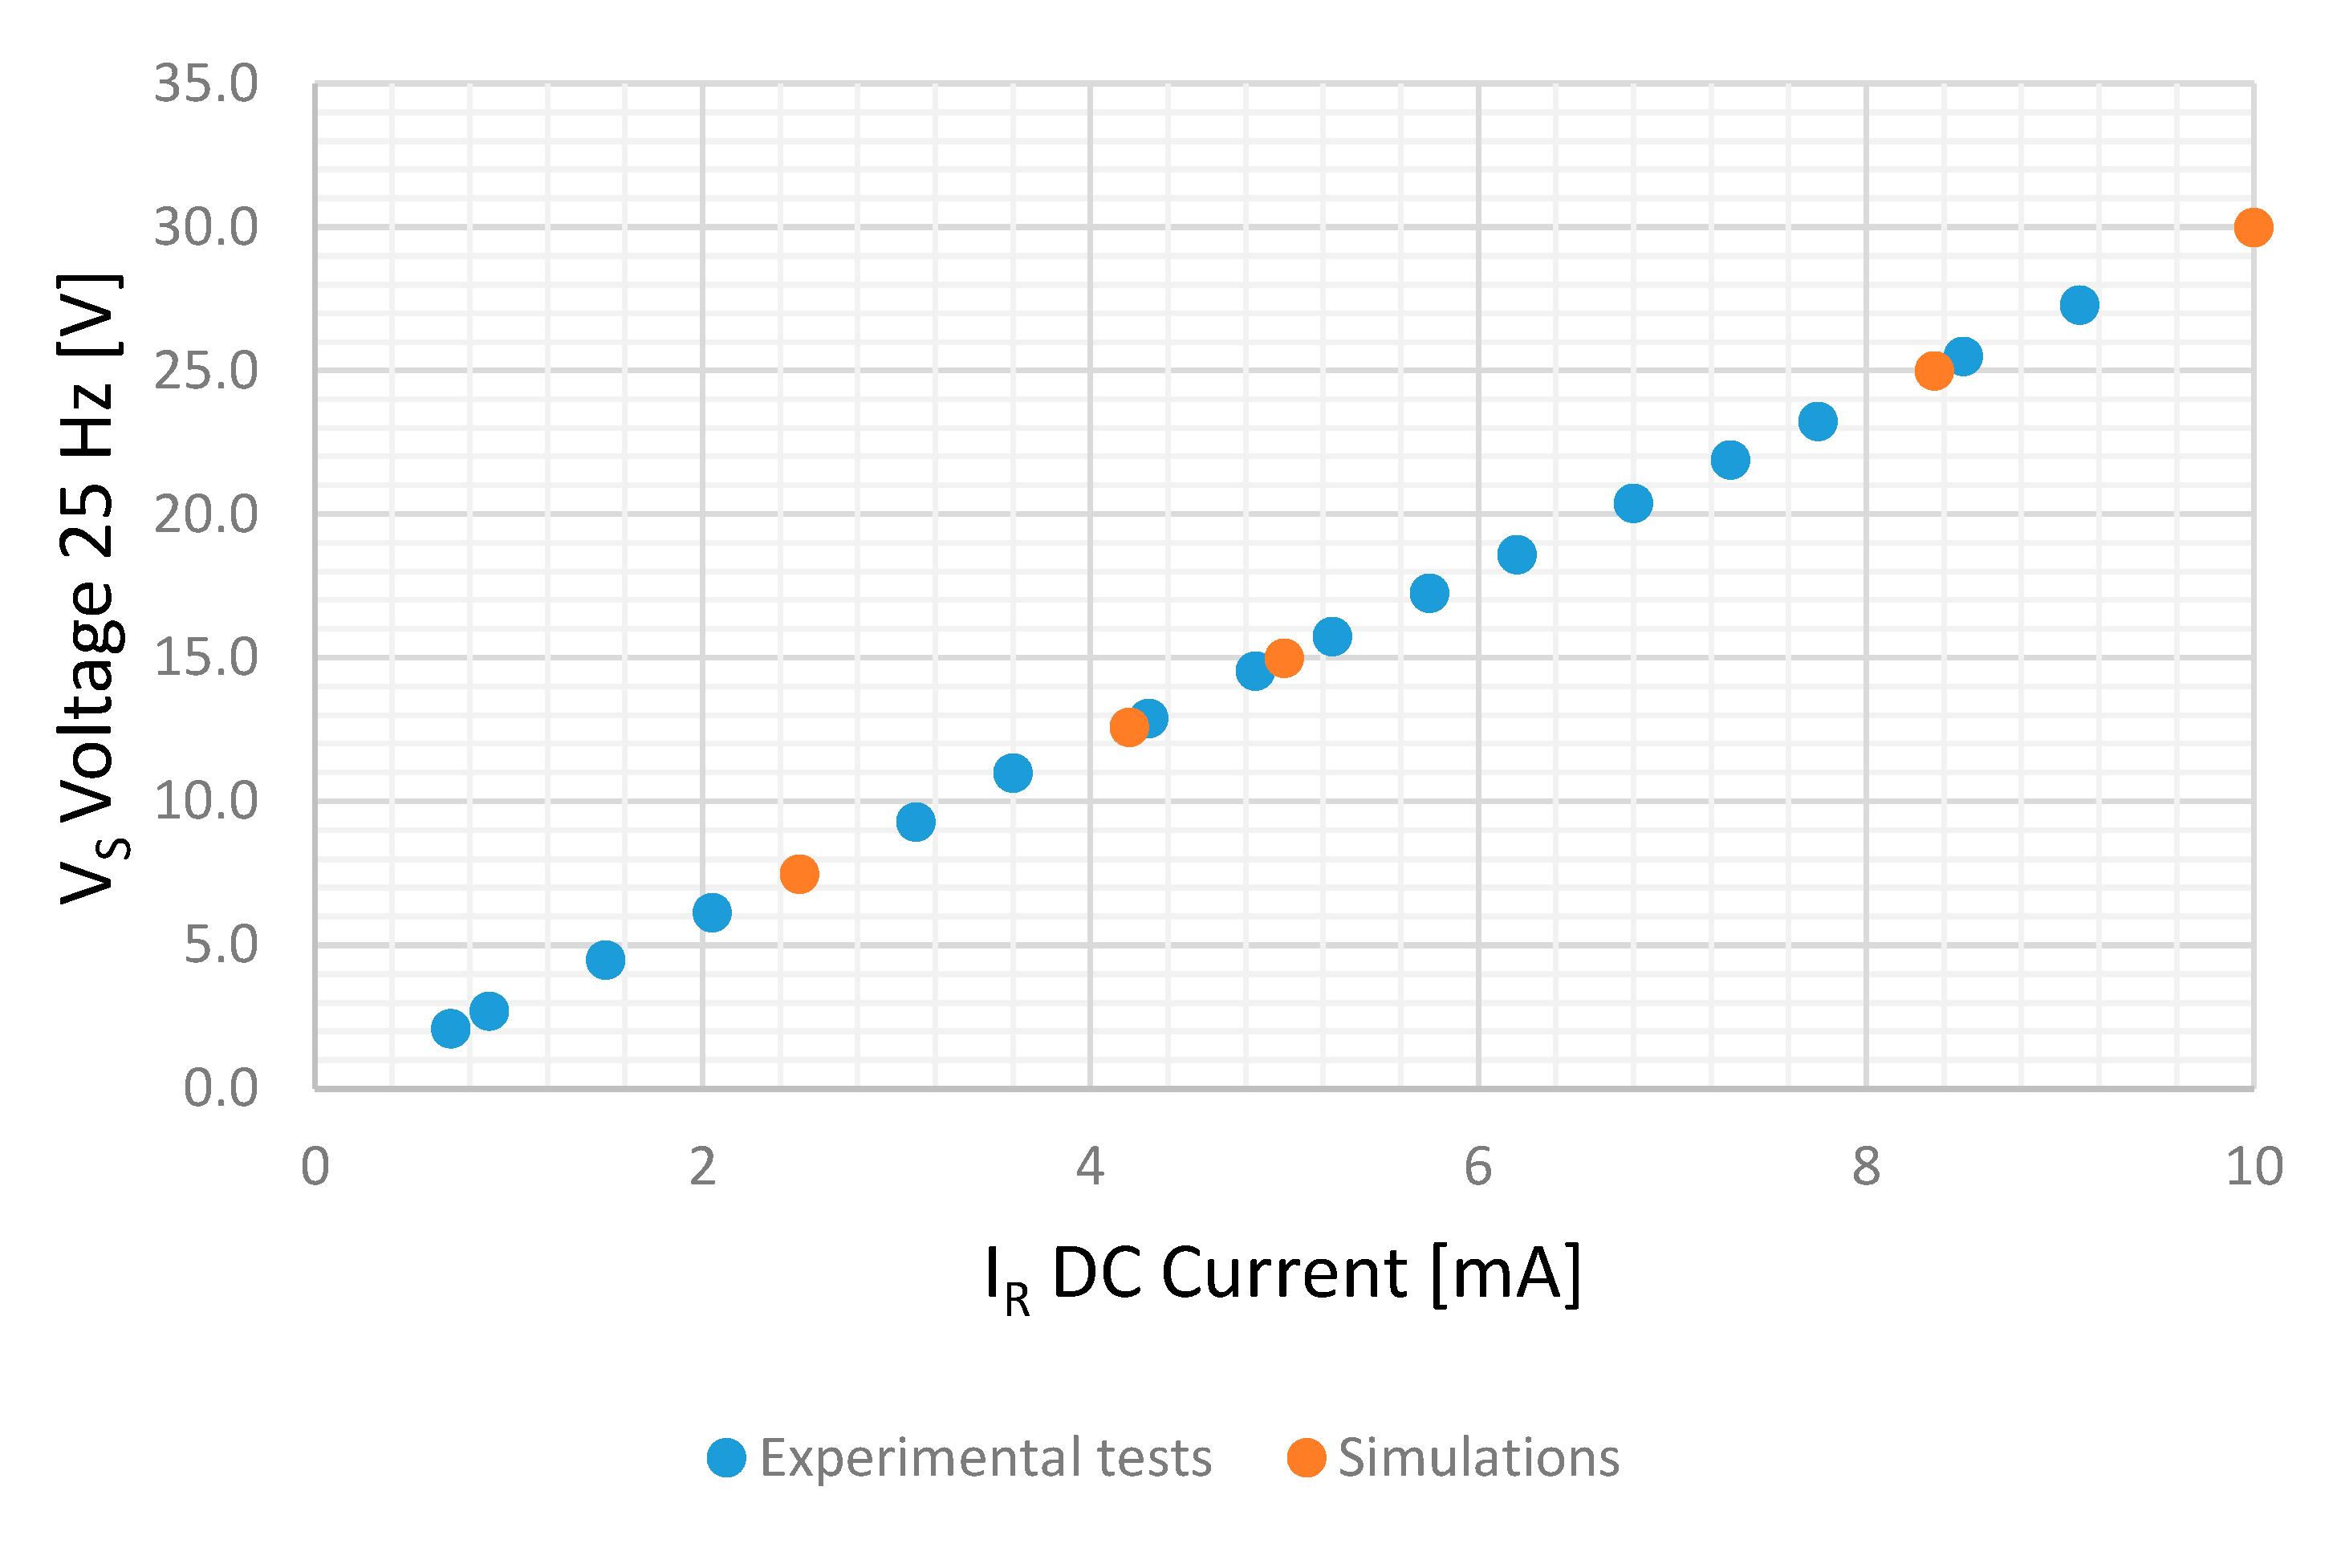
Stator-Induced Voltage
3.1.2. Simulations with AC Currents
Sensor Saturation
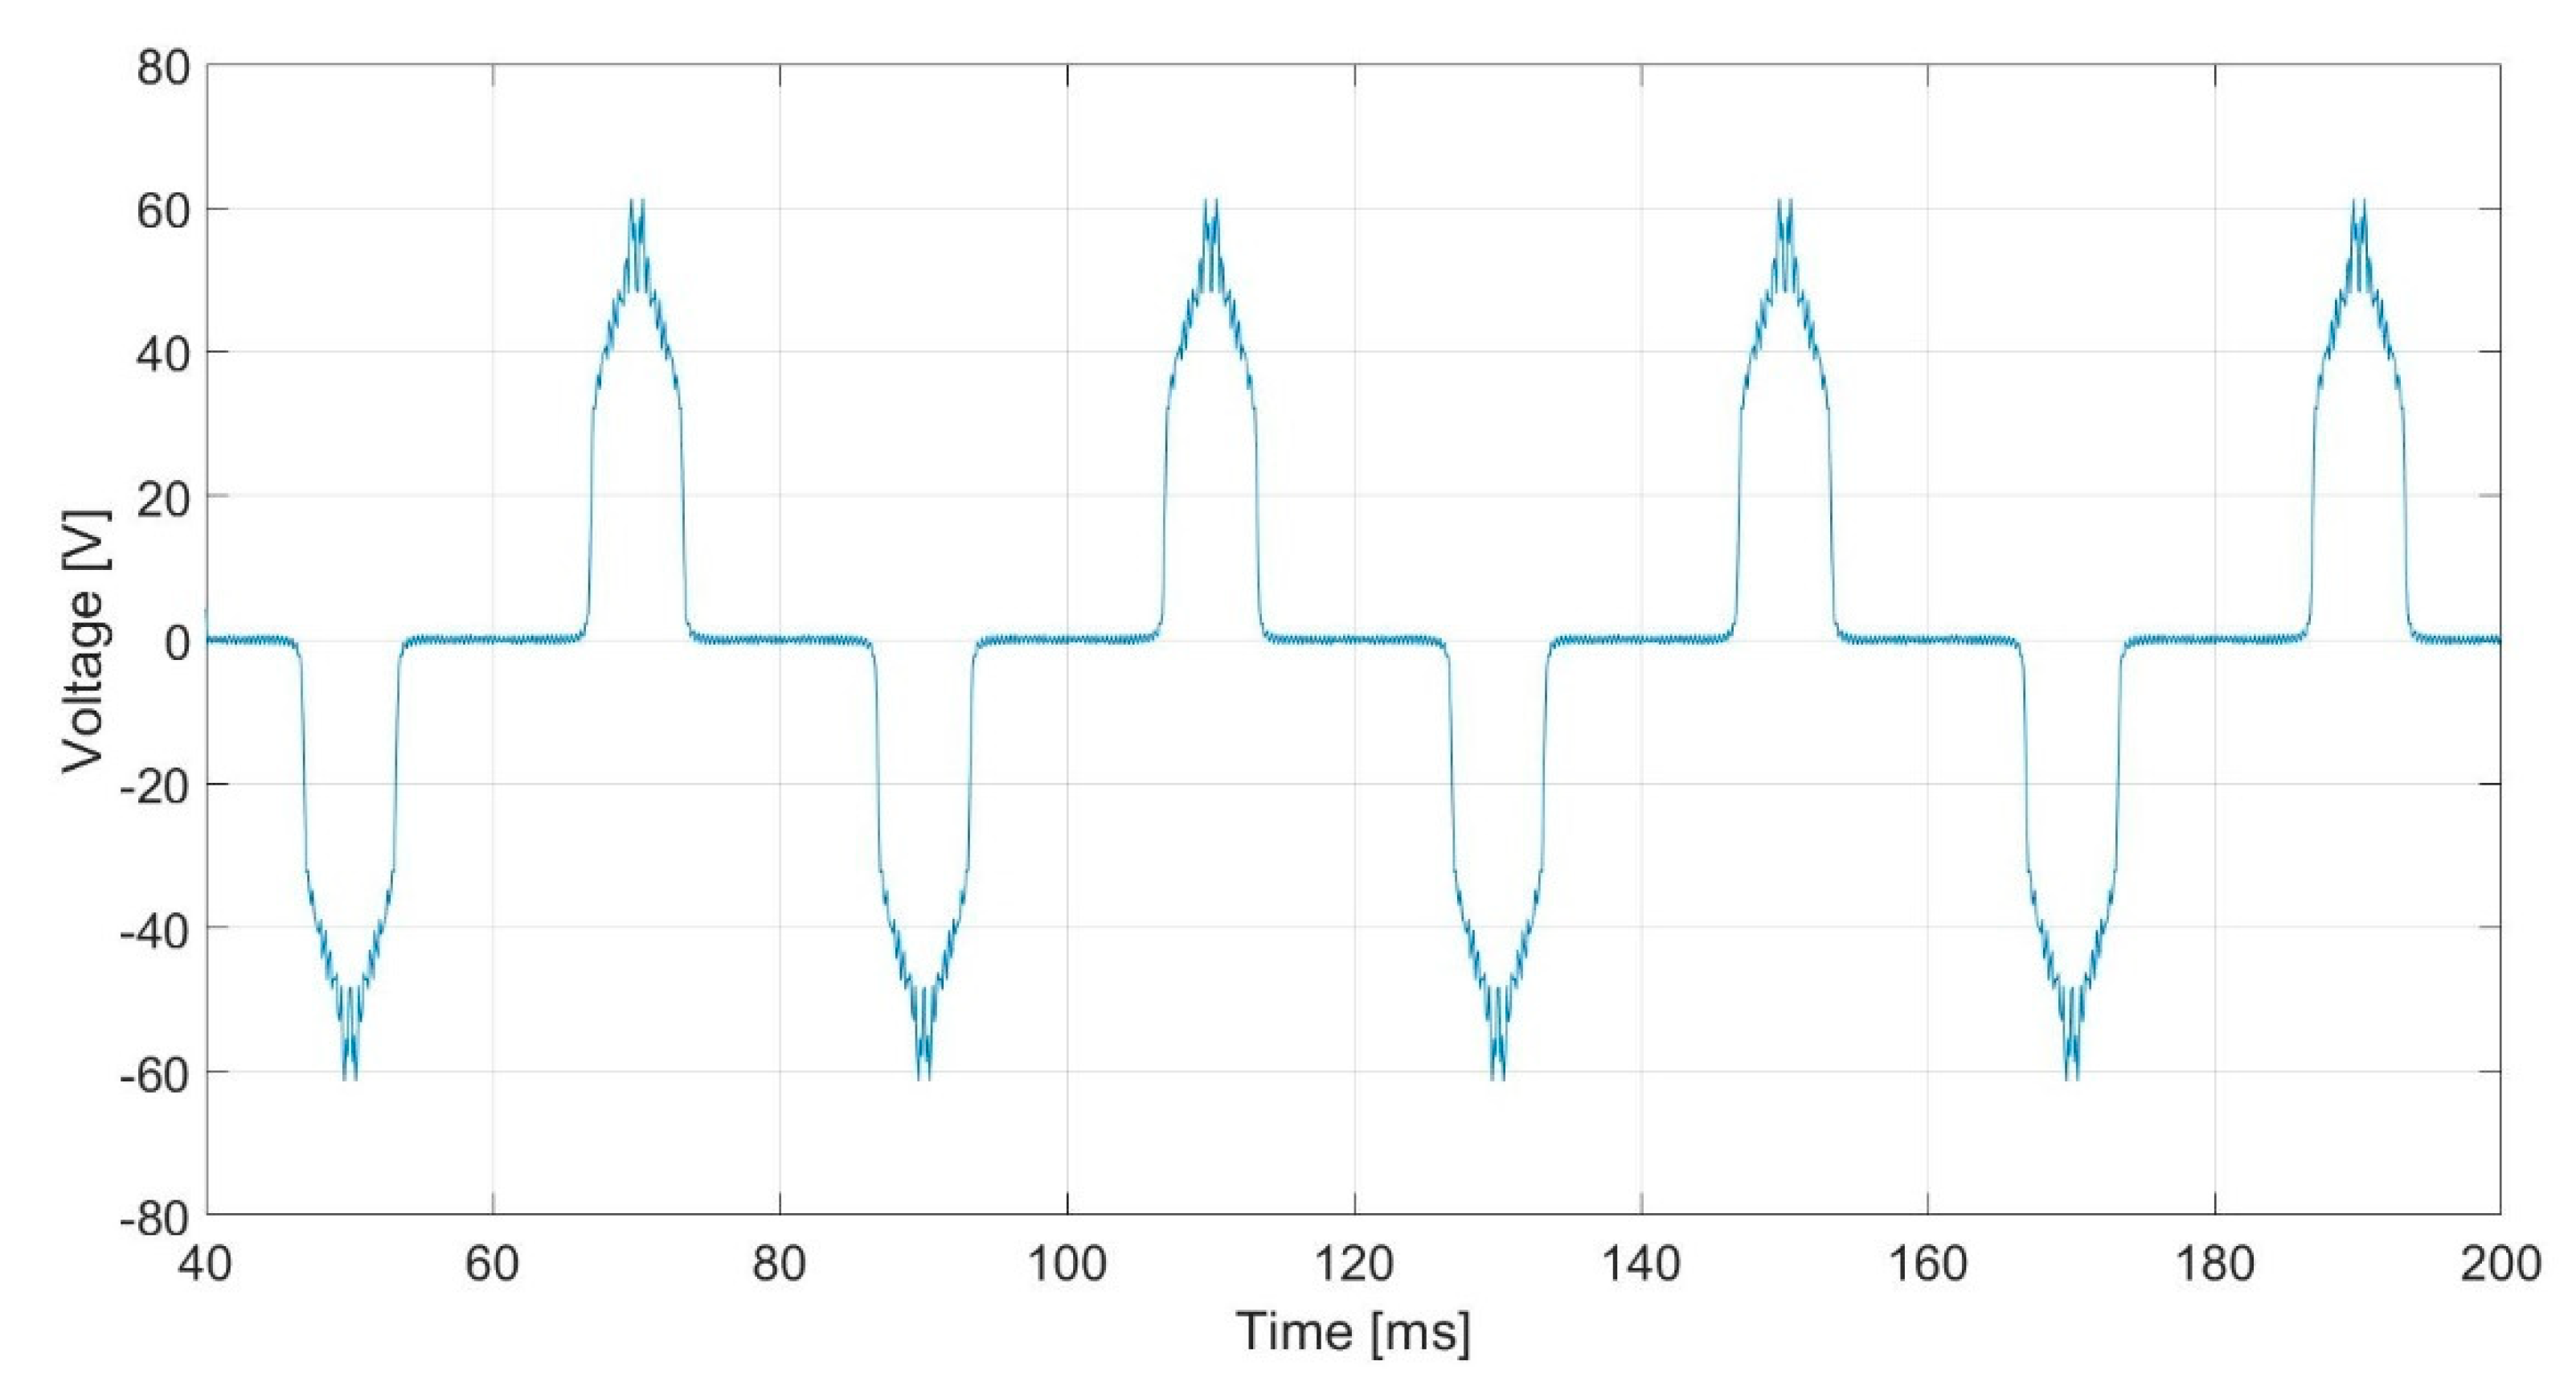
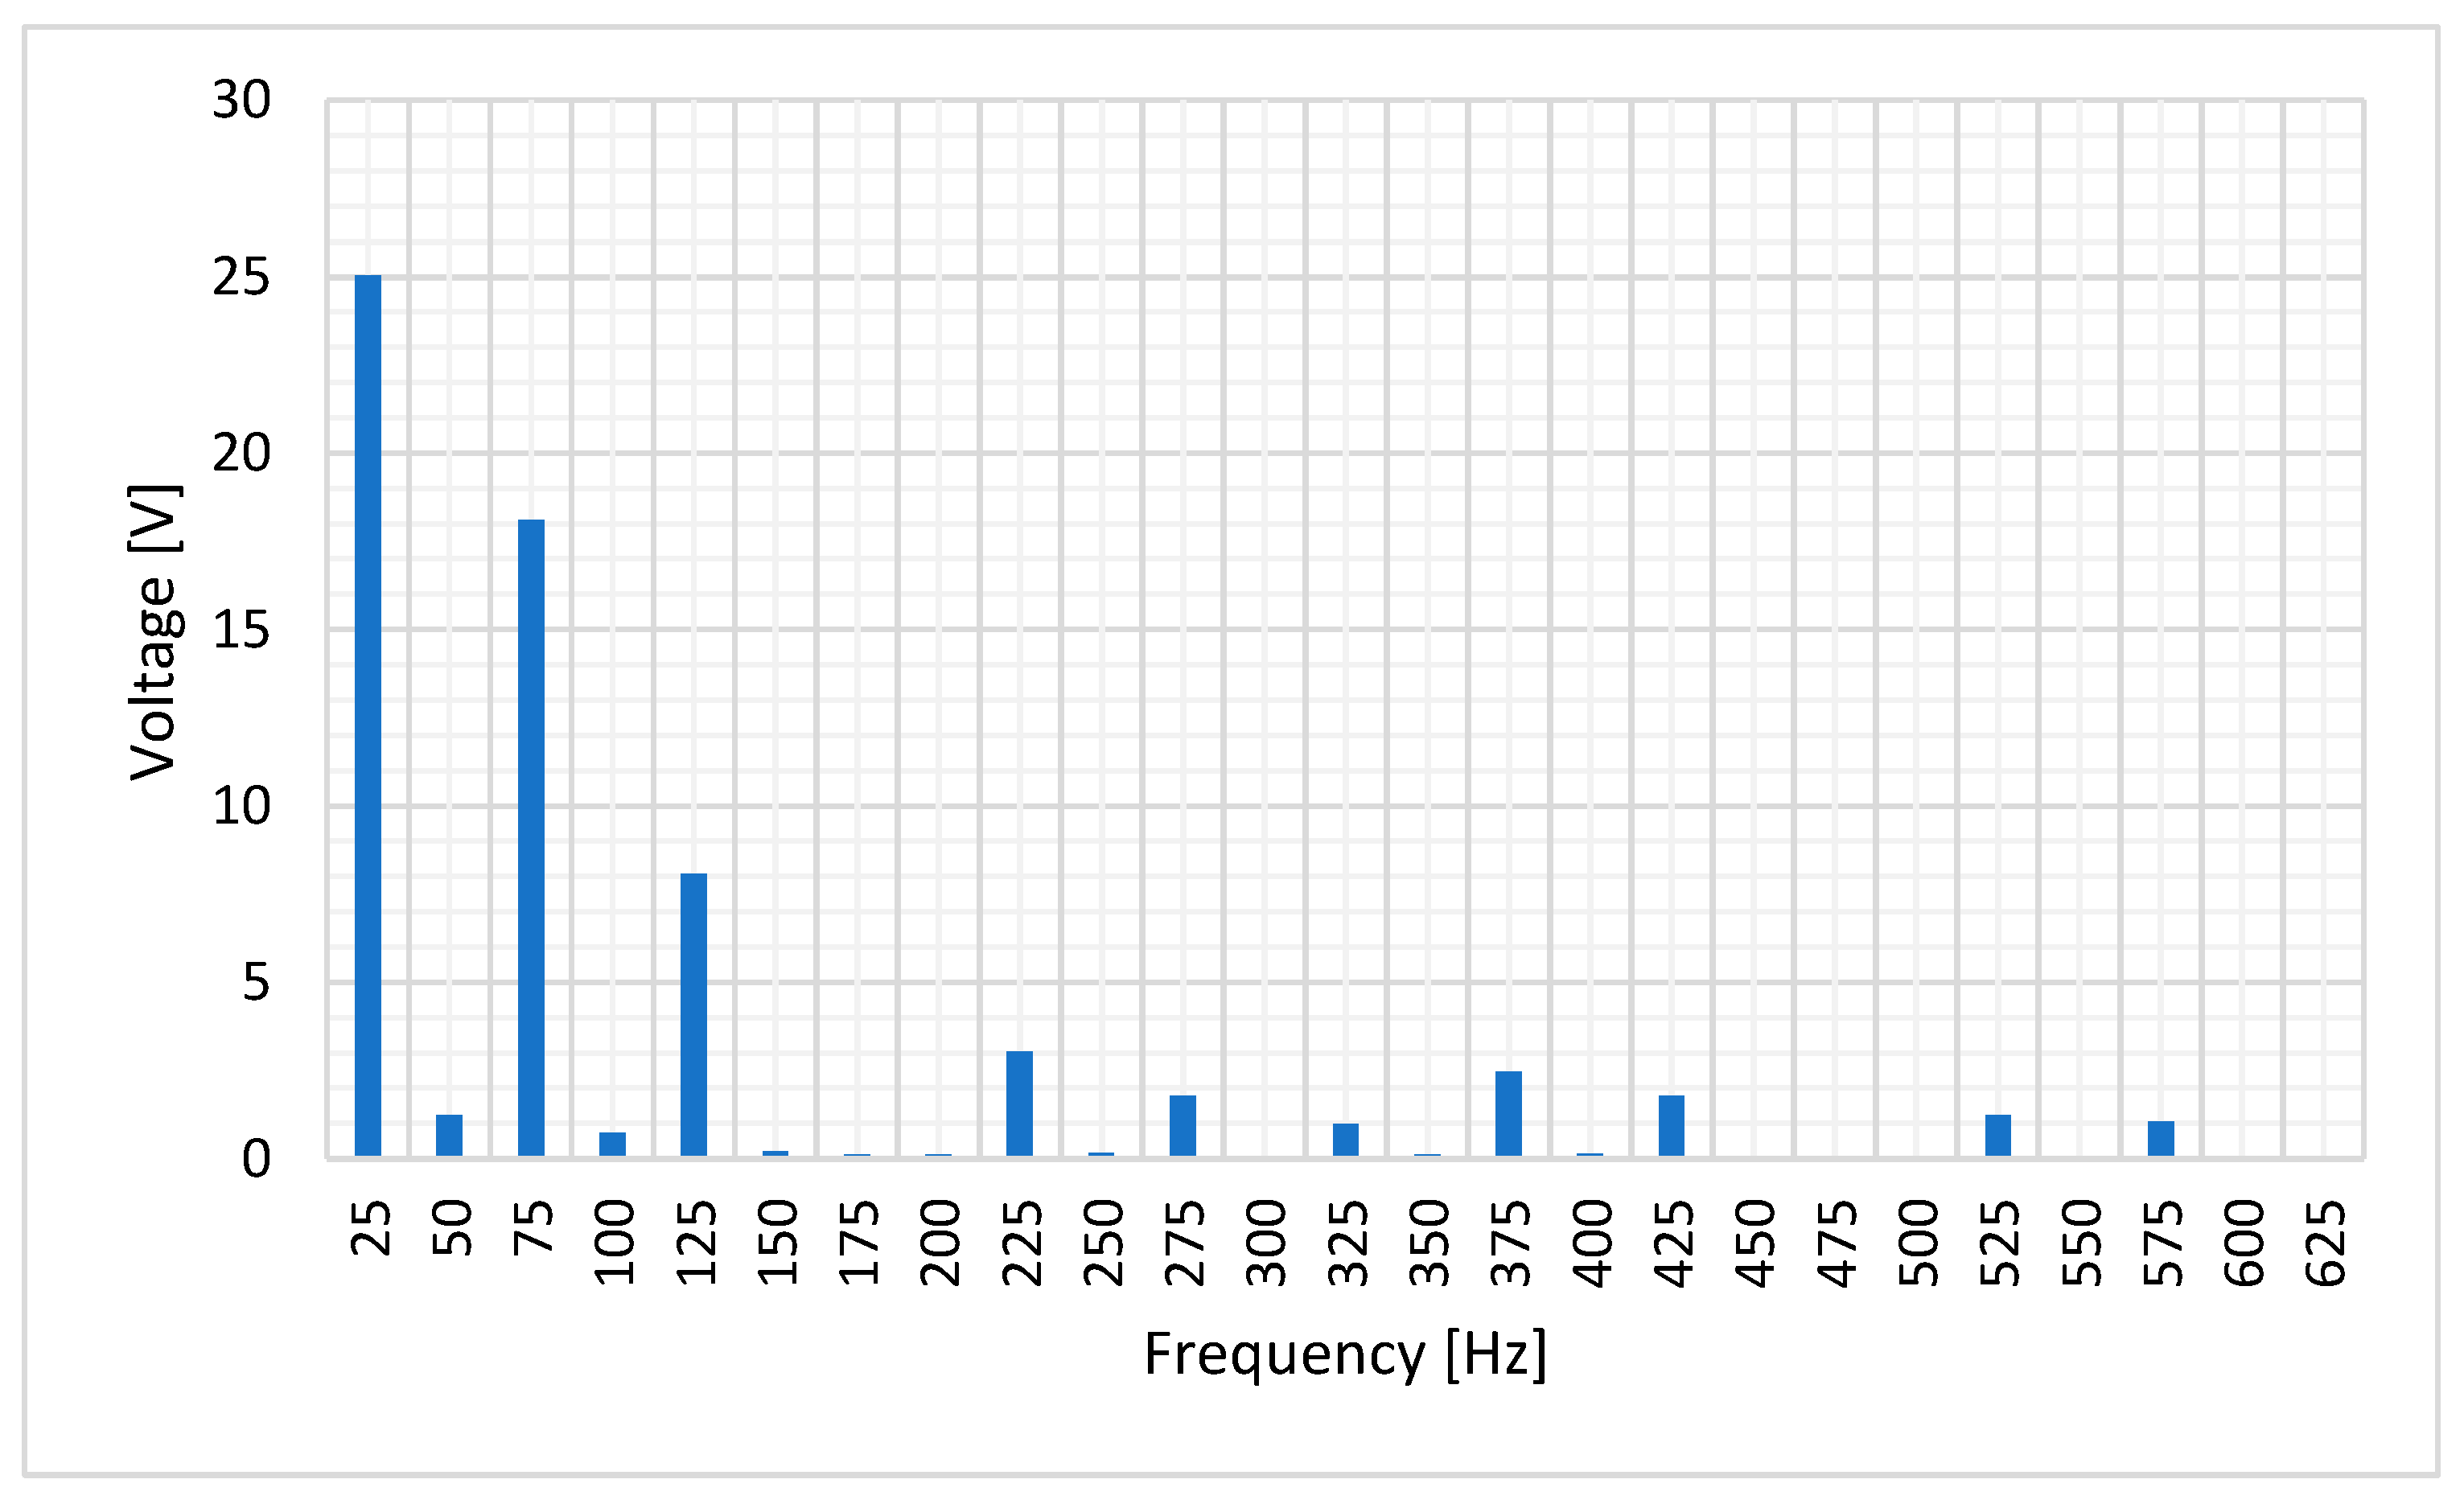
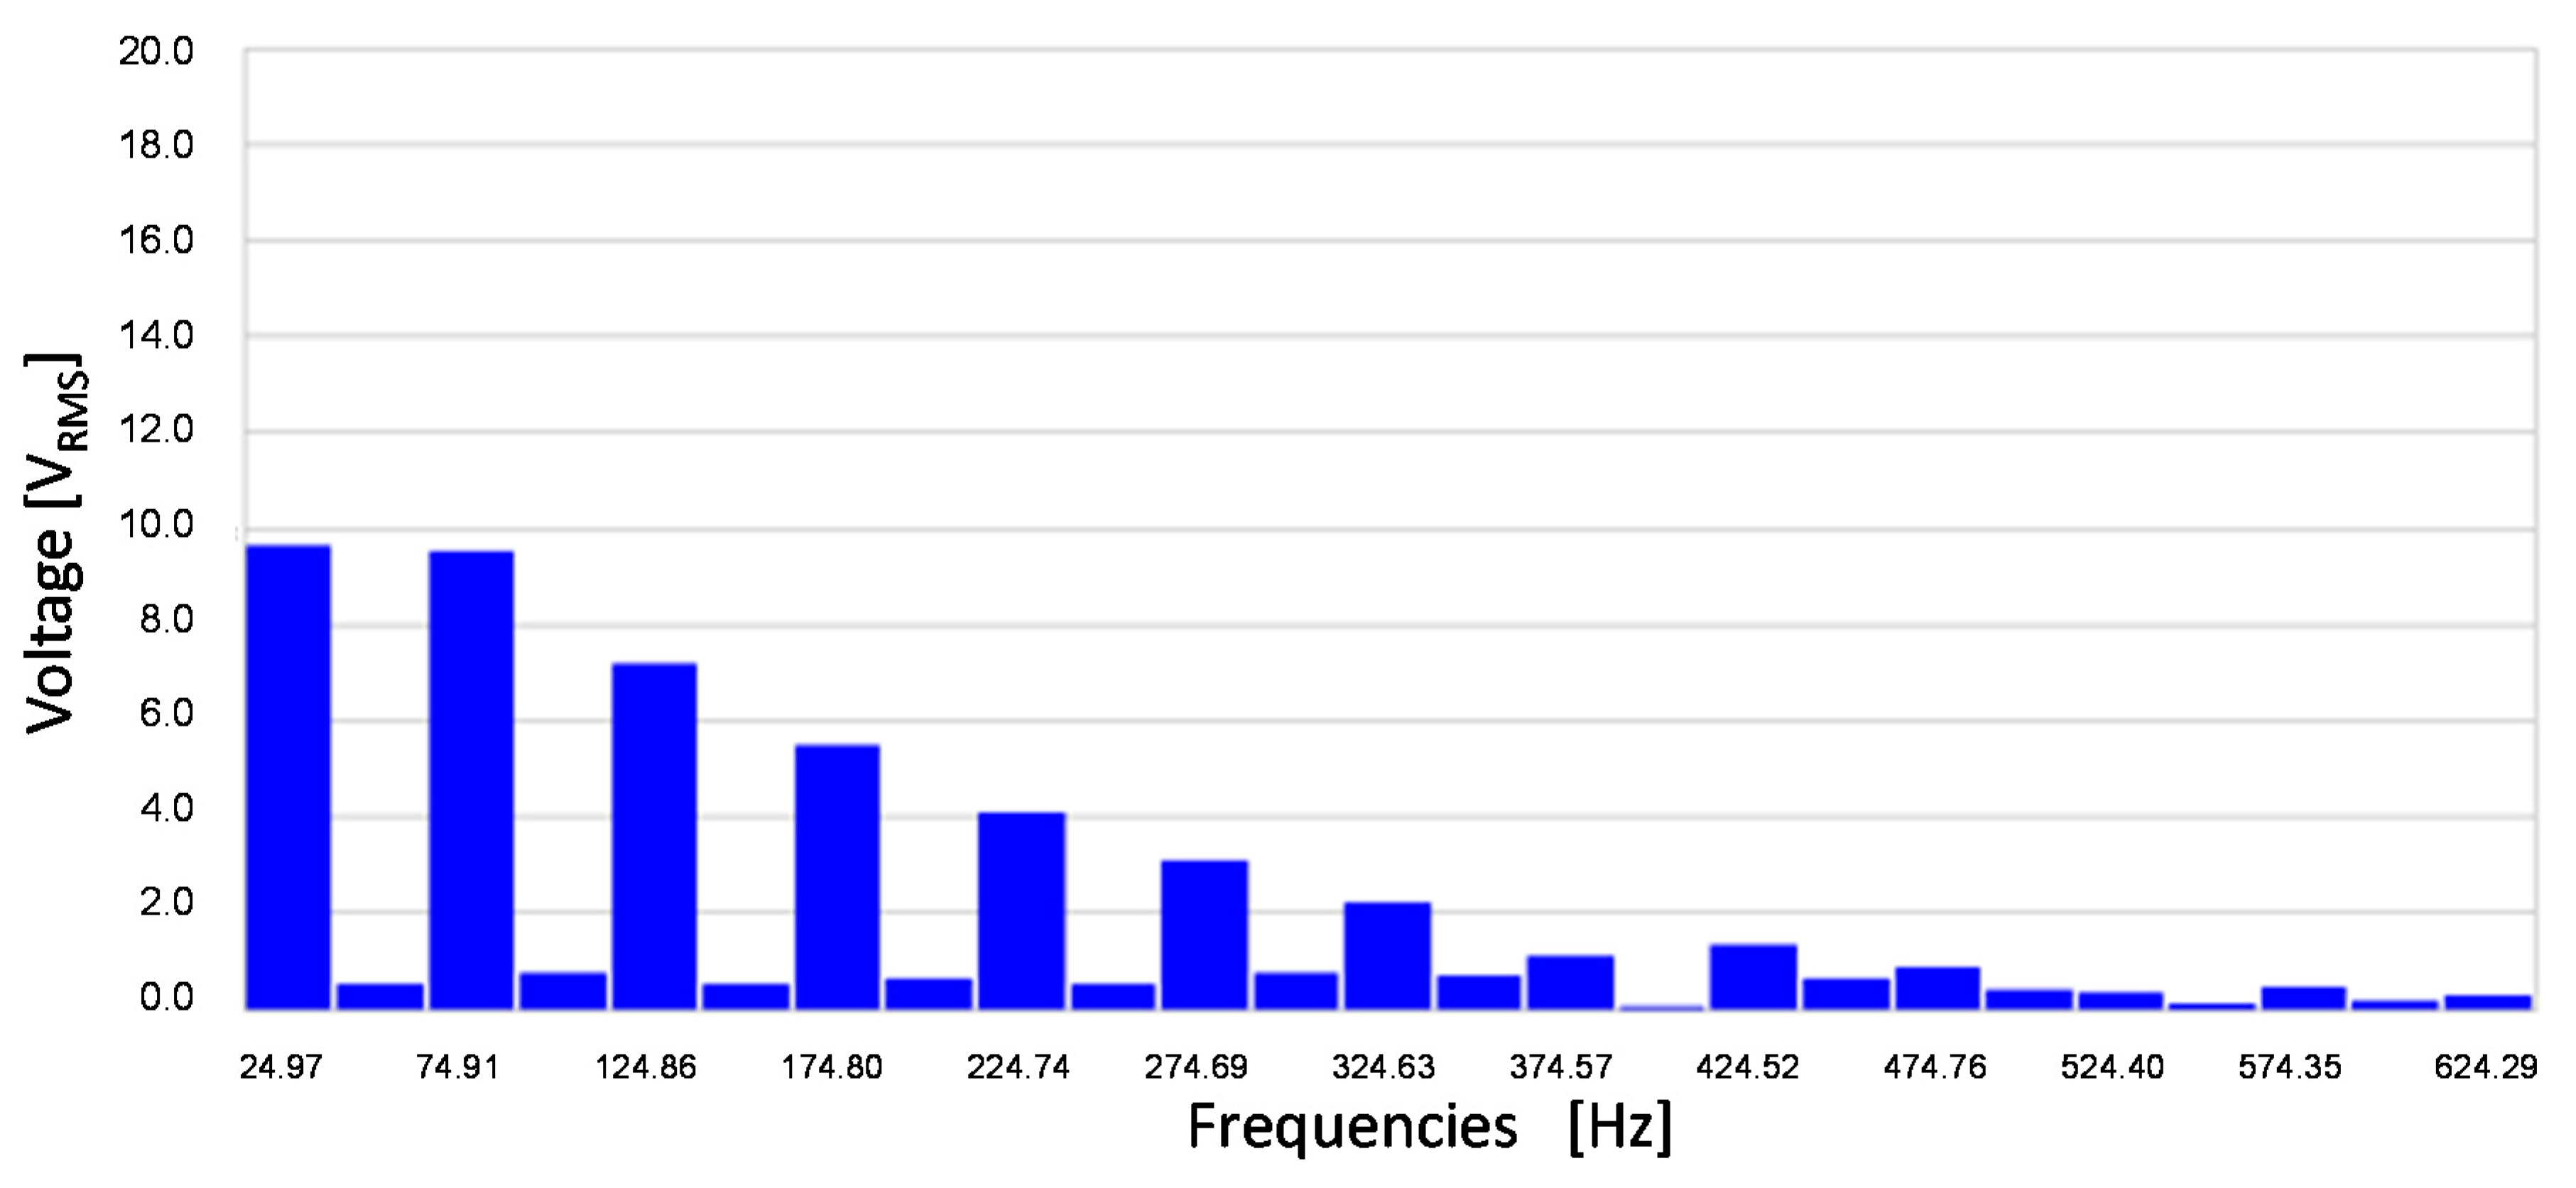
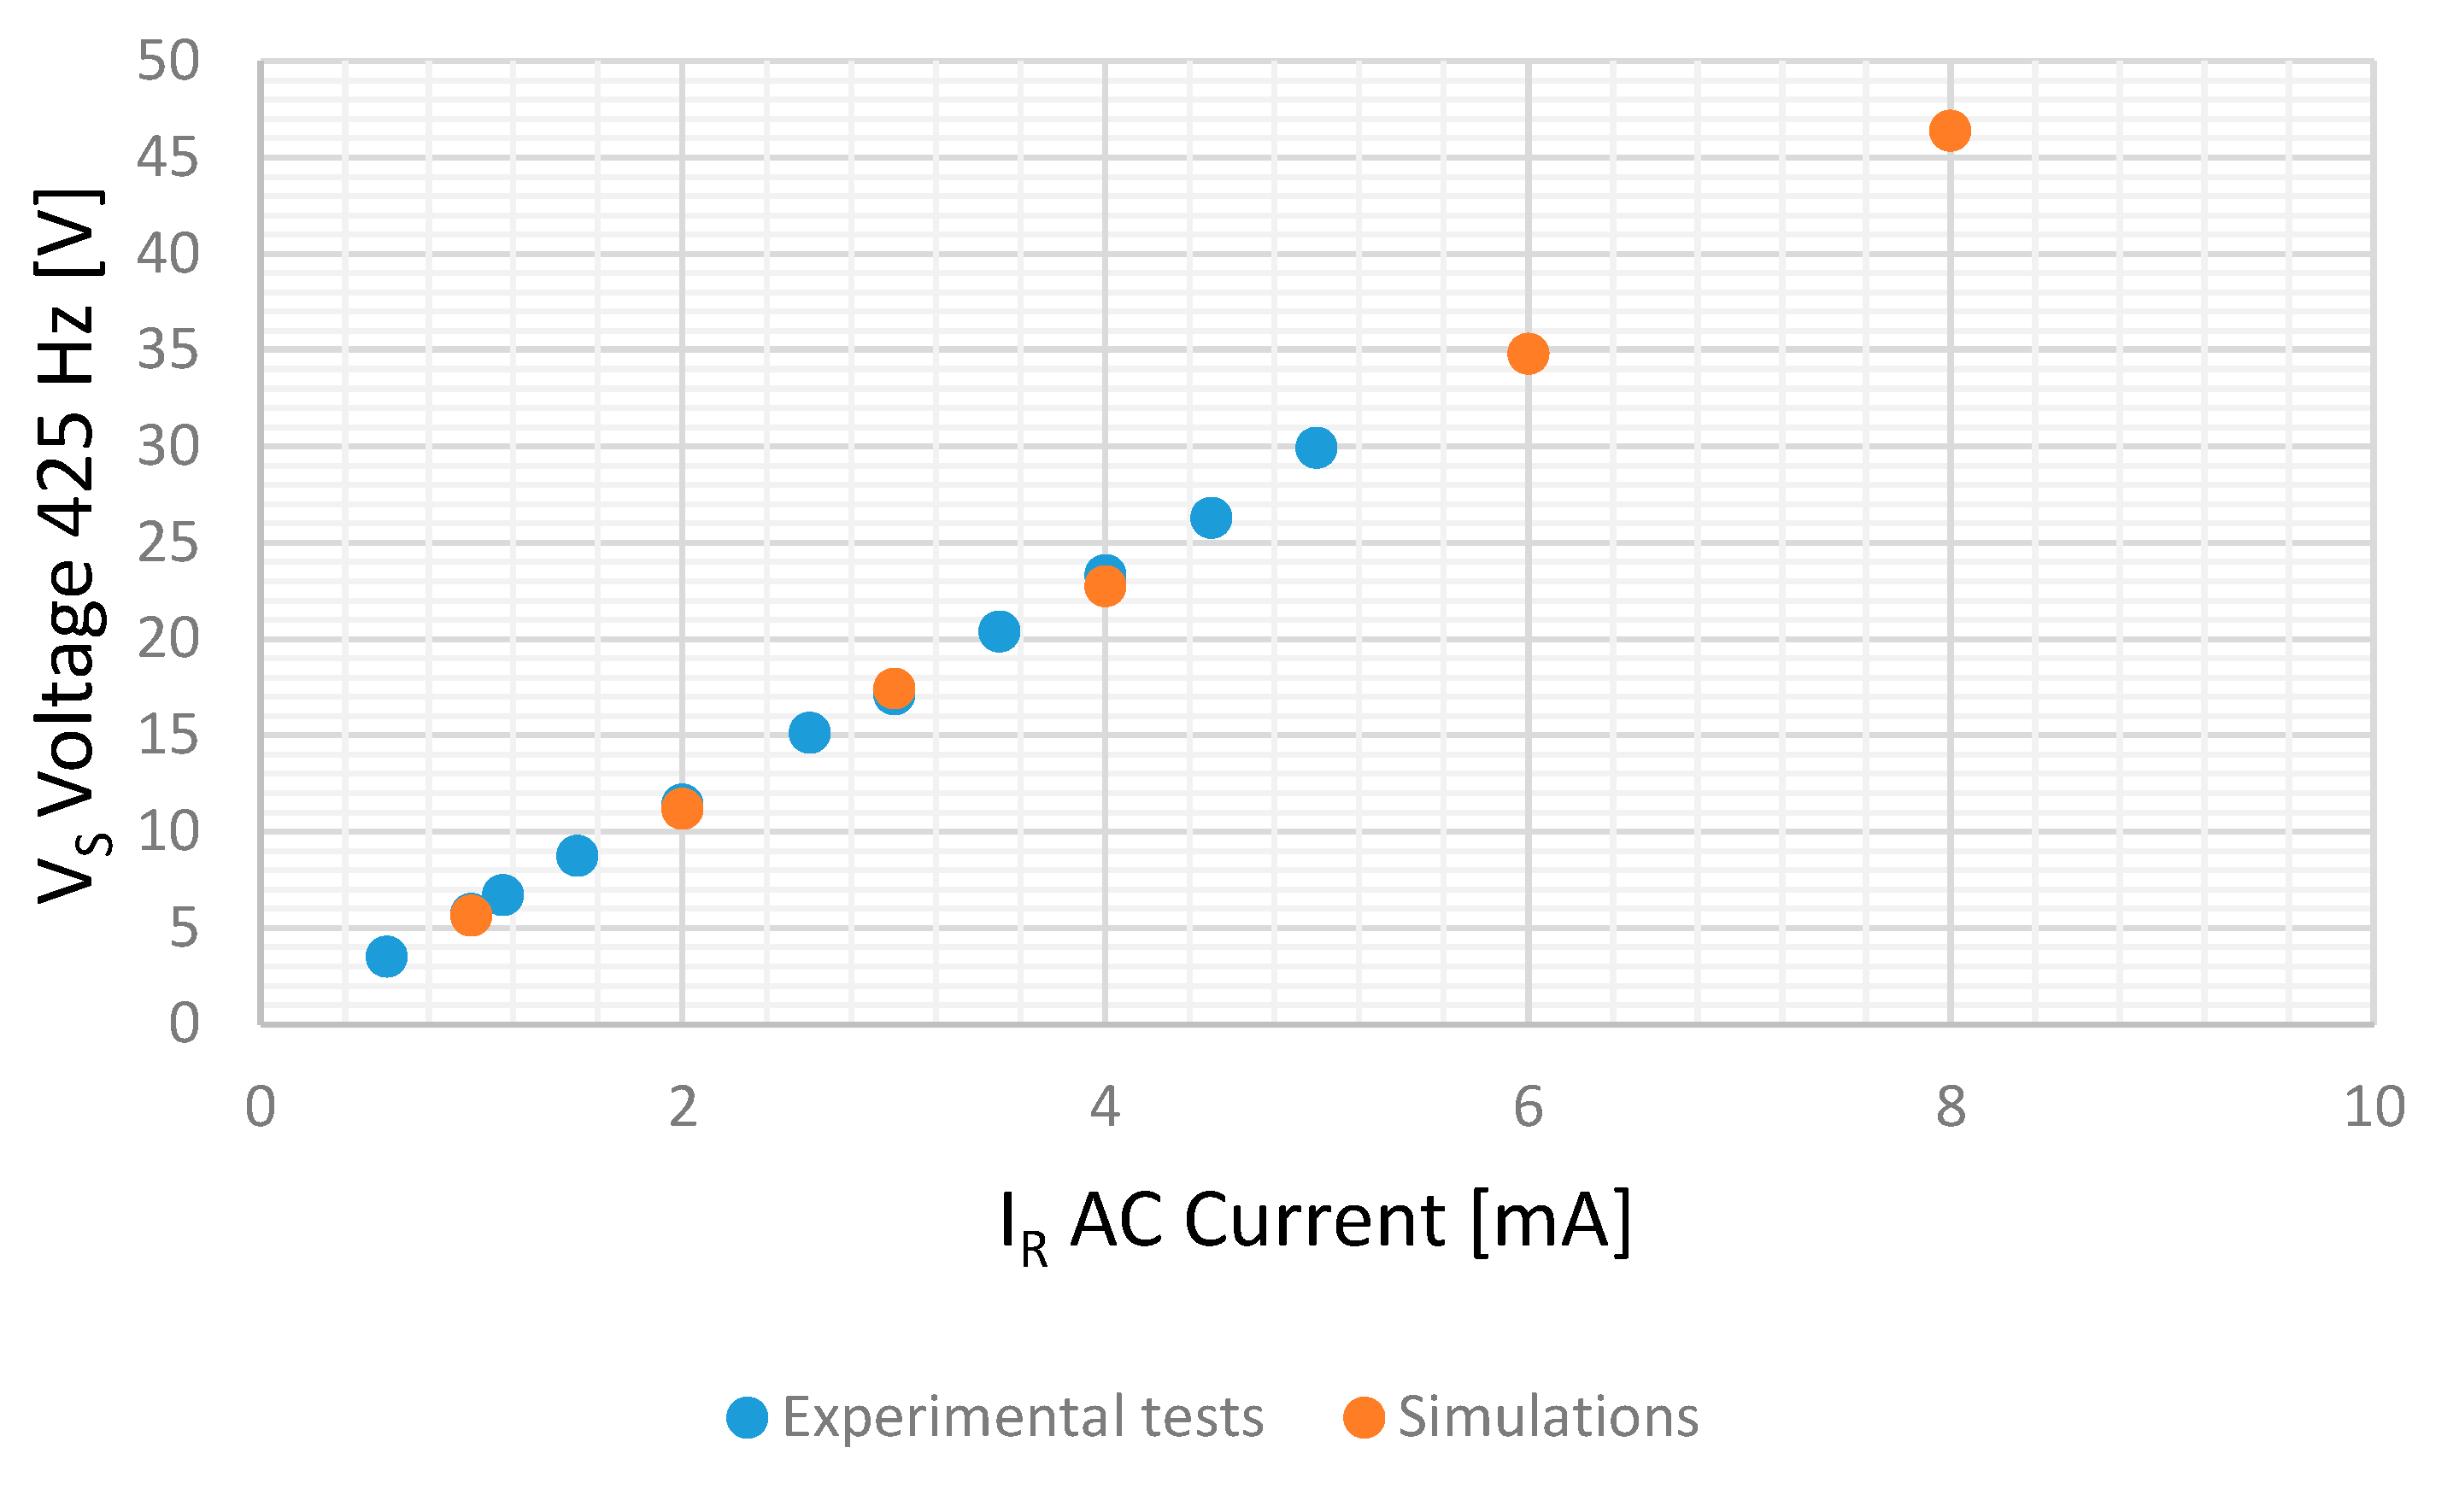
Stator-Induced Voltage
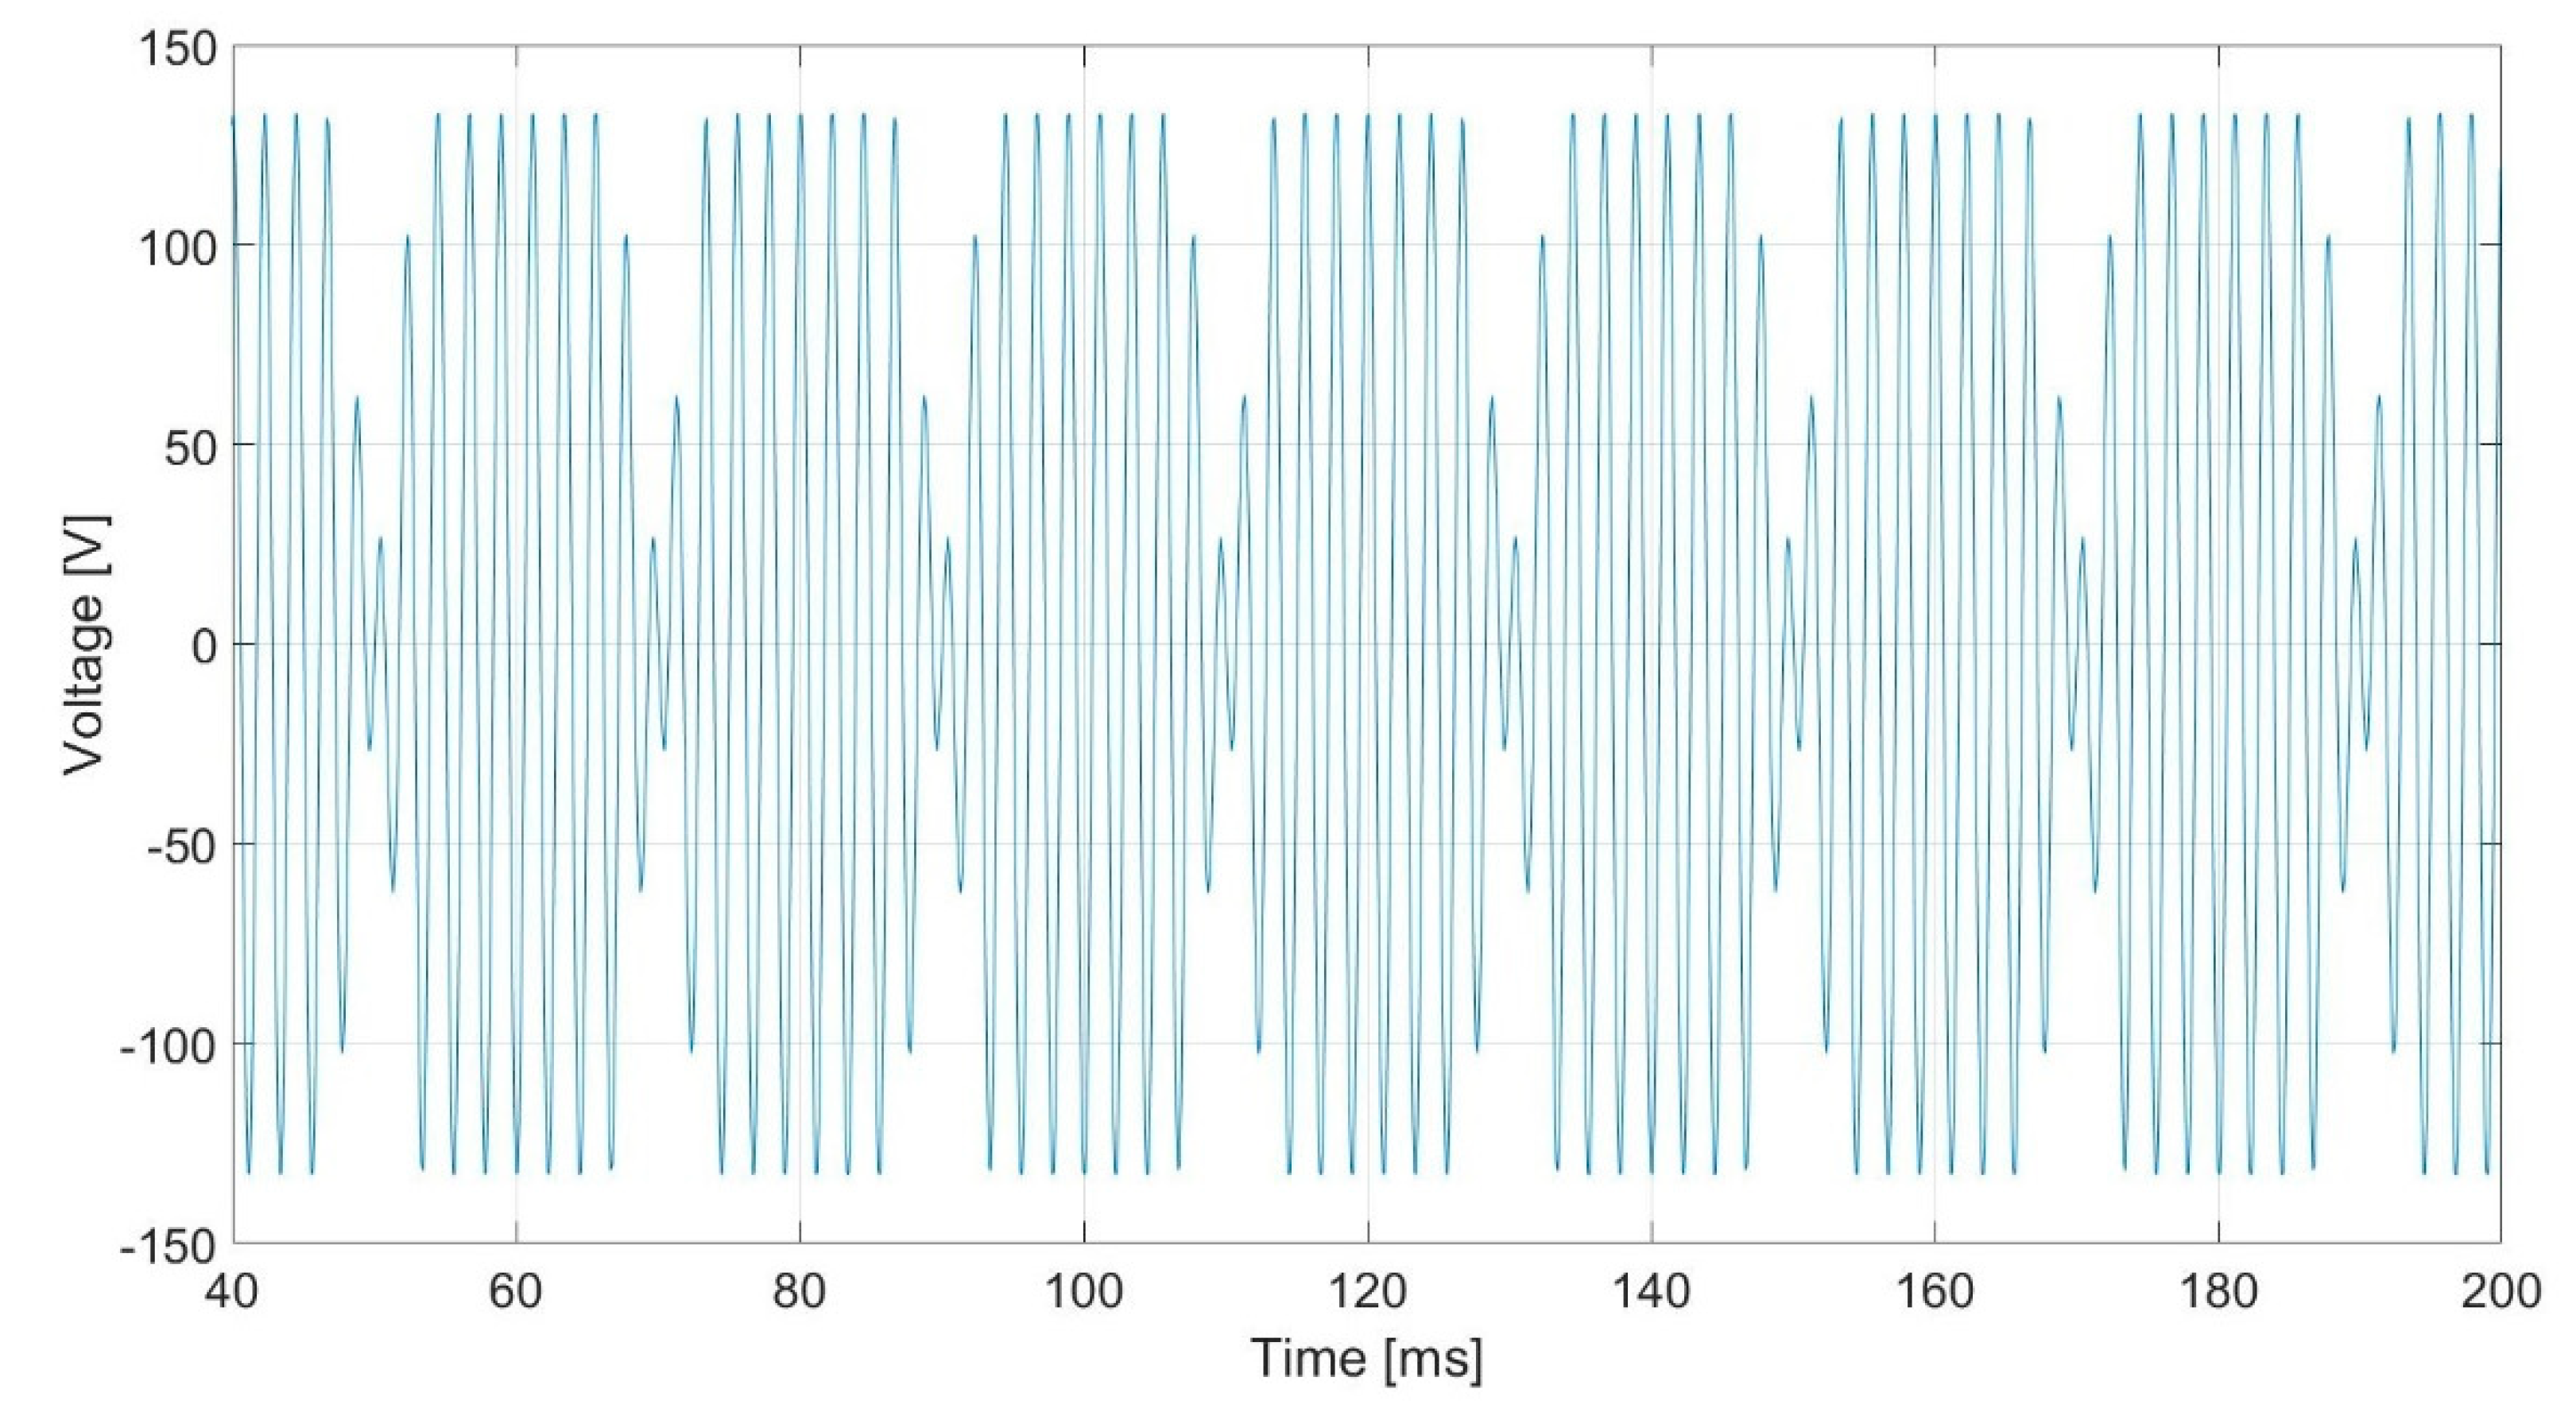
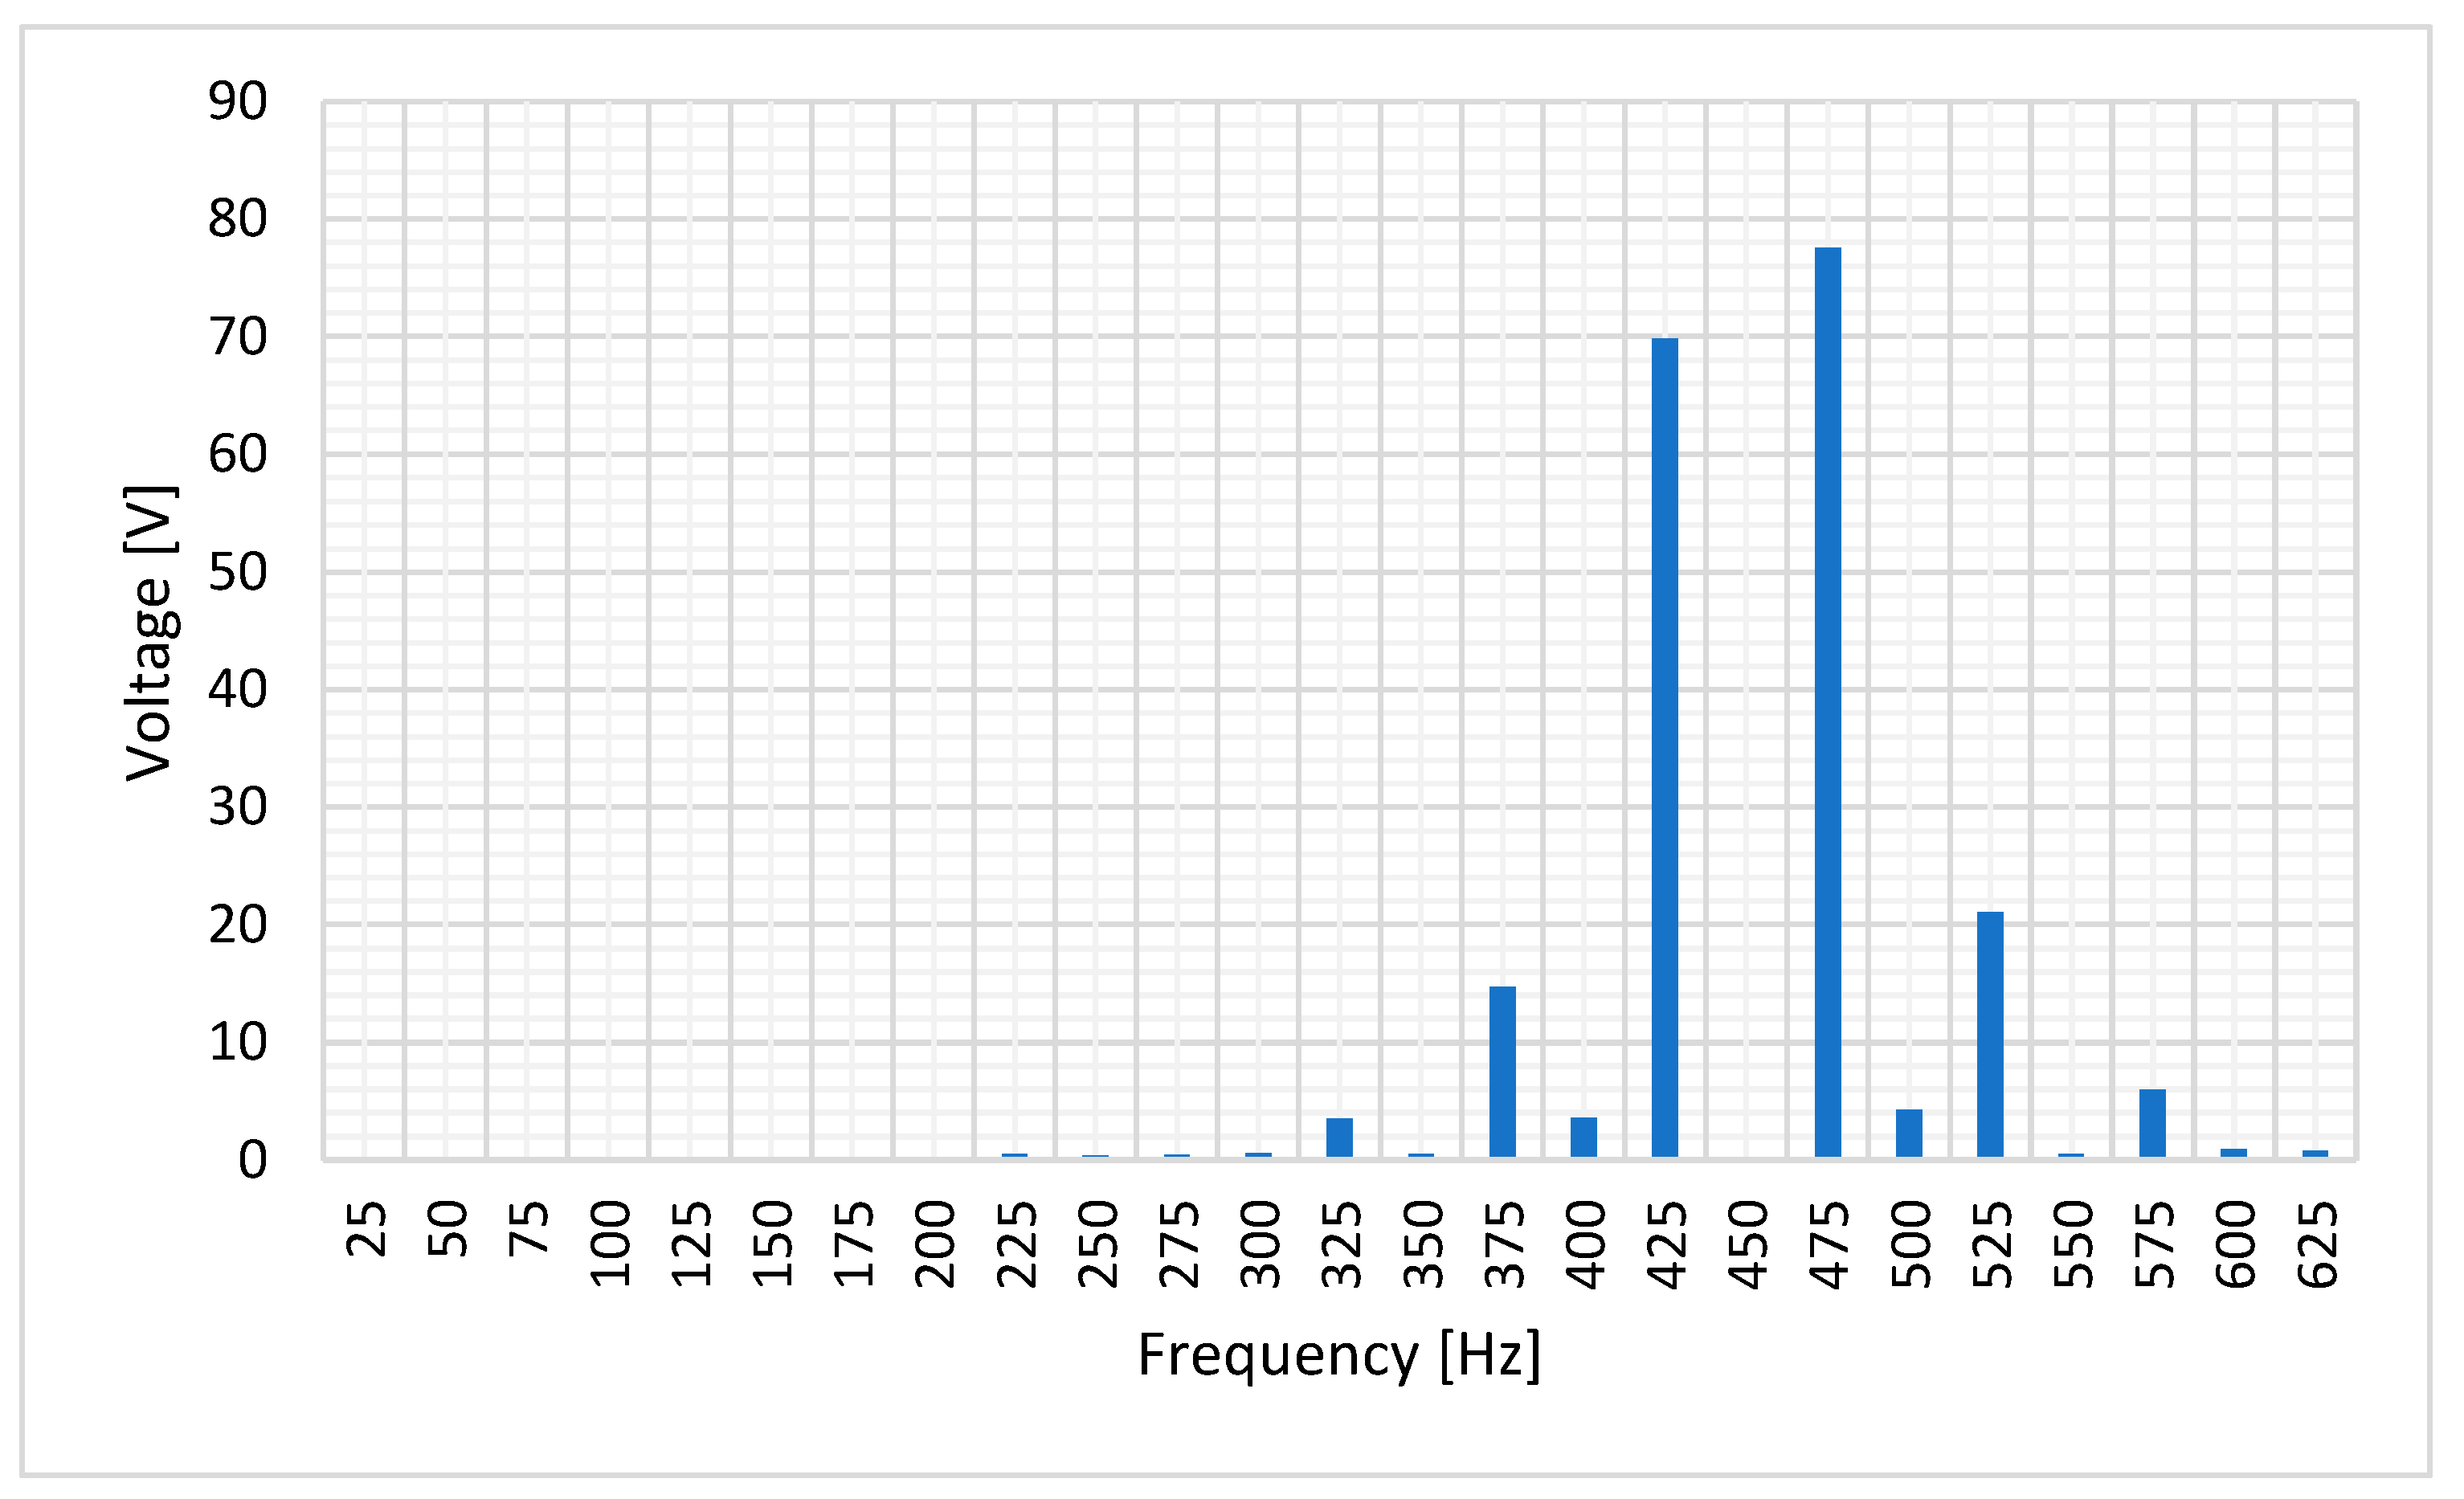
3.1.3. Simulations with AC+DC Currents
Stator-Induced Voltage
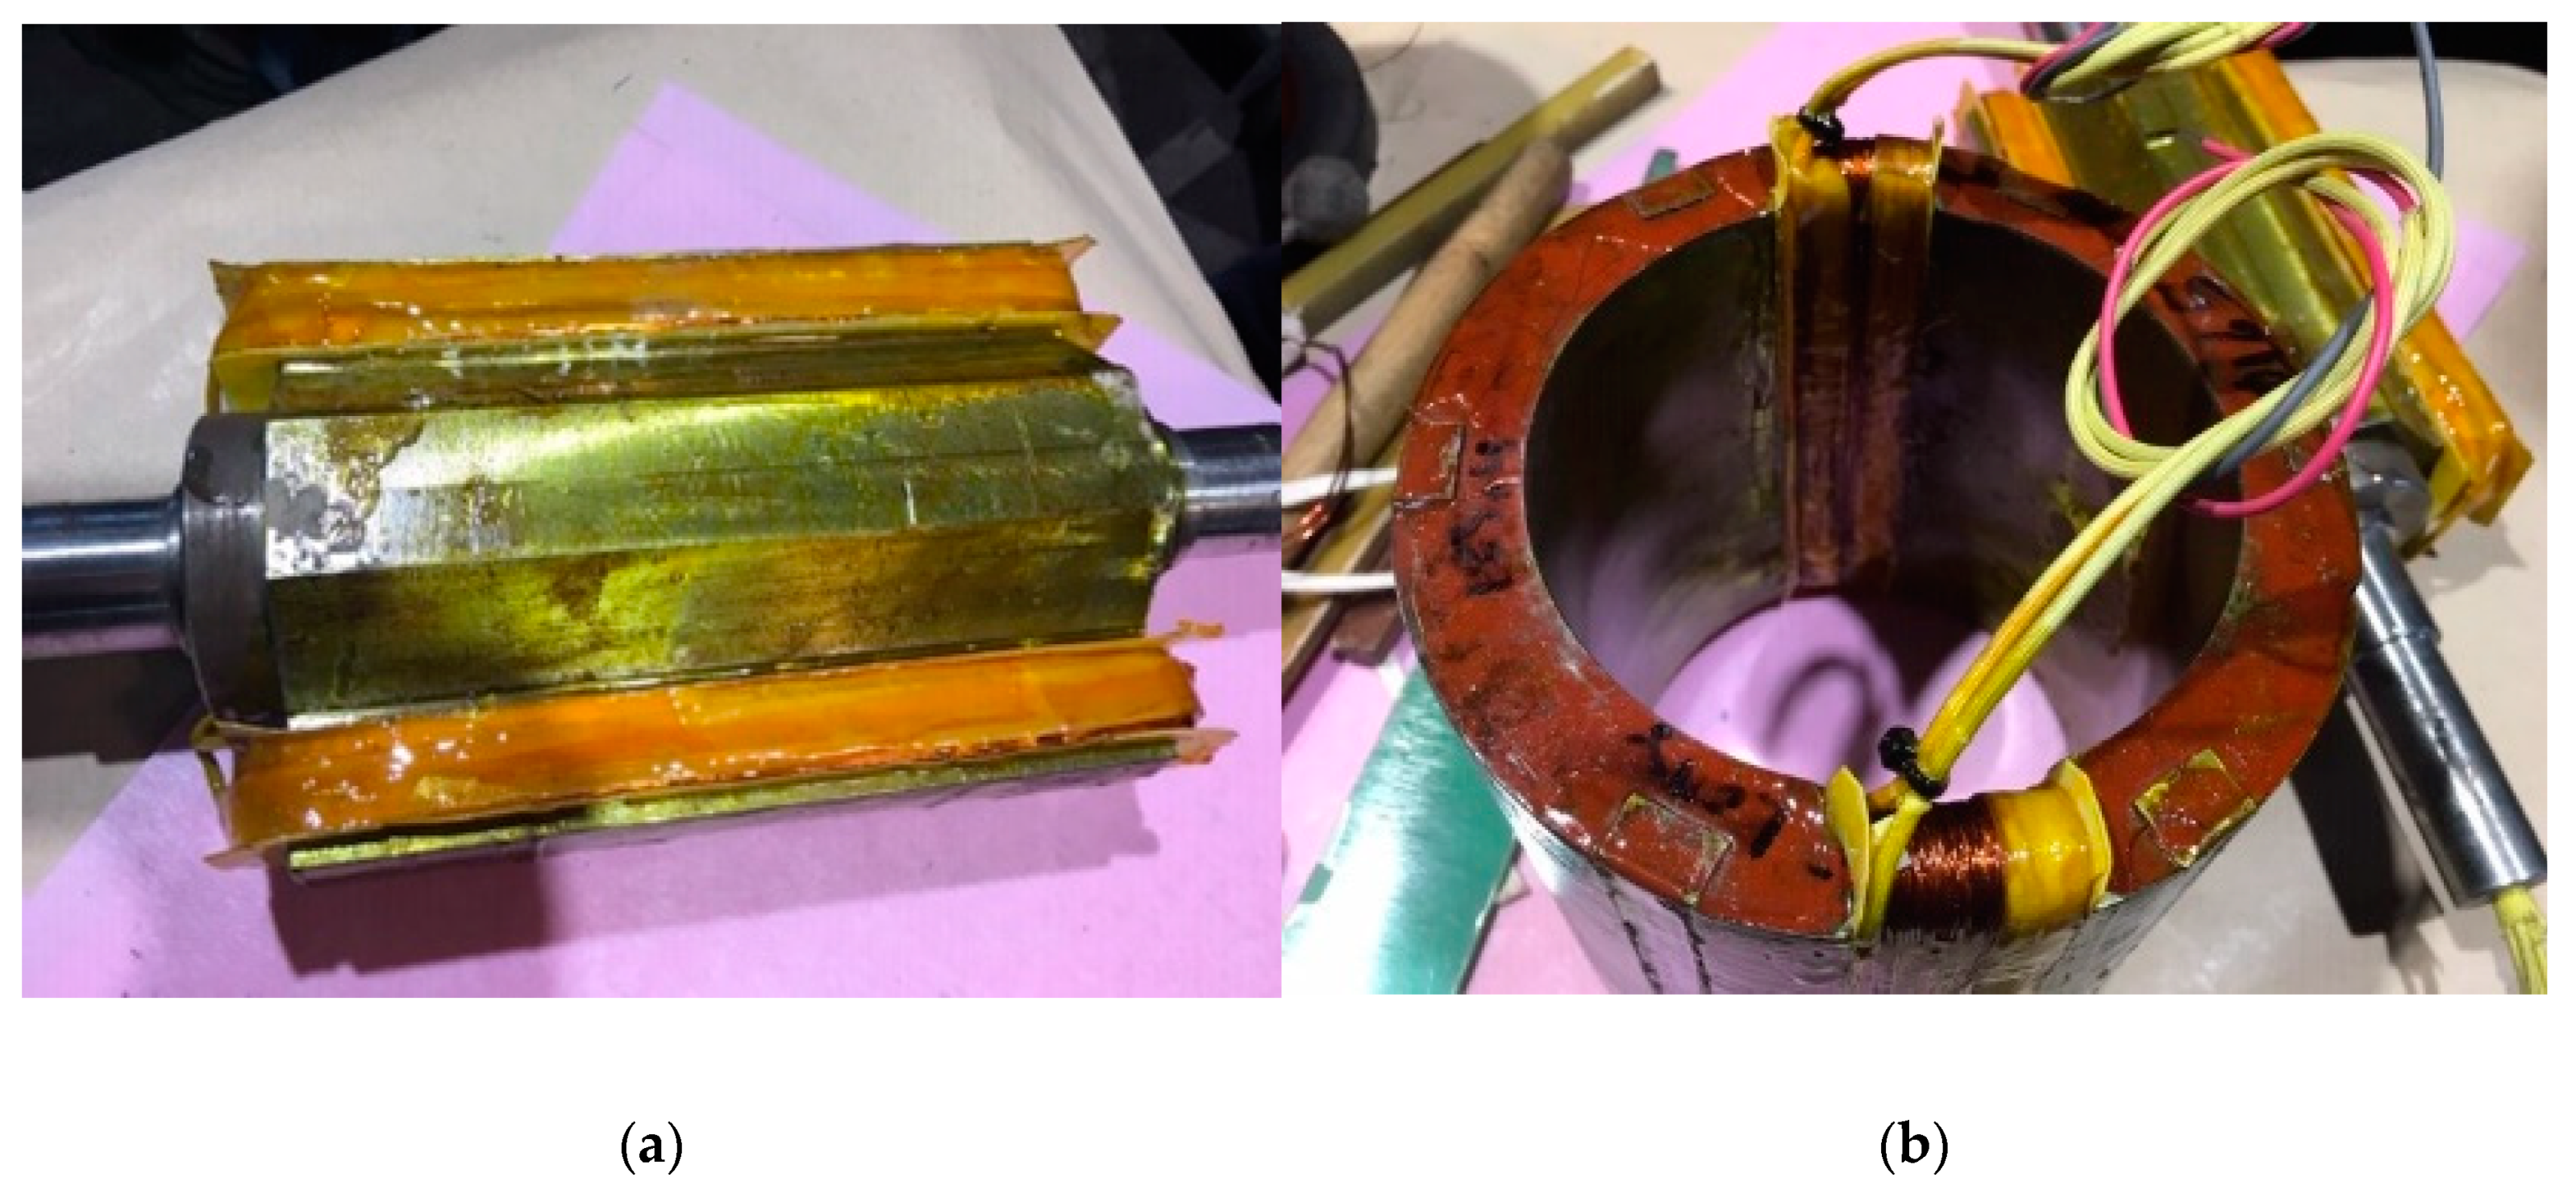
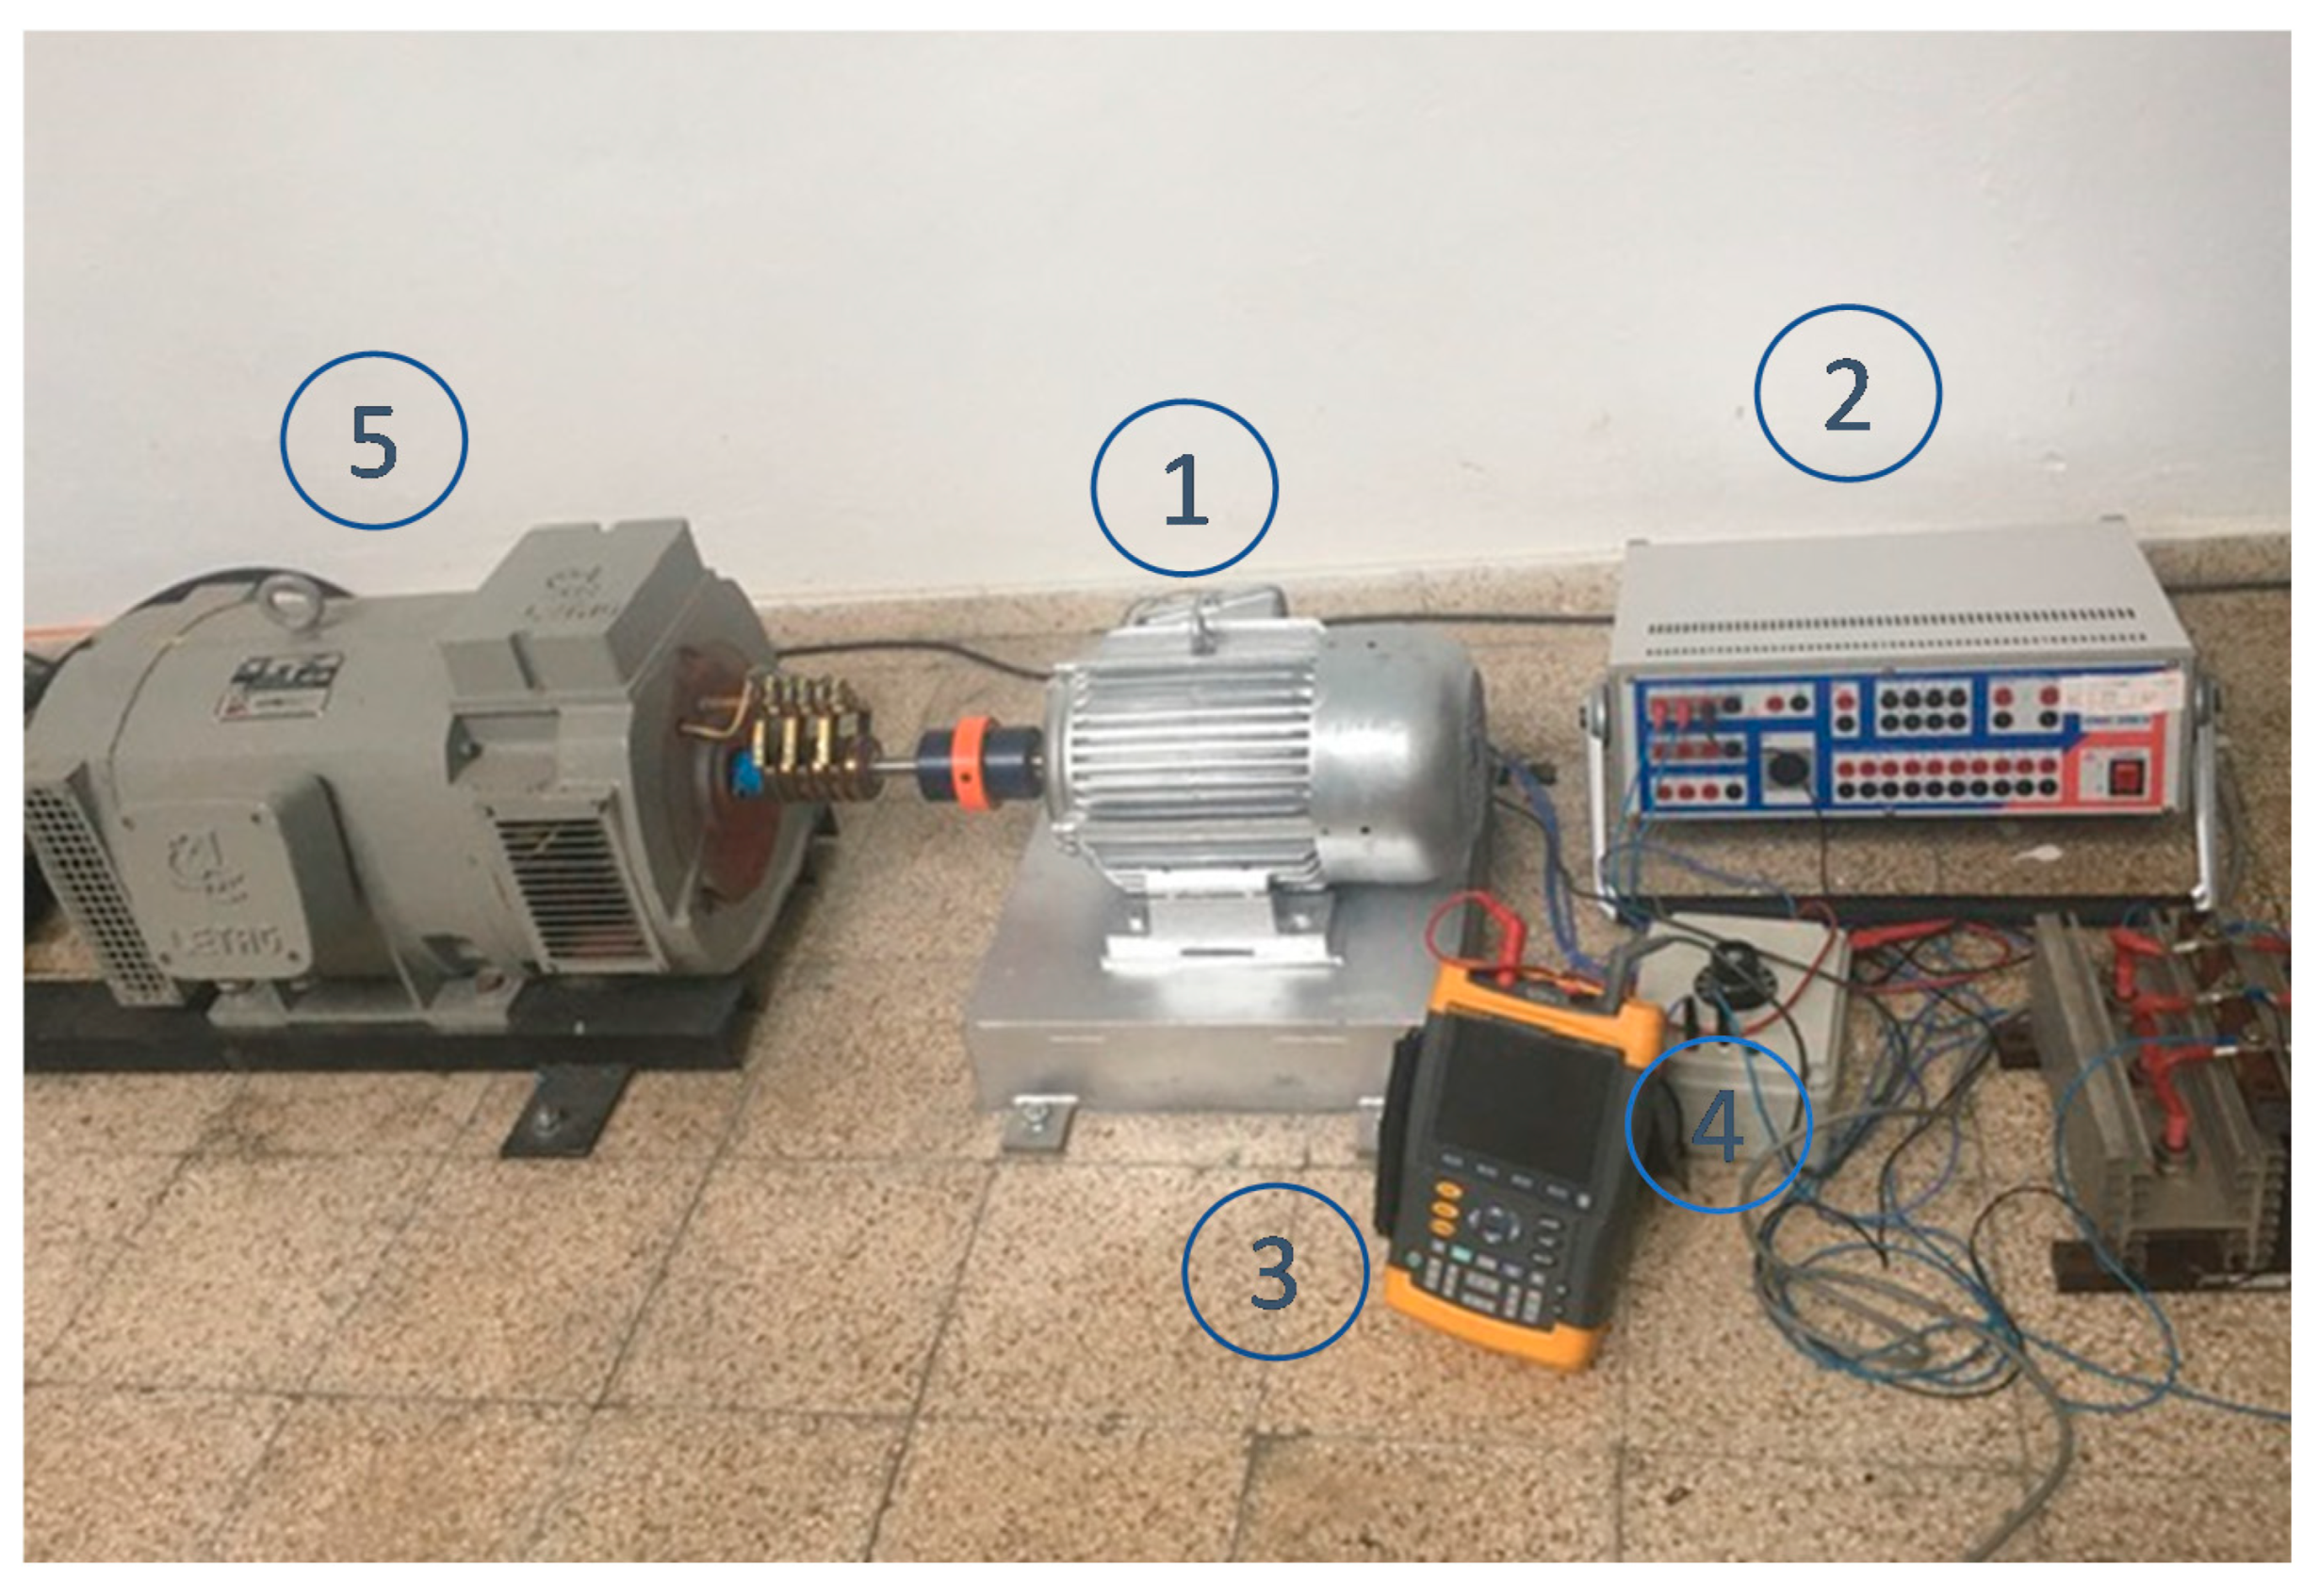
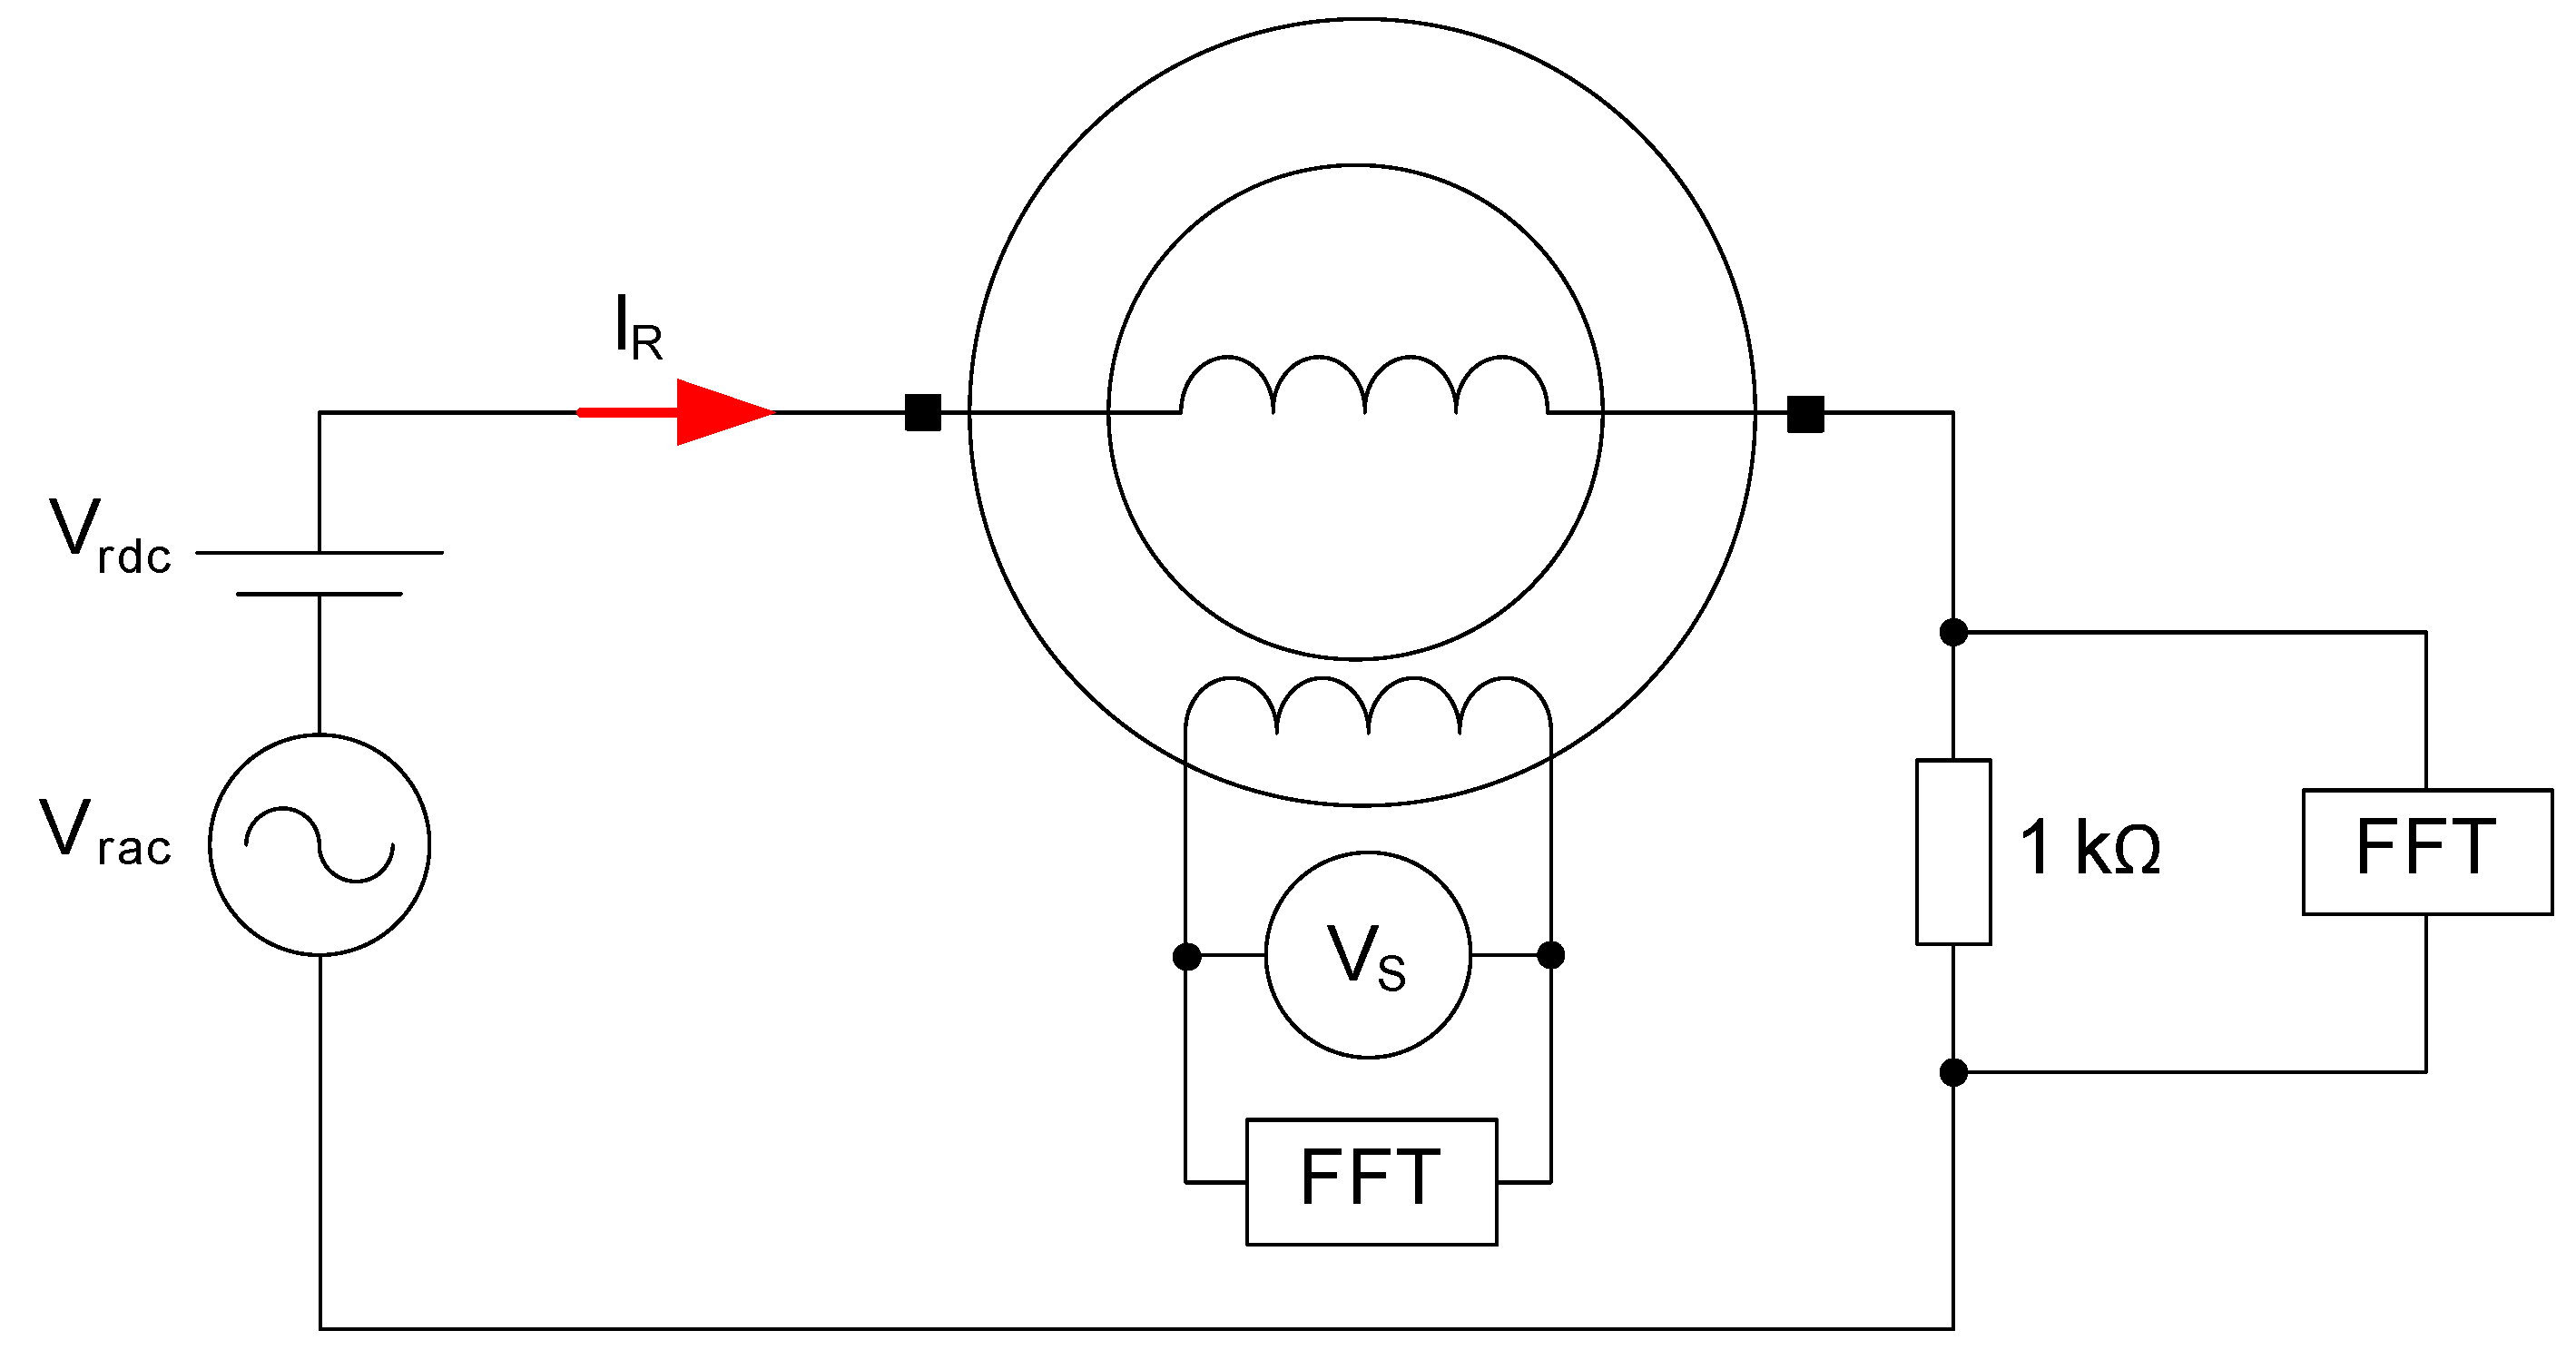
3.2. Experimental Tests
- A three-phase programmable frequency and voltage source;
- Three 4.5 V batteries;
- A variable resistor (0–5000 Ω), settled to 1 kΩ;
- A Fast Fourier Transform (FFT) two-channel oscilloscope;
- A voltmeter.
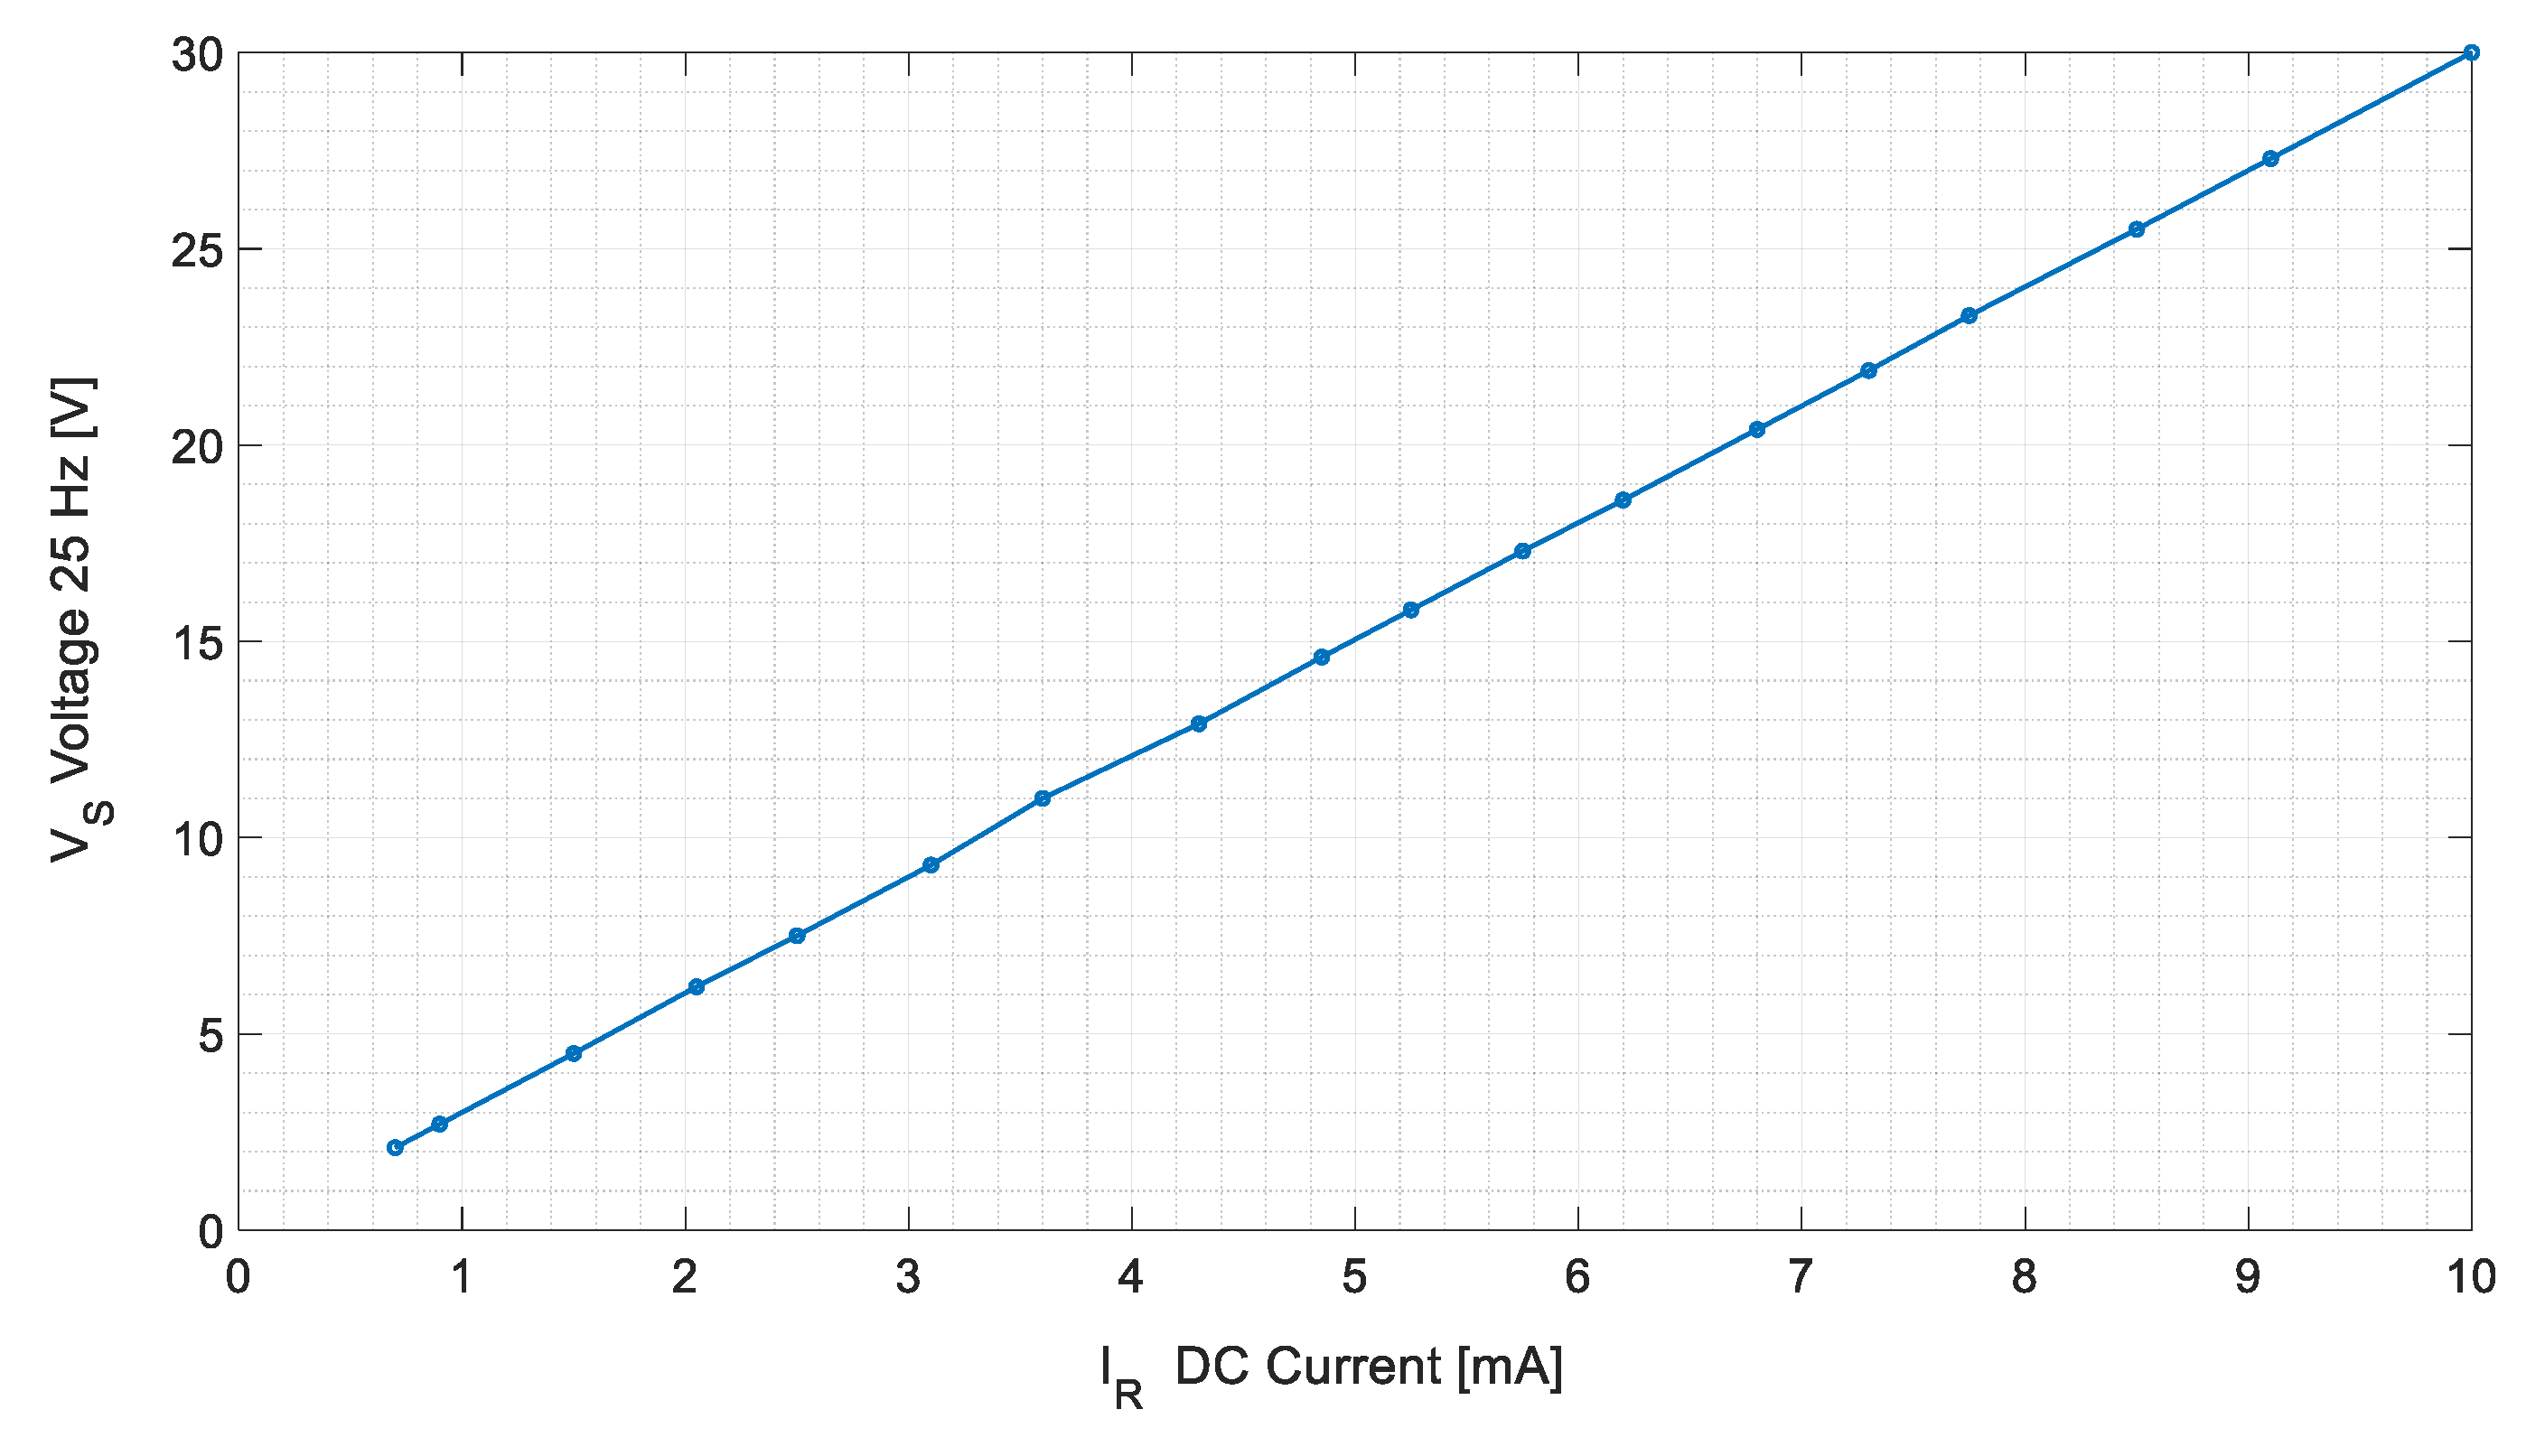
3.2.1. DC Fed Experimental Tests
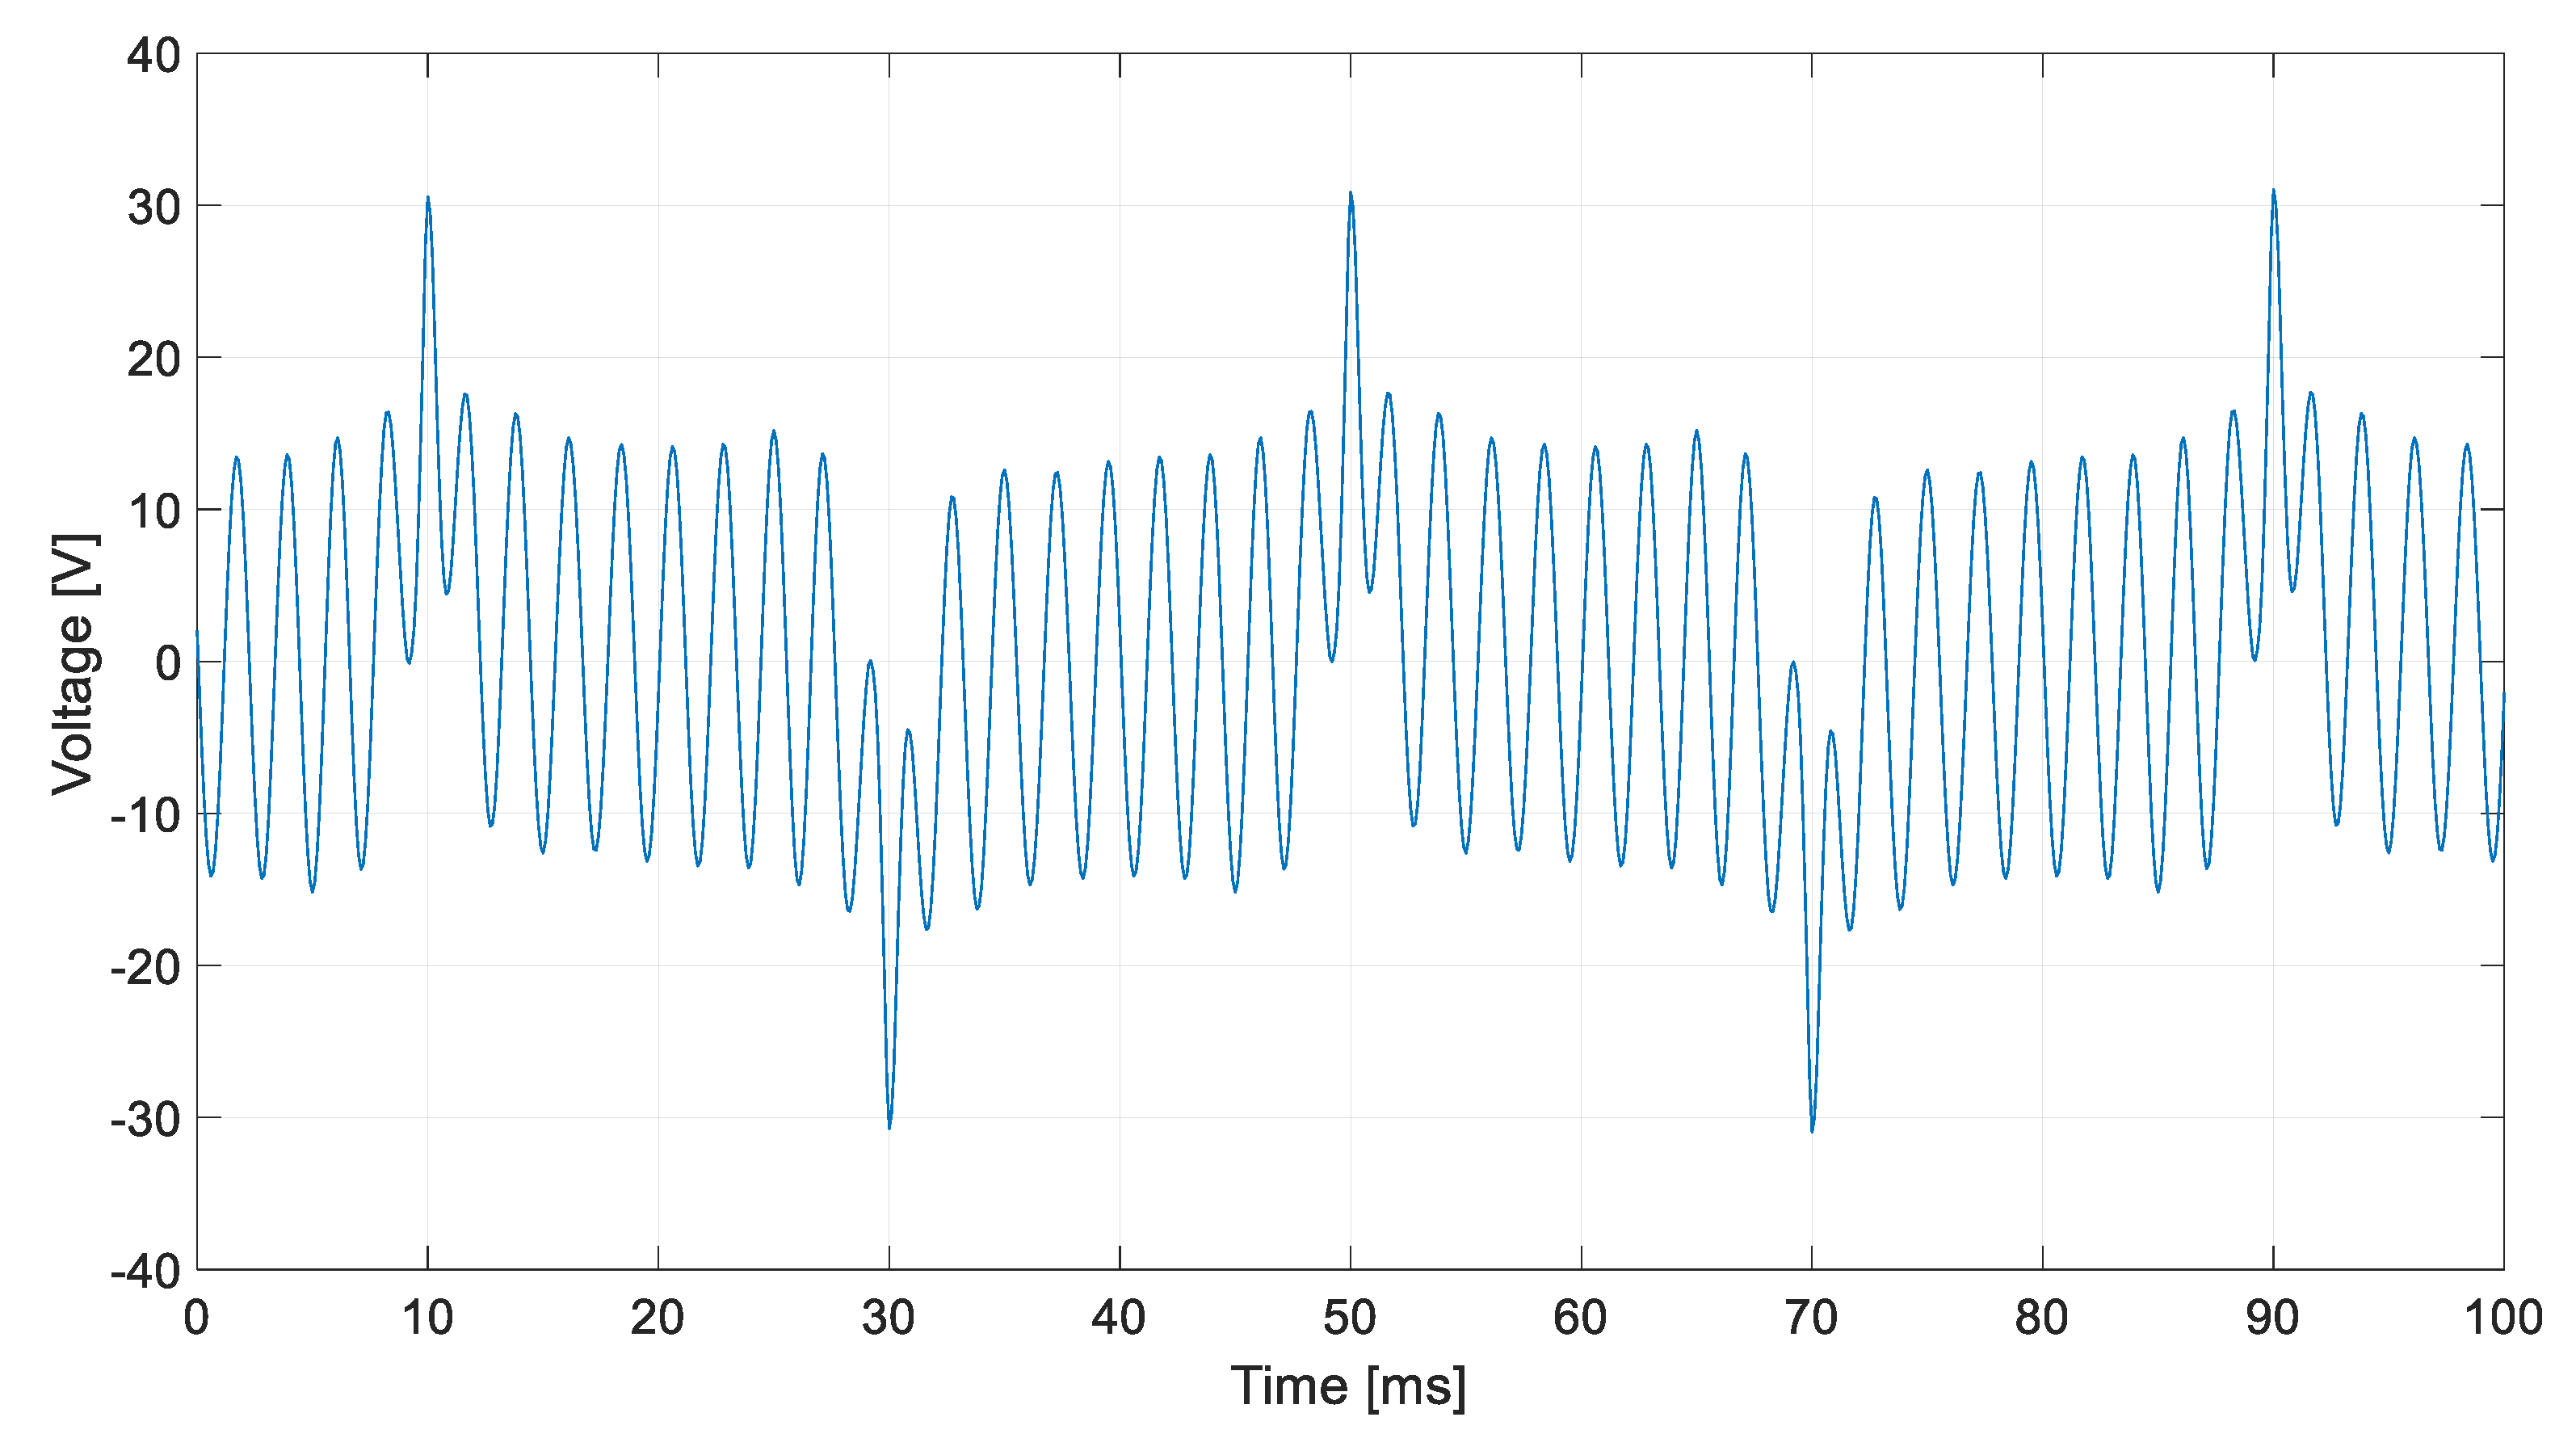
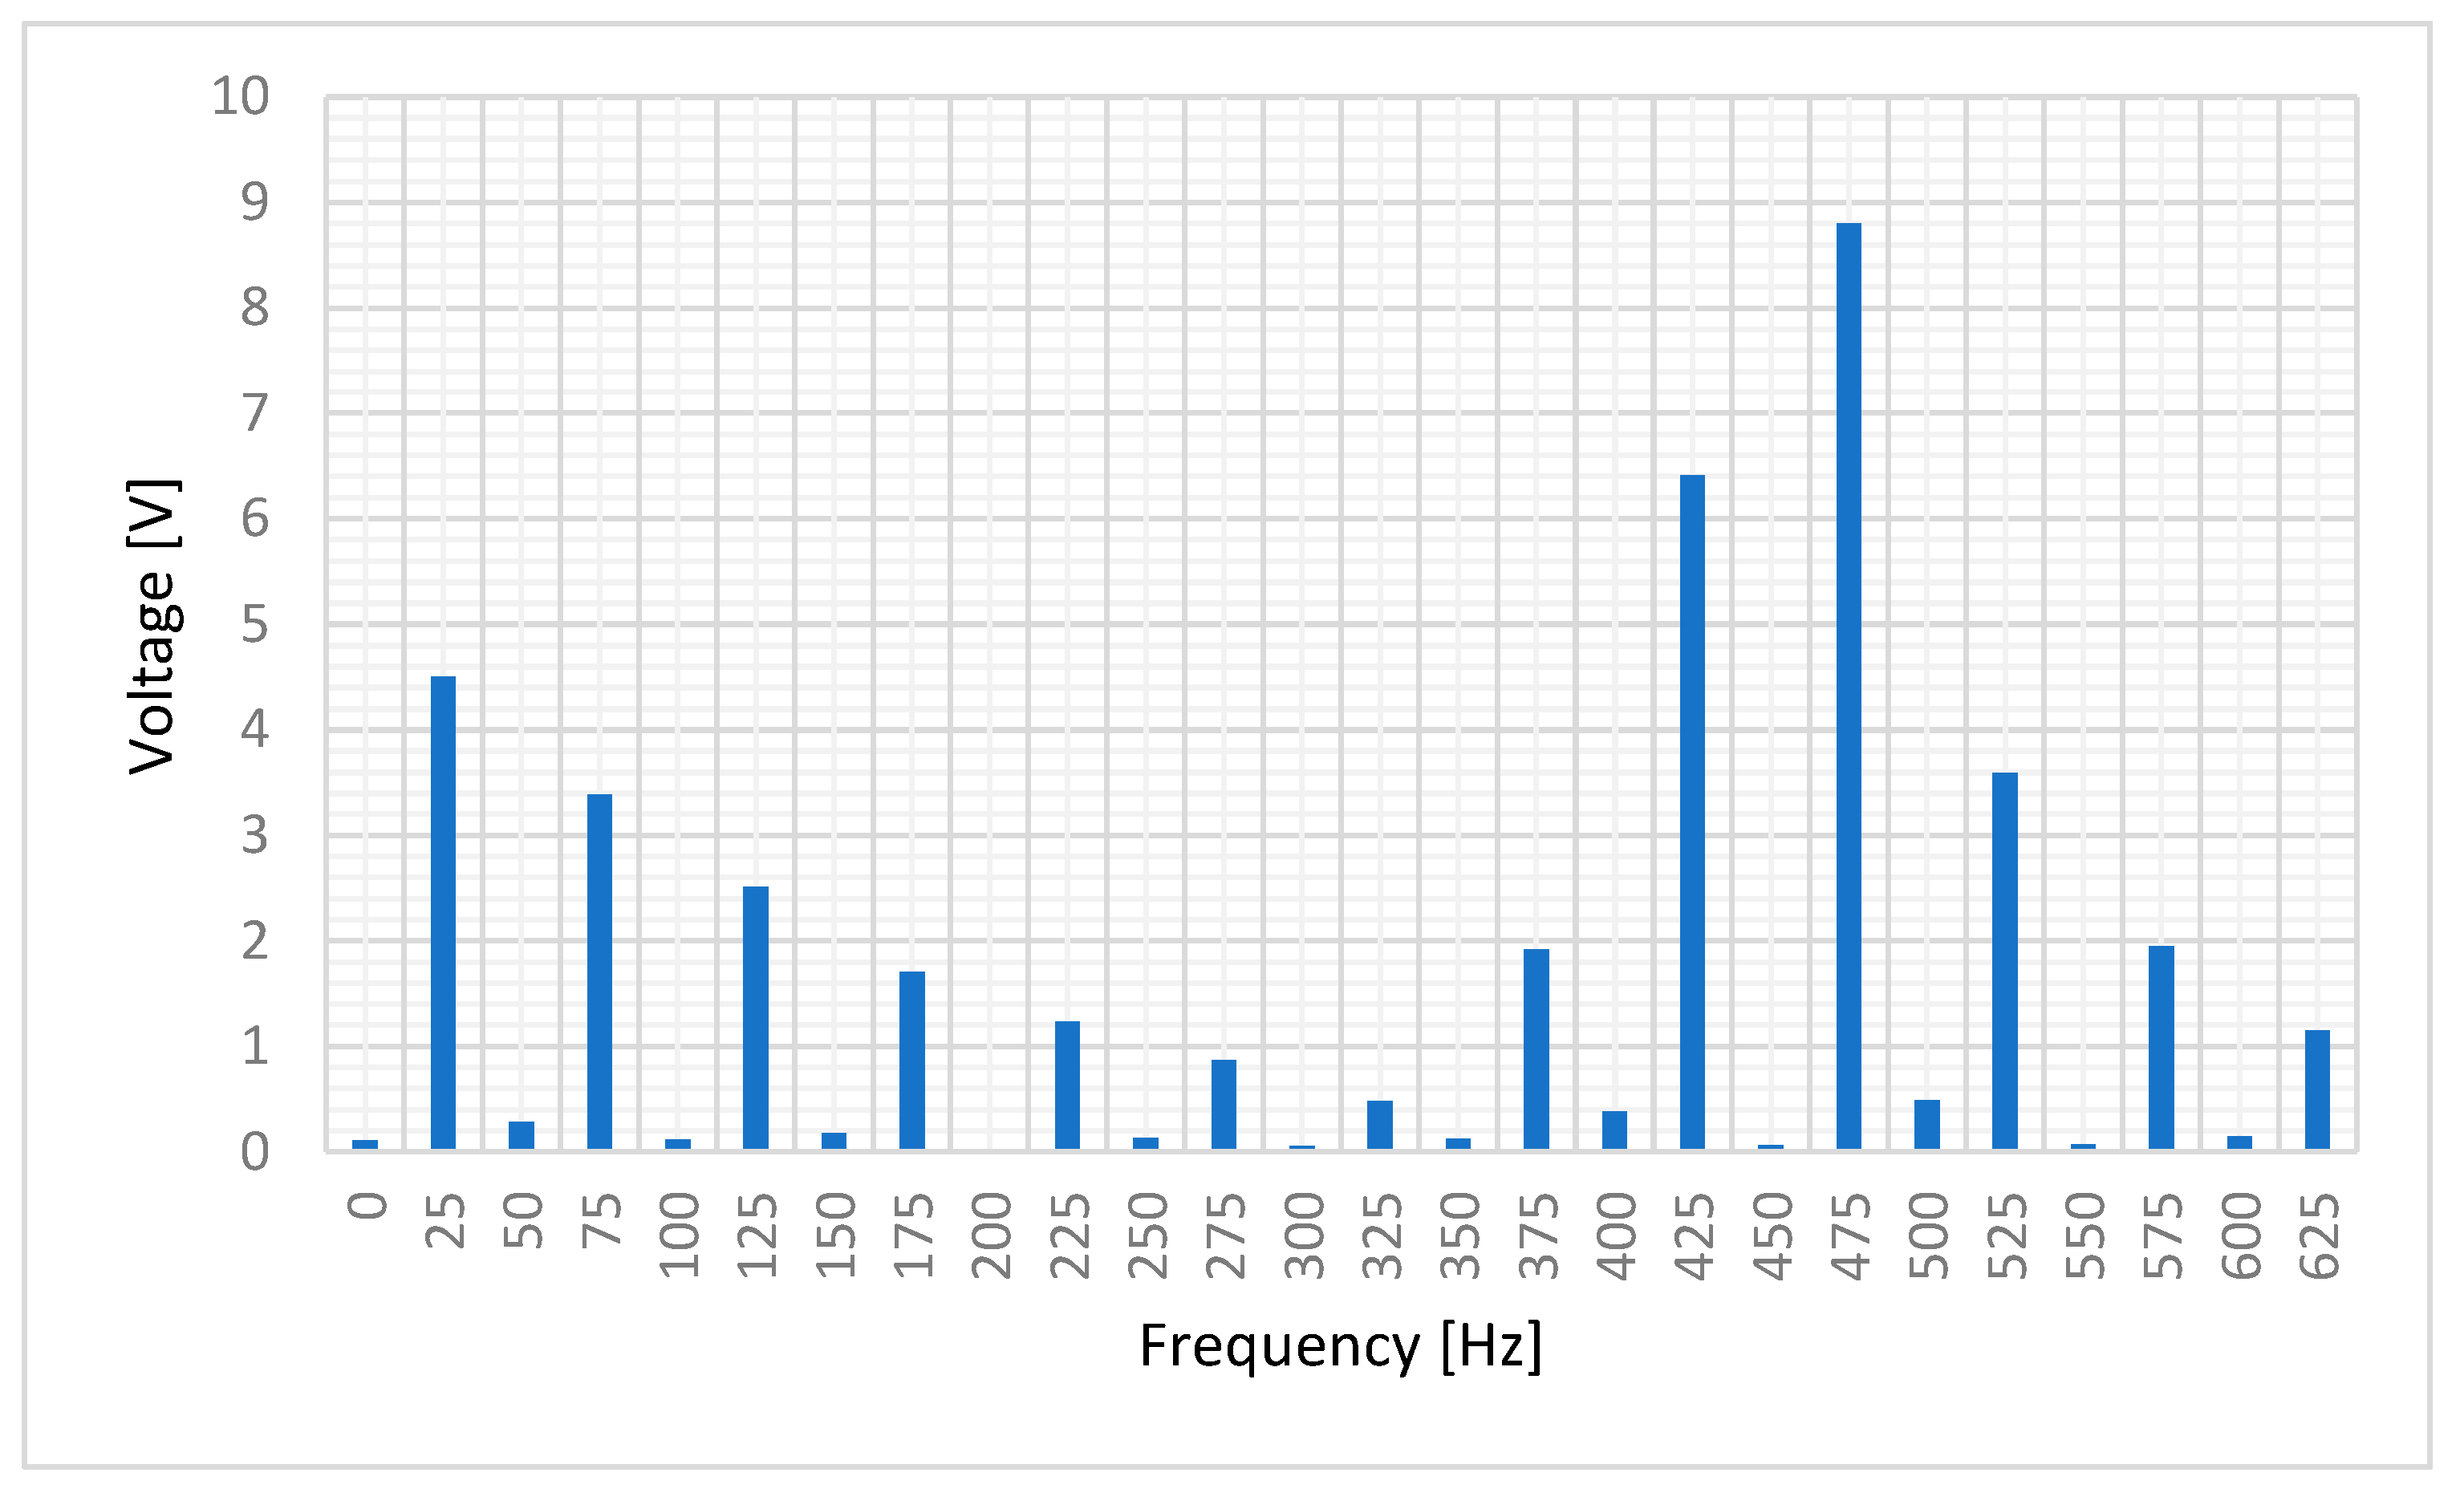
3.2.2. Experimental Tests AC Currents
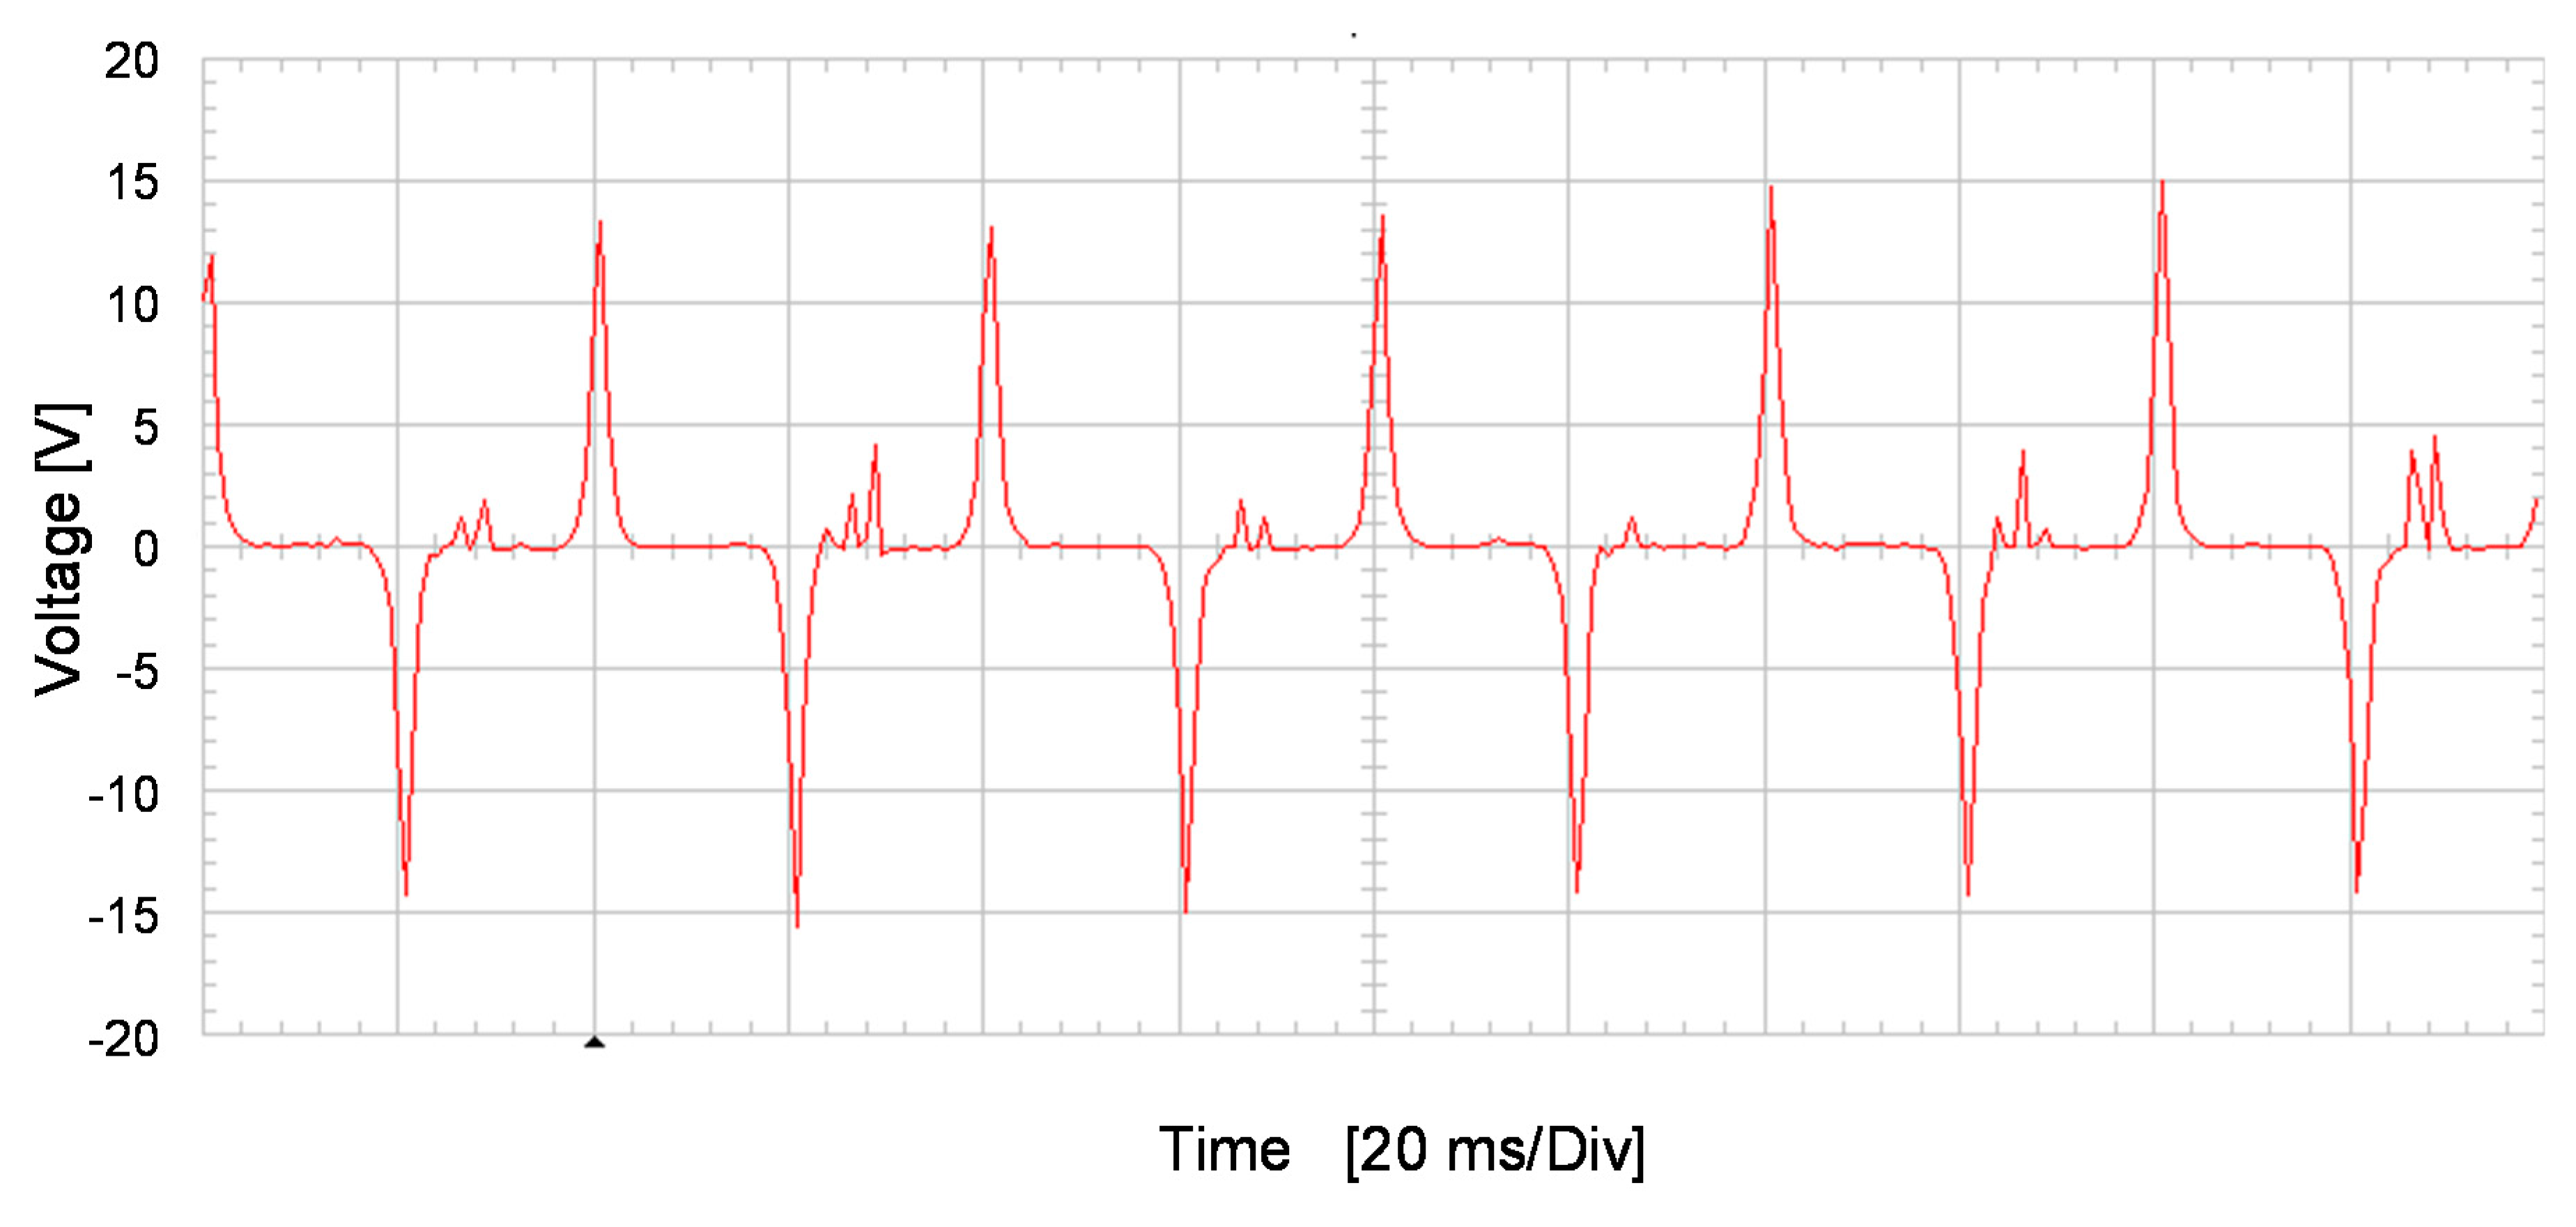
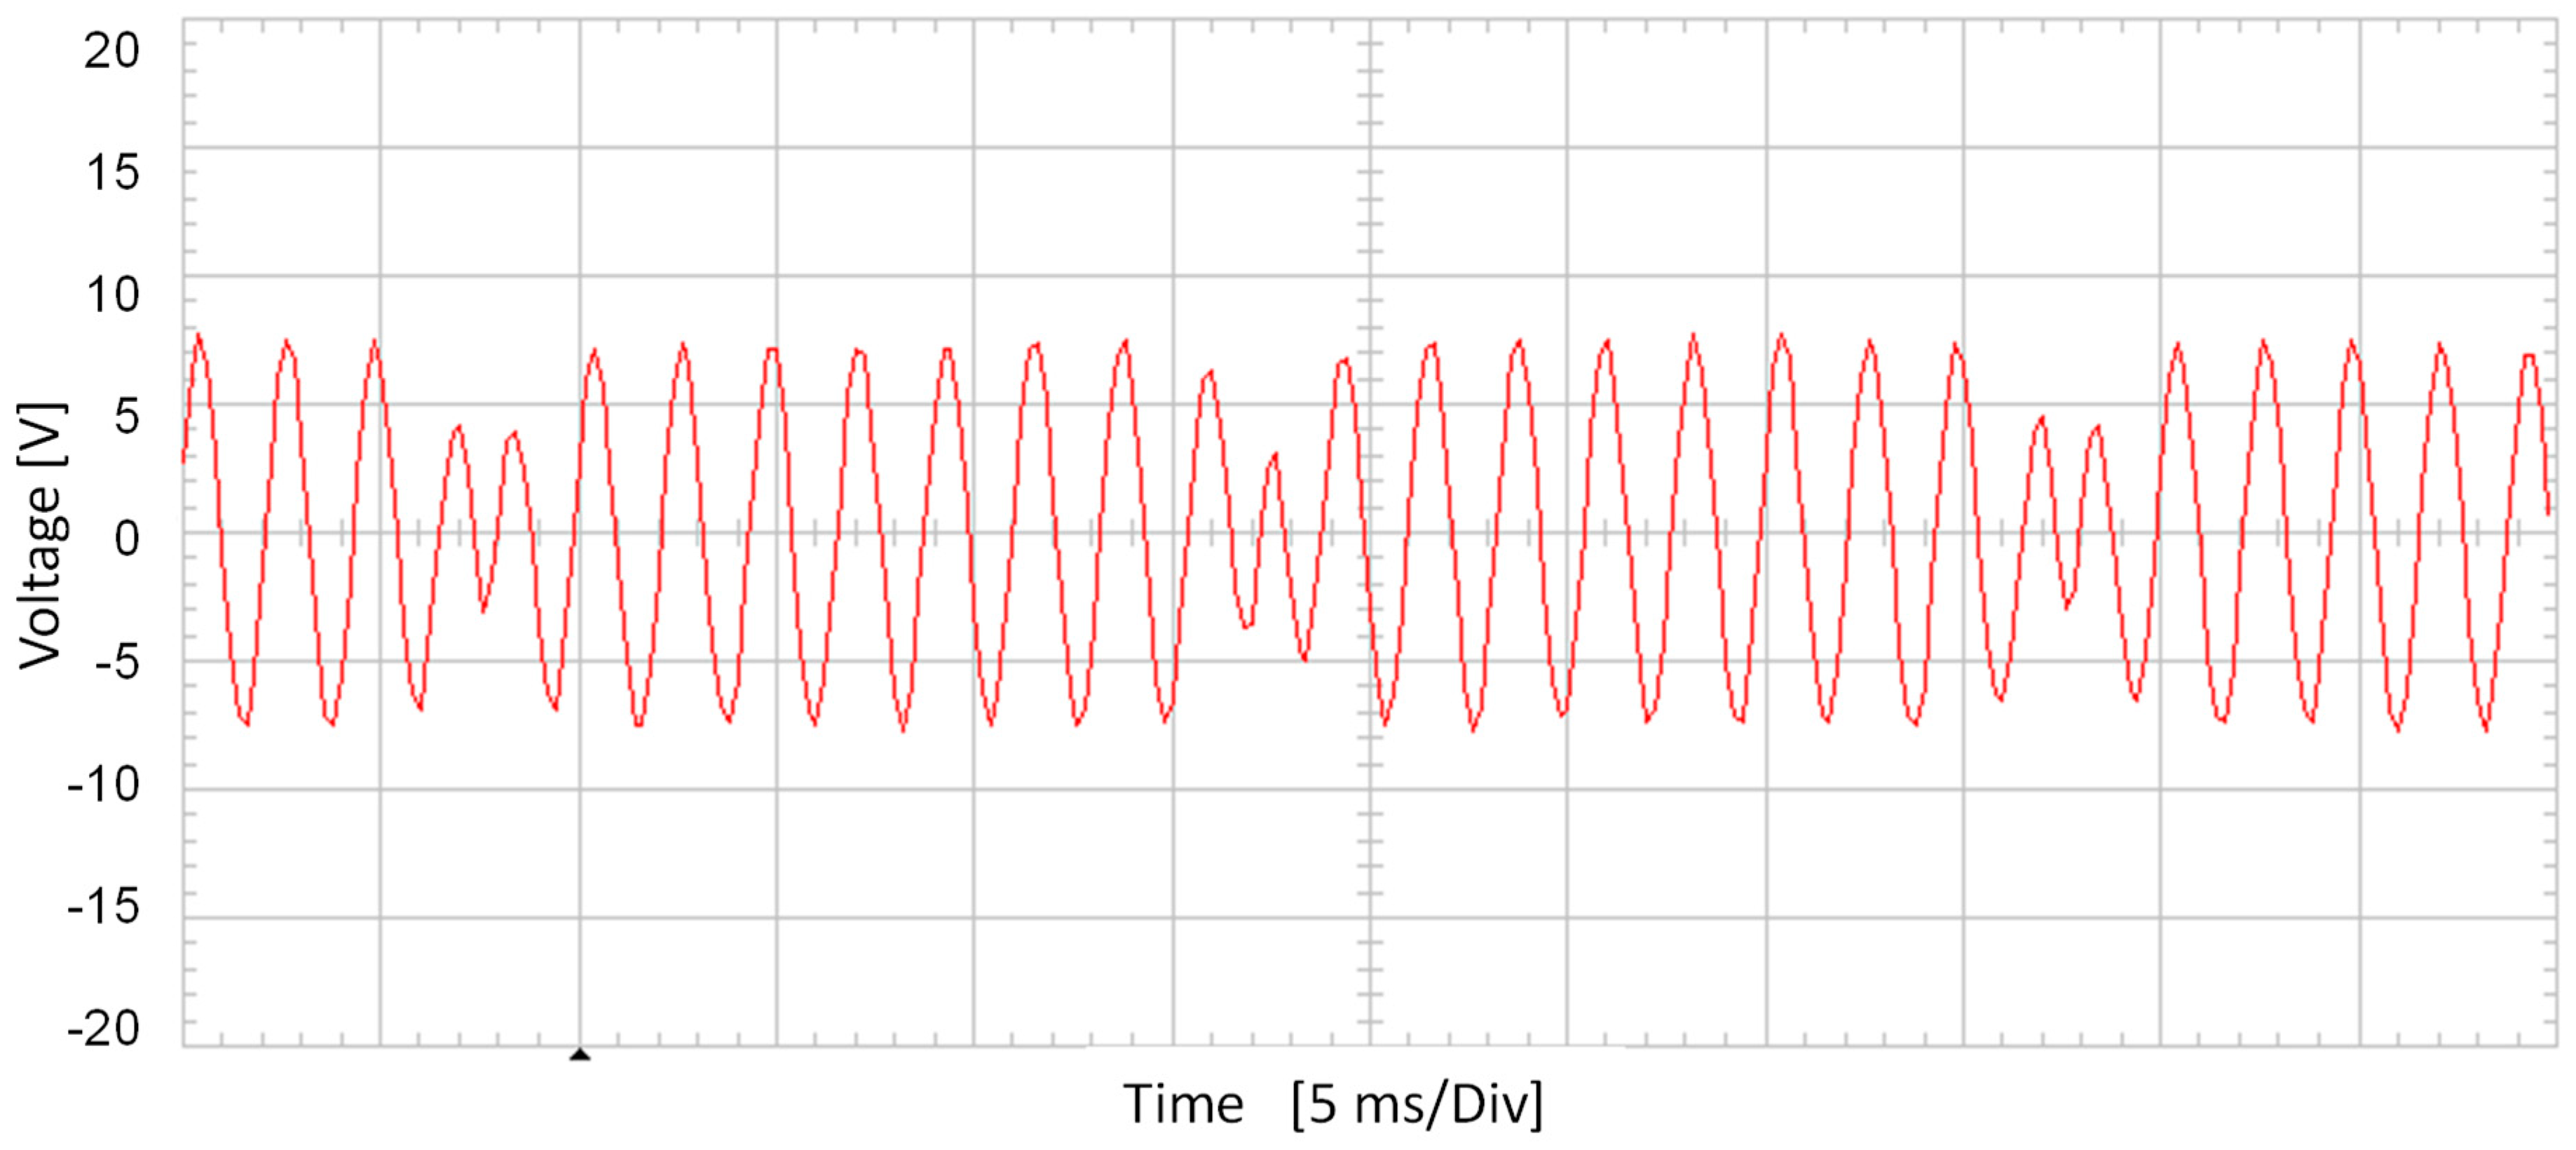
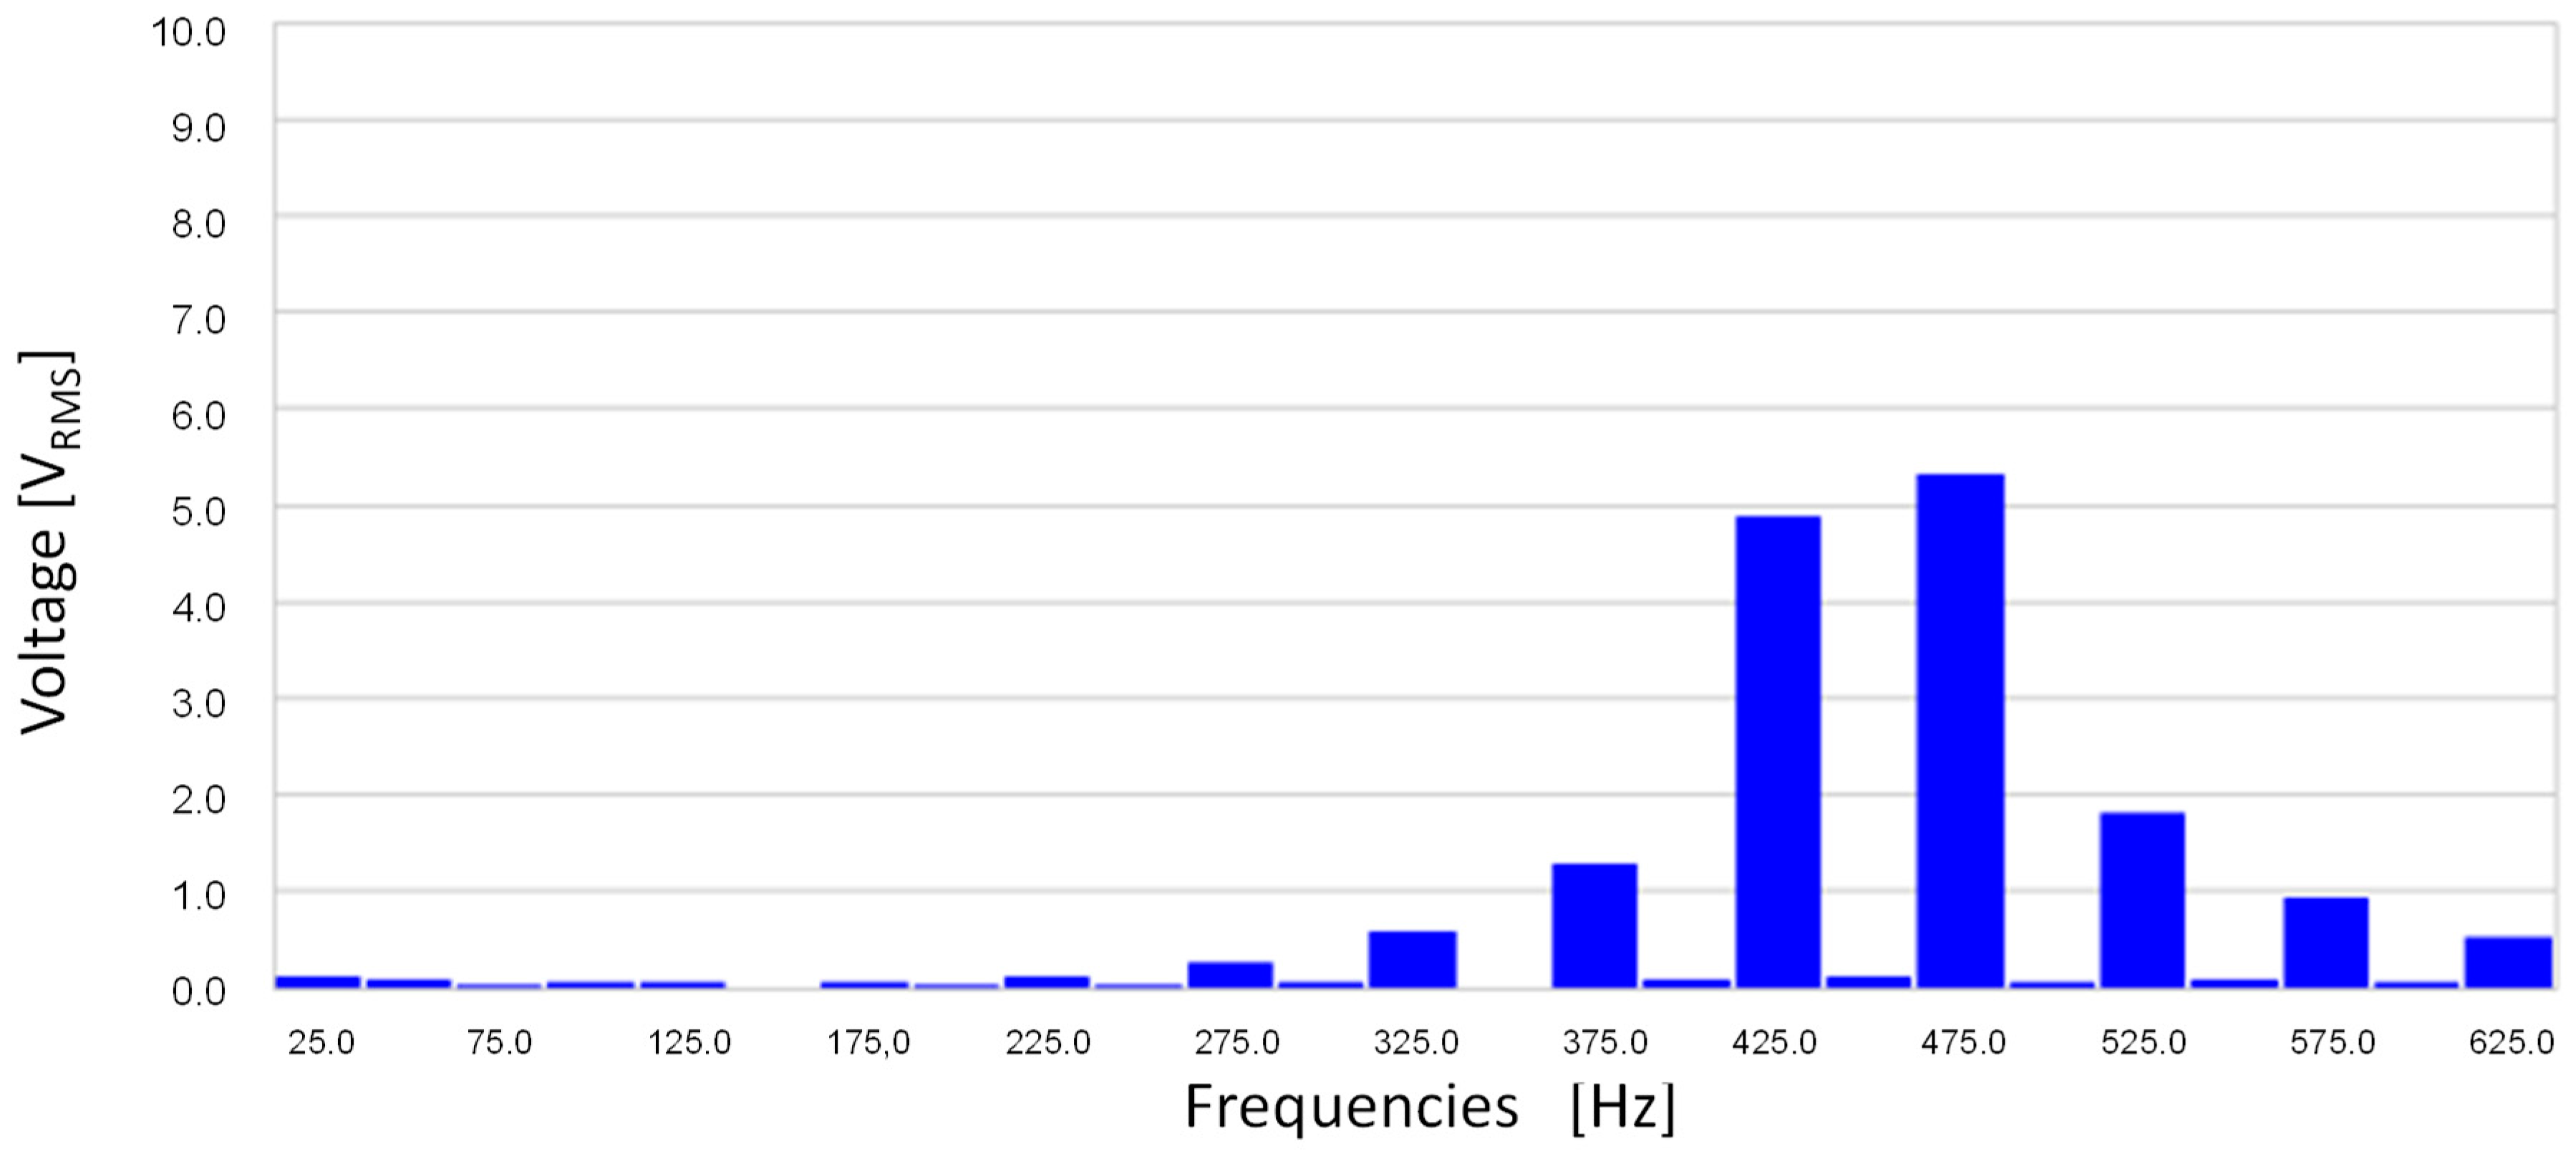
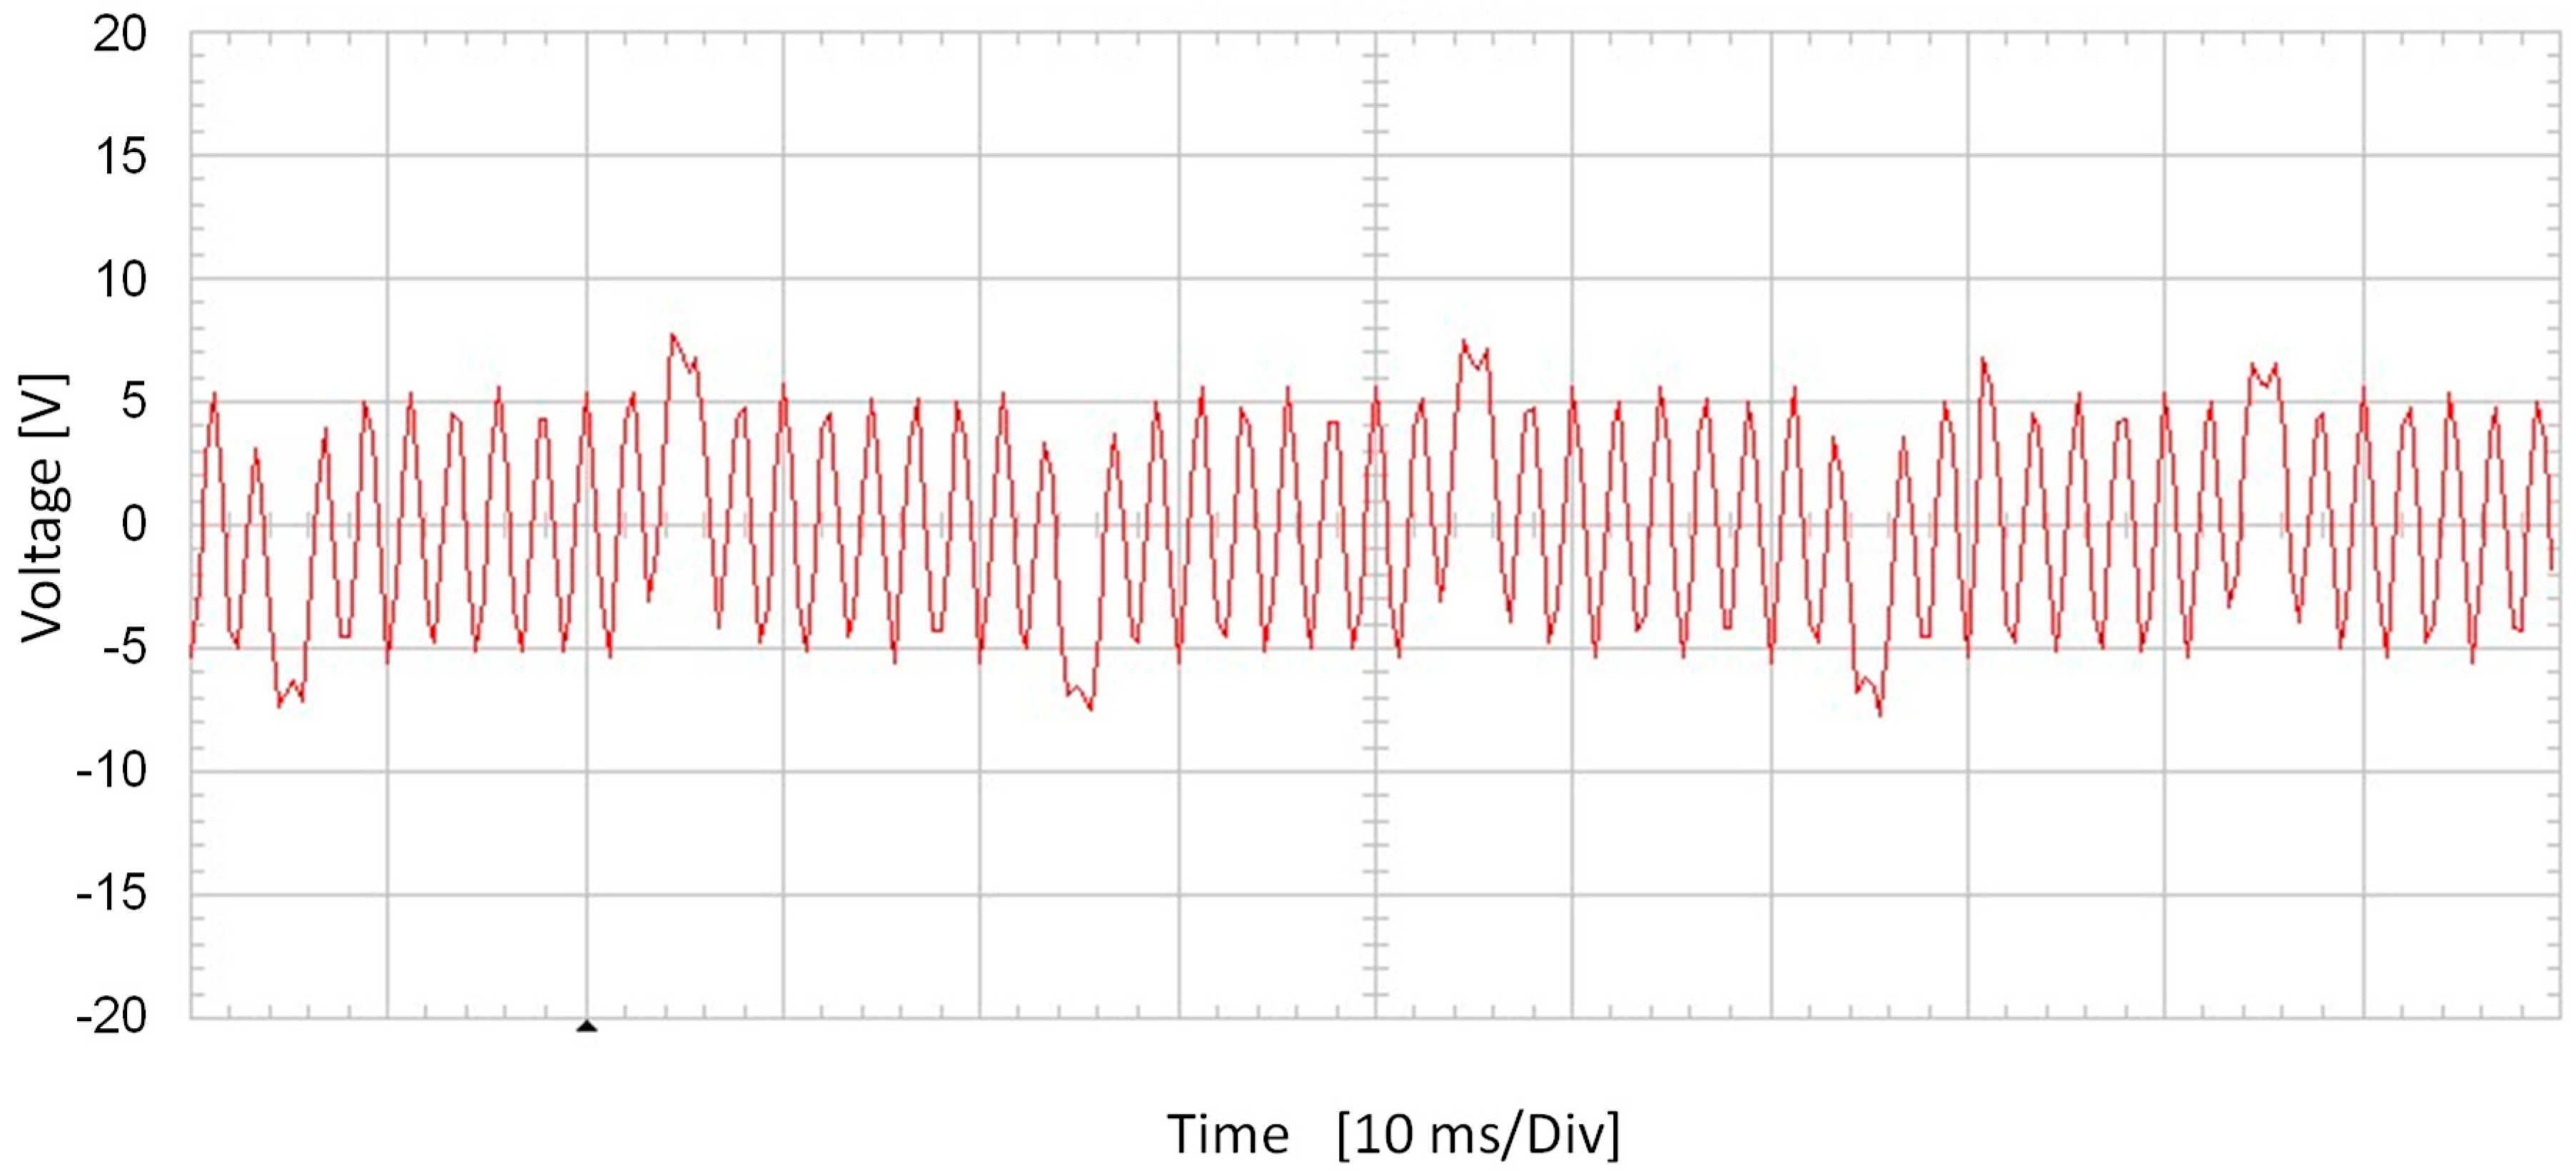
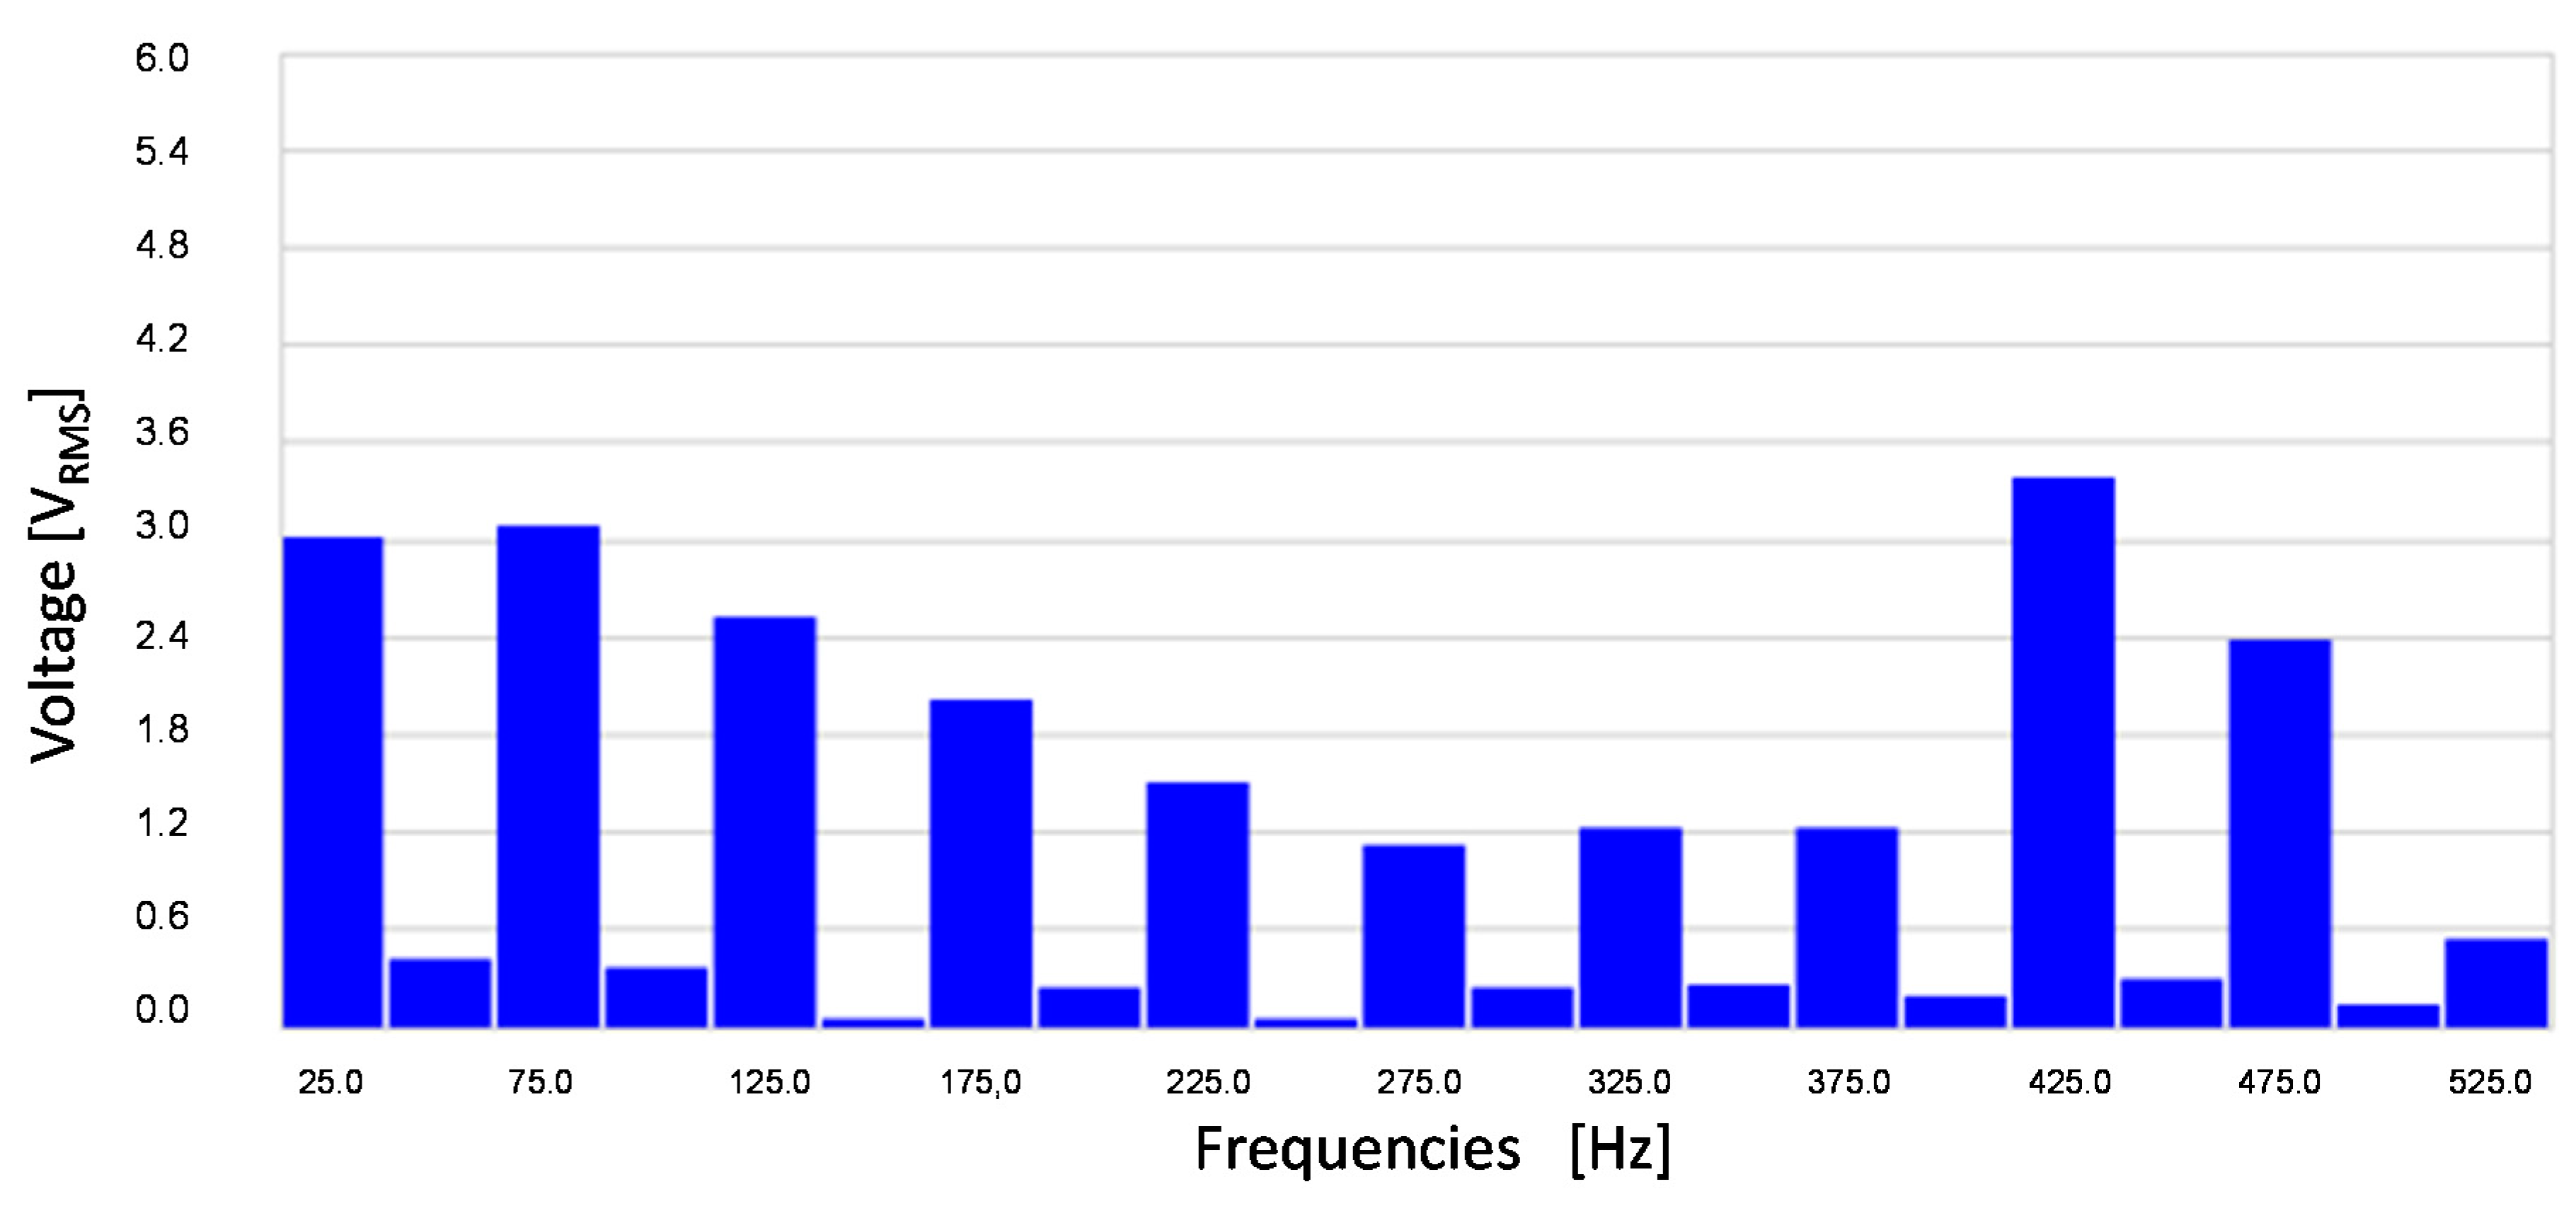
3.2.3. Experimental Tests DC + AC Currents
4. Discussion
- Input signal DC → Output signal AC at 25 Hz (due to rotor speed);
- Input signal AC → Output signal AC with main components at input signal frequency ±25 Hz;
- Input signal AC+DC → Output signal is the addition of the two previous cases. It has components at 25 Hz (and its odd harmonics) and main components at input signal AC frequency ±25 Hz.
5. Conclusions
Author Contributions
Funding
Acknowledgments
Conflicts of Interest
References
- Ziegler, S.; Woodward, R.C.; Iu, H.H.; Borle, L.J. Current Sensing Techniques: A Review. IEEE Sens. J. 2009, 9, 354–376. [Google Scholar] [CrossRef]
- Ouameur, M.; Ziade, F.; Le Bihan, Y. Toward a Calculable Standard Shunt for Current Measurements at 10 A and Up To 1 MHz. IEEE Trans. Instrum. Meas. 2019, 68, 2215–2222. [Google Scholar] [CrossRef]
- Baranov, M.I.; Kniaziev, V.V.; Rudakovb, S.V. The Coaxial Shunt for Measurement of Current Pulses of Artificial Lightning with the Amplitude up to ±220 kA. Instrum. Exp. Tech. 2018, 61, 501–505. [Google Scholar] [CrossRef]
- Weßkamp, P.; Melbert, J. High-accuracy current measurement with low-cost shunts by means of dynamic error correction. J. Sens. Sens. Syst. 2016, 5, 389–400. [Google Scholar] [CrossRef]
- Samimi, M.H.; Mahari, A.; Farahnakian, M.A.; Mohseni, H. The Rogowski coil principles and applications: A review. IEEE Sens. J. 2015, 15, 651–658. [Google Scholar] [CrossRef]
- Xu, M.; Yan, J.; Geng, Y.; Zhang, K.; Sun, C. Research on the Factors Influencing the Measurement Errors of the Discrete Rogowski Coil. Sensors 2018, 18, 847. [Google Scholar] [CrossRef]
- Kojovic, L. Rogowski coils suit relay protection and measurement. IEEE Comput. Appl. Power 1997, 10, 47–53. [Google Scholar] [CrossRef]
- Delzendehand, M.; Karegar, H.K. Current Transformer Saturation Compensator by Using Negative Voltage Feedback. IEEE Trans. Power Deliv. 2020, 35, 1200–1208. [Google Scholar] [CrossRef]
- Weng, H.; Wang, S.; Wan, Y.; Lin, X.; Li, Z.; Huang, J. Discrete Fréchet distance algorithm based criterion of transformer differential protection with the immunity to saturation of current transformer. Int. J. Electr. Power Energy Syst. 2020, 115, 105449. [Google Scholar] [CrossRef]
- Andreev, M.; Suvorov, A.; Ruban, N.; Ufa, R.; Gusev, A.; Askarov, A.; Kievets, A. Development and research of mathematical model of current transformer reproducing magnetic hysteresis based on Preisach theory. IET Gener. Transm. Distrib. 2020, 14, 2720–2730. [Google Scholar] [CrossRef]
- Biswal, S.; Biswal, M. Detection of current transformer saturation phenomenon for secured operation of smart power network. Electr. Power Syst. Res. 2019, 175, 105926. [Google Scholar] [CrossRef]
- Naseri, F.; Kazemi, Z.; Farjah, E.; Ghanbari, T. Fast Detection and Compensation of Current Transformer Saturation Using Extended Kalman Filter. IEEE Trans. Power Deliv. 2019, 34, 1087–1097. [Google Scholar] [CrossRef]
- Edward, R. Hall-Effect Sensors: Theory and Applications, 2nd ed.; Elsevier: Oxford, UK, 2006; pp. 33–41. [Google Scholar]
- Aiello, O. Hall-Effect Current Sensors Susceptibility to EMI: Experimental Study. Electronics 2019, 8, 1310. [Google Scholar] [CrossRef]
- Blagojević, M.; Jovanović, U.; Jovanović, I.; Mančić, D. Folded bus bar current transducer based on Hall effect sensor. Electr. Eng. 2018, 100, 1243–1251. [Google Scholar] [CrossRef]
- Yang, X.; Guo, W.; Li, C.; Zhu, B.; Chen, T.; Ge, W. Design Optimization of a Fluxgate Current Sensor with Low Interference. IEEE Trans. Appl. Supercond. 2016, 26. [Google Scholar] [CrossRef]
- Ponjavic, M.M.; Duric, R.M. Nonlinear Modeling of the Self-Oscillating Fluxgate Current Sensor. IEEE Sens. J. 2007, 7, 1546–1553. [Google Scholar] [CrossRef]
- Nibir, S.J.; Hurwitz, E.; Karami, M.; Parkhideh, B. A Technique to Enhance the Frequency Bandwidth of Contactless Magnetoresistive Current Sensors. IEEE Trans. Ind. Electron. 2016, 63, 5682–5686. [Google Scholar] [CrossRef]
- Yang, X.; Xie, C.; Wang, Y.; Wang, Y.; Yang, W.; Dong, G. Optimization Design of a Giant Magneto Resistive Effect Based Current Sensor with a Magnetic Shielding. IEEE Trans. Appl. Supercond. 2014, 24. [Google Scholar] [CrossRef]
- Asfour, A.; Nabias, J.; Traoré, J.P.; Yonnet, J.P. Practical Use of the GMI Effect to Make a Current Sensor. IEEE Trans. Magn. 2019, 55. [Google Scholar] [CrossRef]
- García-Vidal, E.; Ramírez-Muñoz, D.; Ravelo-Arias, S.I.; Sánchez-Moreno, J.; Cardoso, S.; Ferreira, R.; Freitas, P. Electronic Energy Meter Based on a Tunnel Magnetoresistive Effect (TMR) Current Sensor. Materials 2017, 10, 1134. [Google Scholar] [CrossRef]
- Wang, R.; Xu, S.; Li, W.; Wang, X. Optical fiber current sensor research: Review and outlook. Opt. Quantum Electron. 2016, 48, 442. [Google Scholar] [CrossRef]
- Müller, G.M.; Frank, A.; Yang, L.; Gu, X.; Bohnert, K. Temperature Compensation of Interferometric and Polarimetric Fiber-Optic Current Sensors With Spun Highly Birefringent Fiber. J. Lightwave Technol. 2019, 37, 4507–4513. [Google Scholar] [CrossRef]
- Ripka, P. Electric current sensors: A review. Meas. Sci. Technol. 2010, 21. [Google Scholar] [CrossRef]
- Krause, P.C.; Wasynczuk, O.; Sudhohh, S.D.; Pekarek, S. Analysis of Electric Machinery and Drive Systems, 3rd ed.; Wiley-IEEE Press: Piscataway, NJ, USA, 2013; pp. 142–214. [Google Scholar]
- Nuzzo, S.; Galea, M.; Gerada, C.; Brown, N. Analysis, Modeling, and Design Considerations for the Excitation Systems of Synchronous Generators. IEEE Trans. Ind. Electron. 2018, 65, 2996–3007. [Google Scholar] [CrossRef]
- Rebollo, E.; Platero, C.A.; Blazquez, F.; Granizo, R. Internal sudden short-circuit response of a new HSBDS for brushless synchronous machines tested on a 15 MVA generator. IET Electr. Power Appl. 2017, 11, 495–503. [Google Scholar] [CrossRef]
- Kjaer, P.C.; Kjellqvist, T.; Delaloye, C. Estimation of Field Current in Vector-Controlled Synchronous Machine Variable-Speed Drives Employing Brushless Asynchronous Exciters. IEEE Trans. Ind. Appl. 2005, 41, 834–840. [Google Scholar] [CrossRef]
- Fonseca, J.S.; Coelho, C.U.; Bortoni, E.C. Wireless Sensor for Field Quantities Measurement in Brushless Synchronous Machines. In Proceedings of the IEEE Power & Energy Society General Meeting, Chicago, IL, USA, 16–20 July 2017; pp. 1–5. [Google Scholar] [CrossRef]
- Chubraeva, L.; Evseev, E.; Timofeev, S. Contactless system of excitation current measurement in the windings with high inductance. In Proceedings of the International Conference on Actual Problem of Electromechanics and Electrotechnology (APEET), Ural Federal University, Yekaterinburg, Russia, 13–16 November 2017. [Google Scholar] [CrossRef]
- Kindl, V.; Hajzman, M. Identification of harmful time harmonic interactions in a high power squirrel-cage traction machine. Appl. Math. Modell. 2014, 38, 6153–6169. [Google Scholar] [CrossRef]
- Platero, C.A.; Sánchez-Fernández, J.A.; Gyftakis, K.N.; Blazquez, F.; Granizo, R. Performance Problems of Non-Toroidal Shaped Current Transformers. Sensors 2020, 20, 3025. [Google Scholar] [CrossRef]
- Zhang, Q.; Jia, Z.; Cheng, S.; Wang, D. Analysis and Calculation of Radial Electromagnetic Force of Circular Winding Brushless DC Motor. IEEE Trans. Ind. Electron. 2020, 67, 4338–4349. [Google Scholar] [CrossRef]


| Variable | Value |
|---|---|
| Number of field poles | 2 |
| Number of armature poles | 2 |
| Number of turns of field winding | 1000 |
| Number of turns of armature winding | 3000 |
| Rated speed | 1500 rpm |
| Wires section | 0.096 mm2 |
| Rotor diameter | 122.5 mm |
| Air gap | 0.5 mm |
| Machine length | 170 mm |
| Machine weight | 3.5 kg |
| IR (mA) | 0.7 | 0.9 | 1.5 | 2.0 | 2.5 | 3.1 | 3.6 | 4.3 | 4.85 | 5.25 | 5.75 | 6.2 | 6.8 | 7.3 | 7.75 | 8.5 | 9.1 | 10 |
| VS (V) | 2.1 | 2.7 | 4.5 | 6.2 | 7.5 | 9.3 | 11.0 | 12.9 | 14.6 | 15.8 | 17.3 | 18.6 | 20.4 | 21.9 | 23.3 | 25.5 | 27.3 | 30.0 |
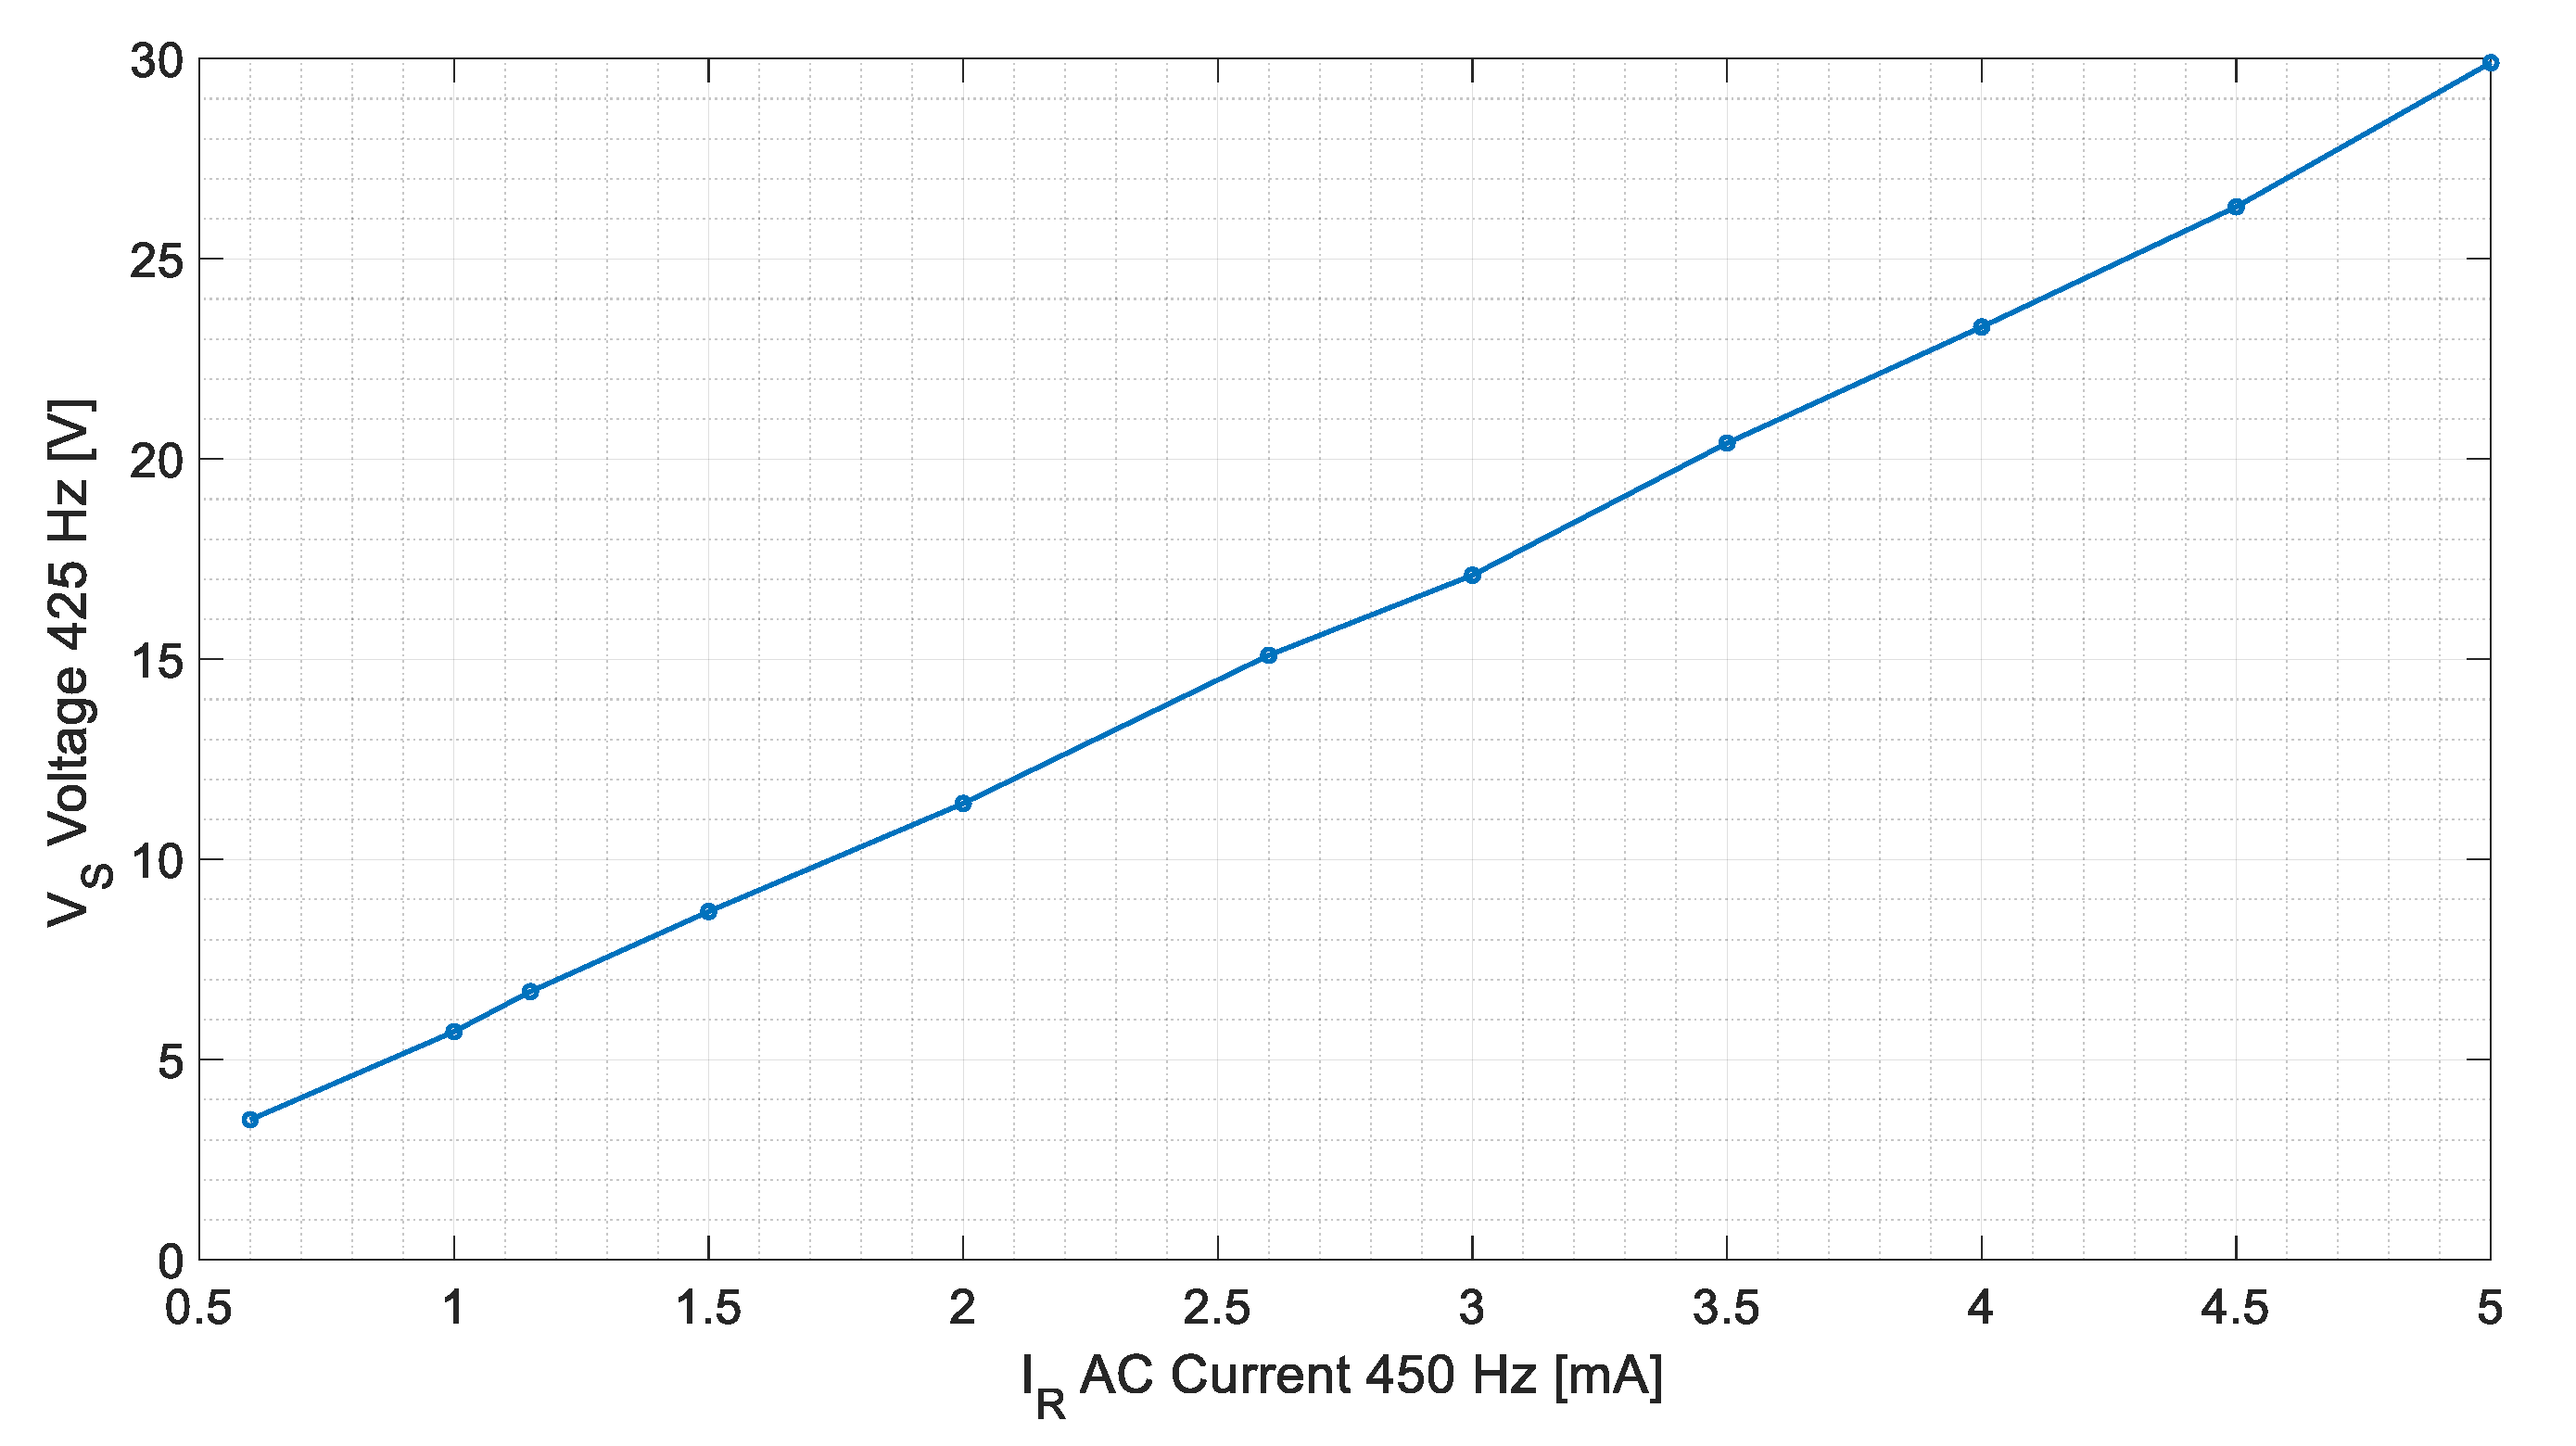
| IR (mA) | 0.6 | 1.0 | 1.15 | 1.5 | 2.0 | 2.6 | 3.0 | 3.5 | 4.0 | 4.5 | 5.0 |
| VS (425 Hz) | 3.5 | 5.7 | 6.7 | 8.7 | 11.4 | 15.1 | 17.1 | 20.4 | 23.3 | 26.3 | 29.9 |
| (a) | ||||||||||||
| Idc (mA) | 1.25 | 1.30 | 1.35 | 1.50 | 1.50 | 1.50 | 1.50 | 1.50 | 1.50 | 1.50 | 1.50 | 1.50 |
| Iac (mA) | 0.60 | 0.65 | 0.70 | 0.75 | 0.80 | 0.83 | 0.95 | 1.10 | 1.15 | 1.30 | 1.40 | 1.45 |
| VS 25 Hz (V) | 3.60 | 3.85 | 4.00 | 4.50 | 4.50 | 4.50 | 4.50 | 4.50 | 4.50 | 4.50 | 4.50 | 4.50 |
| VS 425 Hz (V | 3.49 | 3.75 | 4.10 | 4.40 | 4.70 | 4.85 | 5.30 | 6.40 | 6.70 | 7.60 | 8.20 | 8.40 |
| (b) | ||||||||||||
| Idc (mA) | 2.75 | 2.85 | 3.00 | 3.00 | 3.00 | 3.00 | 3.00 | 3.00 | 3.00 | 3.00 | 3.15 | 3.20 |
| Iac (mA) | 0.60 | 0.65 | 0.70 | 0.75 | 0.80 | 0.90 | 1.00 | 1.15 | 1.25 | 1.30 | 1.40 | 1.45 |
| VS 25 Hz (V) | 8.20 | 8.40 | 8.90 | 8.90 | 8.90 | 8.90 | 8.90 | 8.90 | 8.90 | 8.90 | 9.50 | 9.50 |
| VS 425 Hz (V) | 3.50 | 3.70 | 4.00 | 4.37 | 4.66 | 5.10 | 5.70 | 6.70 | 7.10 | 7.58 | 8.30 | 8.60 |
| (c) | ||||||||||||
| Idc (mA) | 5.00 | 5.00 | 5.00 | 5.05 | 5.15 | 5.15 | 5.15 | 5.15 | 5.15 | 5.15 | 5.15 | |
| Iac (mA) | 0.60 | 0.70 | 0.80 | 0.90 | 1.00 | 1.10 | 1.15 | 1.25 | 1.30 | 1.40 | 1.45 | |
| VS 25 Hz (V) | 14.50 | 14.50 | 14.50 | 15.60 | 15.70 | 15.70 | 15.70 | 15.70 | 15.70 | 15.70 | 15.70 | |
| VS 425 Hz (V) | 3.50 | 4.08 | 4.68 | 5.12 | 5.75 | 6.60 | 6.70 | 7.15 | 7.60 | 8.40 | 8.65 | |
Publisher’s Note: MDPI stays neutral with regard to jurisdictional claims in published maps and institutional affiliations. |
© 2020 by the authors. Licensee MDPI, Basel, Switzerland. This article is an open access article distributed under the terms and conditions of the Creative Commons Attribution (CC BY) license (http://creativecommons.org/licenses/by/4.0/).
Share and Cite
Pardo-Vicente, M.A.; Platero, C.A.; Sánchez-Fernández, J.Á.; Blázquez, F. AC/DC Current Sensor for Rotating Applications. Sensors 2020, 20, 6811. https://doi.org/10.3390/s20236811
Pardo-Vicente MA, Platero CA, Sánchez-Fernández JÁ, Blázquez F. AC/DC Current Sensor for Rotating Applications. Sensors. 2020; 20(23):6811. https://doi.org/10.3390/s20236811
Chicago/Turabian StylePardo-Vicente, Miguel Angel, Carlos A. Platero, José Ángel Sánchez-Fernández, and Francisco Blázquez. 2020. "AC/DC Current Sensor for Rotating Applications" Sensors 20, no. 23: 6811. https://doi.org/10.3390/s20236811
APA StylePardo-Vicente, M. A., Platero, C. A., Sánchez-Fernández, J. Á., & Blázquez, F. (2020). AC/DC Current Sensor for Rotating Applications. Sensors, 20(23), 6811. https://doi.org/10.3390/s20236811