Design Implementation and Evaluation of a Mobile Continuous Blood Oxygen Saturation Monitoring System

Abstract
1. Introduction
2. Methods
2.1. Human Study
2.2. Data Recording Equipment
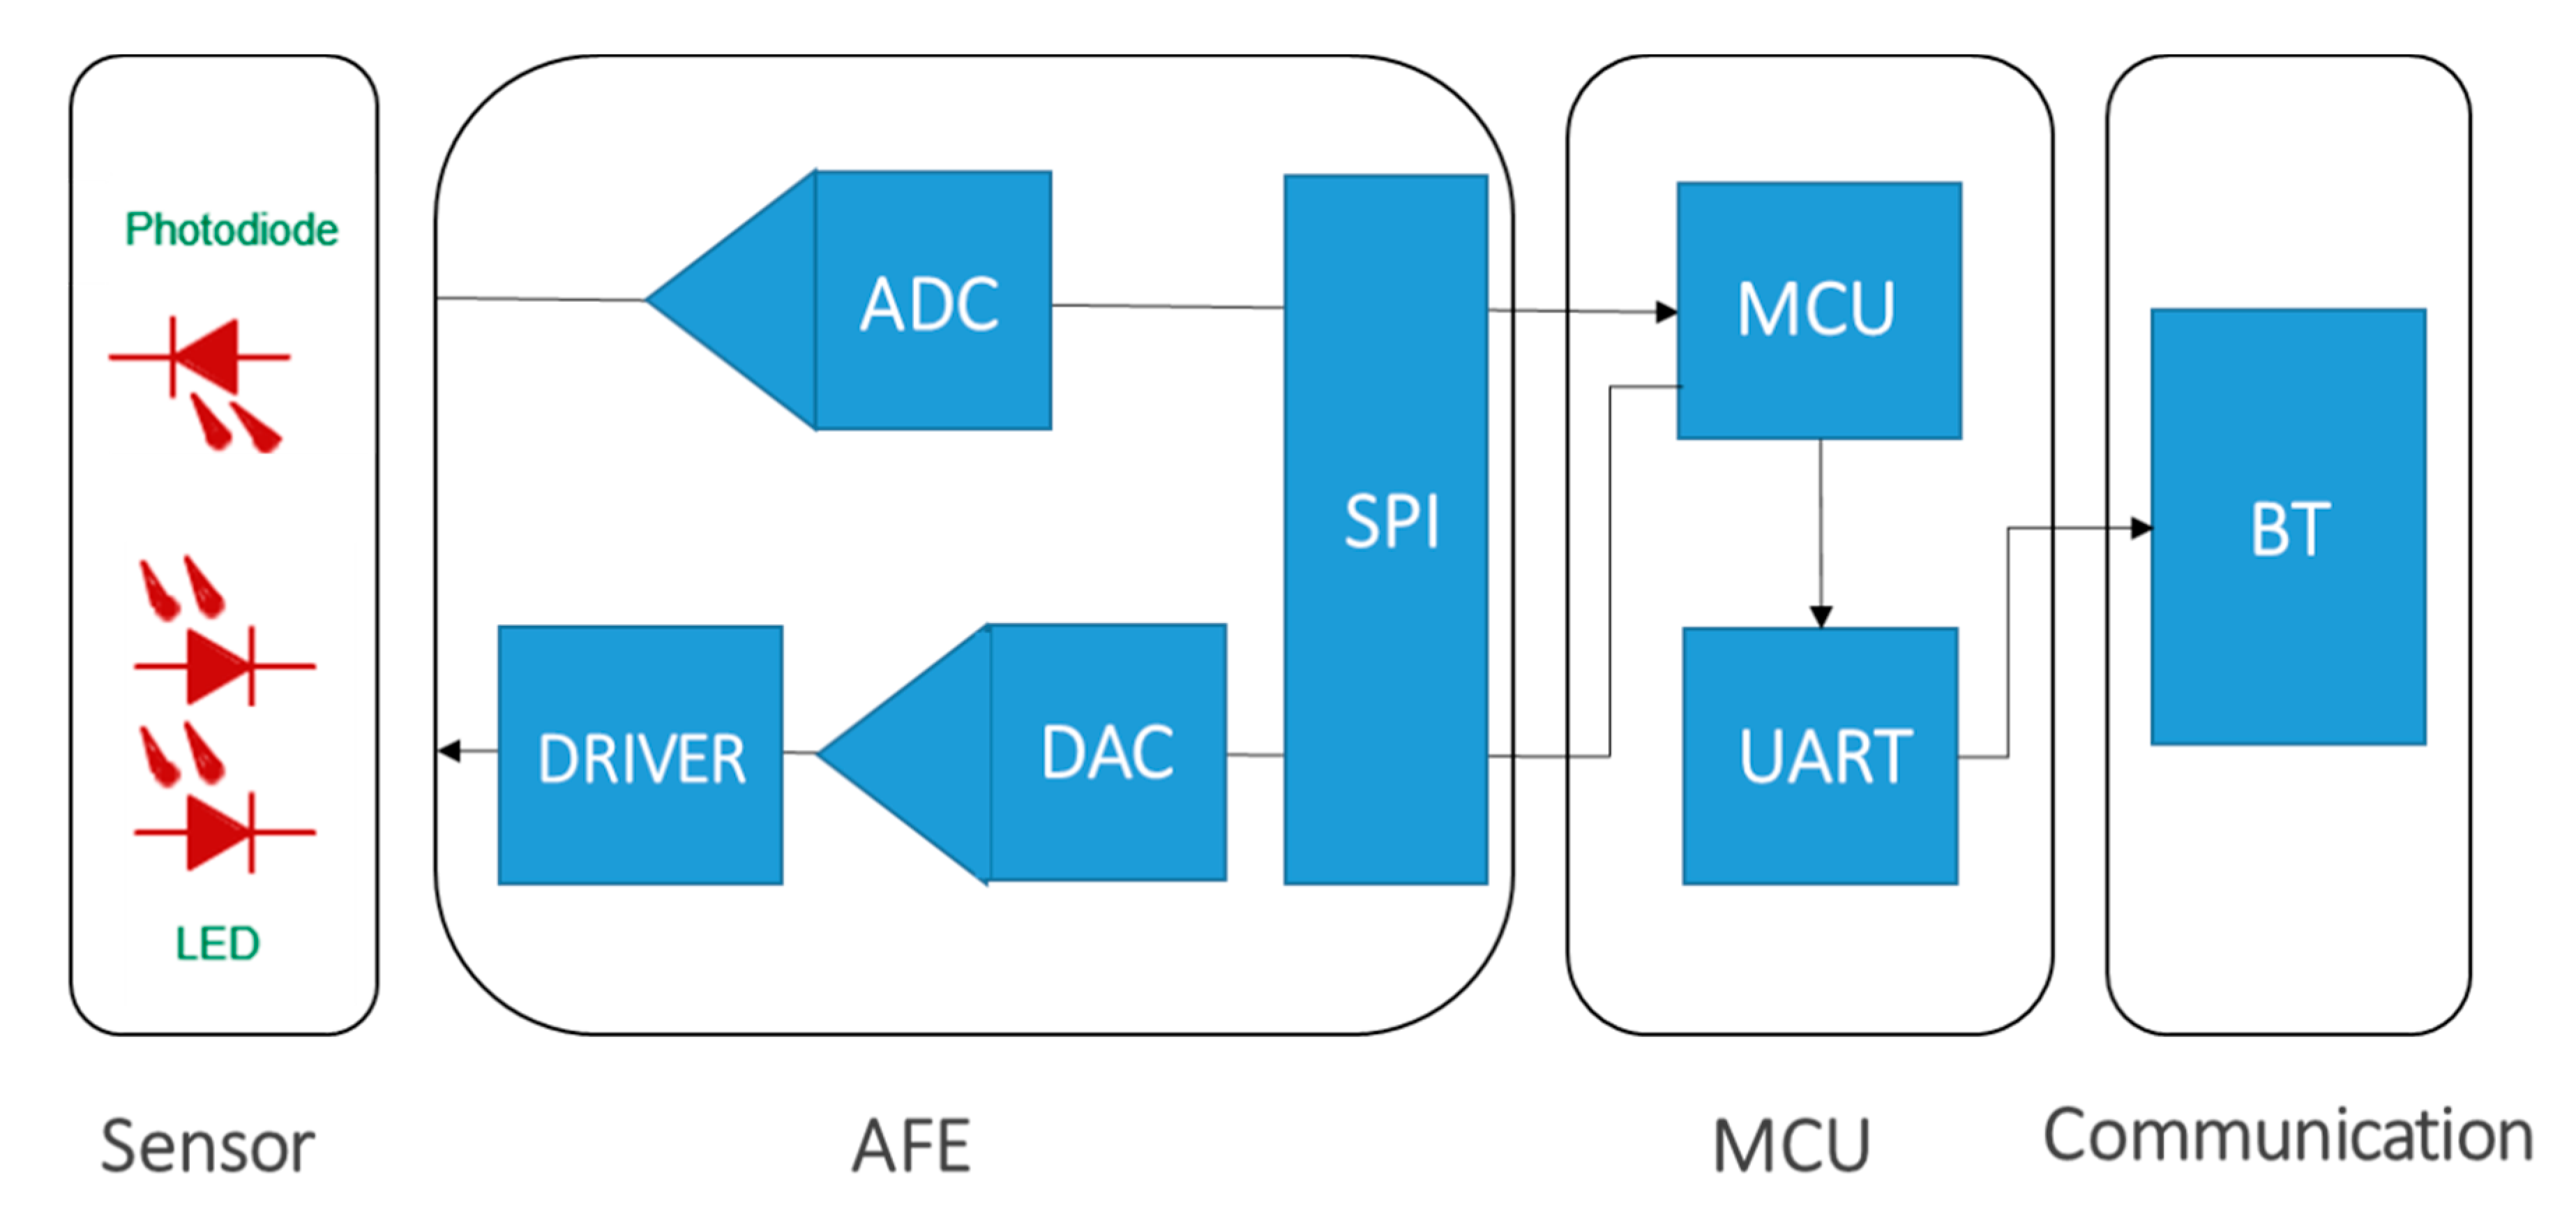
2.3. Wearable Prototyping for Wireless Optical Sensing
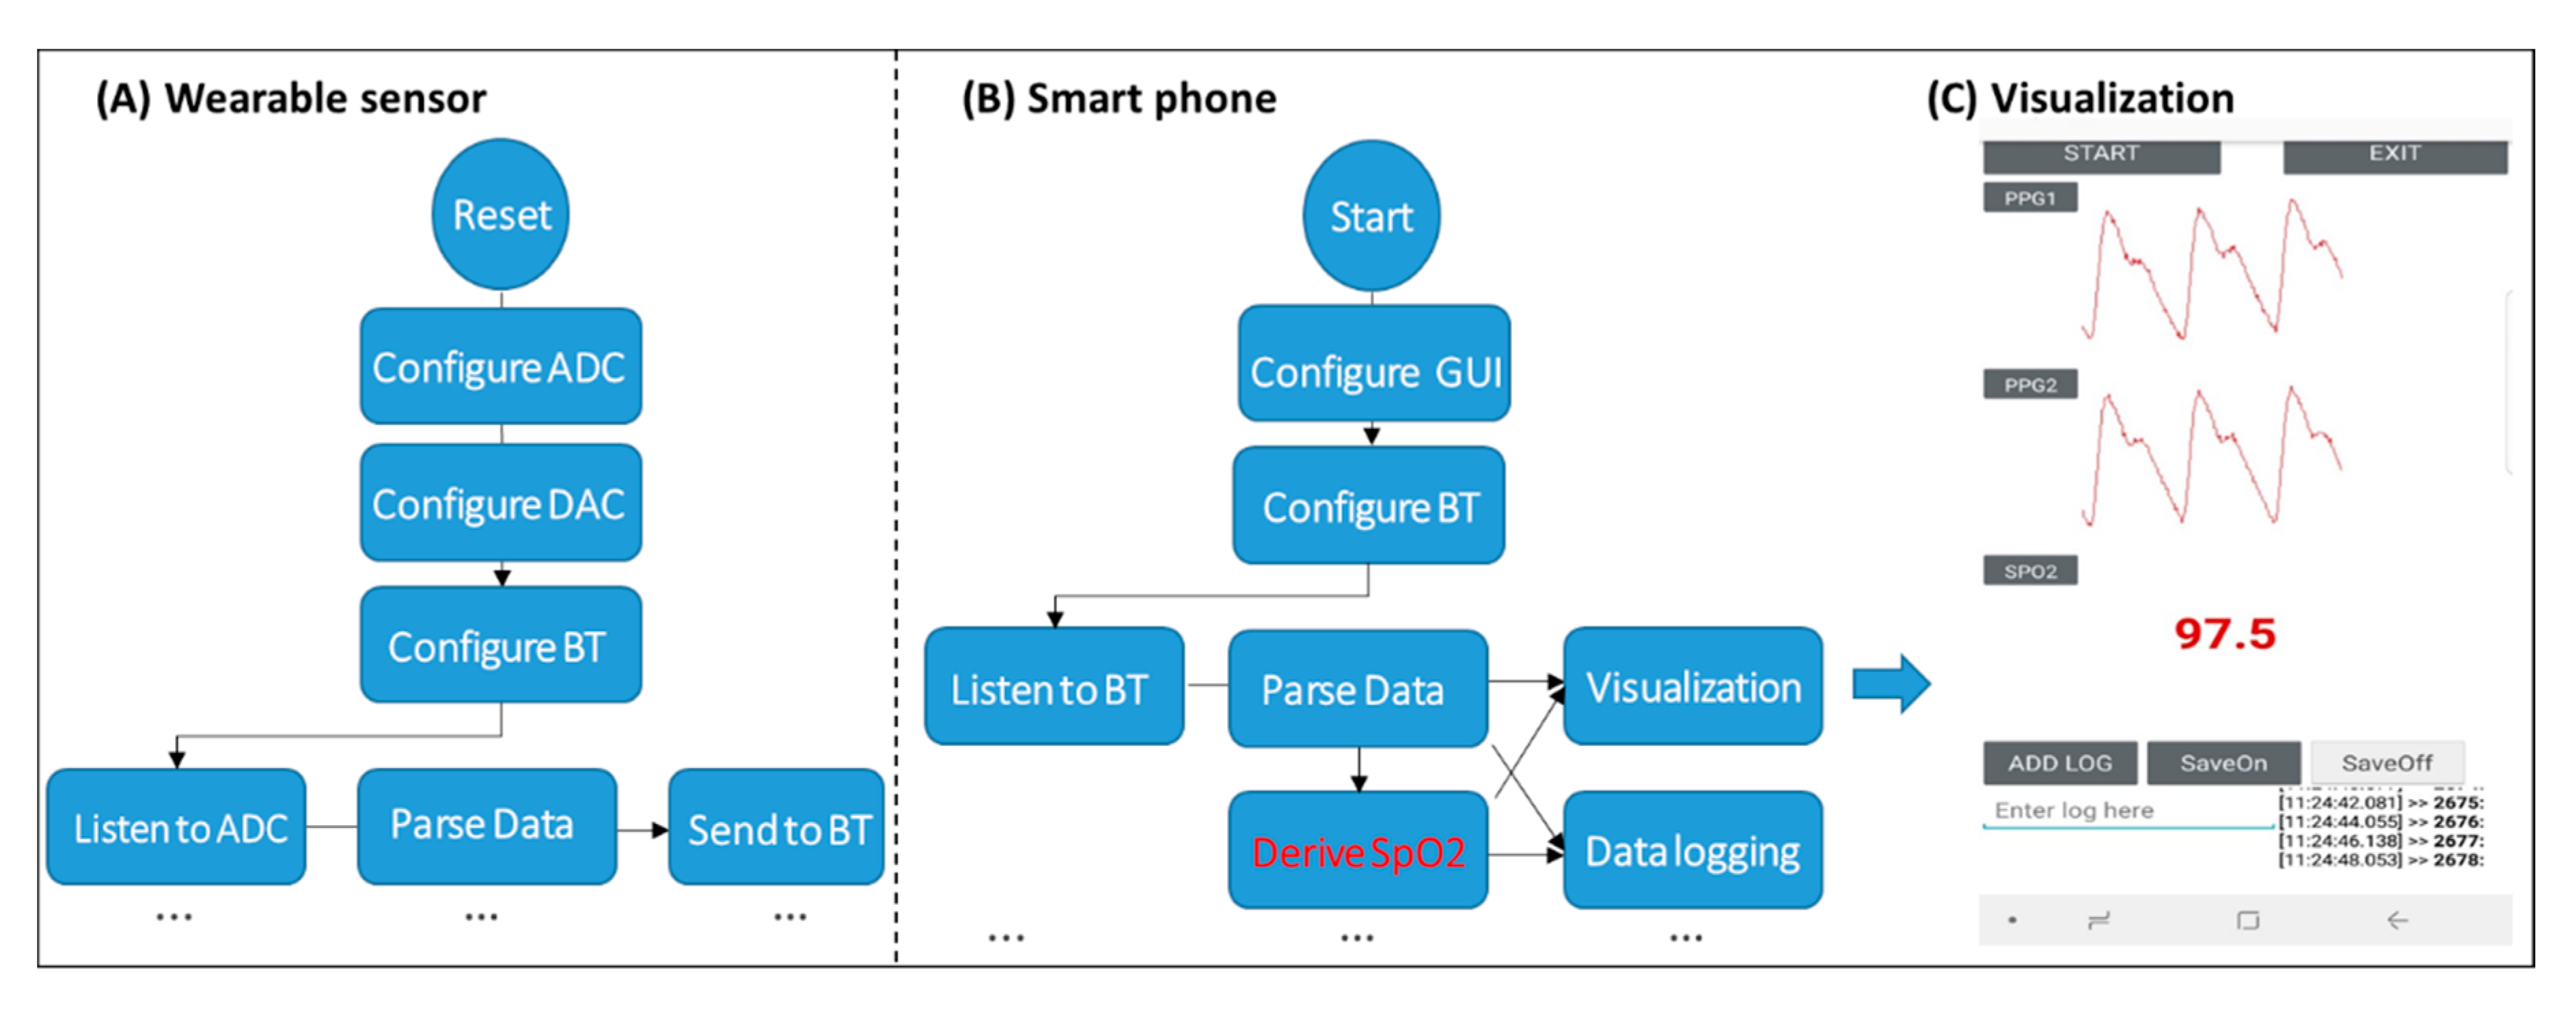
2.4. Mobile App Development
2.5. System Calibration
2.6. PPG Parameter Estimation
2.7. SpO2 Estimation Models
2.8. Finger Types in Model Calibration
2.9. Inter-Hand and Inter-Finger Model Evaluation in Humans
3. Results
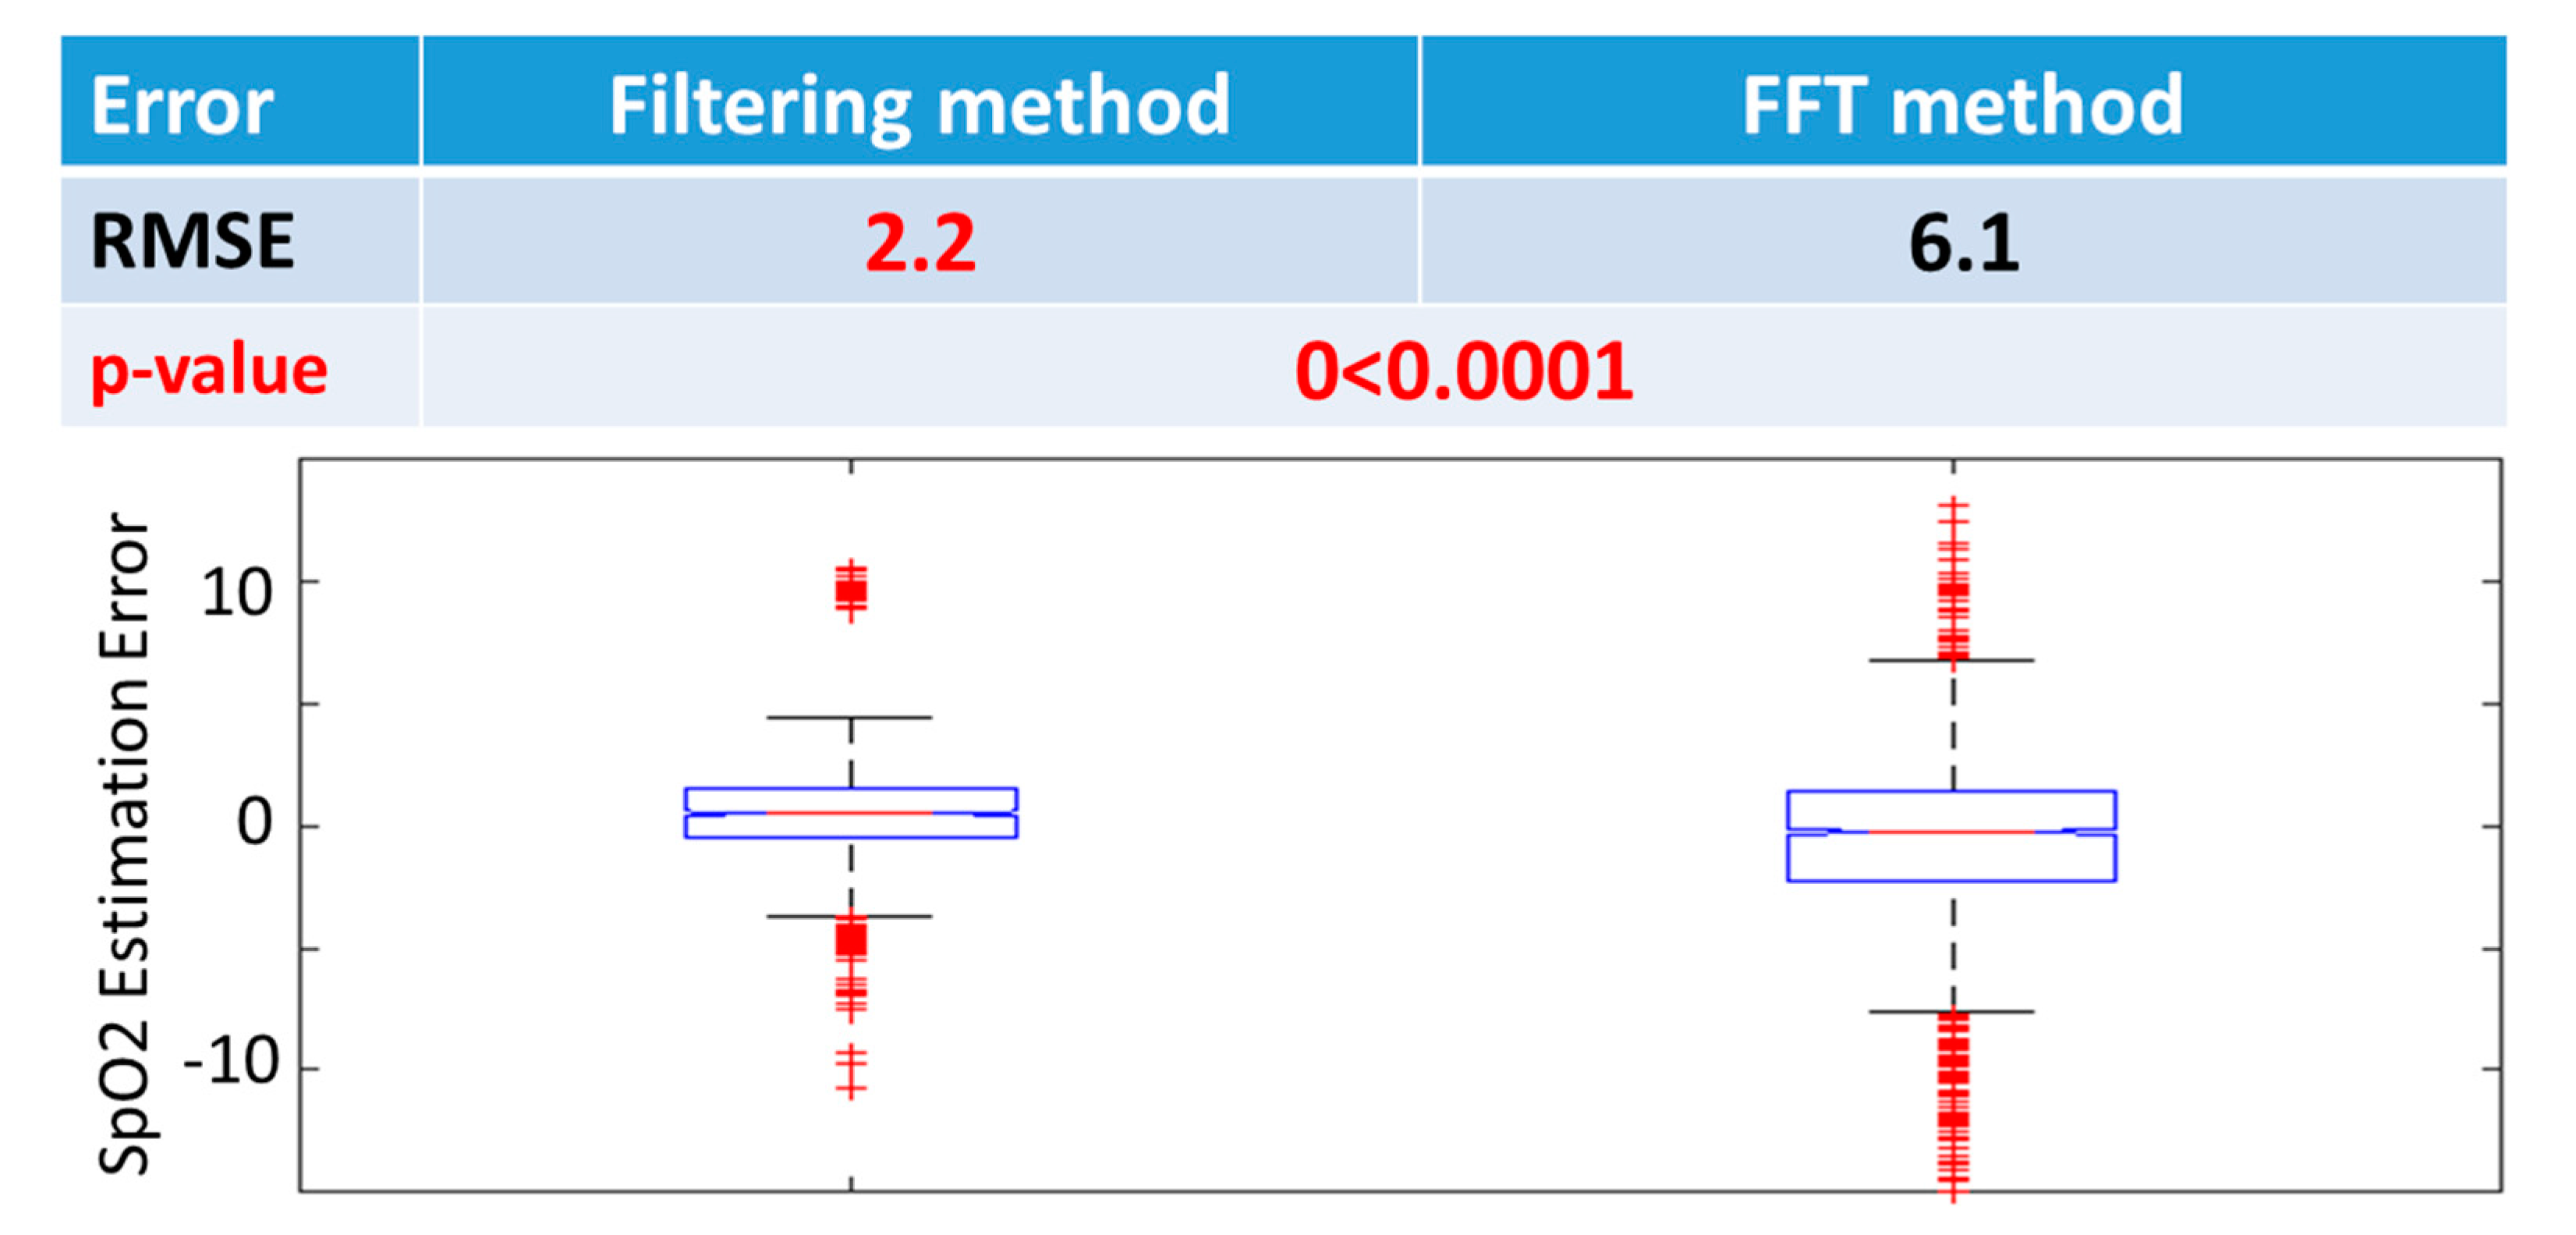
3.1. Calibration
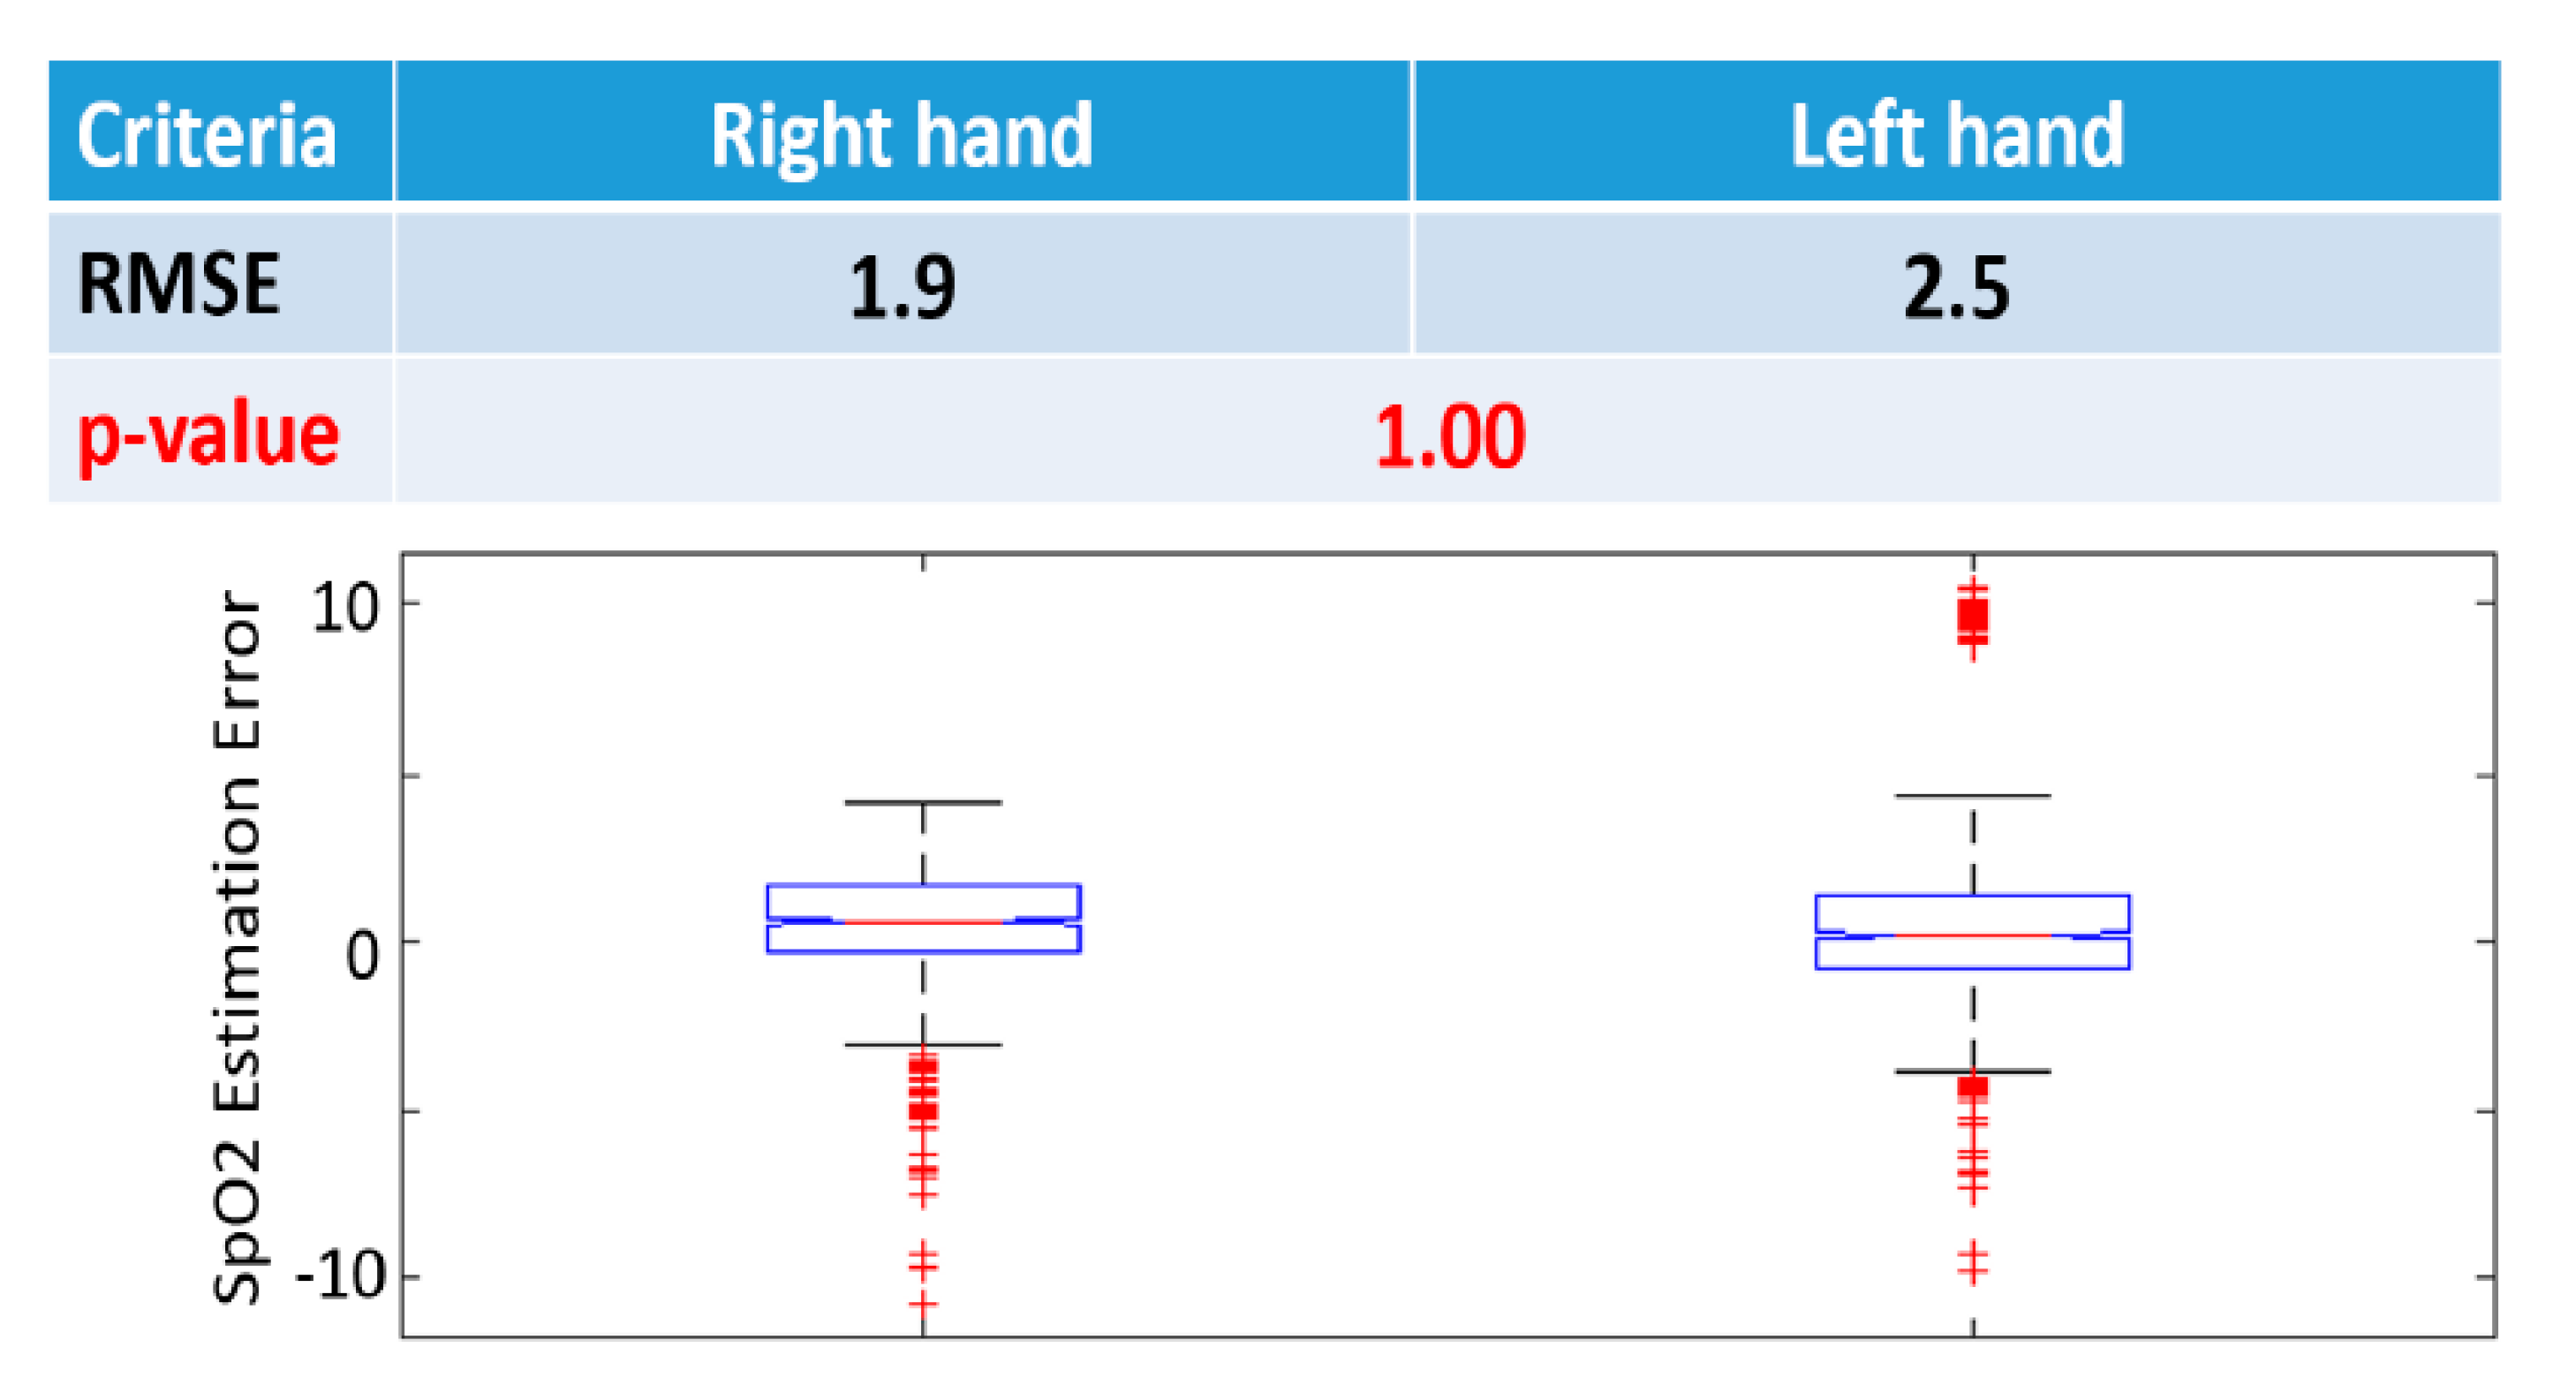
3.2. Inter-Hand Evaluation
3.3. Inter-Finger Evaluation
4. Discussion
Author Contributions
Funding
Conflicts of Interest
Disclosure Statement
References
- Allen, J. Photoplethysmography and its application in clinical physiological measurement. Physiol. Meas. 2007, 28, R1–R39. [Google Scholar] [CrossRef] [PubMed]
- Gonzalez, F.J.; Xie, C.; Jiang, C. The role of hypoxia-inducible factors in metabolic diseases. Nat. Rev. Endocrinol. 2019, 15, 21–32. [Google Scholar] [CrossRef] [PubMed]
- Castellon, X.; Bogdanova, V. Chronic inflammatory diseases and endothelial dysfunction. Aging Dis. 2016, 7, 81. [Google Scholar] [CrossRef] [PubMed]
- Gupta, N.; Ashraf, M. Hypoxia Signaling in Cardiovascular Diseases. In Hypoxia and Anoxia; IntechOpen: London, UK, 2018. [Google Scholar]
- Sexton, K.W.; Rodriguez-Feo, C.L.; Boyer, R.B.; Del Corral, G.A.; Riley, D.C.; Pollins, A.C.; Cardwell, N.L.; Shack, R.B.; Nanney, L.B.; Thayer, W.P. Axonal fusion via conduit-based delivery of hydrophilic polymers. Hand 2015, 10, 688–694. [Google Scholar] [CrossRef]
- Sohn, K.; Dalvin, S.P.; Merchant, F.M.; Kulkarni, K.; Sana, F.; Abohashem, S.; Singh, J.P.; Heist, E.K.; Owen, C.; Isselbacher, E.M.; et al. Utility of a Smartphone Based System (cvrPhone) to Predict Short-term Arrhythmia Susceptibility. Sci. Rep. 2019, 9, 14497. [Google Scholar] [CrossRef]
- Sohn, K.; Merchant, F.M.; Abohashem, S.; Kulkarni, K.; Singh, J.P.; Heist, E.K.; Owen, C.; Roberts, J.D.; Isselbacher, E.M.; Sana, F.; et al. Utility of a smartphone based system (cvrphone) to accurately determine apneic events from electrocardiographic signals. PLoS ONE 2019, 14, e0217217. [Google Scholar] [CrossRef]
- Sohn, K.; Merchant, F.M.; Sayadi, O.; Puppala, D.; Doddamani, R.; Sahani, A.; Singh, J.P.; Heist, E.K.; Isselbacher, E.M.; Armoundas, A.A. A Novel Point-of-Care Smartphone Based System for Monitoring the Cardiac and Respiratory Systems. Sci. Rep. 2017, 7, 44946. [Google Scholar] [CrossRef]
- Sana, F.; Isselbacher, E.M.; Singh, J.P.; Heist, E.K.; Pathik, B.; Armoundas, A.A. Wearable Devices for Ambulatory Cardiac Monitoring: JACC State-of-the-Art Review. J. Am. Coll. Cardiol. 2020, 75, 1582–1592. [Google Scholar] [CrossRef]
- McNicholas, W.T.; Bonsigore, M.R. Sleep apnoea as an independent risk factor for cardiovascular disease: Current evidence, basic mechanisms and research priorities. Eur. Respir. J. 2007, 29, 156–178. [Google Scholar] [CrossRef]
- Quaranta, A.J.; D’Alonzo, G.E.; Krachman, S.L. Cheyne-Stokes respiration during sleep in congestive heart failure. Chest 1997, 111, 467–473. [Google Scholar] [CrossRef]
- El-Khatib, M.; Bou-Khalil, P.; Zeineldine, S.; Kanj, N.; Abi-Saad, G.; Jamaleddine, G. Metabolic and respiratory variables during pressure support versus synchronized intermittent mandatory ventilation. Respiration 2009, 77, 154–159. [Google Scholar] [CrossRef] [PubMed]
- Schneider, J.; Mitchell, I.; Singhal, N.; Kirk, V.; Hasan, S.U. Prenatal cigarette smoke exposure attenuates recovery from hypoxemic challenge in preterm infants. Am. J. Respir. Crit. Care Med. 2008, 178, 520–526. [Google Scholar] [CrossRef] [PubMed]
- Zhang, L.; Hou, Y.; Po, S.S. Obstructive Sleep Apnoea and Atrial Fibrillation. Arrhythmia Electrophysiol. Rev. 2015, 4, 14–18. [Google Scholar] [CrossRef] [PubMed]
- Nigam, G.; Pathak, C.; Riaz, M. A systematic review of central sleep apnea in adult patients with chronic kidney disease. Sleep Breath. 2016, 20, 957–964. [Google Scholar] [CrossRef] [PubMed]
- Kent, B.D.; Grote, L.; Ryan, J.P.S.; Pépin, J.-L.; Bonsignore, M.R.; Tkacova, R.; Saaresranta, T.; Verbraecken, J.; Lévy, P.; Hedner, J.; et al. Diabetes mellitus prevalence and control in sleep-disordered breathing: The European Sleep Apnea Cohort (ESADA) study. Chest 2014, 146, 982–990. [Google Scholar] [CrossRef]
- Kent, B.D.; Grote, L.; Bonsignore, M.R.; Saaresranta, T.; Verbraecken, J.; Lévy, P.; Śliwiński, P.; Tkacova, R.; Kvamme, J.-A.; Fietze, I.; et al. Sleep apnoea severity independently predicts glycaemic health in nondiabetic subjects: The ESADA study. Eur. Respir. J. 2014, 44, 130–139. [Google Scholar] [CrossRef]
- Punjabi, N.M. The epidemiology of adult obstructive sleep apnea. Proc. Am. Thorac. Soc. 2008, 5, 136–143. [Google Scholar] [CrossRef] [PubMed]
- Adochiei, F.; Rotariu, C.; Ciobotariu, R.; Costin, H. (Eds.) A wireless low-power pulse oximetry system for patient telemonitoring. In Proceedings of the 2011 7th International Symposium on Advanced Topics in Electrical Engineering (ATEE), Bucharest, Romania, 12–14 May 2011; IEEE: Piscataway, NJ, USA, 2011. [Google Scholar]
- Azhari, A.; Yoshimoto, S.; Nezu, T.; Iida, H.; Ota, H.; Noda, Y.; Araki, T.; Uemura, T.; Sekitani, T.; Morii, K. (Eds.) A patch-type wireless forehead pulse oximeter for SpO2 measurement. In Proceedings of the 2017 IEEE Biomedical Circuits and Systems Conference (BioCAS), Turin, Italy, 19–21 October 2017; IEEE: Piscataway, NJ, USA, 2017. [Google Scholar]
- Polk, T.; Walker, W.; Hande, A.; Bhatia, D. (Eds.) Wireless telemetry for oxygen saturation measurements. In Proceedings of the 2006 IEEE Biomedical Circuits and Systems Conference, London, UK, 29 November–1 December 2006; IEEE: Piscataway, NJ, USA, 2006. [Google Scholar]
- Rotariu, C.; Manta, V. (Eds.) Wireless system for remote monitoring of oxygen saturation and heart rate. In Proceedings of the 2012 Federated Conference on Computer Science and Information Systems (FedCSIS), Wroclaw, Poland, 9–12 September 2012; IEEE: Piscataway, NJ, USA, 2012. [Google Scholar]
- Lamonaca, F.; Carnì, D.L.; Grimaldi, D.; Nastro, A.; Riccio, M.; Spagnolo, V. (Eds.) Blood oxygen saturation measurement by smartphone camera. In Proceedings of the 2015 IEEE International Symposium on Medical Measurements and Applications (MeMeA) Proceedings, Turin, Italy, 7–9 May 2015; IEEE: Piscataway, NJ, USA, 2015. [Google Scholar]
- Van Gastel, M.; Liang, H.; Stuijk, S.; De Haan, G. (Eds.) Simultaneous estimation of arterial and venous oxygen saturation using a camera. In Proceedings of the Optical Diagnostics and Sensing XVIII: Toward Point-of-Care Diagnostics, San Francisco, CA, USA, 29–30 January 2018; International Society for Optics and Photonics: Bellingham, WA, USA, 2018. [Google Scholar]
- Khan, M.; Pretty, C.G.; Amies, A.C.; Balmer, J.; Banna, H.E.; Shaw, G.M.; Chase, J.G. Proof of concept non-invasive estimation of peripheral venous oxygen saturation. Biomed. Eng. Online 2017, 16, 60. [Google Scholar] [CrossRef] [PubMed]
- Sayadi, O.; Puppala, D.; Ishaque, N.; Doddamani, R.; Merchant, F.M.; Barrett, C.; Singh, J.P.; Heist, E.K.; Mela, T.; Martínez, J.P.; et al. A novel method to capture the onset of dynamic electrocardiographic ischemic changes and its implications to arrhythmia susceptibility. J. Am. Heart Assoc. 2014, 3, e001055. [Google Scholar] [CrossRef] [PubMed]
- Sayadi, O.; Weiss, E.H.; Merchant, F.M.; Puppala, D.; Armoundas, A.A. An optimized method for estimating the tidal volume from intracardiac or body surface electrocardiographic signals: Implications for estimating minute ventilation. Am. J. Physiol. Heart Circ. Physiol. 2014, 307, H426–H436. [Google Scholar] [CrossRef]
- Weiss, E.H.; Sayadi, O.; Ramaswamy, P.; Merchant, F.M.; Sajja, N.; Foley, L.; Laferriere, S.; Armoundas, A.A. An optimized method for the estimation of the respiratory rate from electrocardiographic signals: Implications for estimating minute ventilation. Am. J. Physiol. Heart Circ. Physiol. 2014, 307, H437–H447. [Google Scholar] [CrossRef] [PubMed]
- Anagha, S.; Suyampulingam, A.; Ramachandran, K. (Eds.) A Better Digital Filtering Technique for Estimation of SPO 2 and Heart Rate from PPG Signals. In Proceedings of the 2018 International Conference on Inventive Research in Computing Applications (ICIRCA), Coimbatore, India, 11–12 July 2018; IEEE: Piscataway, NJ, USA, 2018. [Google Scholar]
- Lloyd-Jones, D.; Adams, R.J.; Brown, T.M.; Carnethon, M.; Dai, S.; De Simone, G.; Ferguson, T.B.; Ford, E.; Furie, K.; Gillespie, C.; et al. Heart disease and stroke statistics—2010 update: A report from the American Heart Association. Circulation 2009, 121, e46–e215. [Google Scholar] [PubMed]
- Pew Research Internet Project. Mobile Technology Fact Sheet. 2014. Available online: http://www.pewinternet.org/fact-sheets/mobile-technology-fact-sheet (accessed on 9 May 2020).
- Webster, J.G. Design of Pulse Oximeters; CRC Press: Boca Raton, FL, USA, 1997. [Google Scholar]


Publisher’s Note: MDPI stays neutral with regard to jurisdictional claims in published maps and institutional affiliations. |
© 2020 by the authors. Licensee MDPI, Basel, Switzerland. This article is an open access article distributed under the terms and conditions of the Creative Commons Attribution (CC BY) license (http://creativecommons.org/licenses/by/4.0/).
Share and Cite
Zhang, Q.; Arney, D.; Goldman, J.M.; Isselbacher, E.M.; Armoundas, A.A. Design Implementation and Evaluation of a Mobile Continuous Blood Oxygen Saturation Monitoring System. Sensors 2020, 20, 6581. https://doi.org/10.3390/s20226581
Zhang Q, Arney D, Goldman JM, Isselbacher EM, Armoundas AA. Design Implementation and Evaluation of a Mobile Continuous Blood Oxygen Saturation Monitoring System. Sensors. 2020; 20(22):6581. https://doi.org/10.3390/s20226581
Chicago/Turabian StyleZhang, Qingxue, David Arney, Julian M. Goldman, Eric M. Isselbacher, and Antonis A. Armoundas. 2020. "Design Implementation and Evaluation of a Mobile Continuous Blood Oxygen Saturation Monitoring System" Sensors 20, no. 22: 6581. https://doi.org/10.3390/s20226581
APA StyleZhang, Q., Arney, D., Goldman, J. M., Isselbacher, E. M., & Armoundas, A. A. (2020). Design Implementation and Evaluation of a Mobile Continuous Blood Oxygen Saturation Monitoring System. Sensors, 20(22), 6581. https://doi.org/10.3390/s20226581