Estimating Surgical Blood Loss Volume Using Continuously Monitored Vital Signs


Abstract
1. Introduction
2. Methods
2.1. Research Subjects and Hemorrhagic Surgery Protocol
2.2. Feature Derivation and Normalization
2.3. Model Development
3. Results
3.1. Characteristics of Research Subjects
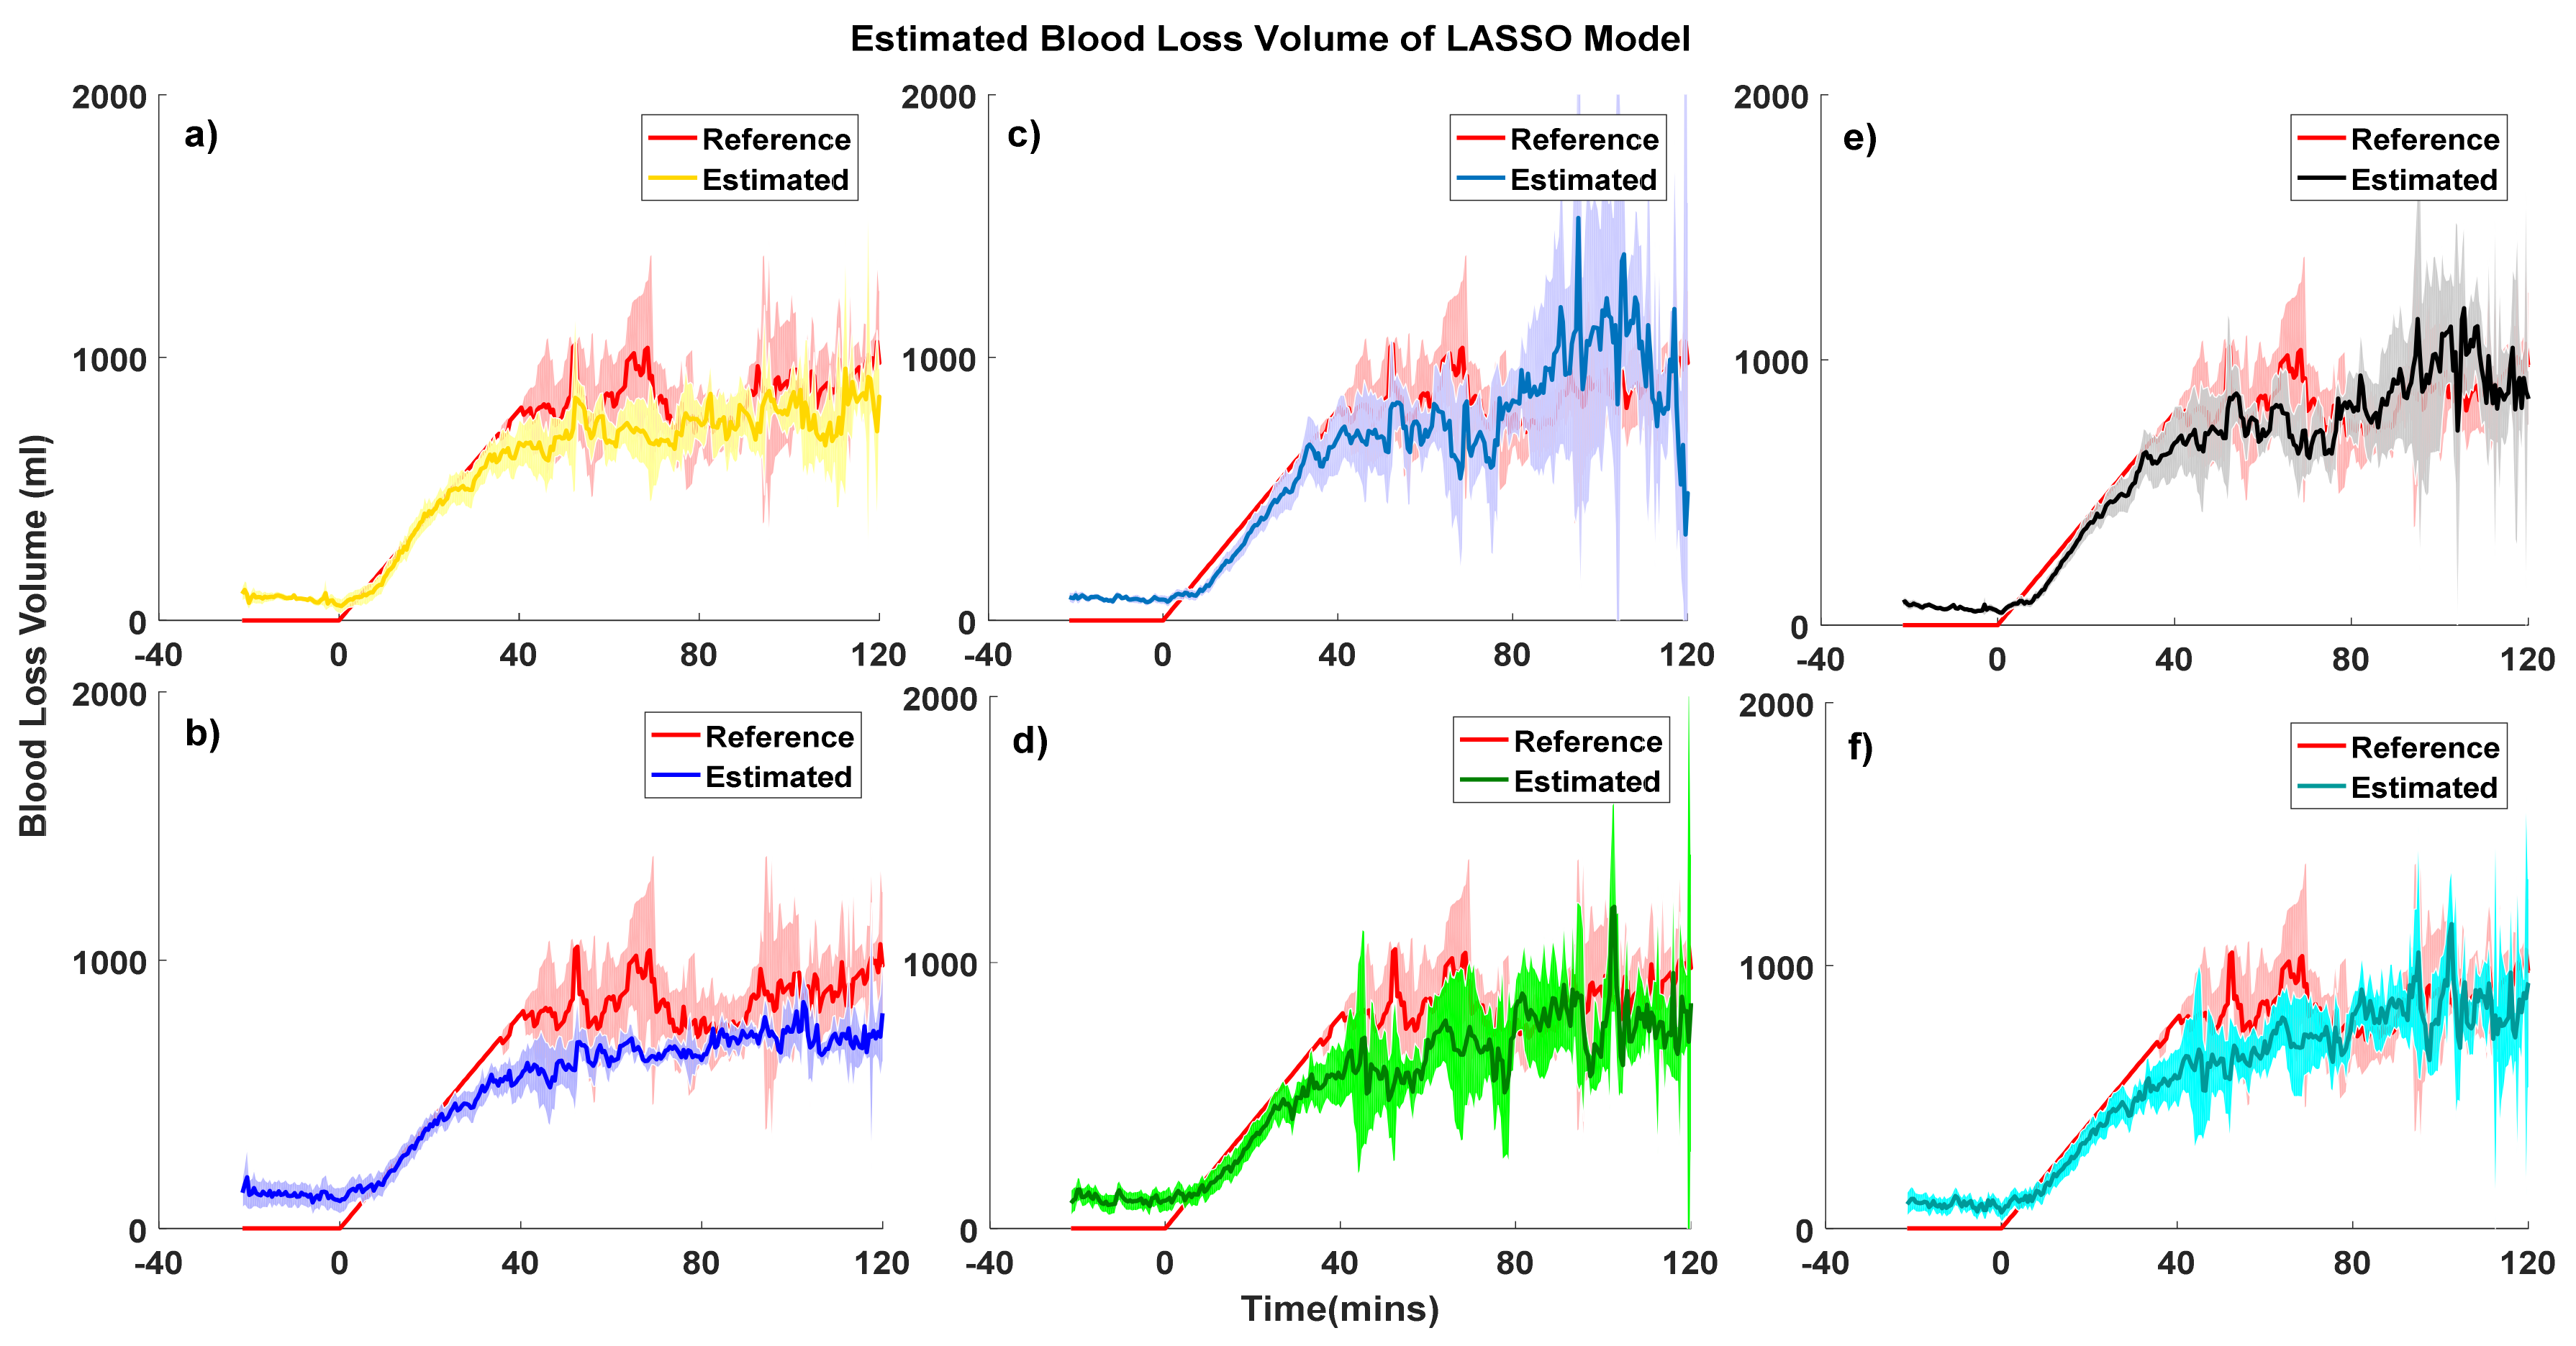
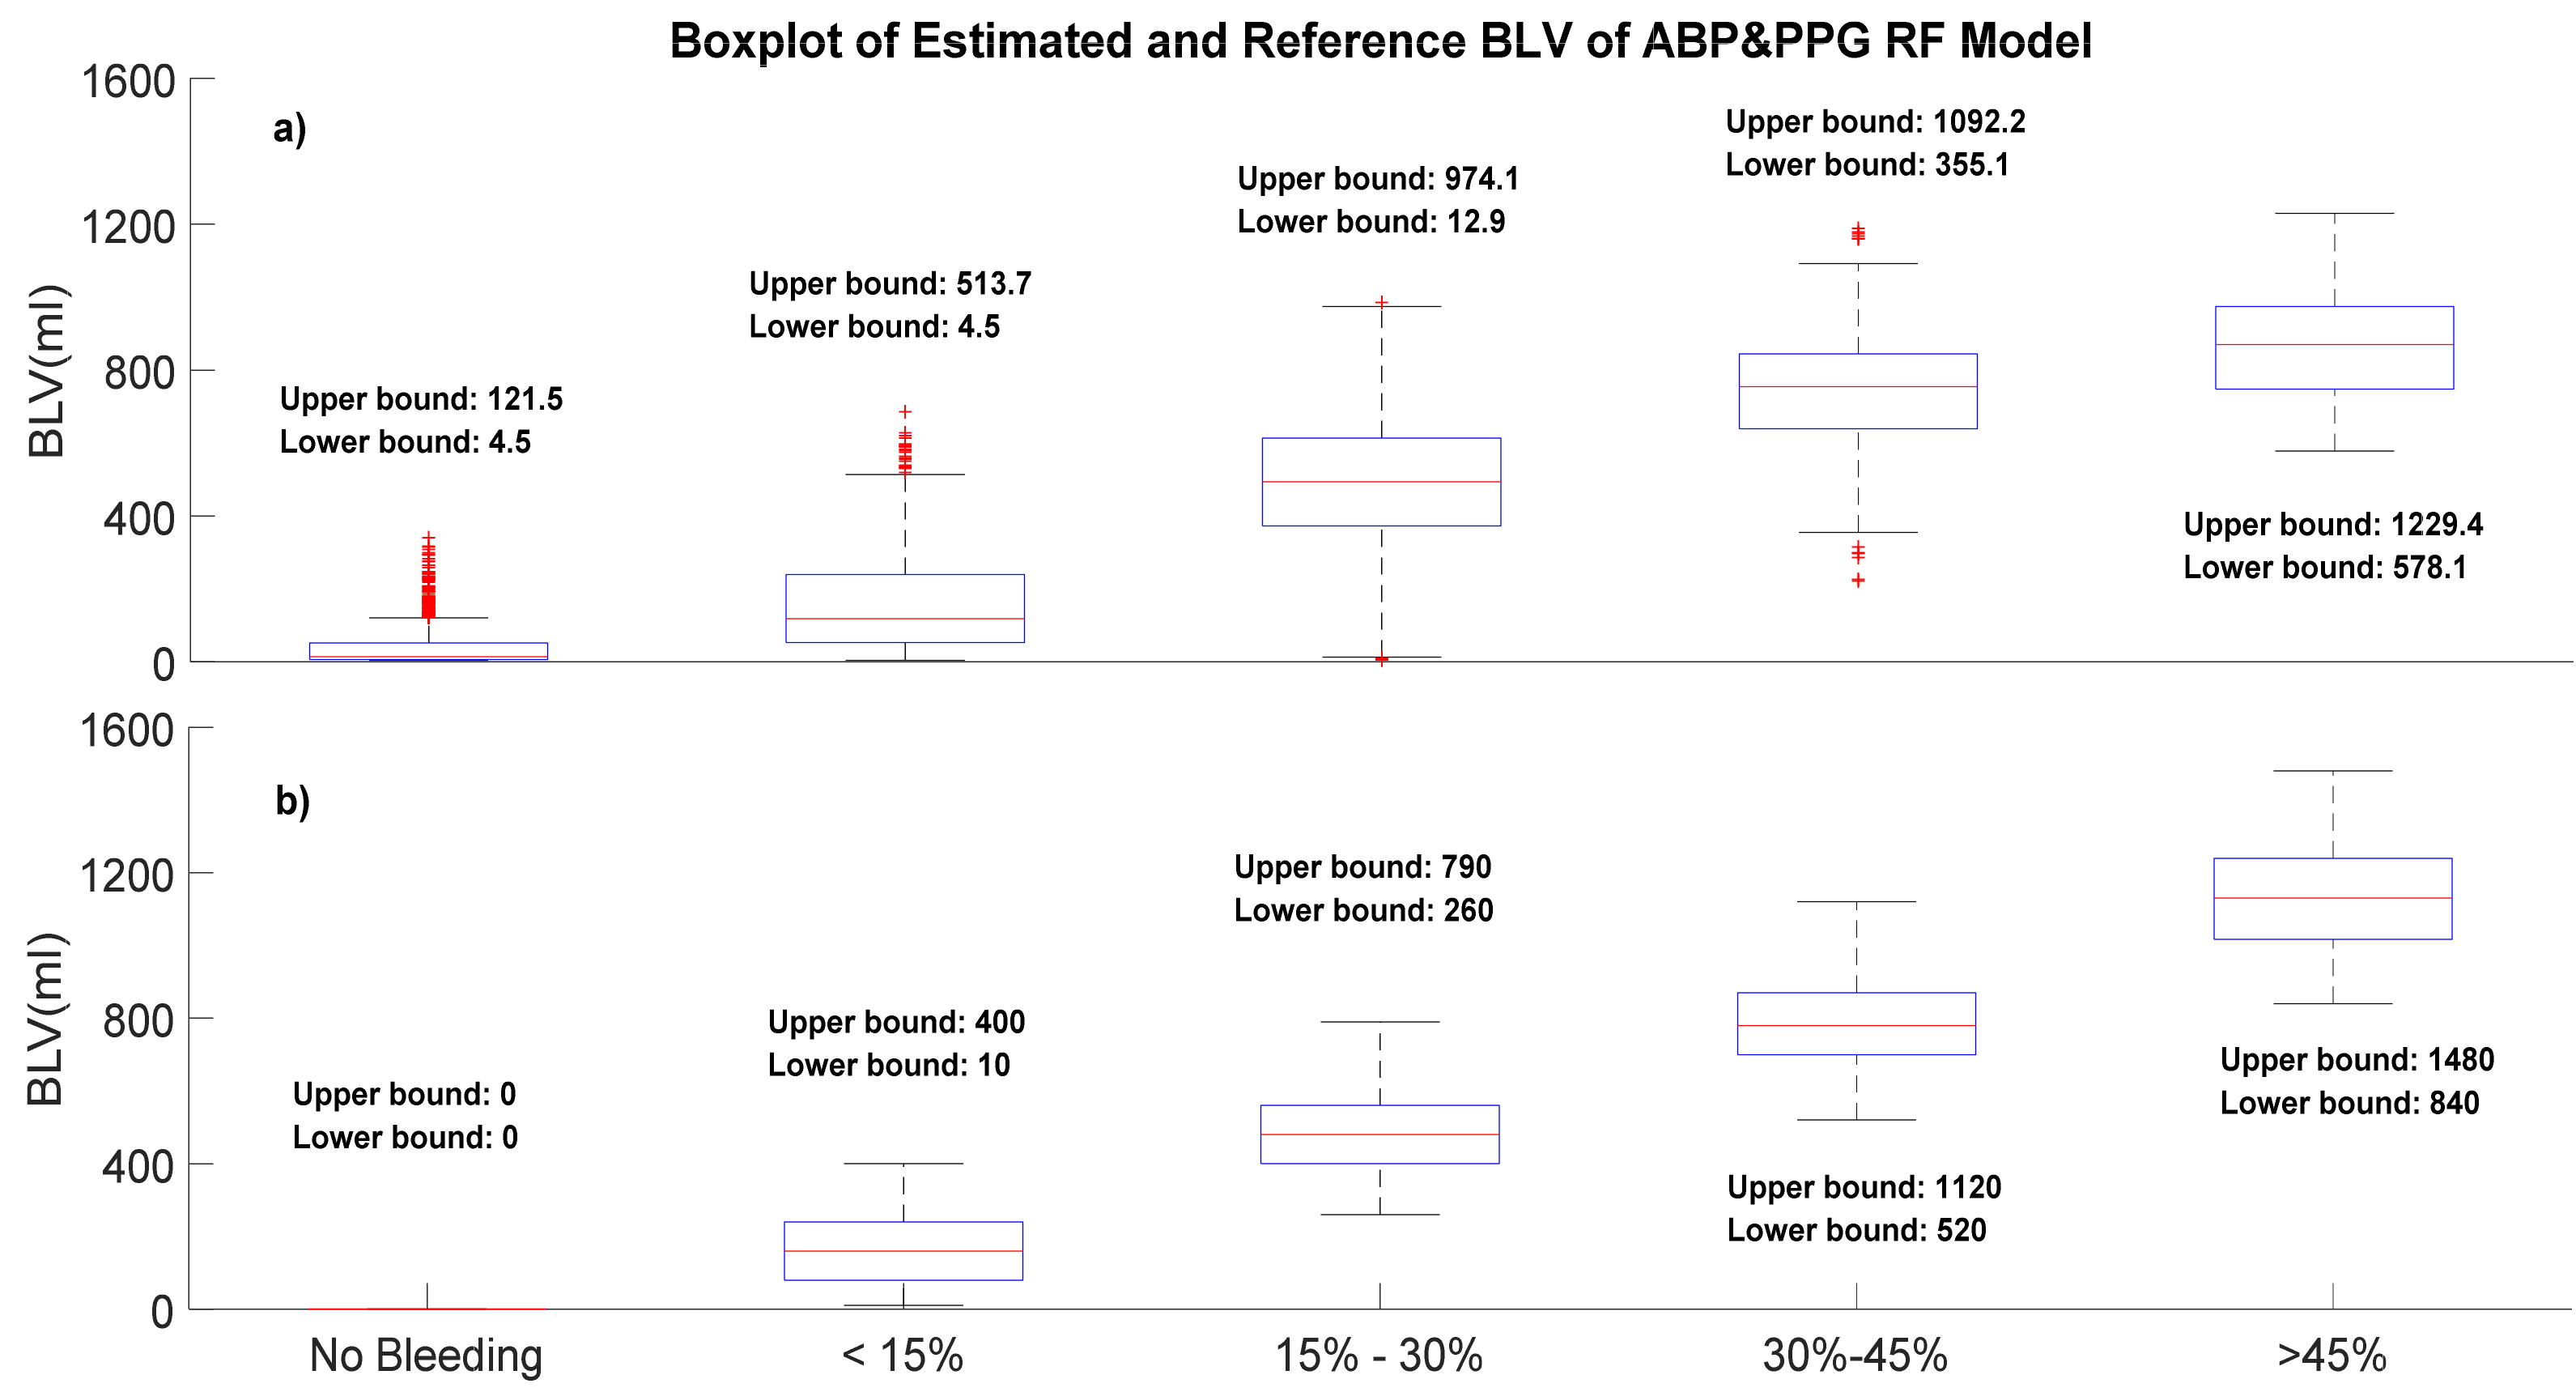
3.2. Model Performance of Blood Loss Estimation
3.3. Comparisons of Feature Importance among Models
4. Discussion
5. Conclusions
Author Contributions
Funding
Acknowledgments
Conflicts of Interest
Appendix A


| Feature Number | Feature Name | Feature Interpretation |
|---|---|---|
| Fr1 | Mean pulse rate | Mean pulse rate |
| Fr2 | Std pulse rate | Standard deviation of pulse rate |
| Fr3 | RMSDD | Square root of the mean squared differences of pulse intervals |
| Fr4 | PRV COSEN | Coefficient of sample entropy |
| Fr5 | Max PR | Maximum pulse rate in the window |
| Fr6 | Min PR | Minimum pulse rate in the window |
| Fa1 | Mean SBP | Mean SBP in the window |
| Fa2 | Mean DBP | Mean DBP in the window |
| Fa3 | Mean PP | Mean PP in the window |
| Fa4 | Mean SBPV | Mean SBP variation in the window |
| Fa5 | Mean DBPV | Mean DBP variation in the window |
| Fa6 | Mean PPV | Mean PP variation in the window |
| Feature Number | Feature Name | Feature Interpretation |
|---|---|---|
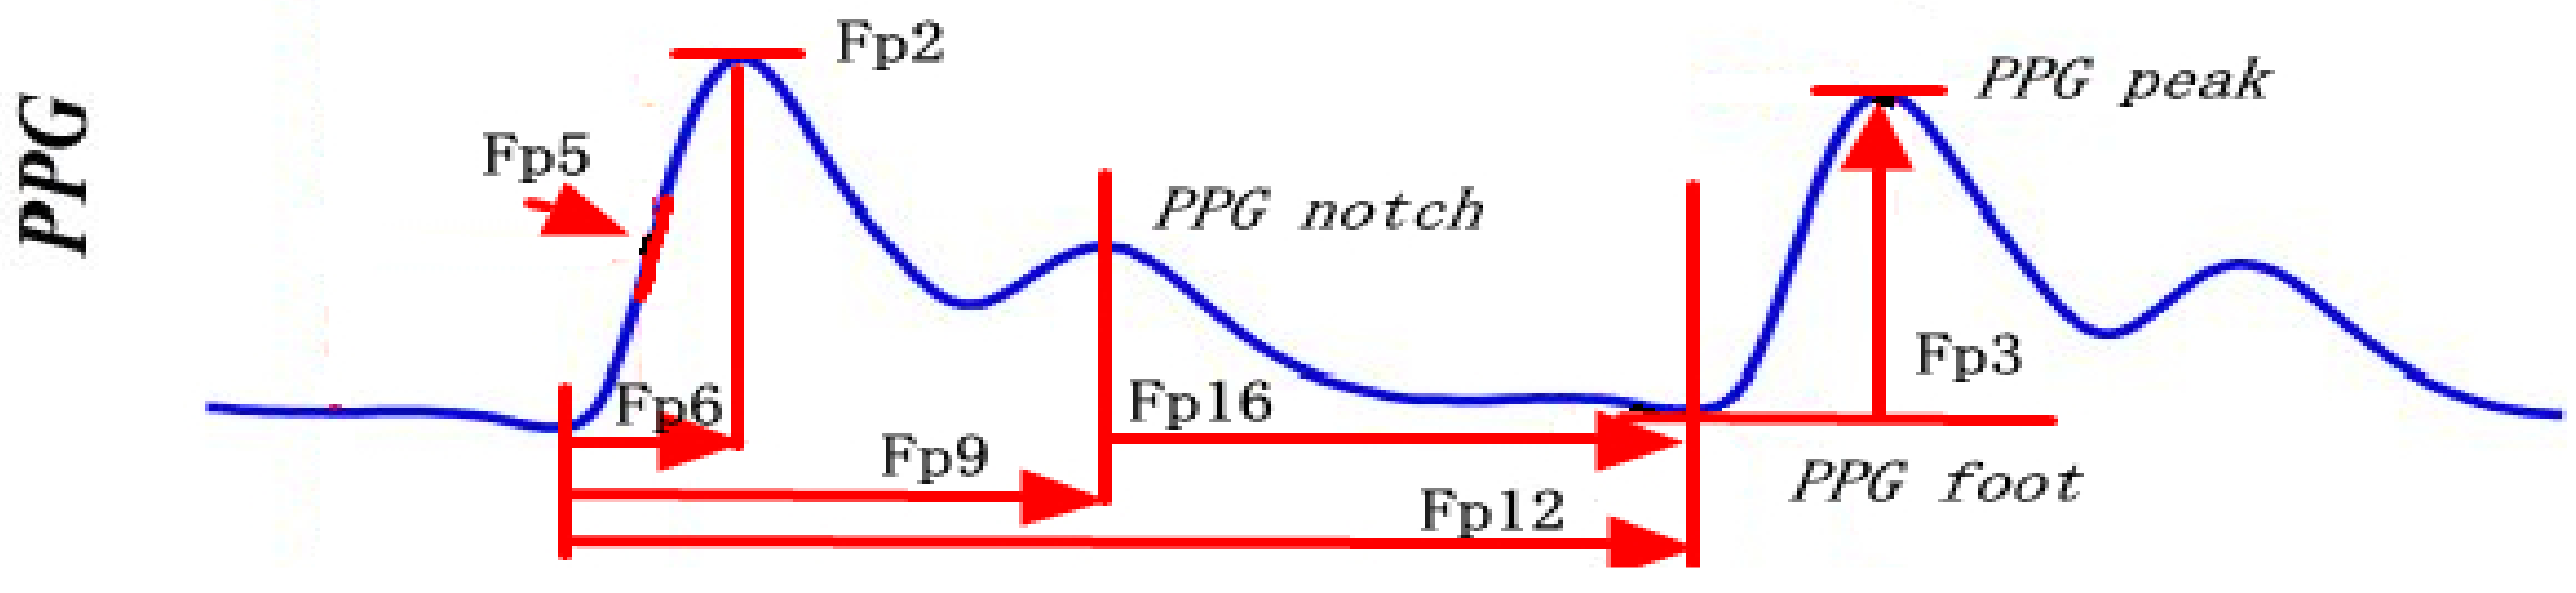
| Fp1 | PPG Amplitude Variation | Variation of PPG peak amplitude |
| Fp2 | PPG Amplitude | PPG peak amplitude |
| Fp3 | PPG peak–foot amplitude | PPG peak amplitude–PPG foot amplitude |
| Fp4 | PPG Peak–Foot Amplitude Variation | Variation of (PPG peak amplitude–PPG foot amplitude) |
| Fp5 | Slope Transit Time | Slope transit time of PPG |
| Fp6 | Systolic Time | time interval from PPG foot to PPG peak |
| Fp7 | Systolic Area | Area under the systolic wave |
| Fp8 | Systolic Area Ratio | Area under the systolic wave/total beat area |
| Fp9 | Notch Time | Time interval from PPG peak to PPG notch |
| Fp10 | Notch Area | Area under curve from PPG peak to PPG notch |
| Fp11 | Notch Area Ratio | Area under curve from PPG peak to PPG notch/total beat area |
| Fp12 | Diastolic Time | time interval from peak to foot |
| Fp13 | Diastolic Area | Area under diastolic wave |
| Fp14 | Diastolic Area Ratio | Area under the diastolic wave/total beat area |
| Fp15 | PPG Intensity Ratio | PPG peak amplitude/(PPG foot amplitude |
| Fp16 | Notch-Foot Time | Time interval from PPG notch to PPG foot |
| Fp17 | Notch-Foot Area | Area under curve from PPG notch to PPG foot |
| Fp18 | Notch-Foot Area Ratio | Area under curve from PPG notch to PPG foot/total beat area |
References
- Asehnoune, K.; Balogh, Z.; Citerio, G.; Cap, A.; Billiar, T.; Stocchetti, N.; Cohen, M.J.; Pelosi, P.; Curry, N.; Gaarder, C.; et al. The research agenda for trauma critical care. Intensive Care Med. 2017, 43, 1340–1351. [Google Scholar] [CrossRef] [PubMed]
- Tisherman, S.A.; Stein, D.M. ICU Management of Trauma Patients. Crit. Care Med. 2018, 46, 1991–1997. [Google Scholar] [CrossRef] [PubMed]
- Clevenger, B.; Mallett, S.V.; Klein, A.A.; Richards, T. Patient blood management to reduce surgical risk. Br. J. Surg. 2015, 102, 1325–1337. [Google Scholar] [CrossRef]
- Goodnough, L.T.; Shander, A. Patient Blood Management. Anesthesiology 2012, 116, 1367–1376. [Google Scholar] [CrossRef] [PubMed]
- Shander, A.; Bracey, A.W.; Goodnough, L.T.; Gross, I.; Hassan, N.E.; Ozawa, S.; Marques, M.B. Patient Blood Management as Standard of Care. Anesth. Analg. 2016, 123, 1051–1053. [Google Scholar] [CrossRef] [PubMed]
- Jaramillo, S.; Montane-Muntane, M.; Capitan, D.; Aguilar, F.; Vilaseca, A.; Blasi, A.; Navarro-Ripoll, R. Agreement of surgical blood loss estimation methods. Transfusion 2019, 59, 508–515. [Google Scholar] [CrossRef]
- Rothermel, L.D.; Lipman, J.M. Estimation of blood loss is inaccurate and unreliable. Surgery 2016, 160, 946–952. [Google Scholar] [CrossRef]
- Yeung, C.Y.; Yim, W.W.; Chan, S.Y.; Lo, R.S.L.; Leung, L.Y.; Hung, K.K.C.; Graham, C.A. Improvement of blood loss volume estimation by paramedics using a pictorial nomogram: A developmental study. Injury 2017, 48, 2693–2698. [Google Scholar] [CrossRef]
- Bourke, D.L.; Smith, T.C. Estimating Allowable Hemodilution. Anesthesiology 1974, 41, 609–611. [Google Scholar] [CrossRef]
- Ward, C.F.; Meathe, E.A.; Benumof, J.L.; Trousdale, F. A Computer Nomogram for Blood Loss Replacement. Anesthesiology 1980, 53 (Suppl. 3), S126. [Google Scholar] [CrossRef]
- Lopez-Picado, A.; Albinarrate, A.; Barrachina, B. Determination of Perioperative Blood Loss: Accuracy or Approximation? Anesth. Analg. 2017, 125, 280–286. [Google Scholar] [CrossRef] [PubMed]
- Marino, P.L. The ICU Book; Wolters Kluwer Health/Lippincott Williams & Wilkins: Philadelphia, PA, USA, 2014. [Google Scholar]
- Selvaraj, N.; Scully, C.G.; Shelley, K.H.; Silverman, D.G.; Chon, K.H. Early Detection of Spontaneous Blood Loss using Amplitude Modulation of Photoplethysmogram. In Proceedings of the 2011 Annual International Conference of the IEEE Engineering in Medicine and Biology Society, Boston, MA, USA, 30 August–3 September 2011; pp. 5499–5502. [Google Scholar]
- Shamir, M.; Eidelman, L.A.; Floman, Y.; Kaplan, L.; Pizov, R. Pulse oximetry plethysmographic waveform during changes in blood volume. Br. J. Anaesth. 1999, 82, 178–181. [Google Scholar] [CrossRef] [PubMed]
- Cannesson, M.; Attof, Y.; Rosamel, P.; Desebbe, O.; Joseph, P.; Metton, O.; Bastien, O.; Lehot, J.J. Respiratory variations in pulse oximetry plethysmographic waveform amplitude to predict fluid responsiveness in the operating room. Anesthesiology 2007, 106, 1105–1111. [Google Scholar] [CrossRef] [PubMed]
- Scully, C.G.; Selvaraj, N.; Romberg, F.W.; Wardhan, R.; Ryan, J.; Florian, J.P.; Silverman, D.G.; Shelley, K.H.; Chon, K.H. Using Time-Frequency Analysis of the Photoplethysmographic Waveform to Detect the Withdrawal of 900 mL of Blood. Anesth. Analg. 2012, 115, 74–81. [Google Scholar] [CrossRef]
- Cejnar, M.; Kobler, H.; Hunyor, S.N. Quantitative Photoplethysmography—Lambert-Beer Law or Inverse Function Incorporating Light Scatter. J. Biomed. Eng. 1993, 15, 151–154. [Google Scholar] [CrossRef]
- Pinsky, M.R.; Wertz, A.; Clermont, G.; Dubrawski, A. Parsimony of Hemodynamic Monitoring Data Sufficient for the Detection of Hemorrhage. Anesth. Analg. 2020, 130, 1176–1187. [Google Scholar] [CrossRef]
- Gómez, H.; Mesquida, J.; Hermus, L.; Polanco, P.; Kim, H.K.; Zenker, S.; Torres, A.; Namas, R.; Vodovotz, Y.; Clermont, G.; et al. Physiologic responses to severe hemorrhagic shock and the genesis of cardiovascular collapse: Can irreversibility be anticipated? J. Surg. Res. 2012, 178, 358–369. [Google Scholar] [CrossRef]
- Gomez, H.; Kautza, B.; Escobar, D.; Nassour, I.; Luciano, J.; Botero, A.M.; Gordon, L.; Martinez, S.; Holder, A.; Ogundele, O.; et al. Inhaled Carbon Monoxide Protects against the Development of Shock and Mitochondrial Injury following Hemorrhage and Resuscitation. PLoS ONE 2015, 10, e0135032. [Google Scholar] [CrossRef]
- Miao, F.; Fu, N.; Zhang, Y.; Ding, X.; Hong, X.; He, Q.; Li, Y. A Novel Continuous Blood Pressure Estimation Approach Based on Data Mining Techniques. IEEE J. Biomed. Health Inform. 2017, 21, 1730–1740. [Google Scholar] [CrossRef]
- Miao, F.; Liu, Z.; Liu, J.; Wen, B.; He, Q.; Li, Y. Multi-Sensor Fusion Approach for Cuff-Less Blood Pressure Measurement. IEEE J. Biomed. Health Inform. 2020, 24, 79–91. [Google Scholar] [CrossRef]
- Chen, Y.; Yoon, J.H.; Pinsky, M.R.; Ma, T.; Clermont, G. Development of hemorrhage identification model using non-invasive vital signs. Physiol. Meas. 2020, 41, 055010. [Google Scholar] [CrossRef] [PubMed]
- Wertz, A.; Holder, A.L.; Guillame-Bert, M.; Clermont, G.; Dubrawski, A.; Pinsky, M.R. Increasing Cardiovascular Data Sampling Frequency and Referencing It to Baseline Improve Hemorrhage Detection. Crit. Care Explor. 2019, 1, e0058. [Google Scholar] [CrossRef] [PubMed]
- Pedregos, F.; Varoquau, G.; Gramfor, A.; Miche, V.; Thirio, B.; Grisel, O.; Blonde, M.; Prettenhofer, P.; Weiss, R.; Dubour, V.; et al. Scikit-learn: Machine Learning in Python. J. Mach. Learn. Res. 2011, 12, 2825–2830. [Google Scholar]
- Breiman, L. Random Forests. J. Mach. Learn. 2001, 45, 5–32. [Google Scholar] [CrossRef]
- Beleites, C.; Neugebauer, U.; Bocklitz, T.; Krafft, C.; Popp, J. Sample size planning for classification models. Anal. Chim. Acta 2013, 760, 25–33. [Google Scholar] [CrossRef] [PubMed]
- Nilsson, L.M. Respiration signals from photoplethysmography. Anesth. Analg. 2013, 117, 859–865. [Google Scholar] [CrossRef] [PubMed]
- John, A. Photoplethysmography and its application in clinical physiological measurement. Physiol. Meas. 2007, 28, R1. [Google Scholar]


| Model Performance | PPG-Personal Model-RF (mL) | PPG-Grouped Model-RF (mL) | ABP-Personal Model-RF (mL) | ABP-Grouped Model-RF (mL) | PPG&ABP-Personal Model-RF (mL) | PPG&ABP-Grouped Model-RF (mL) |
|---|---|---|---|---|---|---|
| Overall | 11.9 ± 156.2 | −21.9 ± 210.6 | 6.5 ± 161.5 | −9.15 ± 193.3 | 7.0 ± 139.4 | −7.6 ± 187.1 |
| No bleeding | −51.8 ± 64.8 | −152.9 ± 138.4 | −53.6 ± 76.3 | −115.7 ± 87.9 | −38.0 ± 50.6 | −109.6 ± 94.1 |
| Loss of <15% | 1.8 ± 123.2 | −26.2 ± 171.2 | 10.5 ± 140.5 | 3.8 ± 140.3 | 9.1 ± 103.4 | −2.5 ± 144.3 |
| Loss of 15–30% | 22.2 ± 158.7 | 29.7 ± 203.5 | −3.8 ± 180.1 | 21.5 ± 256.2 | −1.4 ± 160.3 | 44.1 ± 191.4 |
| Loss of 30–45% | 80.4 ± 193.3 | 91.3 ± 215.7 | 57.4 ± 183.1 | 54.2 ± 215.2 | 47.3 ± 167.9 | 64.9 ± 203.8 |
| Loss of >45% | 281.8 ± 263.5 | 320.7 ± 244.9 | 348.6 ± 198.6 | 352.2 ± 201.1 | 264.0 ± 228.0 | 306.0 ± 214.8 |
| Model Performance | PPG-Personal Model-LASSO (mL) | PPG-Grouped Model-LASSO (mL) | ABP-Personal Model-LASSO (mL) | ABP-Grouped Model-LASSO (mL) | PPG&ABP-Personal Model-LASSO (mL) | PPG&ABP-Grouped Model-LASSO (mL) |
| Overall | −3.6 ± 211.1 | 9.0 ± 226.8 | 1.32 ± 180.1 | 2.9 ± 226.3 | 3.2 ± 163.2 | 15.7 ± 208.7 |
| No bleeding | −82.8 ± 58.6 | −101.9 ± 149.5 | −83.39 ± 85.8 | −131.9 ± 195.1 | −65.7 ± 53.6 | −88.8 ± 138.6 |
| Loss of <15% | 35.0 ± 109.1 | 8.2 ± 178.5 | 12.13 ± 147.1 | −17.3 ± 175.0 | 38.2 ± 93.4 | 15.1 ± 162.7 |
| Loss of 15–30% | 53.8 ± 191.0 | 66.7 ± 207.0 | −5.71 ± 195.7 | 38.7 ± 159.2 | 28.7 ± 175.7 | 45.7 ± 207.1 |
| Loss of 30–45% | −17.8 ± 360.8 | 102.4 ± 264.5 | 77.13 ± 172.9 | 138.5 ± 169.7 | 1.1 ± 237.3 | 78.5 ± 227.9 |
| Loss of >45% | 121.2 ± 470.4 | 379.1 ± 367.3 | 393.32 ± 204.0 | 474.3 ± 181.4 | 209.3 ± 322.5 | 348.9 ± 277.9 |
| Blood Loss Stage | HCT Value (%) | HCT Variation (%) | Estimated BLV Error-Ward’s (mL) | Estimated BLV Error-Bourke’s (mL) | Estimated BLV Error-Gross’s (mL) |
|---|---|---|---|---|---|
| Baseline | 30.8 ± 6.0 | \ | \ | \ | \ |
| Blood loss < 30% | 28.4 ± 4.8 | −9.6 ± 7.1 | 238.7 ± 295.6 | 188.8 ± 286.7 | 236.4 ± 293.5 |
| Blood loss > 30% | 28.3 ± 5.7 | −3.9 ± 13.8 | 98.9 ± 390.1 | 70.9 ± 354.5 | 93.2 ± 388.0 |
| Over all | \ | \ | 134.7 ± 343.4 | 102.1 ± 313.5 | 131.2 ± 341.4 |
| Features | PPG Personal | PPG Grouped | ABP Personal | ABP Grouped | PPG&ABP Personal | PPG&ABP Grouped |
|---|---|---|---|---|---|---|
| Mean Pulse Rate | 5 | 9 | 5 | 7 | 13 | 5 |
| Min Pulse Rate | 20 | 5 | 6 | 9 | 19 | 7 |
| PPG peak Amplitude | 9 | 11 | \ | \ | 20 | 9 |
| PPG peak Amplitude Variation | 11 | 15 | \ | \ | 4 | 18 |
| PPG peak–foot amplitude | 1 | 1 | \ | \ | 1 | 10 |
| PPG peak–foot amplitude variation | 10 | 4 | \ | \ | 26 | 3 |
| Slope Transit Time | 12 | 22 | \ | \ | 12 | 19 |
| Systolic Time | 4 | 6 | \ | \ | 6 | 2 |
| Systolic Area | 14 | 8 | \ | \ | 16 | 13 |
| Systolic Area Ratio | 15 | 10 | \ | \ | 15 | 14 |
| Notch Area | 8 | 14 | \ | \ | 5 | 29 |
| Notch Area Ratio | 6 | 25 | \ | \ | 8 | 30 |
| Diastolic time | 3 | 7 | \ | \ | 9 | 6 |
| Diastolic Area | 21 | 3 | \ | \ | 25 | 16 |
| Diastolic area ratio | 7 | 13 | \ | \ | 17 | 27 |
| PIR | 2 | 2 | \ | \ | 2 | 4 |
| Mean SBP | \ | \ | 1 | 2 | 3 | 8 |
| Mean DBP | \ | \ | 2 | 1 | 10 | 1 |
| Mean PP | \ | \ | 4 | 3 | 7 | 11 |
| Mean SBP variation | \ | \ | 3 | 5 | 14 | 17 |
| Mean DBP Variation | \ | \ | 6 | 6 | 18 | 22 |
| Mean PP Variation | \ | \ | 7 | 4 | 19 | 12 |
| Features | PPG Personal | PPG Grouped | ABP Personal | ABP Grouped | PPG&ABP Personal | PPG&ABP Grouped |
|---|---|---|---|---|---|---|
| Mean Pulse Rate | 6 | 9 | 5 | 6 | 3 | 13 |
| Min Pulse Rate | 16 | 17 | 7 | 8 | 13 | 18 |
| PPG Peak Amplitude | 2 | 6 | \ | \ | 14 | 8 |
| PPG Peak Amplitude Variation | 3 | 5 | \ | \ | 12 | 4 |
| PPG Peak–Foot Amplitude | 1 | 1 | \ | \ | 7 | 2 |
| PPG Peak–Foot Amplitude Variation | 5 | 3 | \ | \ | 22 | 11 |
| Slope Transit Time | 8 | 15 | \ | \ | 23 | 12 |
| Systolic Time | 9 | 2 | \ | \ | 6 | 10 |
| Systolic Area | 11 | 6 | \ | \ | 11 | 9 |
| Systolic Area Ratio | 15 | 10 | \ | \ | 18 | 6 |
| Notch Area | 17 | 7 | \ | \ | 8 | 16 |
| Notch Area Ratio | 10 | 4 | \ | \ | 16 | 14 |
| Diastolic Time | 14 | 11 | \ | \ | 9 | 19 |
| Diastolic Area | 4 | 5 | \ | \ | 5 | 15 |
| Diastolic Area Ratio | 20 | 12 | \ | \ | 15 | 29 |
| PIR | 7 | 8 | \ | \ | 10 | 5 |
| Mean SBP | \ | \ | 3 | 2 | 2 | 3 |
| Mean DBP | \ | \ | 1 | 1 | 1 | 1 |
| Mean PP | \ | \ | 4 | 3 | 4 | 7 |
| Mean SBP Variation | \ | \ | 2 | 4 | 27 | 26 |
| Mean DBP Variation | \ | \ | 8 | 10 | 28 | 17 |
| Mean PP Variation | \ | \ | 6 | 5 | 30 | 24 |
Publisher’s Note: MDPI stays neutral with regard to jurisdictional claims in published maps and institutional affiliations. |
© 2020 by the authors. Licensee MDPI, Basel, Switzerland. This article is an open access article distributed under the terms and conditions of the Creative Commons Attribution (CC BY) license (http://creativecommons.org/licenses/by/4.0/).
Share and Cite
Chen, Y.; Hong, C.; Pinsky, M.R.; Ma, T.; Clermont, G. Estimating Surgical Blood Loss Volume Using Continuously Monitored Vital Signs. Sensors 2020, 20, 6558. https://doi.org/10.3390/s20226558
Chen Y, Hong C, Pinsky MR, Ma T, Clermont G. Estimating Surgical Blood Loss Volume Using Continuously Monitored Vital Signs. Sensors. 2020; 20(22):6558. https://doi.org/10.3390/s20226558
Chicago/Turabian StyleChen, Yang, Chengcheng Hong, Michael R. Pinsky, Ting Ma, and Gilles Clermont. 2020. "Estimating Surgical Blood Loss Volume Using Continuously Monitored Vital Signs" Sensors 20, no. 22: 6558. https://doi.org/10.3390/s20226558
APA StyleChen, Y., Hong, C., Pinsky, M. R., Ma, T., & Clermont, G. (2020). Estimating Surgical Blood Loss Volume Using Continuously Monitored Vital Signs. Sensors, 20(22), 6558. https://doi.org/10.3390/s20226558