A Multimodal Intention Detection Sensor Suite for Shared Autonomy of Upper-Limb Robotic Prostheses


 , ,
, ,  and
and
Abstract
1. Introduction
1.1. Existing Instrumentation Challenges
1.2. Shared Autonomy: A Potential Solution
1.3. Contributions of Work
- -
- Introduction of a multimodal sensing system for intention detection and grasp selection using mechanomyography, computer vision, and inertial measurement units.
- -
- Real-time implementation and evaluation of the multimodal system using low-complexity algorithms.
- -
- Minimizing the calibration time due to the novel sensory fusion.
- -
- User study evaluation, including timed activity-based experiments with ten able-bodied participants and one transradial amputee.
2. Methods
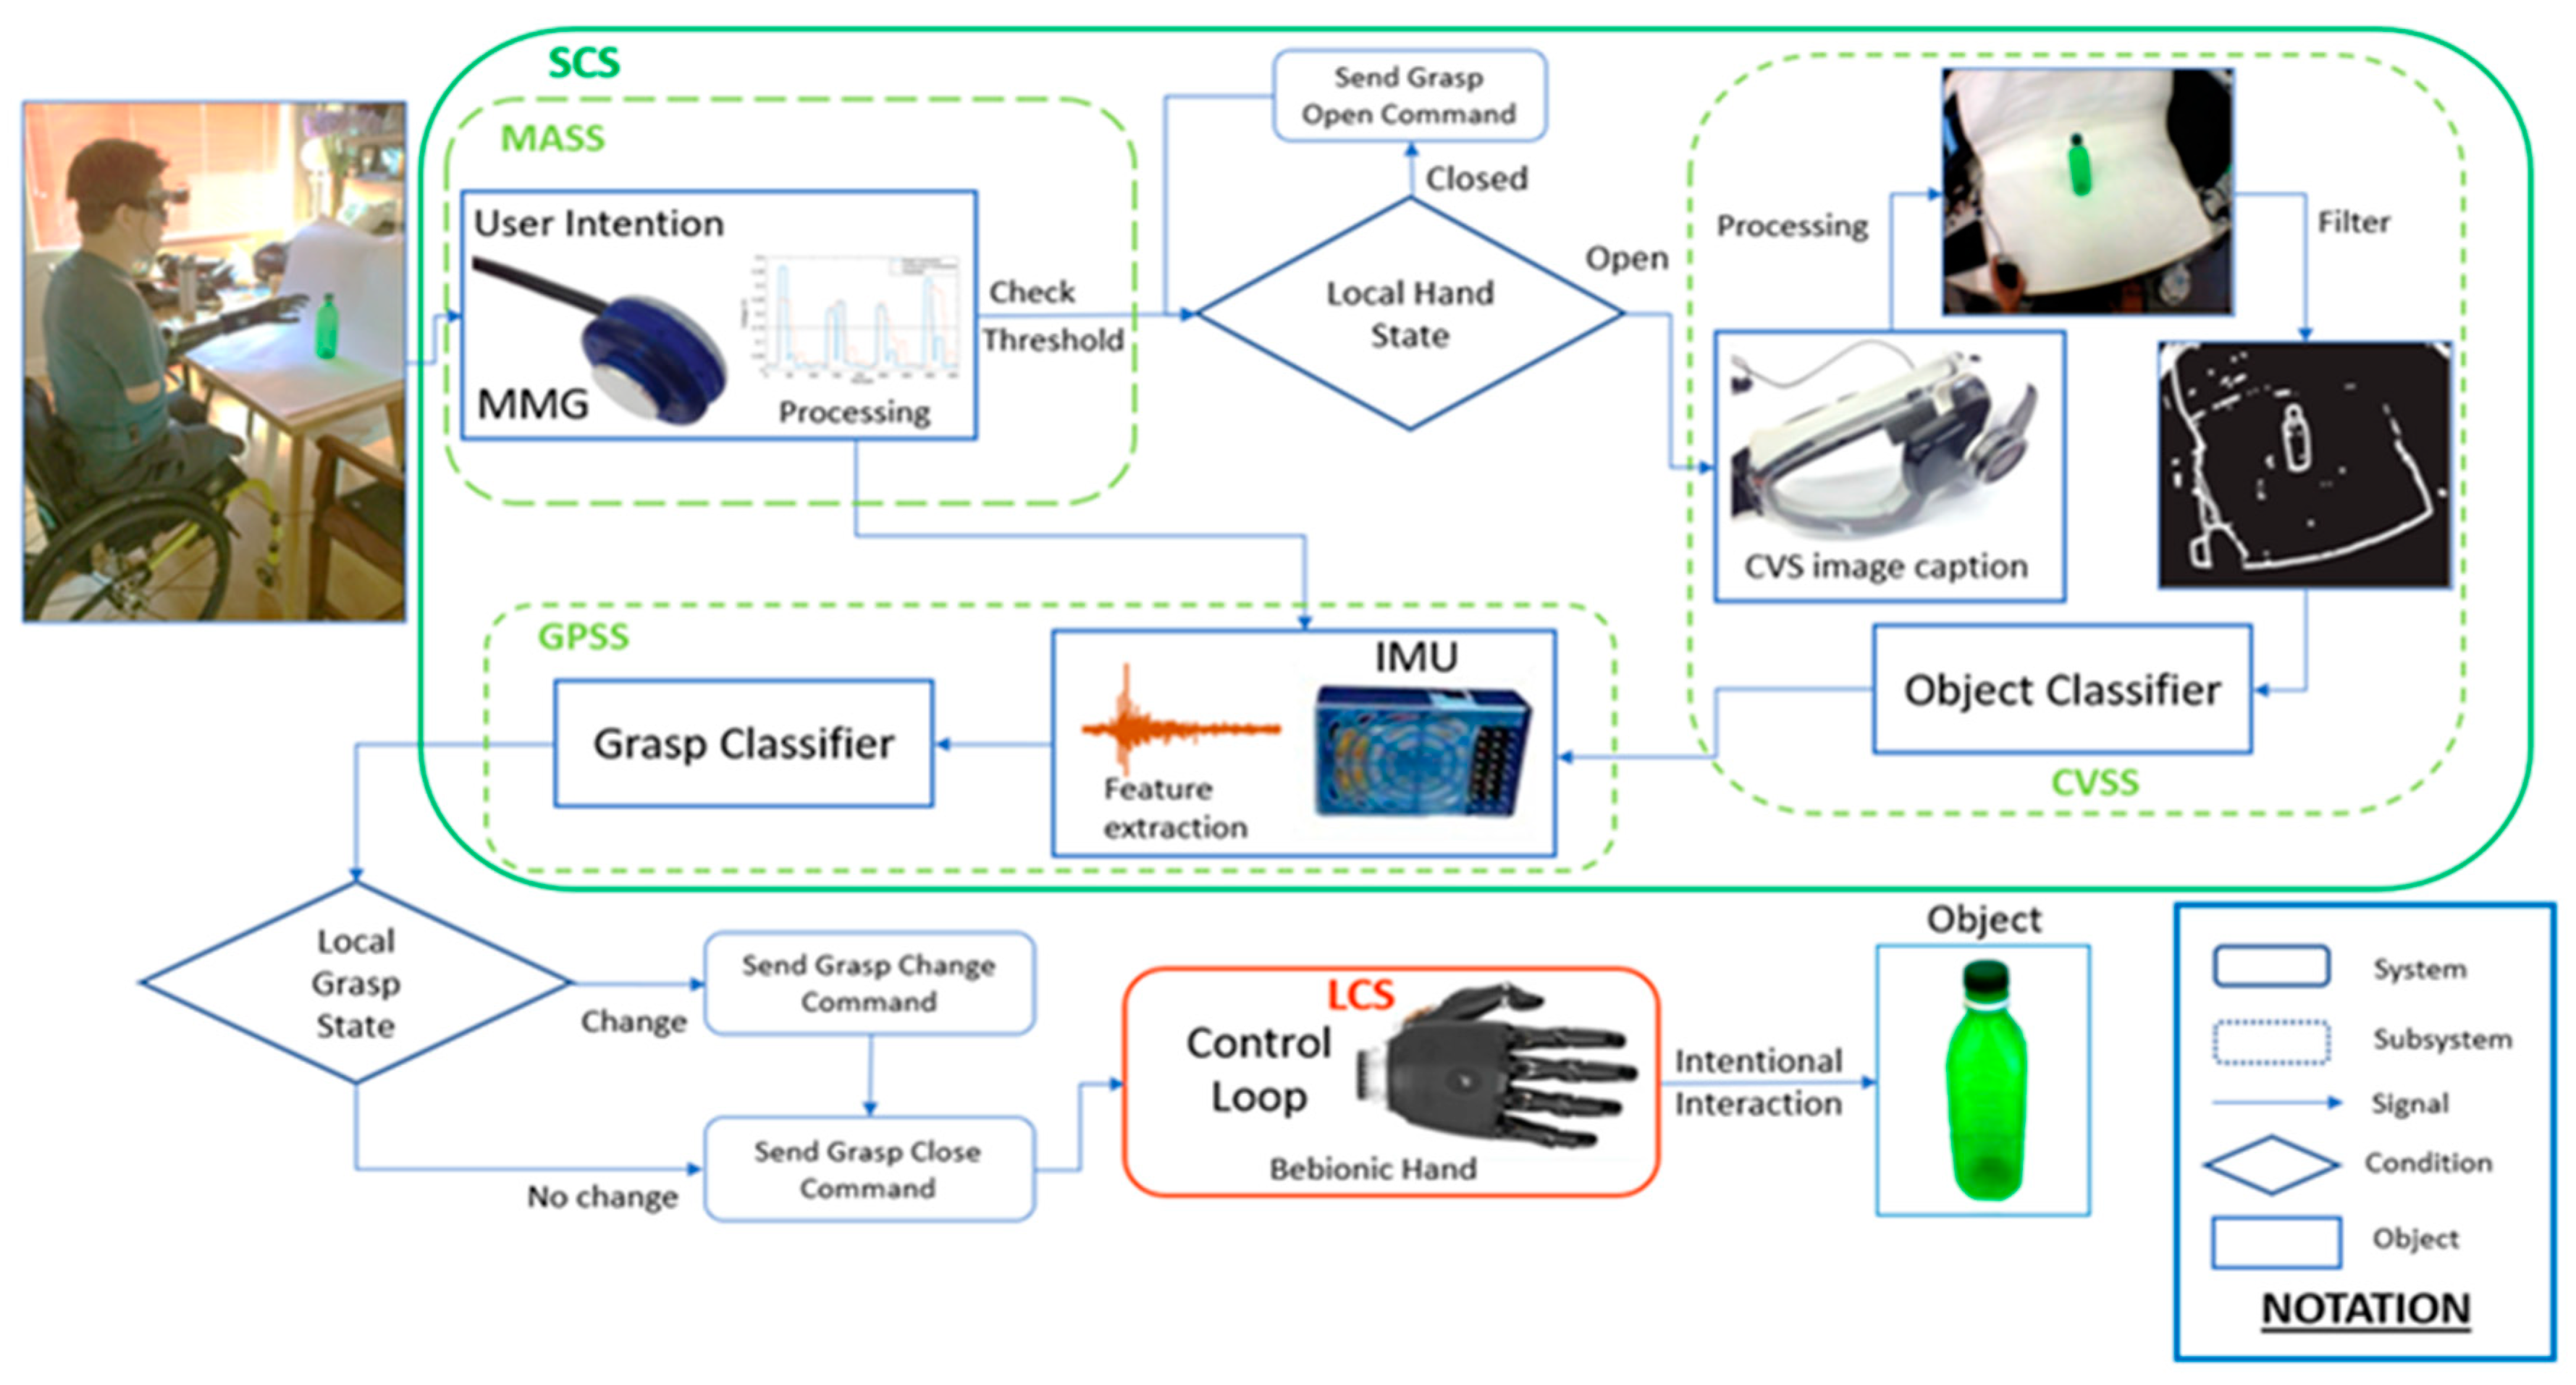
2.1. Human–Robot Interface Architecture
2.1.1. Muscle Activation Subsystem
2.1.2. Computer Vision Subsystem
2.1.3. Grasp Prediction Subsystem
2.1.4. Control Flow
2.1.5. The Low-Level Local Control System
2.2. Demographic Data
2.3. Experimental Protocol
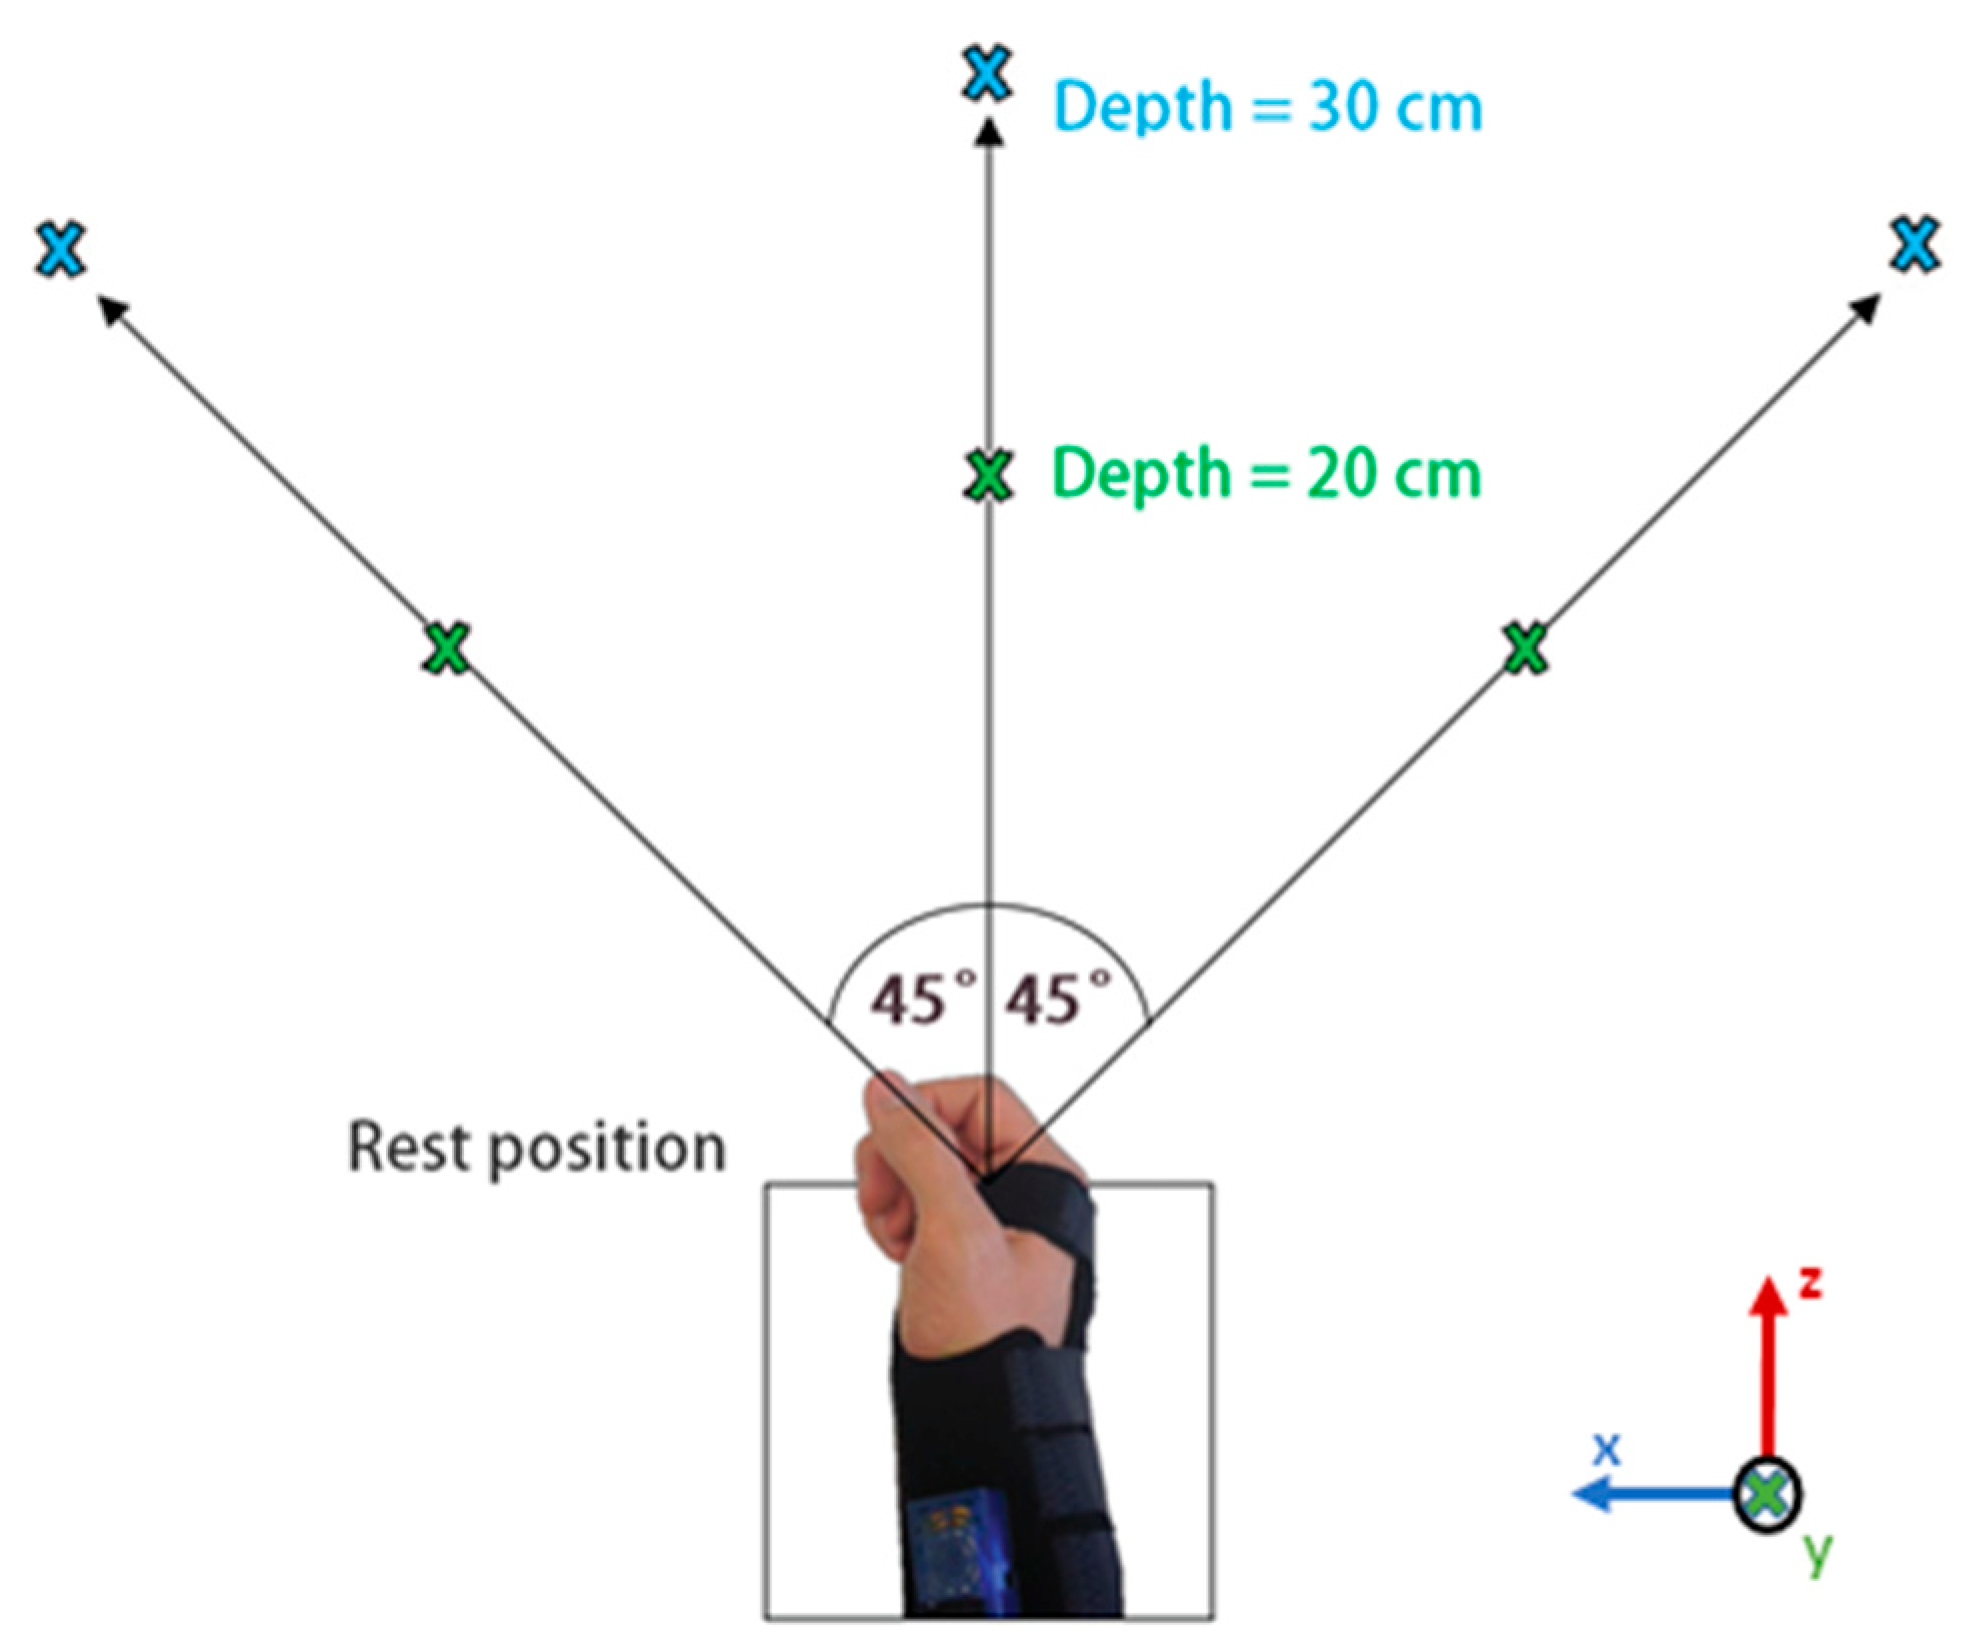
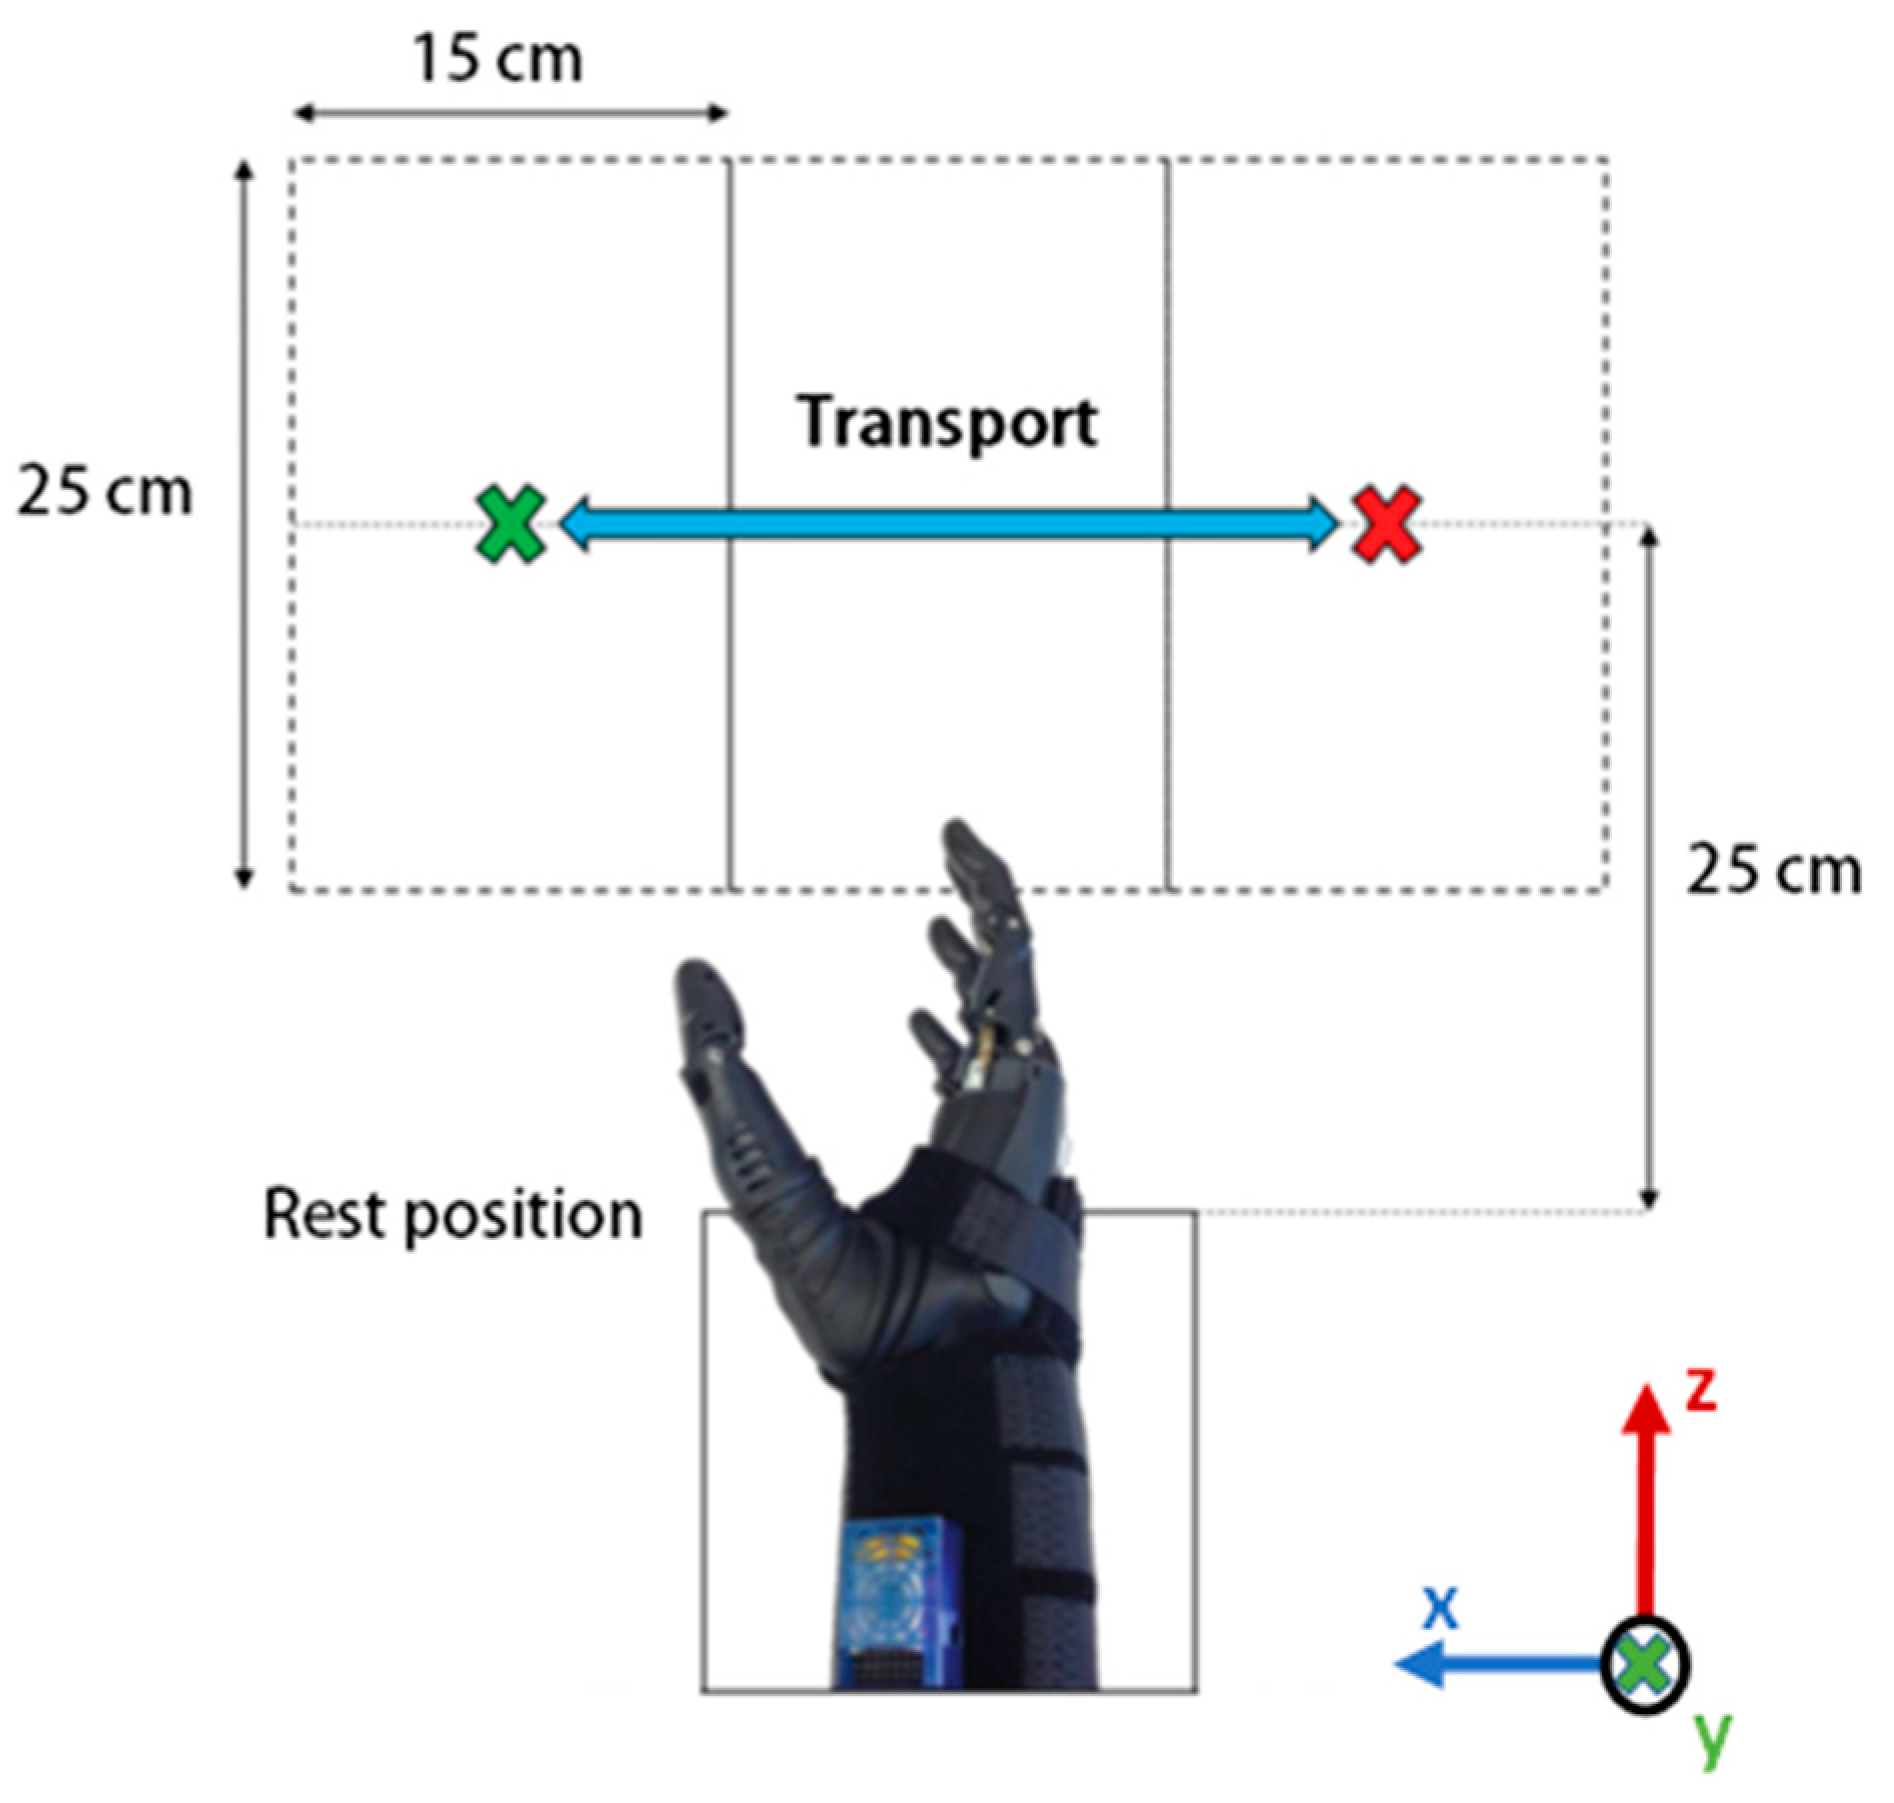
2.3.1. Phase 1—Data Collection Protocol
- Table height: object placed on the table while user seats.
- Ascending: object raised 15 cm on table while user seats.
- Descending: object placed on the table while user stands.
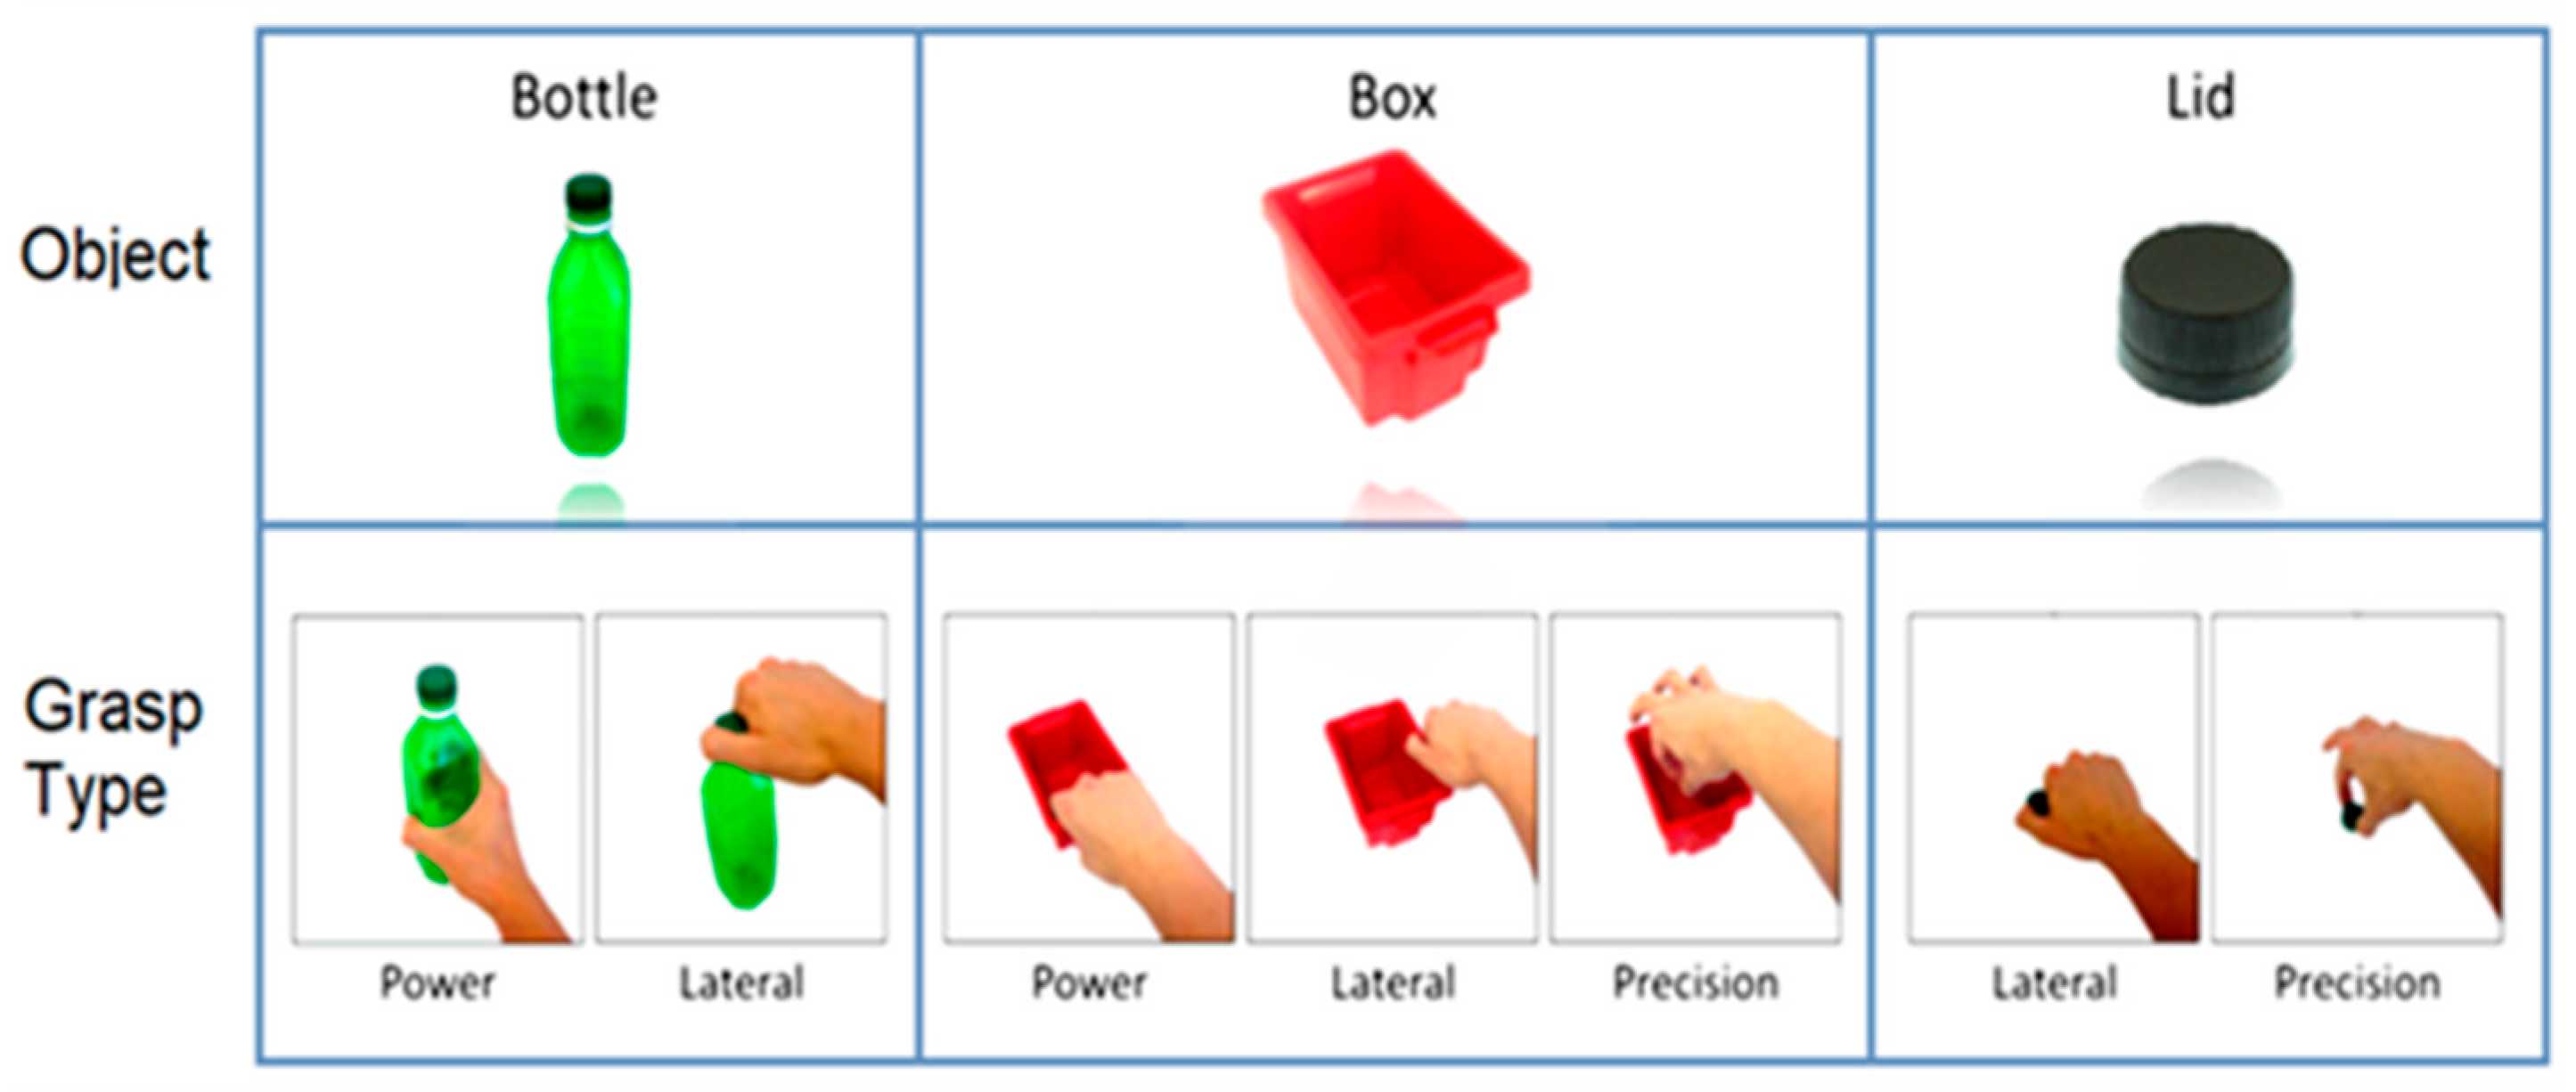
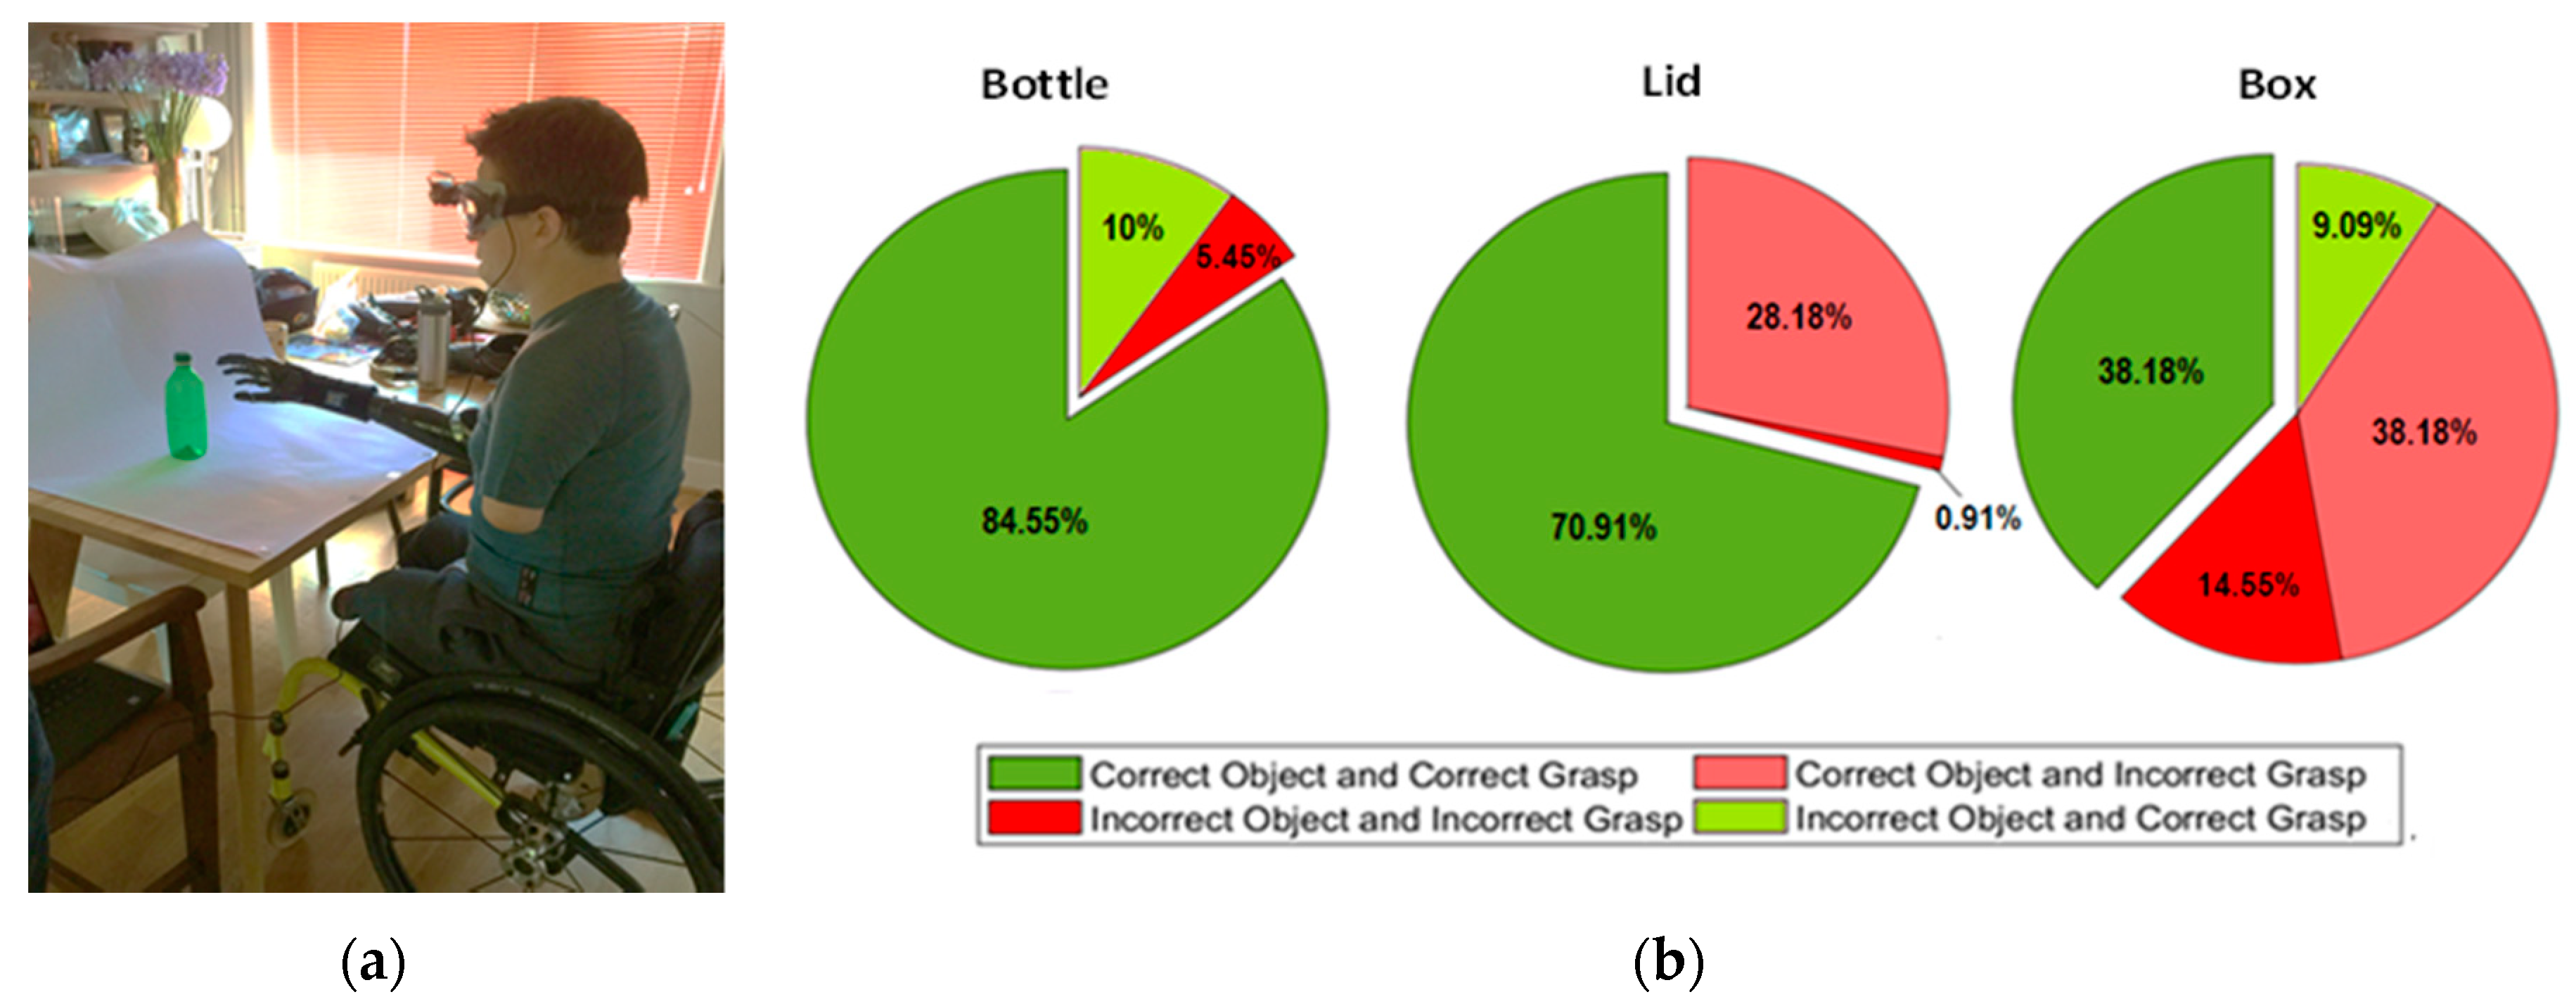
2.3.2. Phase 2—Real-Time Task Conduction and Assessment Protocol for Classification Performance
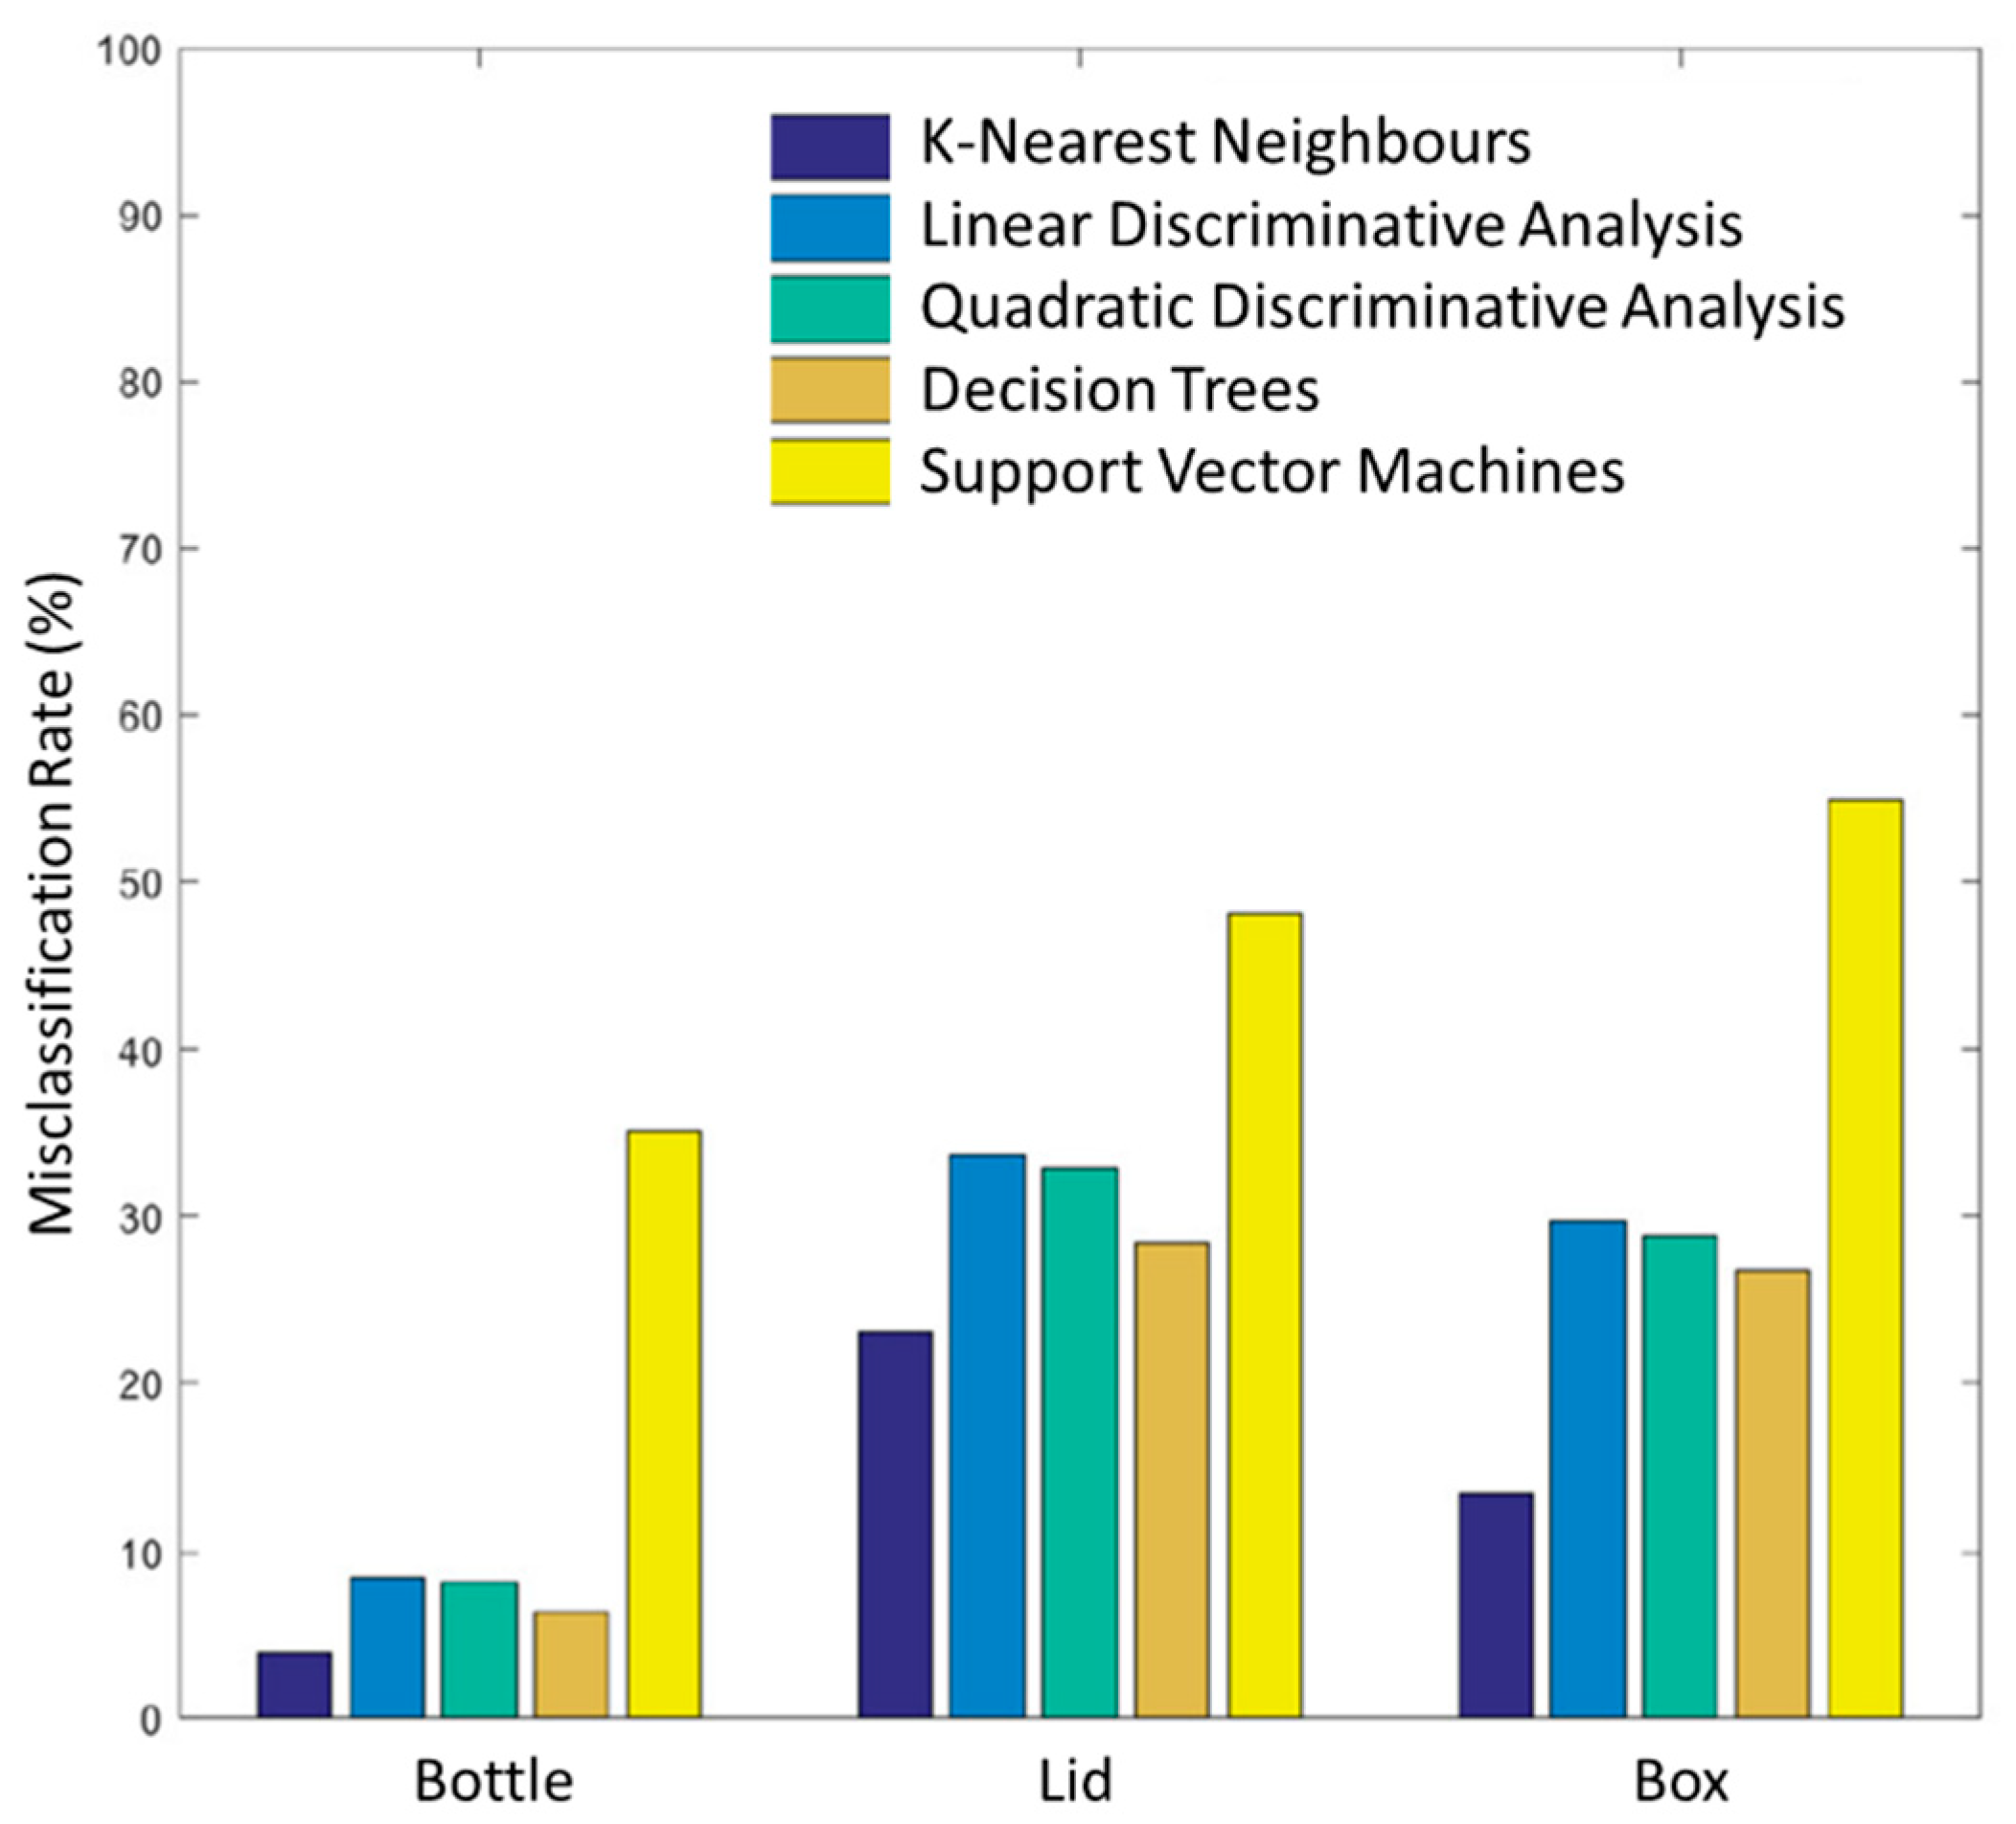
- Bottle (power and lateral);
- Lid (lateral and precision);
- Box (power, lateral, and precision).
3. Results
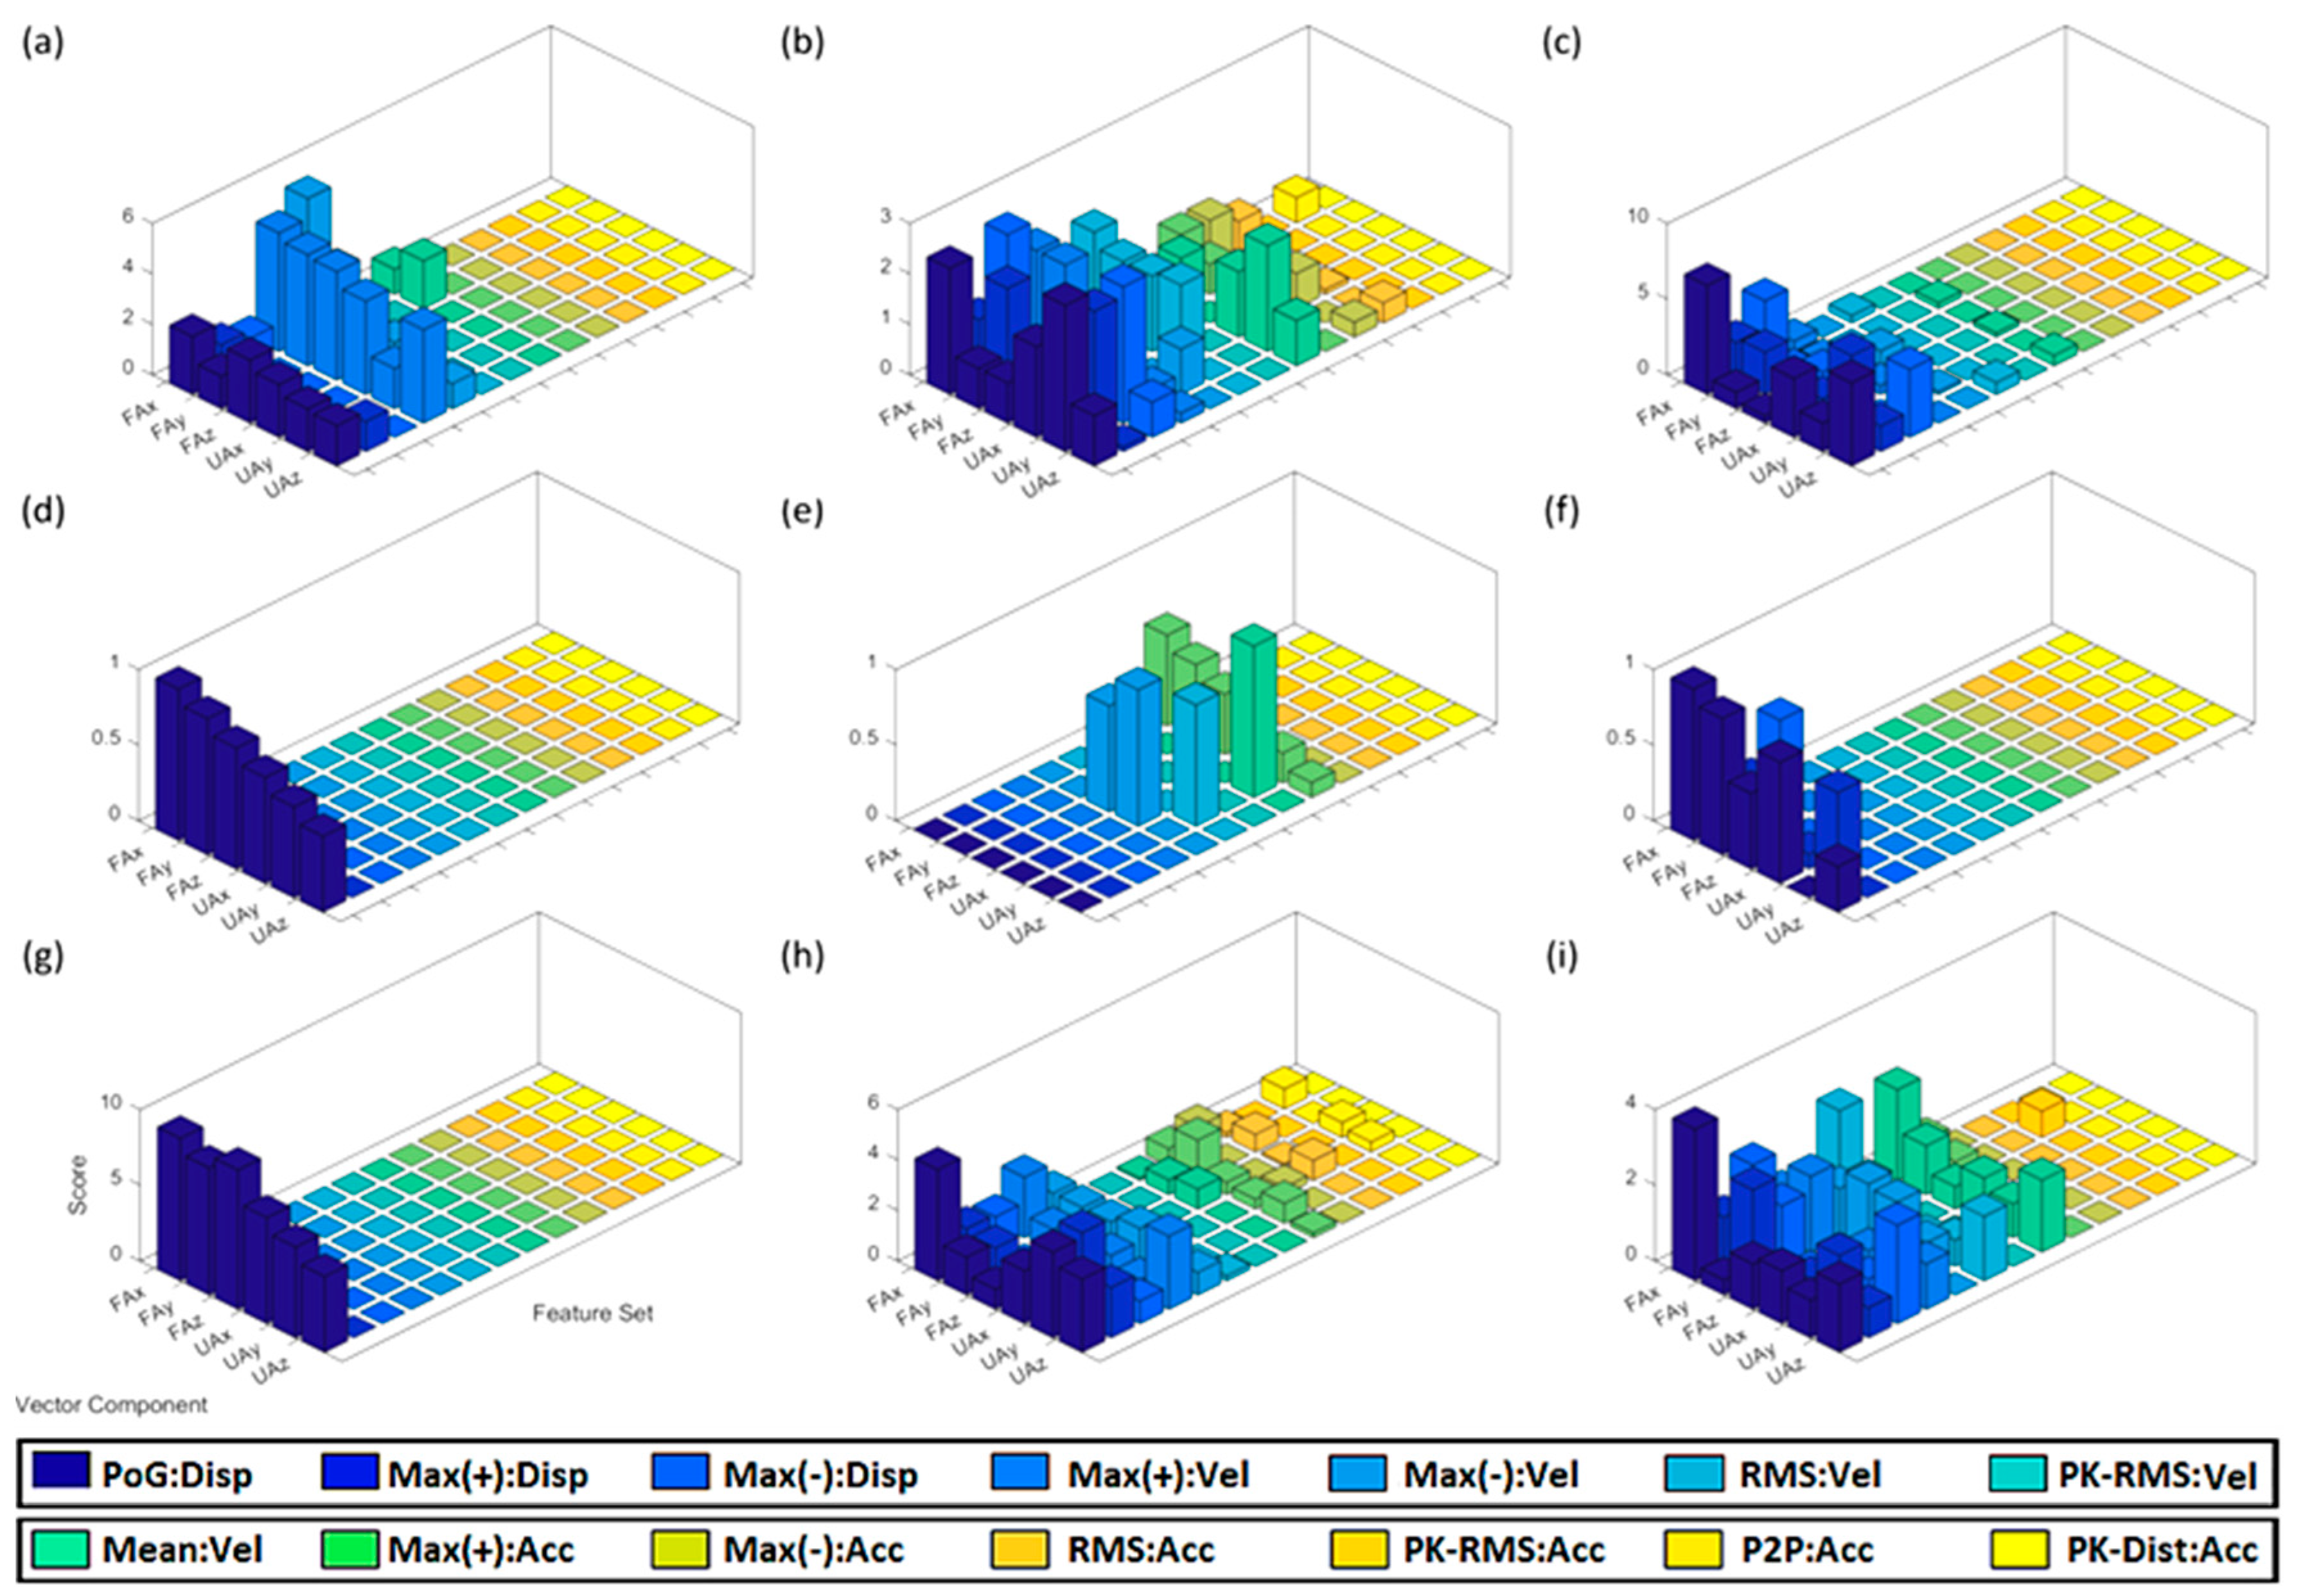
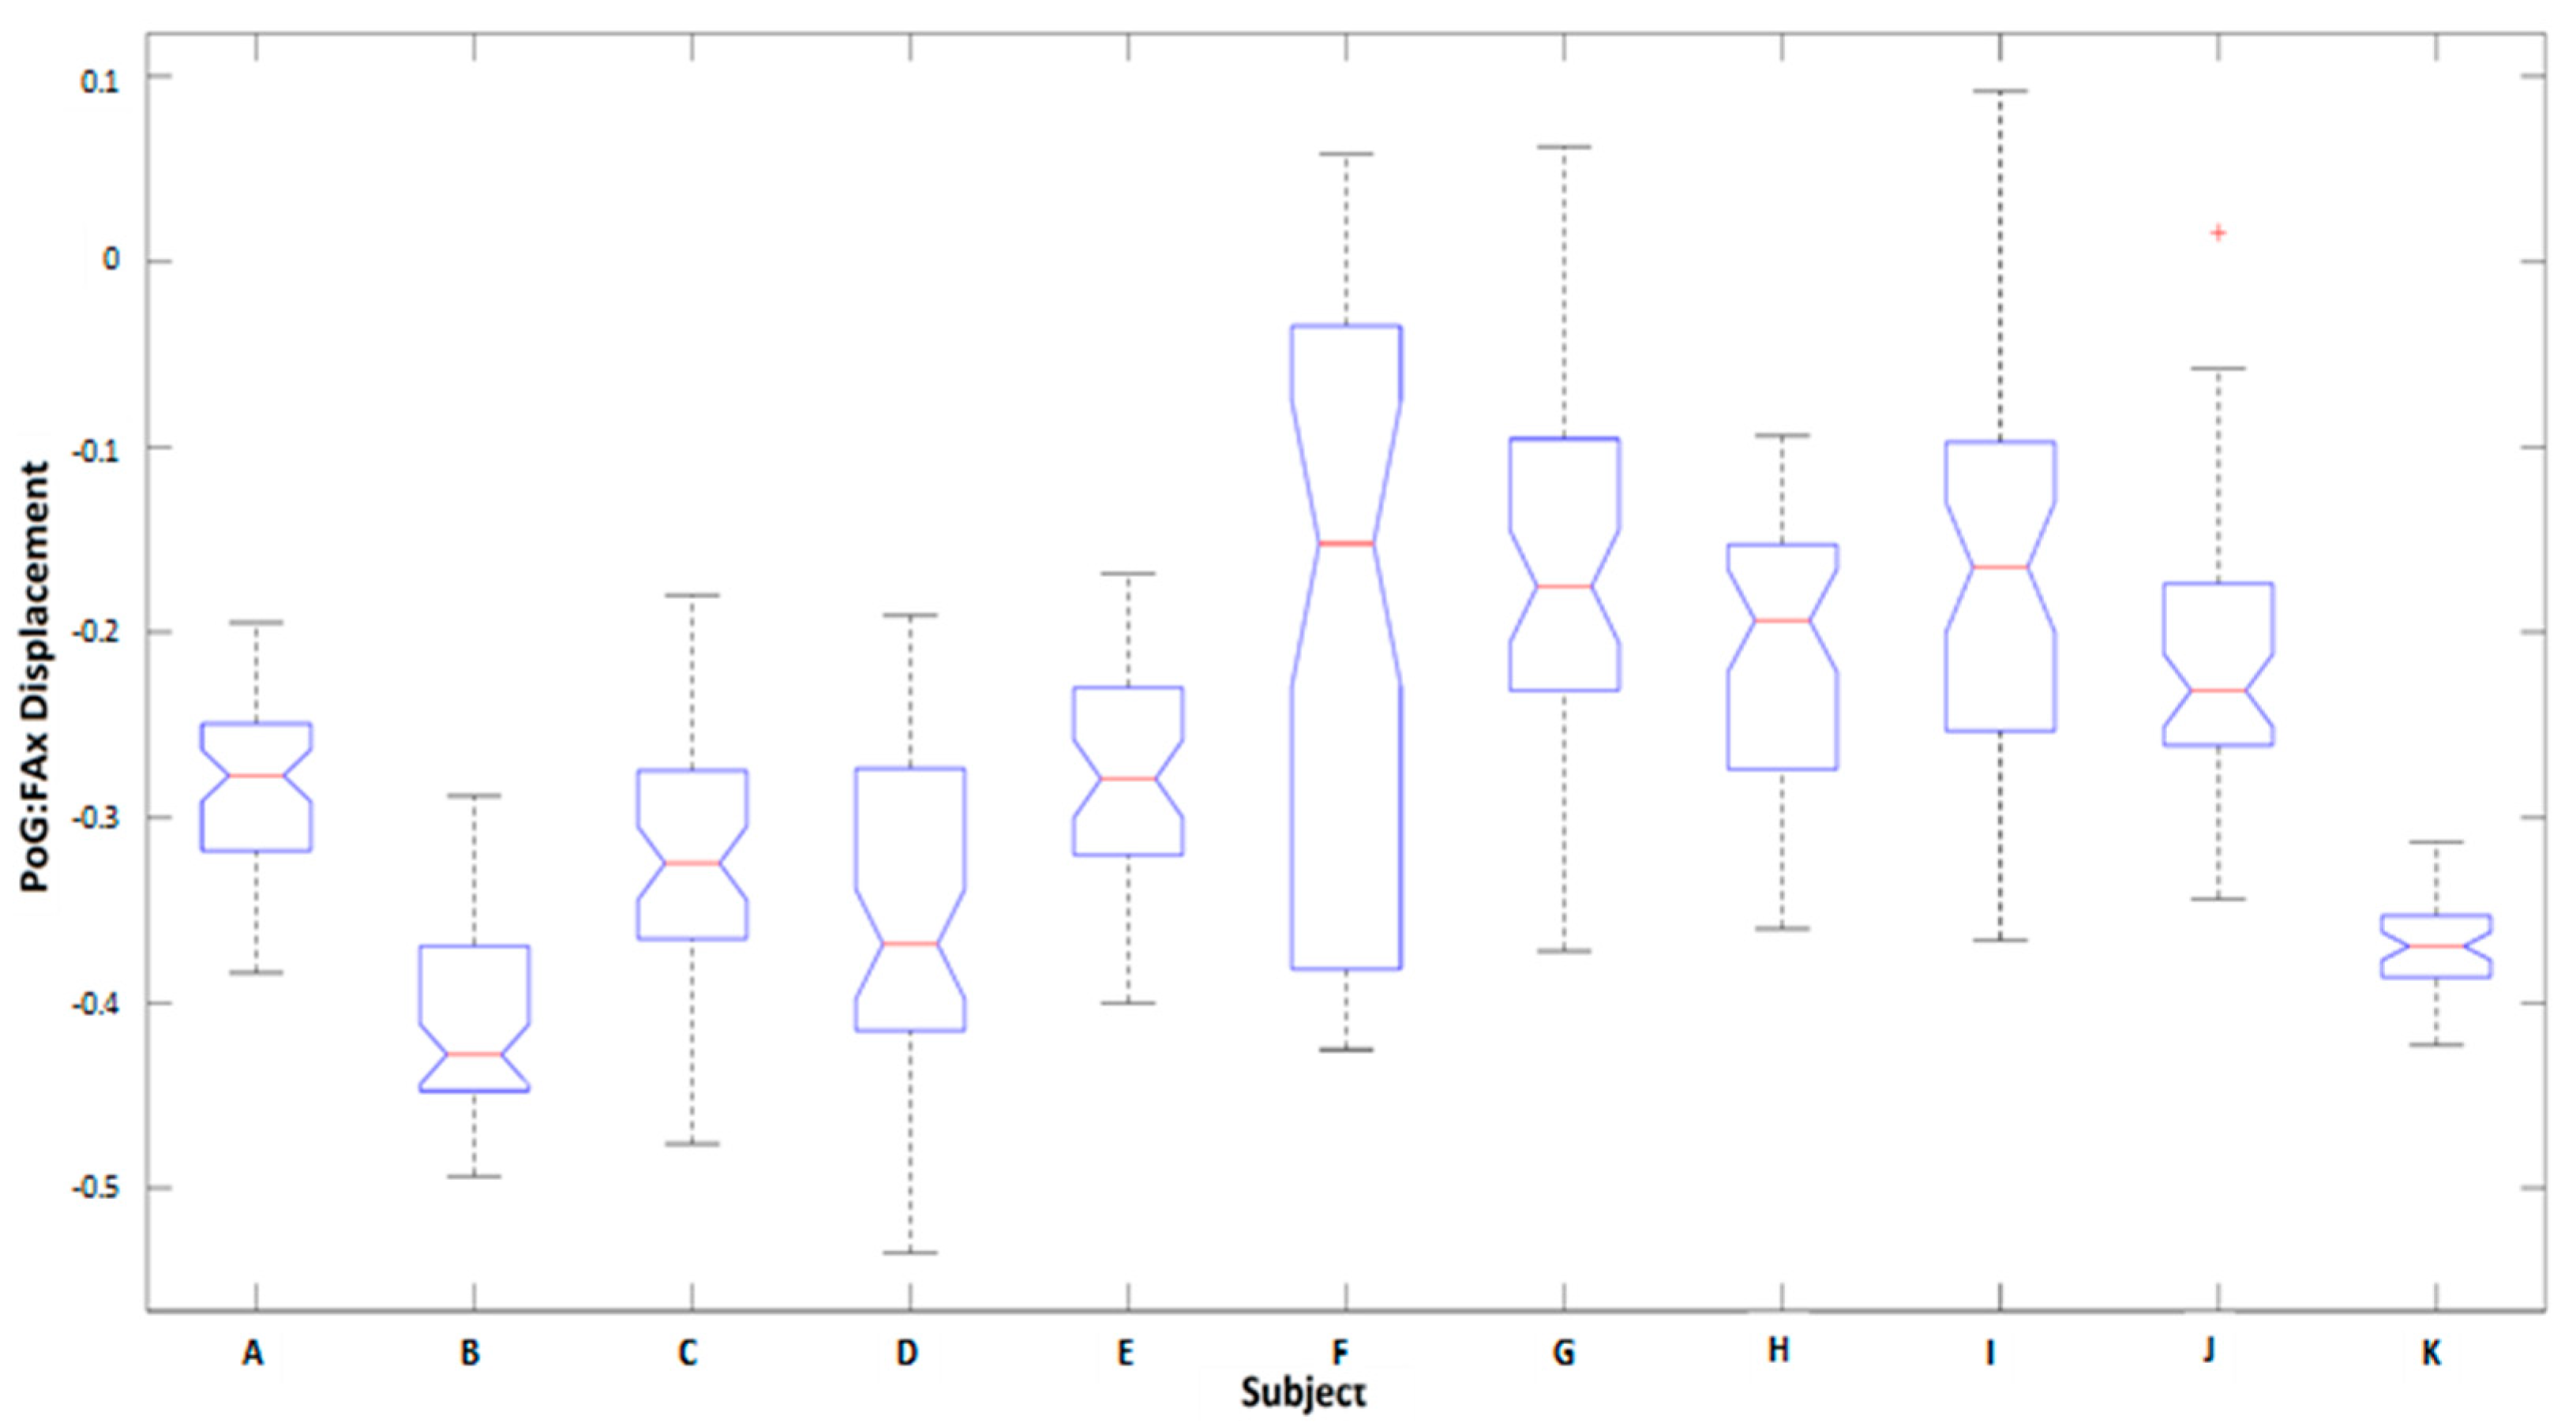
3.1. Kinematic Features
3.2. Classification Performance Assessment Evaluation
4. Discussion
4.1. Analysis of Kinematic Features
4.1.1. Observations Related to All Object Positions
4.1.2. Observations Related to Table-Height/Ascending Positions
4.1.3. Comparison: Displacement, Velocity, and Acceleration
4.2. Classification Performance Assessment Evaluation
5. Conclusions
Author Contributions
Funding
Acknowledgments
Conflicts of Interest
References
- Biddiss, E.; Chau, T. The roles of predisposing characteristics, established need, and enabling resources on upper extremity prosthesis use and abandonment. Disabil. Rehabil. Assist. Technol. 2007, 2, 71–84. [Google Scholar] [CrossRef] [PubMed]
- Belter, J.T.; Dollar, A.M. Performance characteristics of anthropomorphic prosthetic hands. IEEE Int. Conf. Rehabil. Robot. 2011, 2011, 5975476. [Google Scholar]
- Gailey, A.S.; Godfrey, S.B.; Breighner, R.E.; Andrews, K.L.; Zhao, K.D.; Bicchi, A.; Santello, M. Grasp Performance of a Soft Synergy-Based Prosthetic Hand: A Pilot Study. IEEE Trans. Neural. Syst. Rehabil. Eng. 2017, 25, 2407–2417. [Google Scholar] [CrossRef] [PubMed]
- Geethanjali, P. Myoelectric control of prosthetic hands: State-of-the-art review. Med. Devices 2016, 9, 247–255. [Google Scholar] [CrossRef] [PubMed]
- Cordella, F.; Ciancio, A.L.; Sacchetti, R.; Davalli, A.; Cutti, A.G.; Guglielmelli, E.; Zollo, L. Literature review on needs of upper limb prosthesis users. Front. Neurosci. 2016, 10, 209. [Google Scholar] [CrossRef] [PubMed]
- Bi, L.; Guan, C. A review on EMG-based motor intention prediction of continuous human upper limb motion for human-robot collaboration. Biomed. Signal Process. Control 2019, 51, 113–127. [Google Scholar] [CrossRef]
- Simao, M.; Mendes, N.; Gibaru, O.; Neto, P. A Review on Electromyography Decoding and Pattern Recognition for Human-Machine Interaction. IEEE Access 2019, 7, 39564–39582. [Google Scholar] [CrossRef]
- Biddiss, E.A.; Chau, T.T. Upper limb prosthesis use and abandonment: A survey of the last 25 years. Prosthet. Orthot. Int. 2007, 31, 236–257. [Google Scholar] [CrossRef]
- Burger, H.; Vidmar, G. A survey of overuse problems in patients with acquired or congenital upper limb deficiency. Prosthet. Orthot. Int. 2016, 40, 497–502. [Google Scholar] [CrossRef]
- Stango, A.; Negro, F.; Farina, D. Spatial correlation of high density EMG signals provides features robust to electrode number and shift in pattern recognition for myocontrol. IEEE Trans. Neural Syst. Rehabil. Eng. 2015, 23, 189–198. [Google Scholar] [CrossRef]
- Al-Angari, H.M.; Kanitz, G.; Tarantino, S.; Cipriani, C. Distance and mutual information methods for EMG feature and channel subset selection for classification of hand movements. Biomed. Signal Process. Control 2016, 27, 24–31. [Google Scholar] [CrossRef]
- Batzianoulis, I.; Krausz, N.E.; Simon, A.M.; Hargrove, L.; Billard, A. Decoding the grasping intention from electromyography during reaching motions. J. Neuroeng. Rehabil. 2018, 15, 57. [Google Scholar] [CrossRef]
- Chadwell, A.; Kenney, L.; Thies, S.; Galpin, A.; Head, J. The reality of myoelectric prostheses: Understanding what makes these devices difficult for some users to control. Front. Neurorobot. 2016, 10, 7. [Google Scholar] [CrossRef] [PubMed]
- Sang, Y.; Li, X.; Luo, Y. Biomechanical design considerations for transradial prosthetic interface: A review. Proc. Inst. Mech. Eng. Part H J. Eng. Med. 2016, 230, 239–250. [Google Scholar] [CrossRef]
- Weiner, P.; Neef, C.; Shibata, Y.; Nakamura, Y.; Asfour, T. An Embedded, Multi-Modal Sensor System for Scalable Robotic and Prosthetic Hand Fingers. Sensors 2019, 20, 101. [Google Scholar] [CrossRef]
- Ibitoye, M.O.; Hamzaid, N.A.; Zuniga, J.M.; Abdul Wahab, A.K. Mechanomyography and muscle function assessment: A review of current state and prospects. Clin. Biomech. 2014, 29, 691–704. [Google Scholar] [CrossRef] [PubMed]
- Ibitoye, M.O.; Hamzaid, N.A.; Zuniga, J.M.; Hasnan, N.; Wahab, A.K.A. Mechanomyographic parameter extraction methods: An appraisal for clinical applications. Sensors 2014, 14, 22940–22970. [Google Scholar] [CrossRef] [PubMed]
- Geng, Y.; Chen, L.; Tian, L.; Li, G. Comparison of Electromyography and Mechanomyogram in Control of Prosthetic System in Multiple Limb Positions. In Proceedings of the 2012 IEEE-EMBS International Conference on Biomedical and Health Informatics, Hong Kong, China, 5–7 January 2012; IEEE: Piscataway, NJ, USA, 2012; pp. 788–791. [Google Scholar]
- Beck, T.W.; Housh, T.J.; Johnson, G.O.; Cramer, J.T.; Weir, J.P.; Coburn, J.W.; Malek, M.H. Does the frequency content of the surface mechanomyographic signal reflect motor unit firing rates? A brief review. J. Electromyogr. Kinesiol. 2007, 17, 1–13. [Google Scholar] [CrossRef]
- Woodward, R.B.; Shefelbine, S.J.; Vaidyanathan, R. Pervasive monitoring of motion and muscle activation: Inertial and mechanomyography fusion. IEEE/ASME Trans. Mechatron. 2017, 22, 2022–2033. [Google Scholar] [CrossRef]
- Kim, D.; Kang, B.B.; Kim, K.B.; Choi, H.; Ha, J.; Cho, K.J.; Jo, S. Eyes are faster than hands: A soft wearable robot learns user intention from the egocentric view. Sci. Robot. 2019, 4, eaav2949. [Google Scholar] [CrossRef]
- Xiloyannis, M.; Gavriel, C.; Thomik, A.A.C.; Faisal, A.A. Gaussian Process Autoregression for Simultaneous Proportional Multi-Modal Prosthetic Control with Natural Hand Kinematics. IEEE Trans. Neural Syst. Rehabil. Eng. 2017, 25, 1785–1801. [Google Scholar] [CrossRef] [PubMed]
- Došen, S.; Cipriani, C.; Kostić, M.; Controzzi, M.; Carrozza, M.C.; Popović, D.B. Cognitive vision system for control of dexterous prosthetic hands: Experimental evaluation. J. Neuroeng. Rehabil. 2010, 7, 42. [Google Scholar] [CrossRef]
- Markovic, M.; Dosen, S.; Cipriani, C.; Popovic, D.; Farina, D. Stereovision and augmented reality for closed-loop control of grasping in hand prostheses. J. Neural Eng. 2014, 11, 046001. [Google Scholar] [CrossRef] [PubMed]
- Markovic, M.; Dosen, S.; Popovic, D.; Graimann, B.; Farina, D. Sensor fusion and computer vision for context-aware control of a multi degree-of-freedom prosthesis. J. Neural Eng. 2015, 12, 066022. [Google Scholar] [CrossRef]
- Gardner, M.; Woodward, R.; Vaidyanathan, R.; Burdet, E.; Khoo, B.C. An Unobtrusive Vision System to Reduce the Cognitive Burden of Hand Prosthesis Control. In Proceedings of the 2014 13th International Conference on Control Automation Robotics & Vision (ICARCV), Singapore, 10–12 December 2014; IEEE: Piscataway, NJ, USA, 2014; pp. 1279–1284. [Google Scholar]
- Tang, S.; Ghosh, R.; Thakor, N.V.; Kukreja, S.L. Orientation Estimation and Grasp Type Detection of Household Objects for Upper Limb Prostheses with Dynamic Vision Sensor. In Proceedings of the 2016 IEEE Biomedical Circuits and Systems Conference (BioCAS), Shanghai, China, 17–19 October 2016; IEEE: Piscataway, NJ, USA, 2016; pp. 99–102. [Google Scholar]
- Ghazaei, G.; Alameer, A.; Degenaar, P.; Morgan, G.; Nazarpour, K. Deep learning-based artificial vision for grasp classification in myoelectric hands. J. Neural Eng. 2017, 14, 036025. [Google Scholar] [CrossRef]
- Ivorra, E.; Ortega, M.; Alcaniz, M.; Garcia-Aracil, N. Multimodal computer vision framework for human assistive robotics. In Proceedings of the 2018 Workshop on Metrology for Industry 40 and IoT, Brescia, Italy, 16–18 April 2018; IEEE: Piscataway, NJ, USA, 2018; pp. 1–5. [Google Scholar]
- Wang, C.; Zhang, X.; Zang, X.; Liu, Y.; Ding, G.; Yin, W.; Zhao, J. Feature Sensing and Robotic Grasping of Objects with Uncertain Information: A Review. Sensors 2020, 20, 3707. [Google Scholar] [CrossRef] [PubMed]
- Yan, T.; Sun, Y.; Liu, T.; Cheung, C.-H.; Meng, M.Q.-H. A locomotion recognition system using depth images. In Proceedings of the 2018 IEEE International Conference on Robotics and Automation (ICRA), Brisbane, Australia, 21–25 May 2018; IEEE: Piscataway, NJ, USA, 2018; pp. 6766–6772. [Google Scholar]
- Wilson, S.; Eberle, H.; Hayashi, Y.; Madgwick, S.O.; McGregor, A.; Jing, X.; Vaidyanathan, R. Formulation of a new gradient descent MARG orientation algorithm: Case study on robot teleoperation. Mech. Syst. Signal Process. 2019, 130, 183–200. [Google Scholar] [CrossRef]
- Wilson, S.; Vaidyanathan, R. Upper-limb prosthetic control using wearable multichannel mechanomyography. IEEE Int. Conf. Rehabil. Robot. 2017, 2017, 1293–1298. [Google Scholar] [PubMed]
- Rahimian, E.; Zabihi, S.; Atashzar, S.F.; Asif, A.; Mohammadi, A. Surface EMG-Based Hand Gesture Recognition via Hybrid and Dilated Deep Neural Network Architectures for Neurorobotic Prostheses. J. Med. Robot. Res. 2020. [Google Scholar] [CrossRef]
- Ma, Y.; Liu, Y.; Jin, R.; Yuan, X.; Sekha, R.; Wilson, S.; Vaidyanathan, R. Hand gesture recognition with convolutional neural networks for the multimodal UAV control. In Proceedings of the 2017 Workshop on Research, Education and Development of Unmanned Aerial Systems (RED-UAS), Linköping, Sweden, 3–5 October 2017; IEEE: Piscataway, NJ, USA, 2017; pp. 198–203. [Google Scholar]
- Madgwick, S.O.H.; Harrison, A.J.L.; Vaidyanathan, A. Estimation of IMU and MARG orientation using a gradient descent algorithm. IEEE Int. Conf. Rehabil. Robot. 2011, 2011, 5975346. [Google Scholar]
- Madgwick, S.O.H.; Wilson, S.; Turk, R.; Burridge, J.; Kapatos, C.; Vaidyanathan, R. An Extended Complementary Filter for Full-Body MARG Orientation Estimation. IEEE/ASME Trans. Mechatron. 2020, 25, 2054–2064. [Google Scholar] [CrossRef]
- Burridge, J.H.; Lee, A.C.; Turk, R.; Stokes, M.; Whitall, J.; Vaidyanathan, R.; Clatworthy, P.; Hughes, A.M.; Meagher, C.; Franco, E.; et al. Telehealth, wearable sensors, and the internet: Will they improve stroke outcomes through increased intensity of therapy, motivation, and adherence to rehabilitation programs? J. Neurol Phys. Ther. 2017, 41 (Suppl. 3), S32–S38. [Google Scholar] [CrossRef] [PubMed]
- Castillo, C.S.; Atashzar, S.F.; Vaidyanathan, R. 3D-Mechanomyography: Accessing Deeper Muscle Information Non-Invasively for Human-Machine Interfacing. In Proceedings of the 2020 IEEE/ASME International Conference on Advanced Intelligent Mechatronics (AIM), Boston, MA, USA, 6–10 July 2020; IEEE: Boston, MA, USA, 2020; pp. 1458–1463. [Google Scholar] [CrossRef]
- Vaidyanathan, R.; Woodward, R.; Nowlan, N.; Shefelbine, S. Biomechanical Activity Monitoring. U.S. Patent 10,335,080 B2, 2 July 2019. [Google Scholar]


| Property | Description |
|---|---|
| Perimeter | Number of pixels around the edge of the blob. |
| Area | Number of pixels within the entire blob. |
| Major-minor Ratio | Ratio of the blob’s major axis to its minor axis. |
| Eccentricity | Parameter denoting non-circularity of the blob. |
| Area-Axis Ratio | Ratio of the blob’s area to the bounding box. |
| Area-Ellipse Ratio | Ratio of the blob’s area to the bounding ellipse. |
| Property | Description |
|---|---|
| PoG:Disp | Final displacement of the arm at the point of grasp (PoG). |
| Max(+):Disp | Maximum displacement during grasp in the + direction. |
| Max(−):Disp | Maximum displacement during grasp in the − direction. |
| Max(+):Vel | Maximum velocity along the positive vector axis. |
| Max(−):Vel | Maximum velocity along the negative vector axis. |
| RMS:Vel | Root-mean-square velocity. |
| PK-RMS:Vel | Ratio of the largest absolute velocity value to the RMS. |
| Mean:Vel | Mean average velocity. |
| Max(+):Acc | Maximum acceleration rates. |
| Max(−):Acc | Maximum deceleration rates. |
| RMS:Acc | Root-mean-square acceleration. |
| PK-RMS:Acc | Ratio of the largest absolute acceleration value to the RMS. |
| P2P:Acc | Maximum-to-minimum difference. |
| PK-Dist:Acc | Time distance between maximum and minimum peaks. |
Publisher’s Note: MDPI stays neutral with regard to jurisdictional claims in published maps and institutional affiliations. |
© 2020 by the authors. Licensee MDPI, Basel, Switzerland. This article is an open access article distributed under the terms and conditions of the Creative Commons Attribution (CC BY) license (http://creativecommons.org/licenses/by/4.0/).
Share and Cite
Gardner, M.; Mancero Castillo, C.S.; Wilson, S.; Farina, D.; Burdet, E.; Khoo, B.C.; Atashzar, S.F.; Vaidyanathan, R. A Multimodal Intention Detection Sensor Suite for Shared Autonomy of Upper-Limb Robotic Prostheses. Sensors 2020, 20, 6097. https://doi.org/10.3390/s20216097
Gardner M, Mancero Castillo CS, Wilson S, Farina D, Burdet E, Khoo BC, Atashzar SF, Vaidyanathan R. A Multimodal Intention Detection Sensor Suite for Shared Autonomy of Upper-Limb Robotic Prostheses. Sensors. 2020; 20(21):6097. https://doi.org/10.3390/s20216097
Chicago/Turabian StyleGardner, Marcus, C. Sebastian Mancero Castillo, Samuel Wilson, Dario Farina, Etienne Burdet, Boo Cheong Khoo, S. Farokh Atashzar, and Ravi Vaidyanathan. 2020. "A Multimodal Intention Detection Sensor Suite for Shared Autonomy of Upper-Limb Robotic Prostheses" Sensors 20, no. 21: 6097. https://doi.org/10.3390/s20216097
APA StyleGardner, M., Mancero Castillo, C. S., Wilson, S., Farina, D., Burdet, E., Khoo, B. C., Atashzar, S. F., & Vaidyanathan, R. (2020). A Multimodal Intention Detection Sensor Suite for Shared Autonomy of Upper-Limb Robotic Prostheses. Sensors, 20(21), 6097. https://doi.org/10.3390/s20216097