Hyperspectral Shortwave Infrared Image Analysis for Detection of Adulterants in Almond Powder with One-Class Classification Method

 ,
, 
Abstract
:1. Introduction
2. Materials and Methods
2.1. Sample Preparation
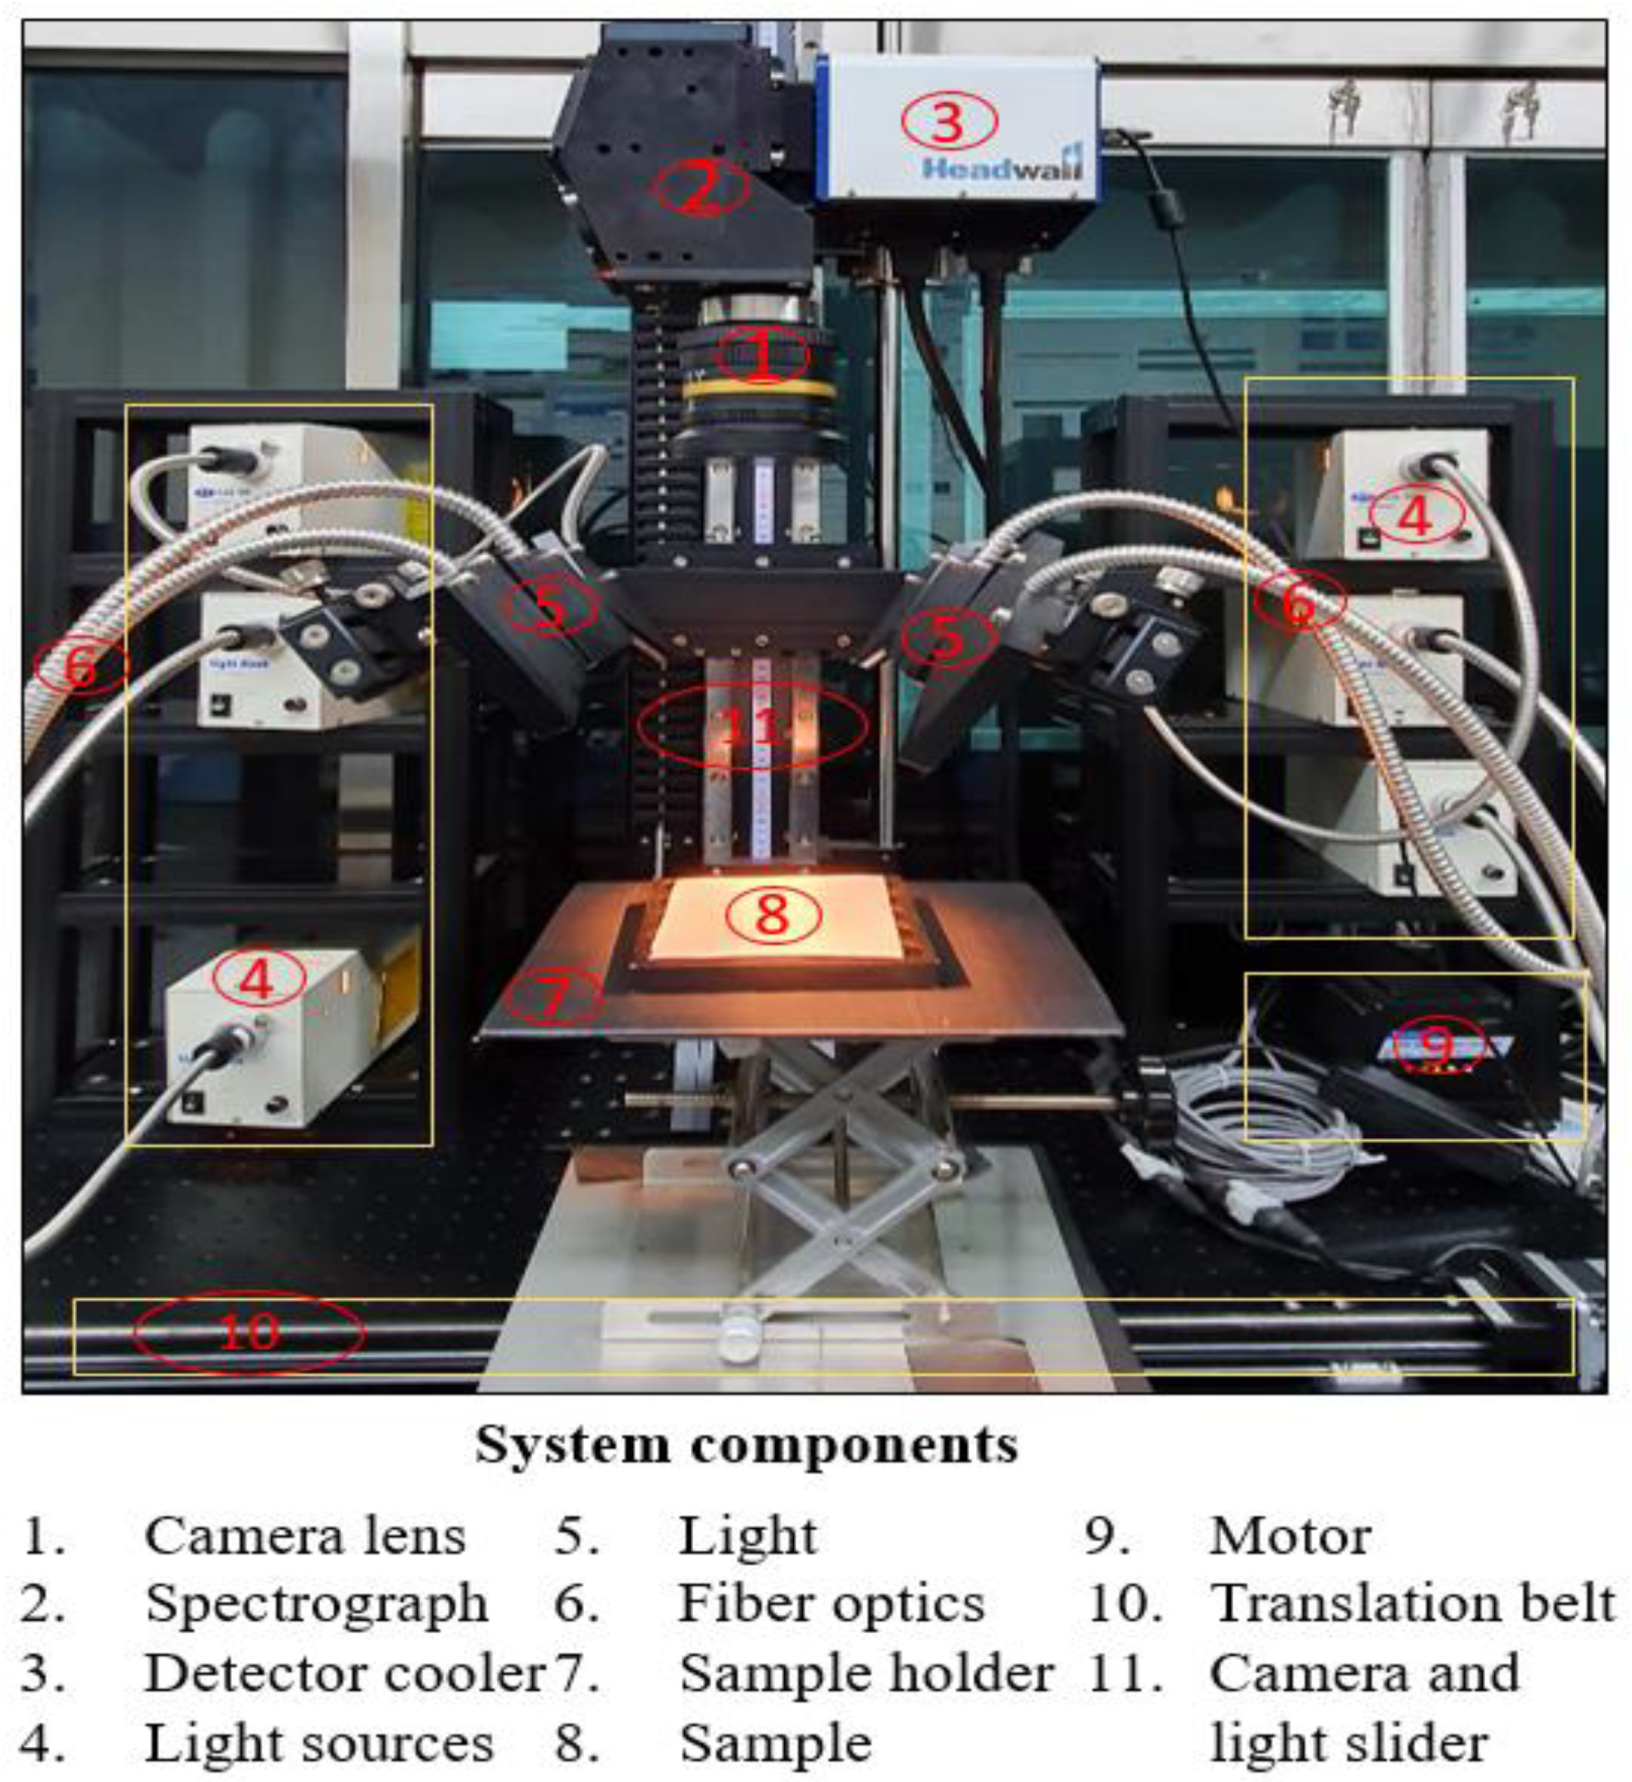
2.2. Hyperspectral Imaging System (HIS)
2.3. Image Calibration
2.4. Spectral Extraction
2.5. Data Analysis
2.5.1. Spectral Pre-Processing
2.5.2. DD-SIMCA
2.5.3. Partial Least Square Regression (PLSR)
2.5.4. Chemical Mapping Based on the Image
3. Results and Discussion
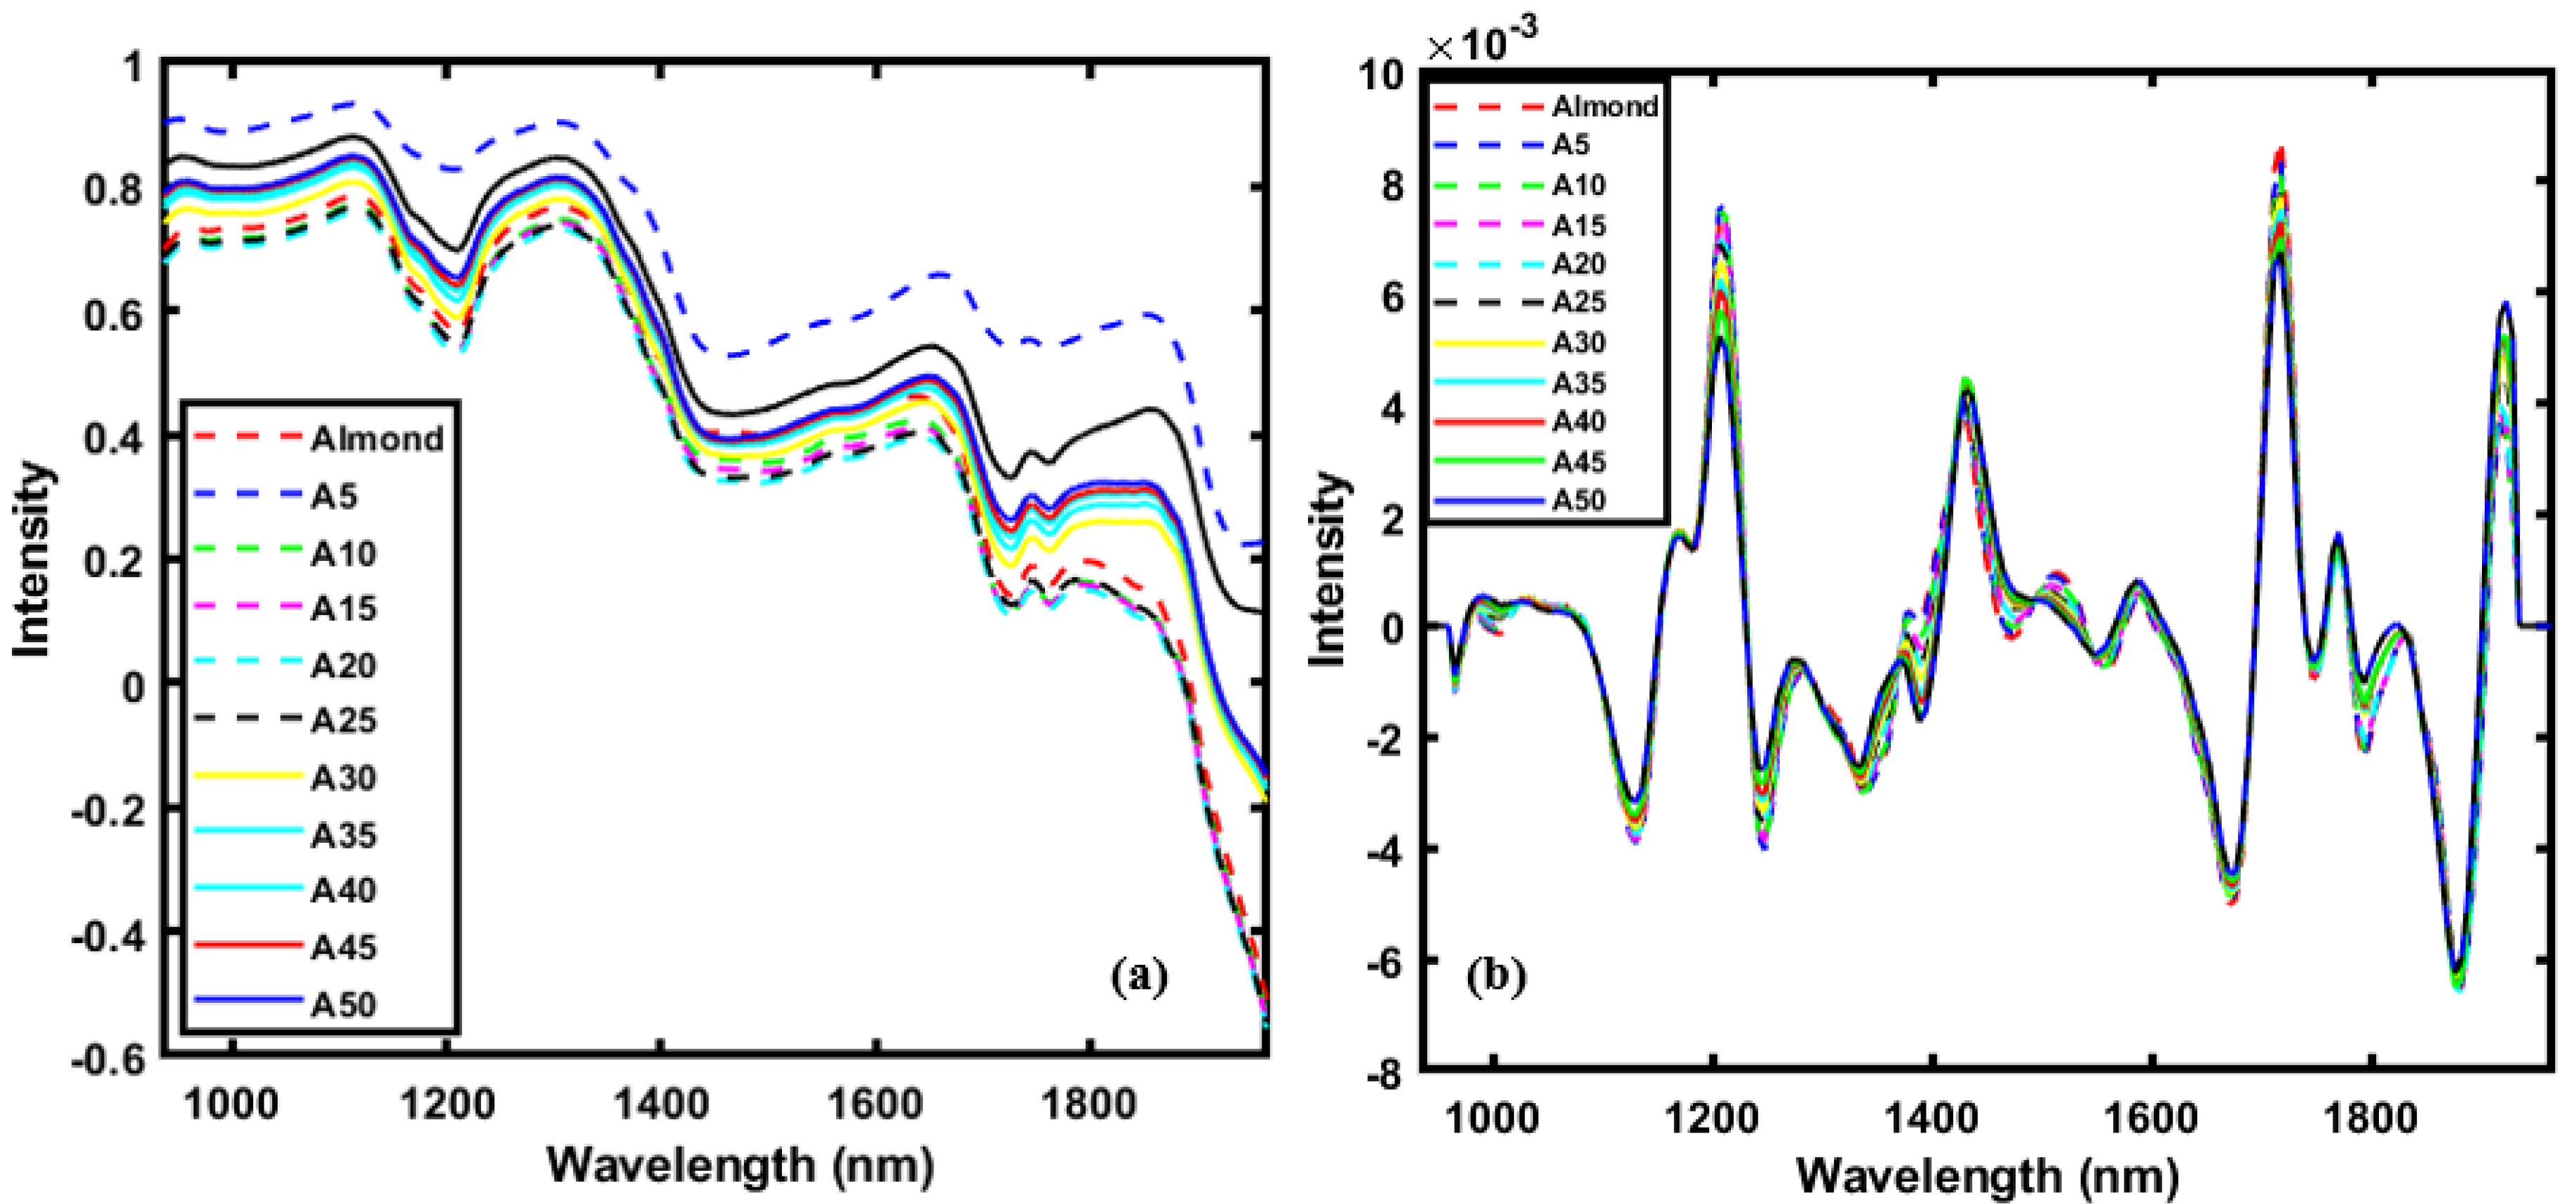
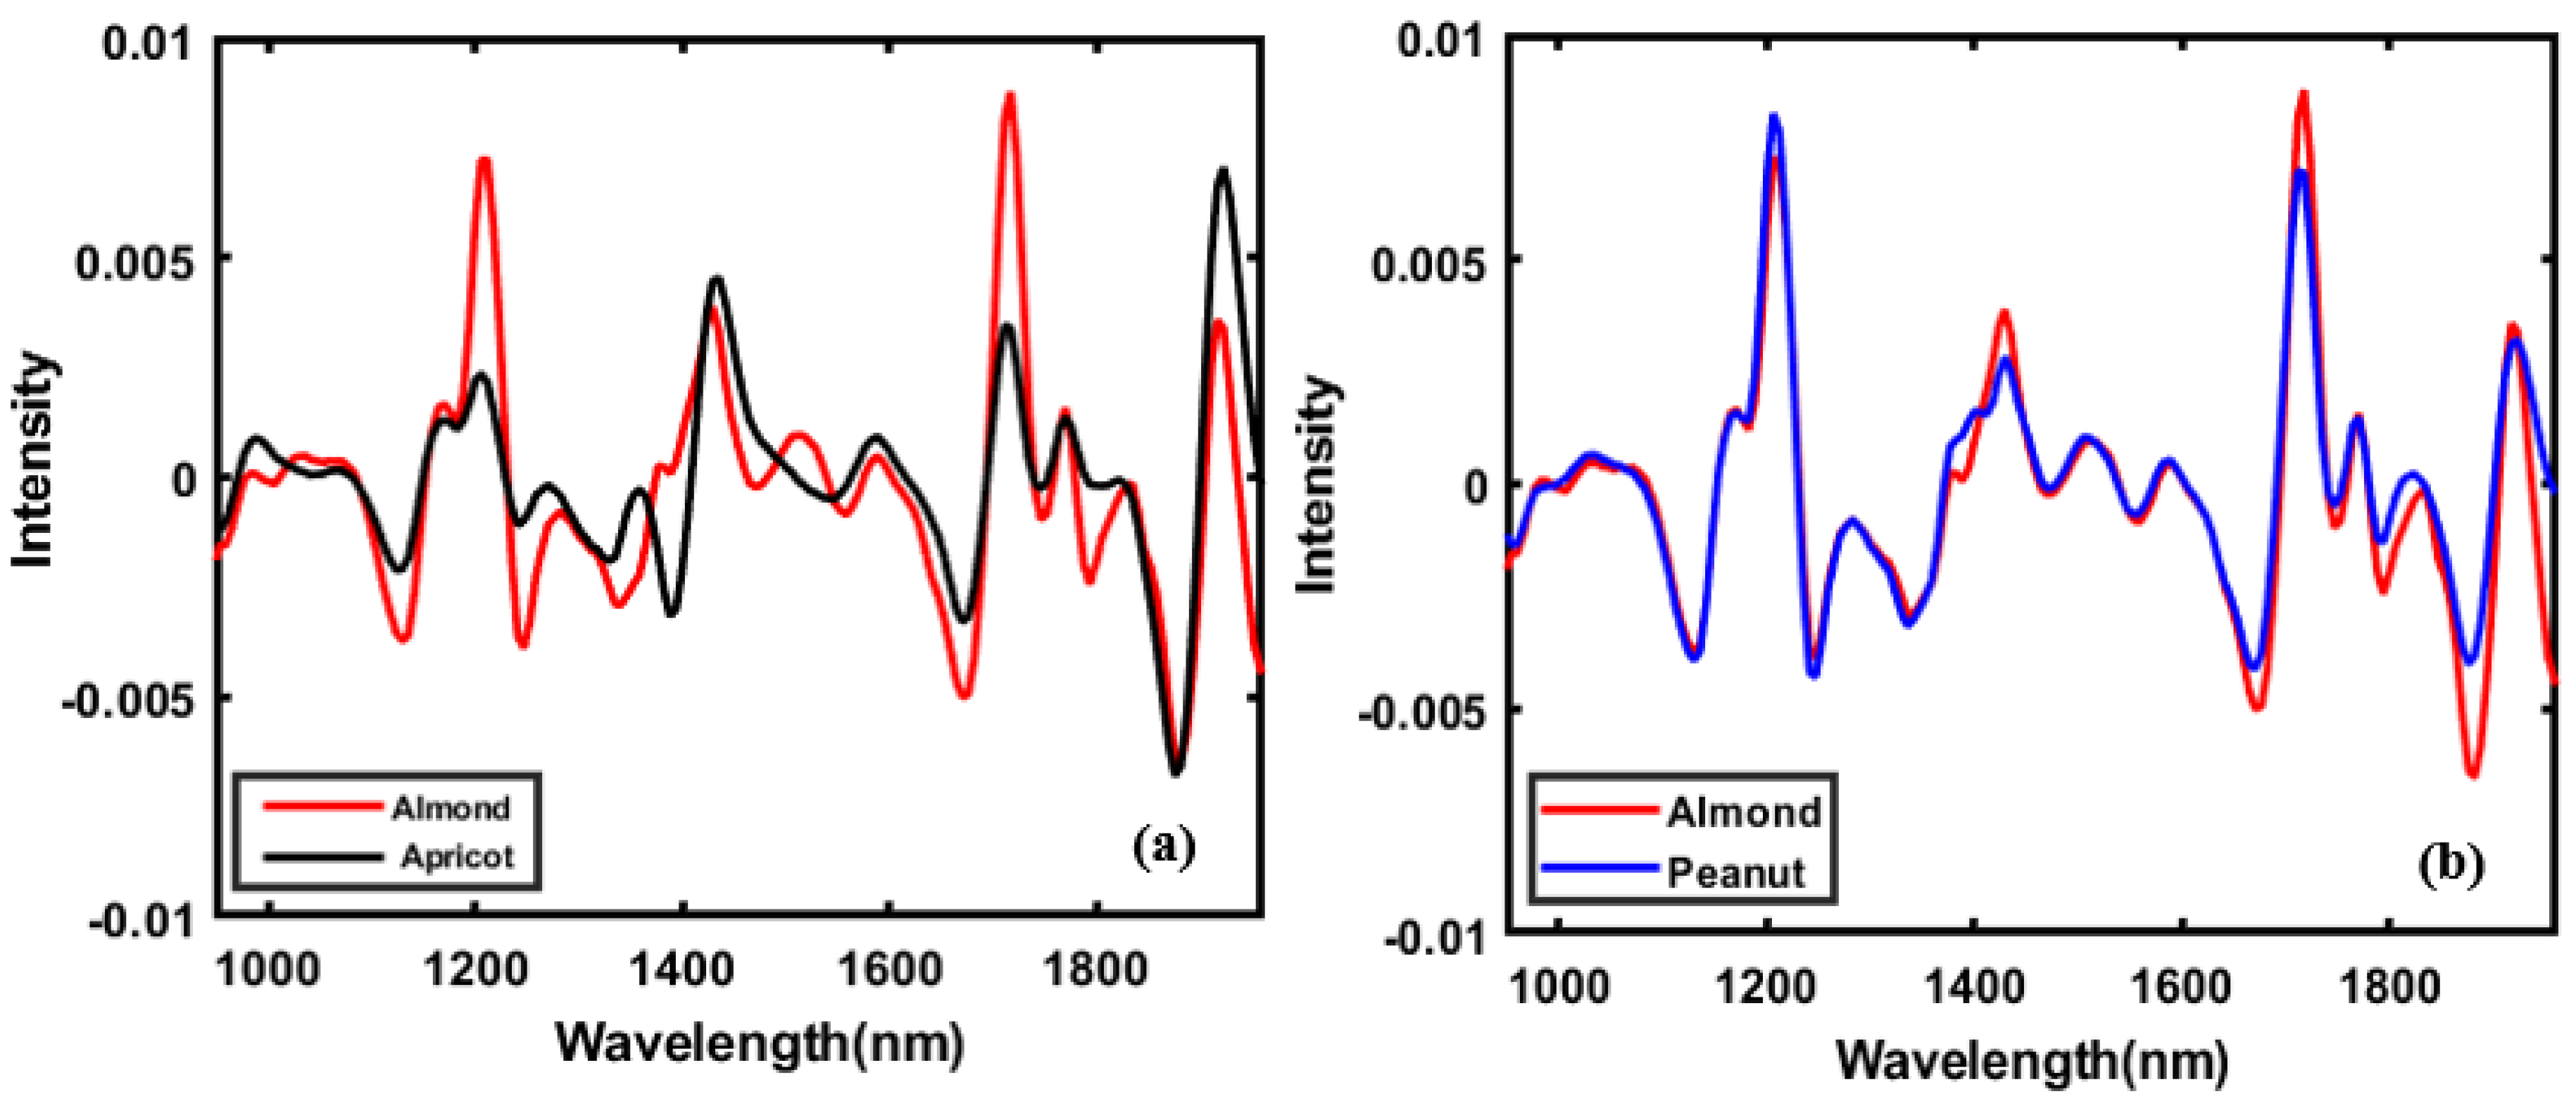
3.1. Spectral Profile of Almond and Adulterants
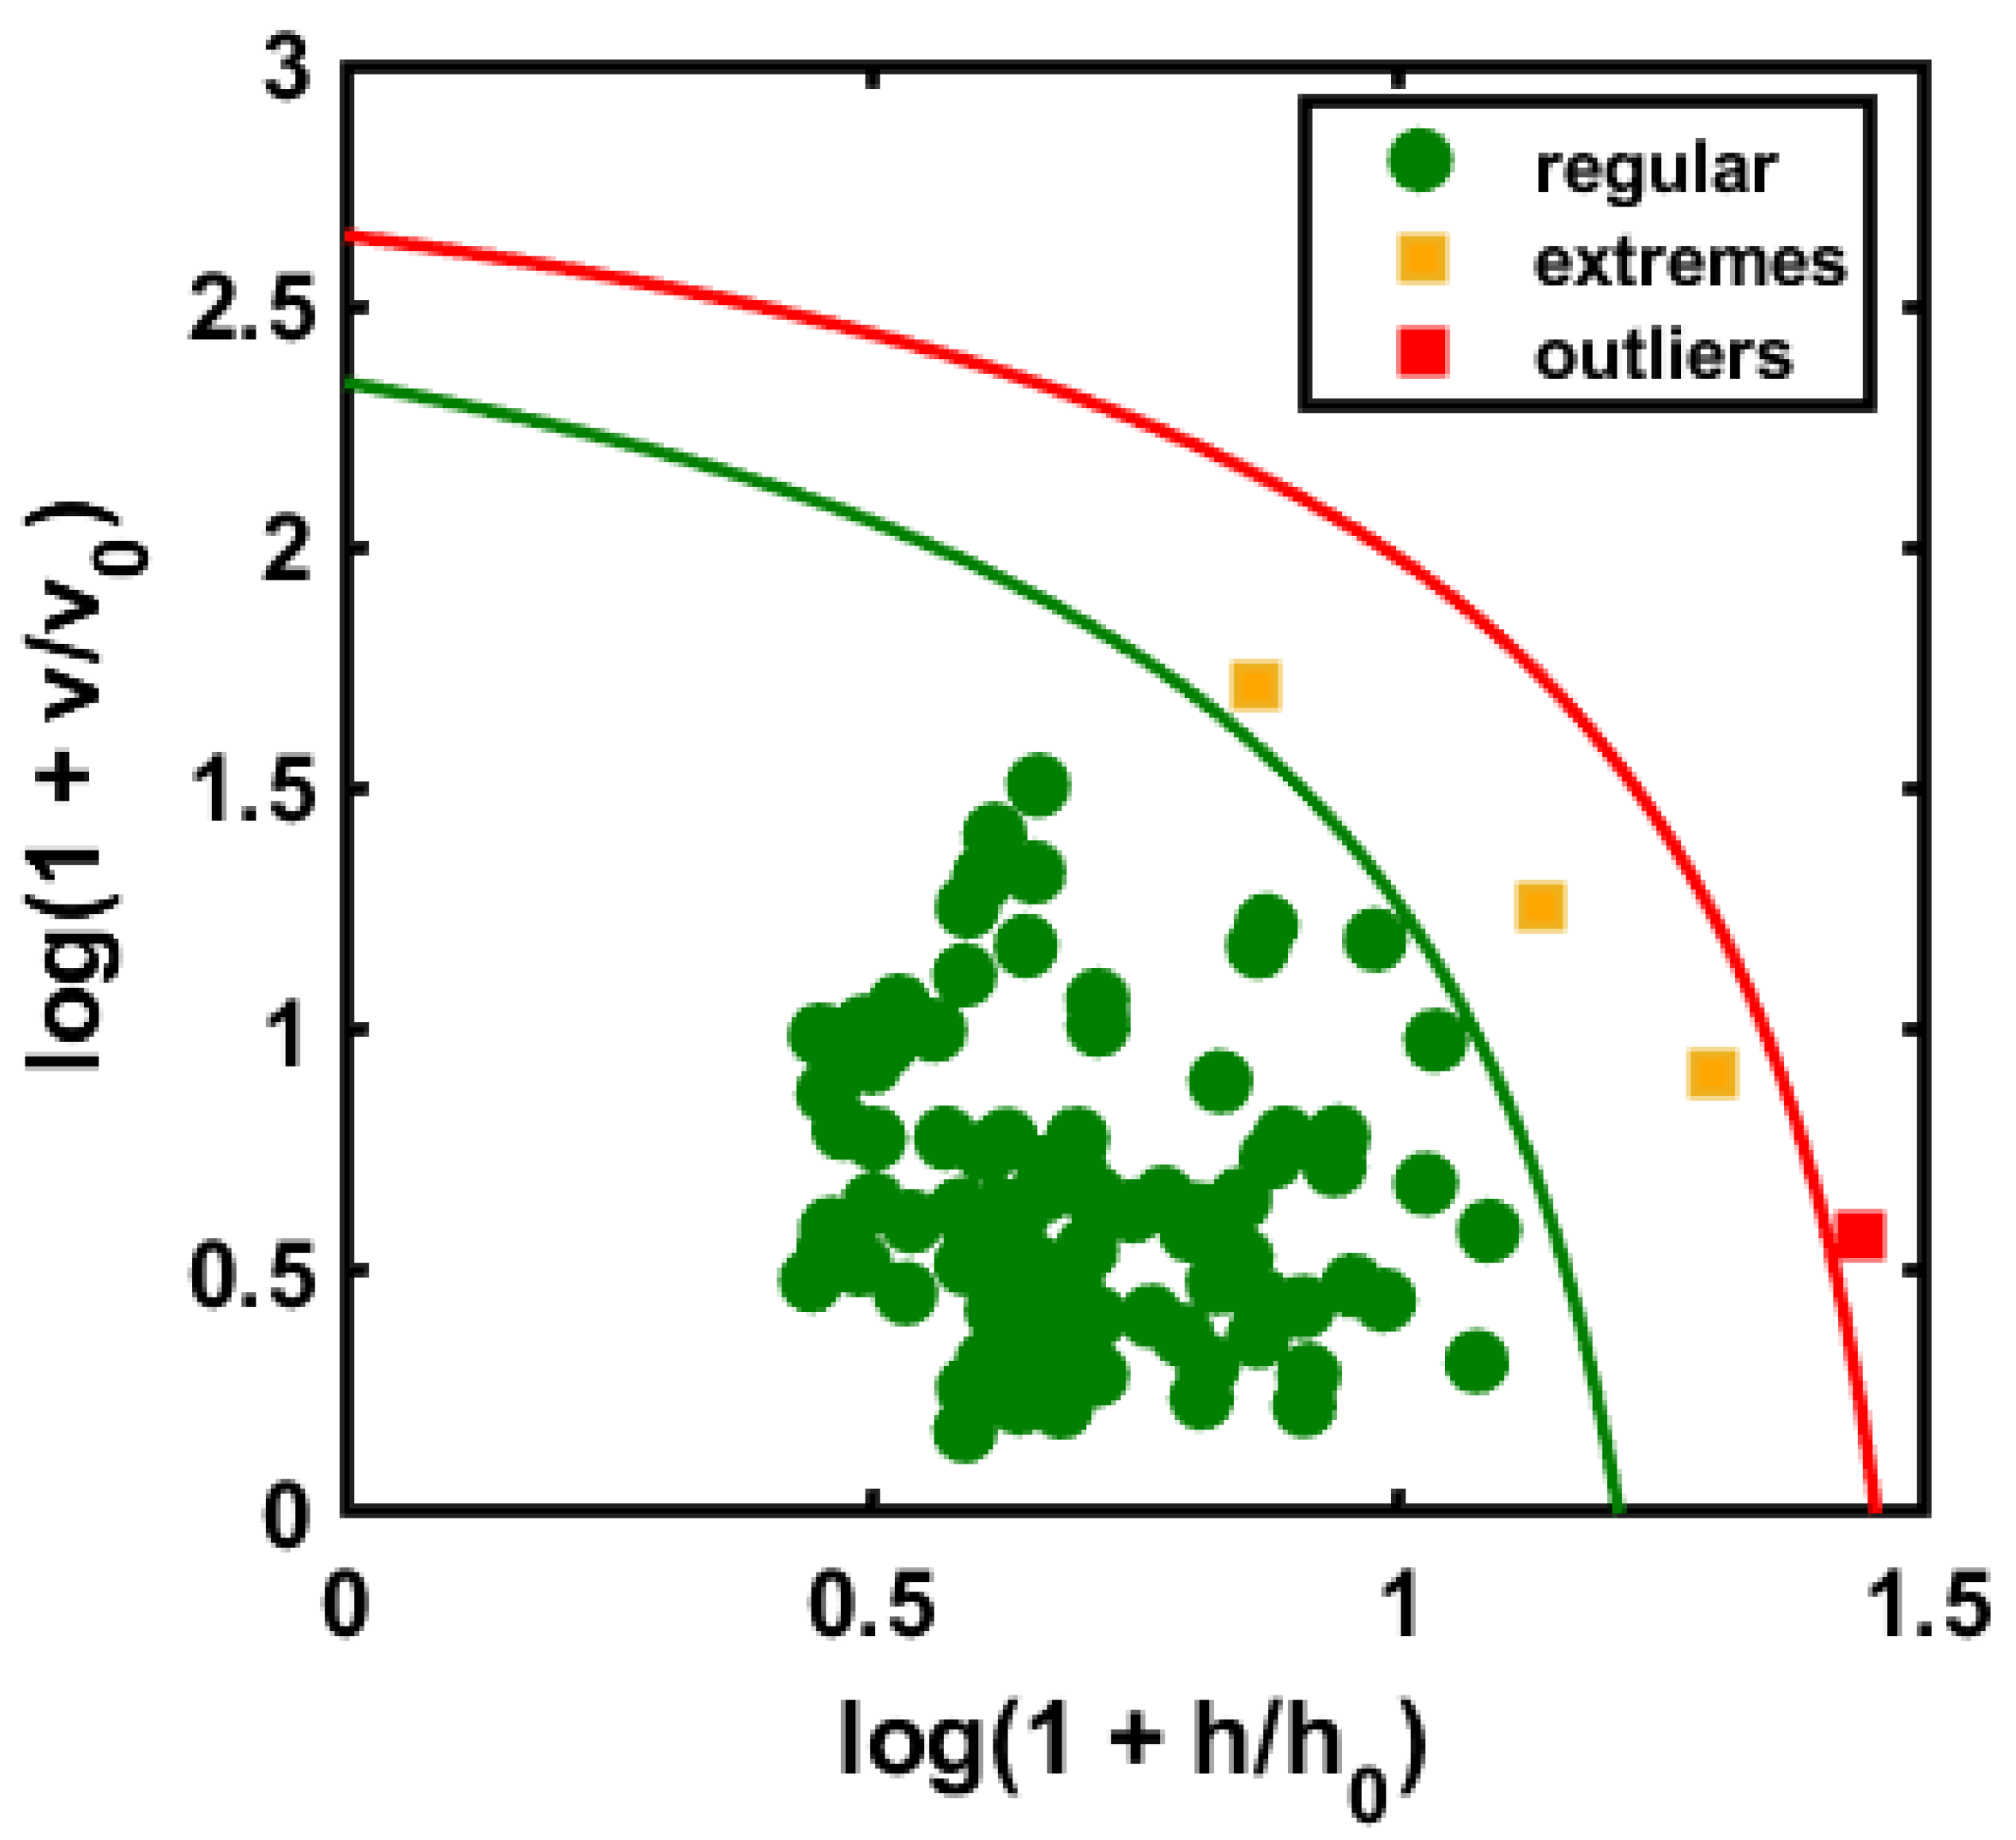
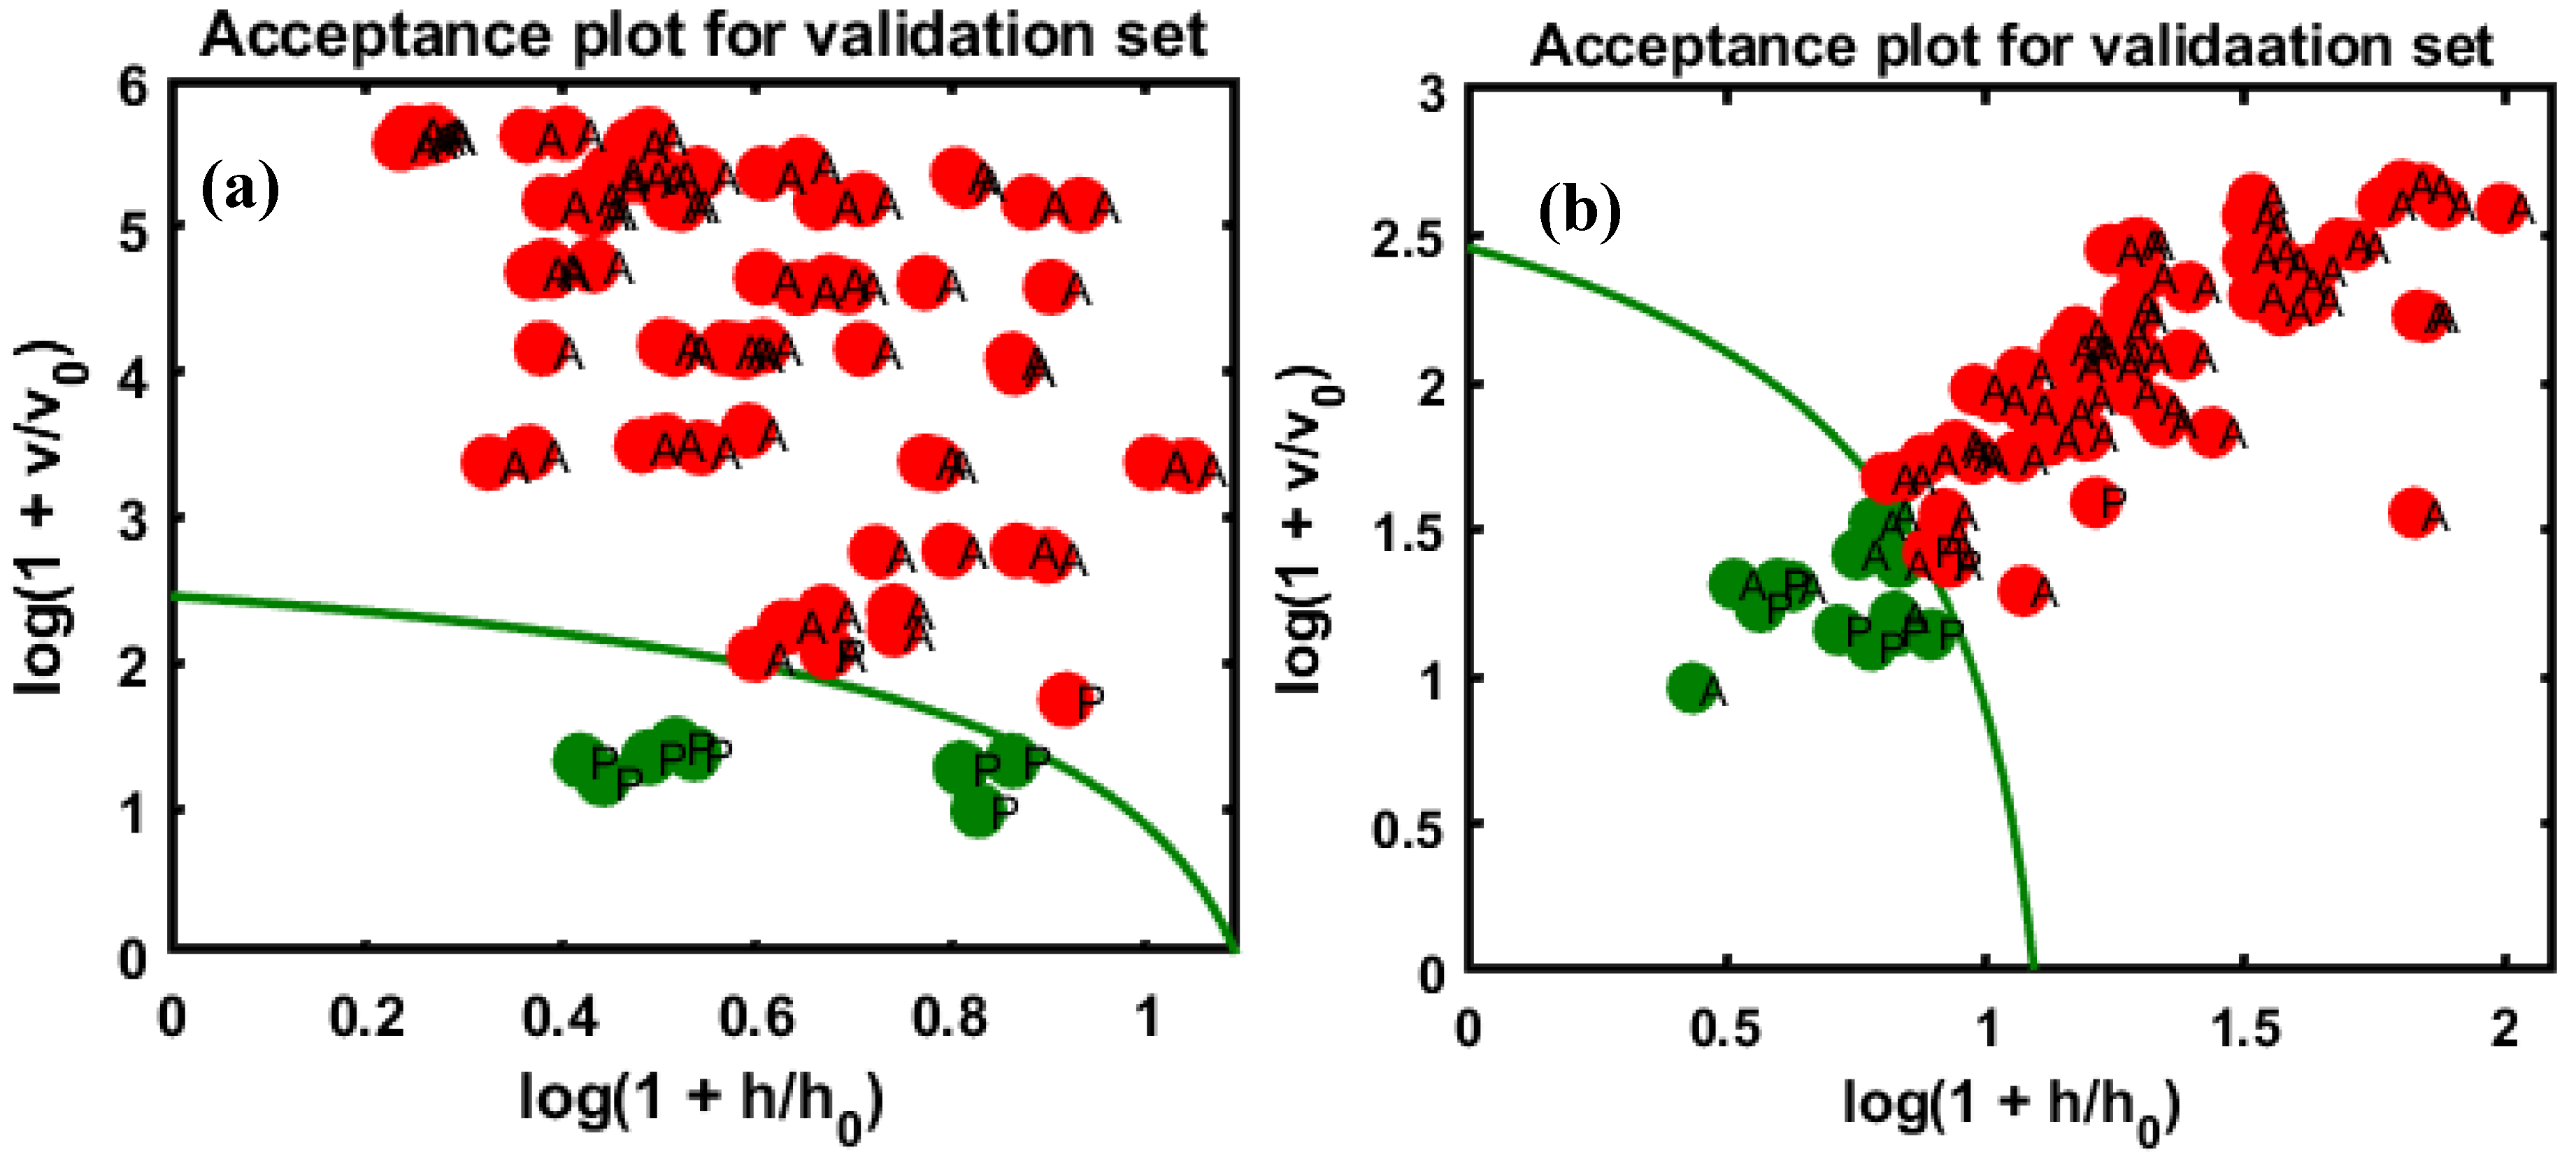
3.2. Class Modeling Construction Based on DD-SIMCA and Validation Performance
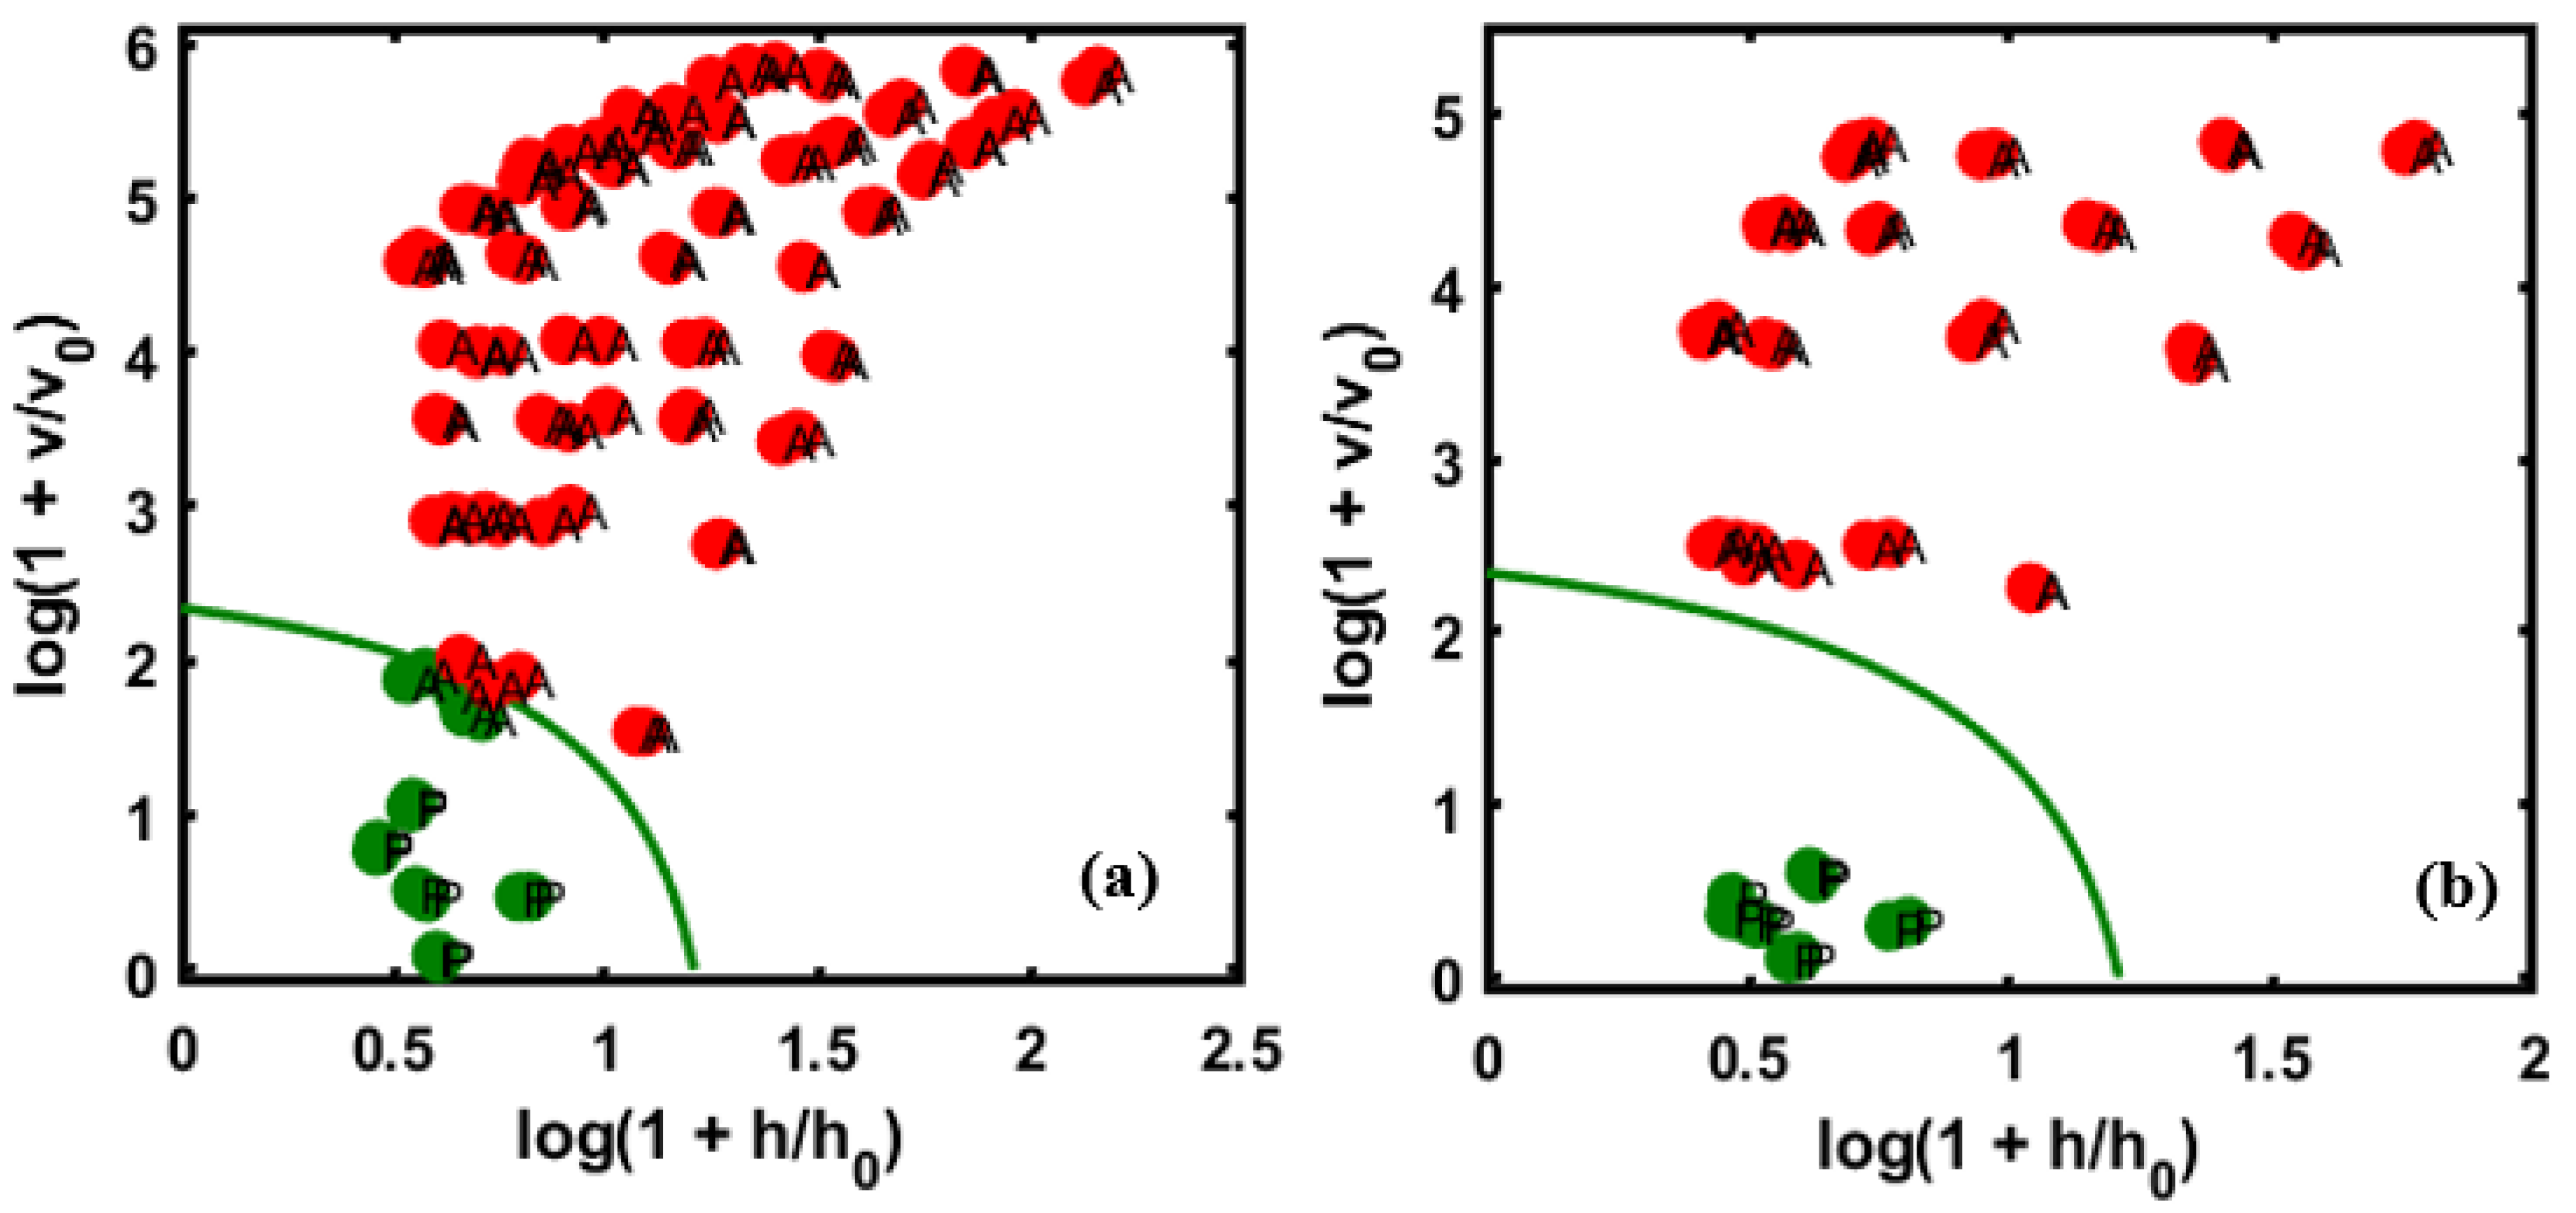
3.3. Reproducibility with an External Validation Set
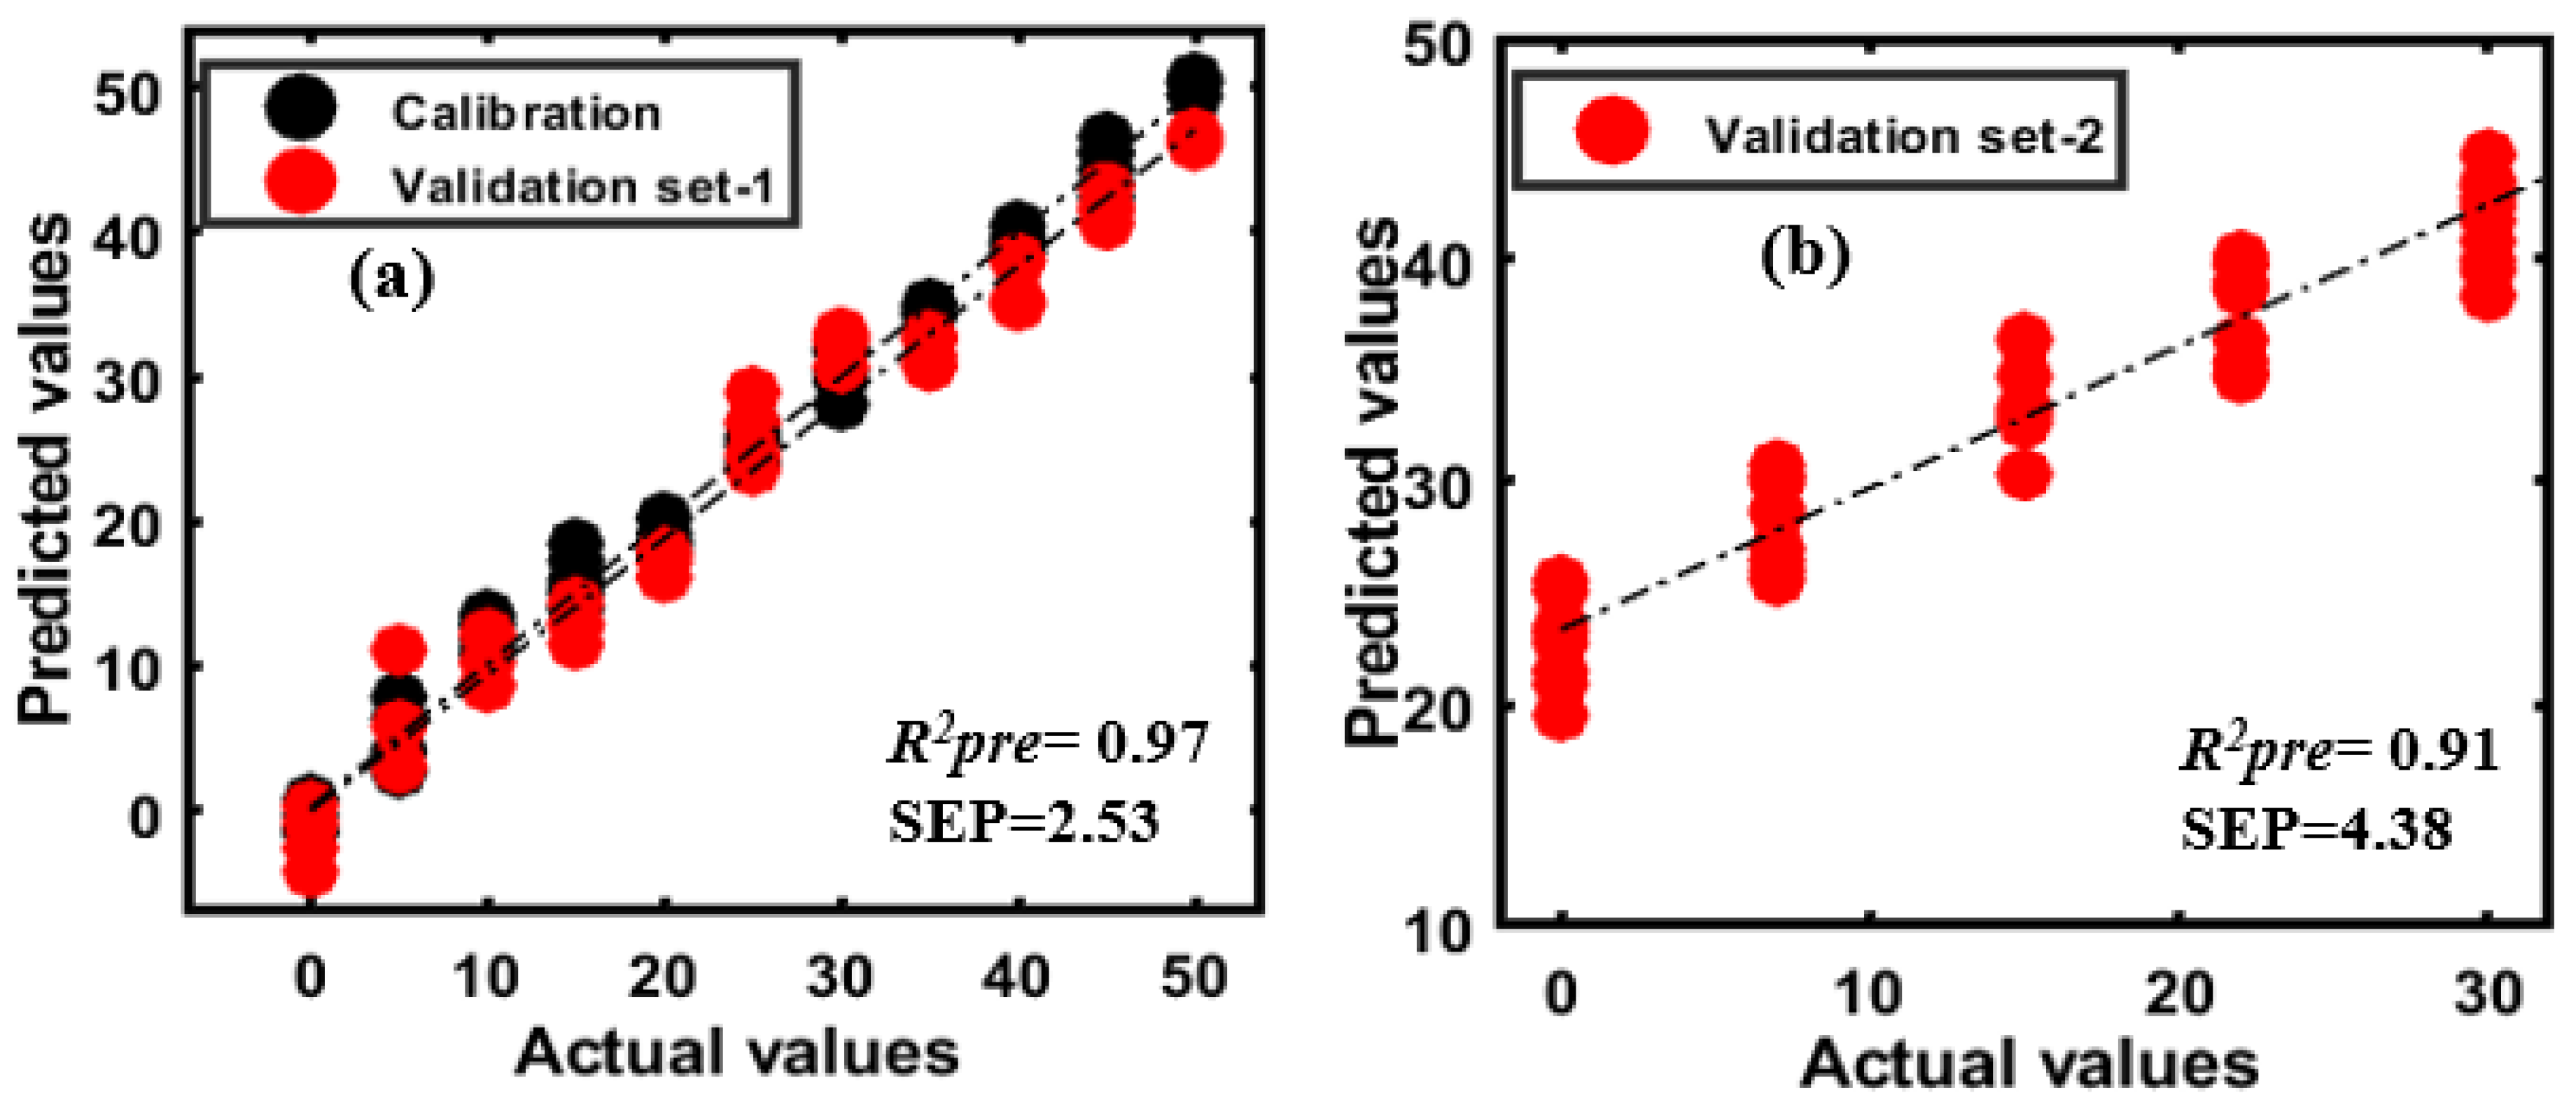
3.4. PLSR Model Development for Almond Adulterants
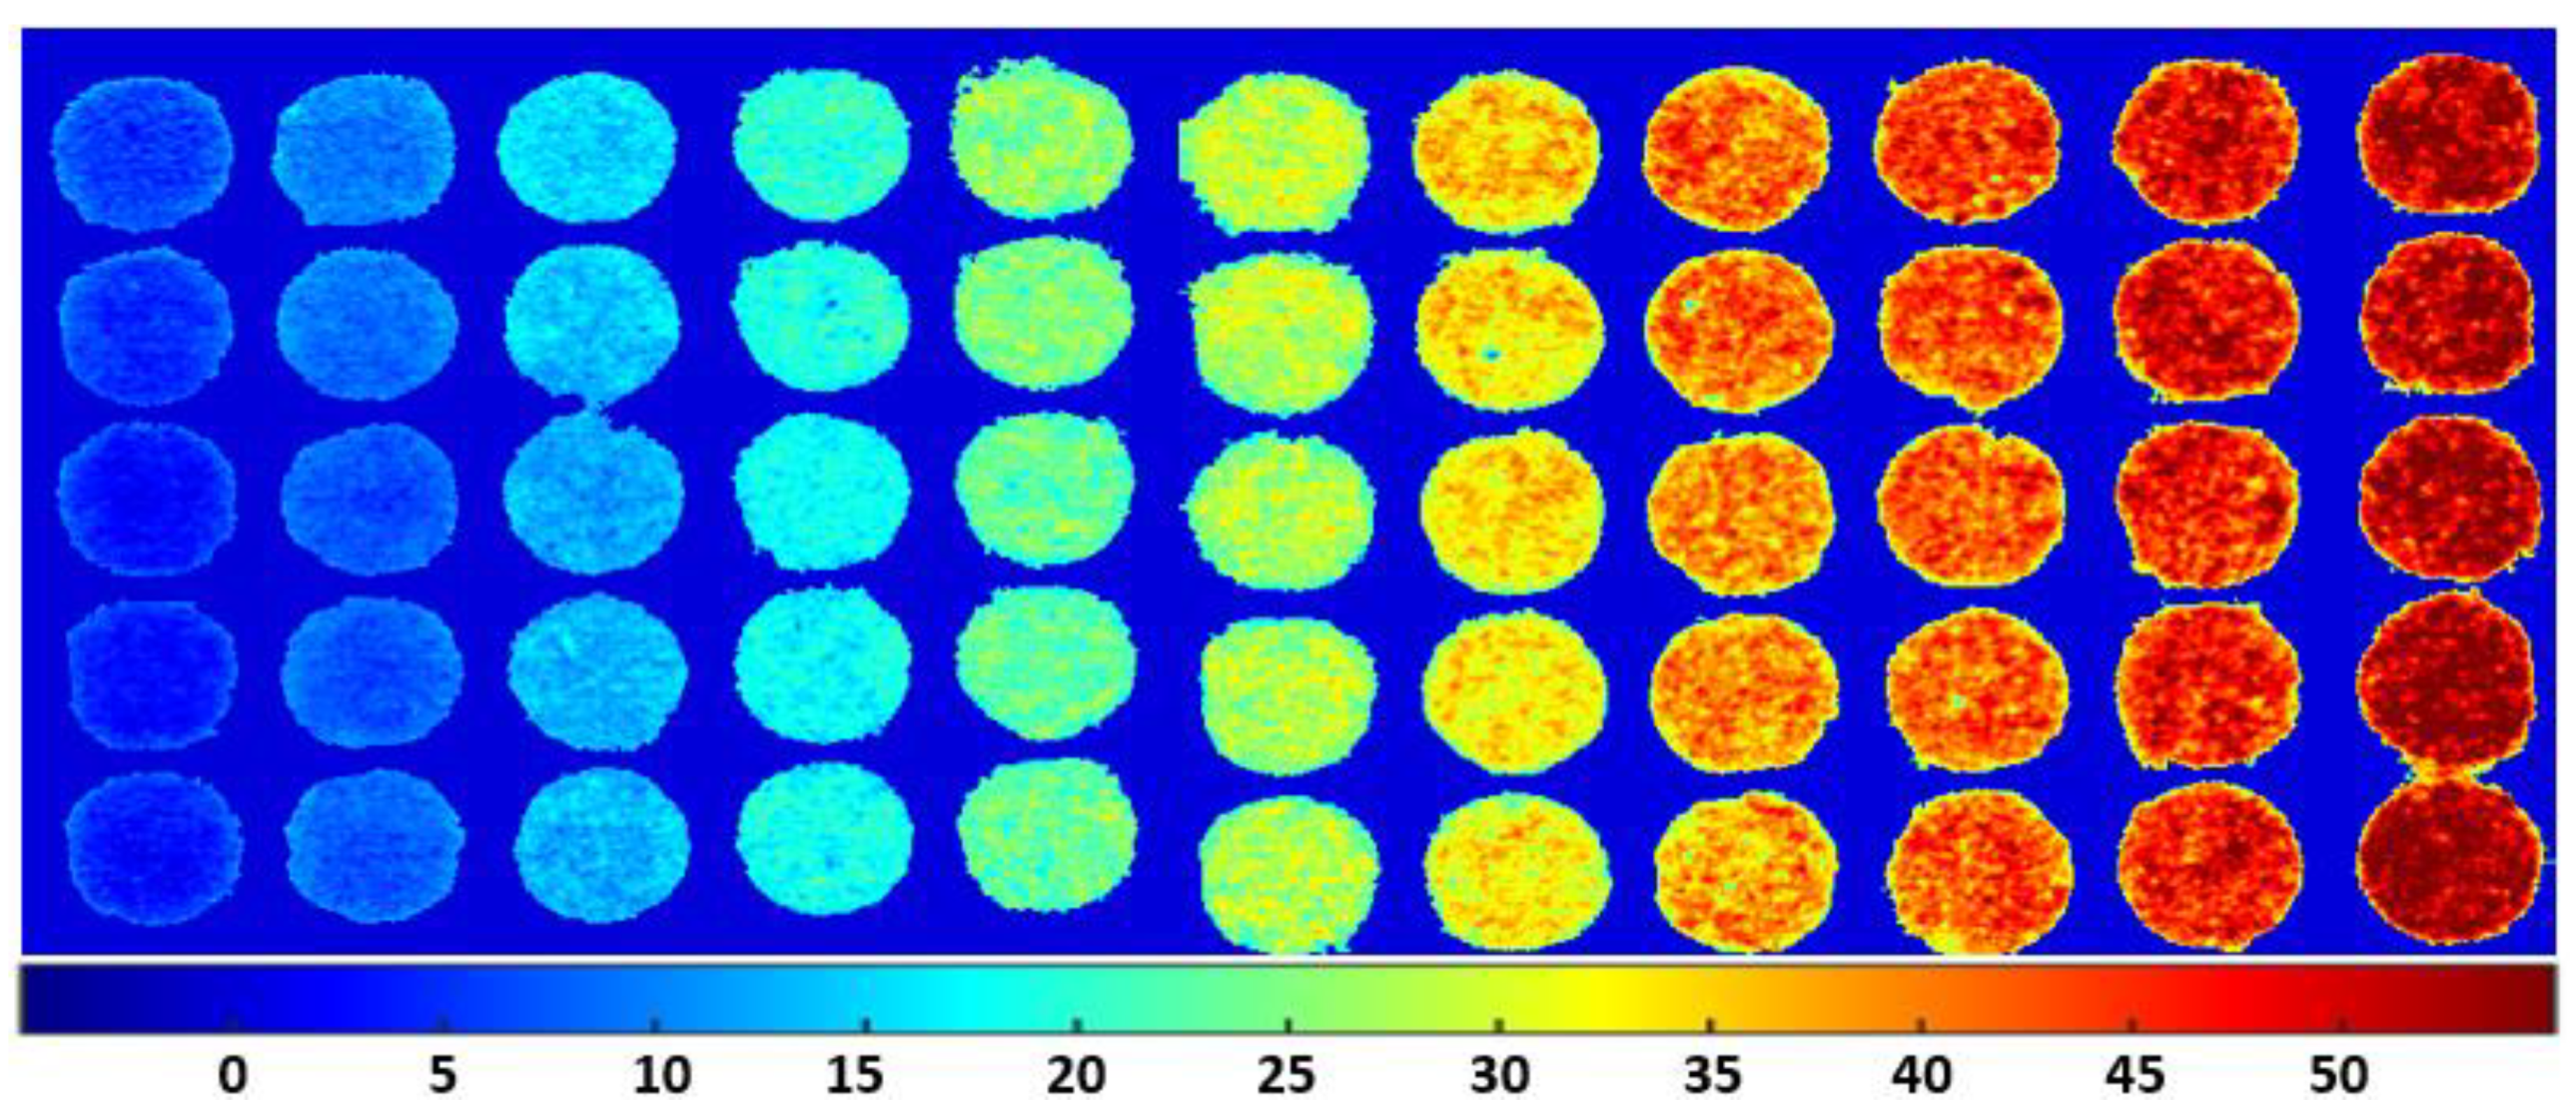
3.5. Spatial Distribution Maps of Adulterants in Almond Powder
4. Conclusions
Author Contributions
Funding
Conflicts of Interest
References
- Dourado, F.; Barros, A.; Mota, M.; Coimbra, M.A.; Gama, F.M. Anatomy and Cell Wall Polysaccharides of Almond (Prunus dulcis D. A. Webb) Seeds. J. Agric. Food Chem. 2004, 52, 1364–1370. [Google Scholar] [CrossRef] [PubMed] [Green Version]
- Devrani, M.; Pal, M. How to Detect Adulteration of Maltodextrin in Milk ? Food Beverage Process. 2018, 5, 22–23. [Google Scholar]
- Lohumi, S.; Lee, H.; Kim, M.S.; Qin, J.; Kandpal, L.M.; Bae, H.; Rahman, A.; Cho, B.K. Calibration and testing of a Raman hyperspectral imaging system to reveal powdered food adulteration. PLoS ONE 2018, 13, 1–16. [Google Scholar] [CrossRef] [PubMed]
- Branigan, T. Chinese Figures Show Fivefold Rise in Babies Sick from Contaminated Milk; Guardian News and Media: London, UK, 2008; Available online: https://www.theguardian.com/world/2008/dec/02/china (accessed on 18 July 2020).
- Everstine, K. Economically Motivated Adulteration: Implications for Food Protection and Alternate Approaches to Detection. Ph.D. Thesis, University of Minnesota, Minneapolis, MN, USA, 2013. [Google Scholar]
- Esteki, M.; Farajmand, B.; Kolahderazi, Y.; Simal-Gandara, J. Chromatographic Fingerprinting with Multivariate Data Analysis for Detection and Quantification of Apricot Kernel in Almond Powder. Food Anal. Methods 2017, 10, 3312–3320. [Google Scholar] [CrossRef]
- Esteki, M.; Vander, H.Y.; Farajmand, B.; Kolahderazi, Y. Qualitative and quantitative analysis of peanut adulteration in almond powder samples using multi-elemental fingerprinting combined with multivariate data analysis methods. Food Control 2017, 82, 31–41. [Google Scholar] [CrossRef]
- Finkelman, F.D. Peanut allergy and anaphylaxis. Curr. Opin. Immunol. 2010, 22, 783–788. [Google Scholar] [CrossRef] [Green Version]
- Al-Ahmed, N.; Alsowaidi, S.; Vadas, P. Peanut allergy: An overview. Allergy Asthma Clin. Immunol. 2008, 4, 139–143. [Google Scholar] [CrossRef] [Green Version]
- Clark, S.; Camargo, C.A. Epidemiology of Anaphylaxis. Immunol. Allergy Clin. N. Am. 2007, 27, 145–163. [Google Scholar] [CrossRef]
- Sicherer, S.H.; Sampson, H.A. Food allergy. J. Allergy Clin. Immunol. 2010, 125, S116–S125. [Google Scholar] [CrossRef]
- Mail, O.N. Schoolboy, 12, Died of Severe Allergic Reaction to Curry Containing Peanuts after Takeaway Staff Assured His Family It Was Nut-Free; Mail Online News: Manchester, UK, 2014; Available online: https://www.dailymail.co.uk/news/article-2588674/Schoolboy-12-died-severe-allergic-reaction-curry-containing-peanuts-takeaway-staff-assured-family-nut-free.html (accessed on 22 June 2020).
- Food, N. Euro Food Pays 18000 Euro for Potentially Deadly Food Adulteration; Food Navigatro: Cwbran, UK, 2013; Available online: https://www.foodnavigator.com/Article/2013/02/25/Food-manufacturer-found-guilty-of-food-adulteration (accessed on 22 June 2020).
- Lohumi, S.; Lee, S.; Lee, W.H.; Kim, M.S.; Mo, C.; Bae, H.; Cho, B.K. Detection of starch adulteration in onion powder by FT-NIR and FT-IR spectroscopy. J. Agric. Food Chem. 2014, 62, 9246–9251. [Google Scholar] [CrossRef]
- Lohumi, S.; Joshi, R.; Kandpal, L.M.; Lee, H.; Kim, M.S.; Cho, H.; Mo, C.; Seo, Y.W.; Rahman, A.; Cho, B.K. Quantitative analysis of Sudan dye adulteration in paprika powder using FTIR spectroscopy. Food Addit. Contam. Part A Chem. Anal. Control. Expo. Risk Assess. 2017, 34, 678–686. [Google Scholar] [CrossRef] [PubMed]
- Dhakal, S.; Chao, K.; Qin, J.; Kim, M.; Schmidt, W.; Chan, D. Detection of metanil yellow contamination in turmeric using FT-Raman and FT-IR spectroscopy. Sens. Agric. Food Qual. Saf. VIII 2016, 9864, 98640A. [Google Scholar] [CrossRef]
- Lohumi, S.; Lee, S.; Lee, H.; Cho, B.K. A review of vibrational spectroscopic techniques for the detection of food authenticity and adulteration. Trends Food Sci. Technol. 2015, 46, 85–98. [Google Scholar] [CrossRef]
- Zhao, X.; Wang, W.; Ni, X.; Chu, X.; Li, Y.-F.; Sun, C. Evaluation of Near-Infrared Hyperspectral Imaging for Detection of Peanut and Walnut Powders in Whole Wheat Flour. Appl. Sci. 2018, 8, 1076. [Google Scholar] [CrossRef] [Green Version]
- Lim, J.; Kim, G.; Mo, C.; Kim, M.S.; Chao, K.; Qin, J.; Fu, X.; Baek, I.; Cho, B.K. Detection of melamine in milk powders using near-infrared hyperspectral imaging combined with regression coefficient of partial least square regression model. Talanta 2016, 151, 183–191. [Google Scholar] [CrossRef] [Green Version]
- Su, W.H.; Sun, D.W. Evaluation of spectral imaging for inspection of adulterants in terms of common wheat flour, cassava flour and corn flour in organic Avatar wheat (Triticum spp.) flour. J. Food Eng. 2017, 200, 59–69. [Google Scholar] [CrossRef]
- Mishra, P.; Herrero-Langreo, A.; Barreiro, P.; Roger, J.M.; Diezma, B.; Gorretta, N.; Lleó, L. Detection and quantification of peanut traces in wheat flour by near infrared hyperspectral imaging spectroscopy using principal-component analysis. J. Near Infrared Spectrosc. 2015, 23, 15–22. [Google Scholar] [CrossRef]
- Mishra, P.; Cordella, C.B.Y.; Rutledge, D.N.; Barreiro, P.; Roger, J.M.; Diezma, B. Application of independent components analysis with the JADE algorithm and NIR hyperspectral imaging for revealing food adulteration. J. Food Eng. 2016, 168, 7–15. [Google Scholar] [CrossRef] [Green Version]
- Rodionova, O.Y.; Balyklova, K.S.; Titova, A.V.; Pomerantsev, A.L. Application of NIR spectroscopy and chemometrics for revealing of the ‘high quality fakes’ among the medicines. Forensic Chem. 2018, 8, 82–89. [Google Scholar] [CrossRef]
- Miaw, C.S.W.; Santos, P.M.; Silva, A.R.C.S.; Gozzi, A.; Guimarães, N.C.C.; Callao, M.P.; Ruisánchez, I.; Sena, M.M.; de Souza, S.V.C. Comparison of Different Multivariate Classification Methods for the Detection of Adulterations in Grape Nectars by Using Low-Field Nuclear Magnetic Resonance. Food Anal. Methods 2020, 13, 108–118. [Google Scholar] [CrossRef]
- Mazivila, S.J.; Páscoa, R.N.M.J.; Castro, R.C.; Ribeiro, D.S.M.; Santos, J.L.M. Detection of melamine and sucrose as adulterants in milk powder using near-infrared spectroscopy with DD-SIMCA as one-class classifier and MCR-ALS as a means to provide pure profiles of milk and of both adulterants with forensic evidence: A short communic. Talanta 2020, 216, 120937. [Google Scholar] [CrossRef] [PubMed]
- Rodríguez, S.D.; Rolandelli, G.; Buera, M.P. Detection of quinoa flour adulteration by means of FT-MIR spectroscopy combined with chemometric methods. Food Chem. 2019, 274, 392–401. [Google Scholar] [CrossRef] [PubMed]
- Karunathilaka, S.R.; Yakes, B.J.; He, K.; Chung, J.K.; Mossoba, M. Non-targeted NIR spectroscopy and SIMCA classification for commercial milk powder authentication: A study using eleven potential adulterants. Heliyon 2018, 4, e00806. [Google Scholar] [CrossRef] [PubMed] [Green Version]
- Chen, H.; Tan, C.; Lin, Z. Non-destructive identification of native egg by near-infrared spectroscopy and data driven-based class-modeling. Spectrochim. Acta Part A Mol. Biomol. Spectrosc. 2019, 206, 484–490. [Google Scholar] [CrossRef]
- Miaw, C.S.W.; Sena, M.M.; de Souza, S.V.C.; Callao, M.P.; Ruisanchez, I. Detection of adulterants in grape nectars by attenuated total reflectance Fourier-transform mid-infrared spectroscopy and multivariate classification strategies. Food Chem. 2018, 266, 254–261. [Google Scholar] [CrossRef]
- Yasmin, J.; Lohumi, S.; Ahmed, M.R.; Kandpal, L.M.; Faqeerzada, M.A.; Kim, M.S.; Cho, B.K. Improvement in purity of healthy tomato seeds using an image-based one-class classification method. Sensors 2020, 20, 2690. [Google Scholar] [CrossRef]
- Faqeerzada, M.A.; Lohumi, S.; Joshi, R.; Kim, M.S.; Baek, I.; Cho, B.-K. Non-Targeted Detection of Adulterants in Almond Powder Using Spectroscopic Techniques Combined with Chemometrics. Foods 2020, 9, 876. [Google Scholar] [CrossRef]
- Rendon, J.L. IR Spectra of Powder Hematite: Effects of Particle Size and Shape. Clay Miner. 1981, 16, 375–382. [Google Scholar] [CrossRef]
- Huang, M.; Kim, M.S.; Delwiche, S.R.; Chao, K.; Qin, J.; Mo, C.; Esquerre, C.; Zhu, Q. Quantitative analysis of melamine in milk powders using near-infrared hyperspectral imaging and band ratio. J. Food Eng. 2016, 181, 10–19. [Google Scholar] [CrossRef] [Green Version]
- Rinnan, Å.; van den Berg, F.; Engelsen, S.B. Review of the most common pre-processing techniques for near-infrared spectra. TrAC Trends Anal. Chem. 2009, 28, 1201–1222. [Google Scholar] [CrossRef]
- Zontov, Y.V.; Rodionova, O.Y.; Kucheryavskiy, S.V.; Pomerantsev, A.L. DD-SIMCA—A MATLAB GUI tool for data driven SIMCA approach. Chemom. Intell. Lab. Syst. 2017, 167, 23–28. [Google Scholar] [CrossRef]
- Sarkar, T.K.; Ryu, C.; Kang, Y.; Kim, S.; Jeon, S. Integrating UAV Remote Sensing with GIS for Predicting Rice Grain Protein. J. Biosyst. Eng. 2018, 43, 148–159. [Google Scholar] [CrossRef]
- Kandpal, L.; Lee, H.; Kim, M.; Mo, C.; Cho, B.-K. Hyperspectral Reflectance Imaging Technique for Visualization of Moisture Distribution in Cooked Chicken Breast. Sensors 2013, 13, 13289–13300. [Google Scholar] [CrossRef] [PubMed] [Green Version]
- Hong, S.; Lee, A.; Han, Y.; Park, J.; So, J.D.; Kim, G. Rancidity Prediction of Soybean Oil by Using Near-Infrared Spectroscopy Techniques. J. Biosyst. Eng. 2018, 43, 219–228. [Google Scholar]
- Kandpal, L.M.; Tewari, J.; Gopinathan, N.; Stolee, J.; Strong, R.; Boulas, P.; Cho, B.K. Quality assessment of pharmaceutical tablet samples using Fourier transform near infrared spectroscopy and multivariate analysis. Infrared Phys. Technol. 2017, 85, 300–306. [Google Scholar] [CrossRef]
- Lohumi, S.; Lee, S.; Lee, H.; Kim, M.S.; Lee, W.H.; Cho, B.K. Application of hyperspectral imaging for characterization of intramuscular fat distribution in beef. Infrared Phys. Technol. 2016, 74, 1–10. [Google Scholar] [CrossRef]
- Rahman, A.; Kandpal, L.; Lohumi, S.; Kim, M.; Lee, H.; Mo, C.; Cho, B. Nondestructive Estimation of Moisture Content, pH and Soluble Solid Contents in Intact Tomatoes Using Hyperspectral Imaging. Appl. Sci. 2017, 7, 109. [Google Scholar] [CrossRef]
- Rahman, A.; Faqeerzada, M.A.; Cho, B.K. Hyperspectral imaging for predicting the allicin and soluble solid content of garlic with variable selection algorithms and chemometricmodels. J. Sci. Food Agric. 2018, 98, 4715–4725. [Google Scholar] [CrossRef] [PubMed]
- Mukasa, P.; Wakholi, C.; Mohammad, A.F.; Park, E.; Lee, J.; Suh, H.K.; Mo, C.; Lee, H.; Baek, I.; Kim, M.S.; et al. Determination of the viability of retinispora (Hinoki cypress) seeds using shortwave infrared hyperspectral imaging spectroscopy. J. Near Infrared Spectrosc. 2020. [Google Scholar] [CrossRef]
- Venkatachalan, M.; Sathe, S.K. Chemical composition of selected edible nut seeds. J. Agric. Food Chem. 2006, 54, 4705–4714. [Google Scholar] [CrossRef]
- Turan, S.; Topcu, A.; Karabulut, I.; Vural, H.; Hayaloglu, A.A. Fatty acid, triacylglycerol, phytosterol, and tocopherol variations in kernel oil of Malatya apricots from Turkey. J. Agric. Food Chem. 2007, 55, 10787–10794. [Google Scholar] [CrossRef]
- Maguire, L.S.; O’Sullivan, S.M.; Galvin, K.; O’Connor, T.P.; O’Brien, N.M. Fatty acid profile, tocopherol, squalene and phytosterol content of walnuts, almonds, peanuts, hazelnuts and the macadamia nut. Int. J. Food Sci. Nutr. 2004, 55, 171–178. [Google Scholar] [CrossRef] [PubMed]
- Ortega-beltran, A.; Liang, P.; Slaughter, D.C.; Ortega-beltran, A. Detection of fungal infection in almond kernels using near-infrared reflectance spectroscopy ScienceDirect Detection of fungal infection in almond kernels using near-infrared reflectance spectroscopy. Biosyst. Eng. 2015, 137, 64–72. [Google Scholar] [CrossRef]
- Baek, I.; Kusumaningrum, D.; Kandpal, L.M.; Lohumi, S.; Mo, C.; Kim, M.S.; Cho, B.K. Rapid measurement of soybean seed viability using Kernel-based multispectral image analysis. Sensors 2019, 19, 271. [Google Scholar] [CrossRef] [Green Version]
- Zhao, H.; Guo, B.; Wei, Y.; Zhang, B. Near infrared reflectance spectroscopy for determination of the geographical origin of wheat. Food Chem. 2013, 138, 1902–1907. [Google Scholar] [CrossRef]
- Bonku, R.; Yu, J. Health aspects of peanuts as an outcome of its chemical composition. Food Sci. Hum. Wellness 2020, 9, 21–30. [Google Scholar] [CrossRef]
- Alpaslan, M.; Hayta, M. Apricot kernel: Physical and chemical properties. JAOCS J. Am. Oil Chem. Soc. 2006, 83, 469–471. [Google Scholar] [CrossRef]
- Lohumi, S.; Kandpal, L.M.; Seo, Y.W.; Cho, B.K. Net Analyte Signal-based Quantitative Determination of Fusel Oil in Korean Alcoholic Beverage Using FT-NIR Spectroscopy. J. Biosyst. Eng. 2016, 41, 208–220. [Google Scholar] [CrossRef] [Green Version]


| Number of Samples | Maximum | Minimum | Mean ± SD | ||
|---|---|---|---|---|---|
| DD-SIMCA | Calibration | 100 | 0 | 0 | 0 ± 0 |
| Validation1 | 110 | 50 | 0 | 25.04 ± 15.94 | |
| Validation2 | 50 | 30 | 0 | 14.8 ± 10.72 | |
| PLSR | Calibration | 66 | 50 | 0 | 25 ± 15.94 |
| Validation1 | 44 | 50 | 0 | 25 ± 15.99 | |
| Validation2 | 44 | 30 | 0 | 13.45 ± 11.07 | |
| Sensitivity (%) | Number of Correctly Classified Samples/Total Number of Samples | Specificity (%) | Number of Correctly Classified Samples/Total Number of Pure Samples | Accuracy (%) | |
|---|---|---|---|---|---|
| Val-1st-AA | 95 | 95/100 | 100 | 10/10 | 95.5 |
| Val-2nd-AA | 100 | 40/40 | 100 | 10/10 | 100.0 |
| Val-1st-AP | 89 | 89/100 | 100 | 10/10 | 90.0 |
| Val-2nd-AP | 90 | 36/40 | 100 | 10/10 | 92.0 |
| Pre-Processing Methods | 1st Variety Adulterated with Apricot | 2nd Variety Adulterated with Apricot | 1st Variety Adulterated with Peanut | 2nd Variety Adulterated with Peanut | ||||||||
|---|---|---|---|---|---|---|---|---|---|---|---|---|
| R2cal | SEC (%) | R2pre | SEP (%) | R2pre | SEP (%) | R2cal | SEC (%) | R2pre | SEP (%) | R2pre | SEP (%) | |
| Mean Normalization | 0.99 | 1.16 | 0.98 | 1.92 | 0.99 | 1.42 | 0.99 | 1.83 | 0.83 | 6.56 | 0.76 | 5.21 |
| Max Normalization | 0.99 | 0.76 | 0.99 | 1.00 | 0.99 | 0.80 | 0.98 | 2.20 | 0.81 | 7.05 | 0.75 | 5.35 |
| Range Normalization | 0.99 | 1.53 | 0.98 | 2.13 | 0.96 | 10.9 | 0.95 | 3.45 | 0.82 | 6.65 | 0.76 | 5.32 |
| MSC | 0.99 | 1.28 | 0.98 | 1.81 | 0.98 | 2.28 | 0.98 | 2.17 | 0.75 | 8.21 | 0.56 | 7.07 |
| SNV | 0.99 | 0.85 | 0.99 | 1.16 | 0.98 | 4.11 | 0.98 | 2.17 | 0.75 | 8.16 | 0.56 | 7.13 |
| SG 1st Derivatives | 0.99 | 0.79 | 0.99 | 0.95 | 0.98 | 1.38 | 0.99 | 1.68 | 0.98 | 2.18 | 0.94 | 4.77 |
| SG 2nd Derivatives | 0.99 | 0.71 | 0.99 | 0.71 | 0.99 | 0.93 | 0.99 | 1.48 | 0.97 | 2.53 | 0.91 | 4.38 |
| Raw | 0.99 | 0.75 | 0.99 | 0.87 | 0.99 | 1.10 | 0.98 | 1.00 | 0.98 | 2.40 | 0.90 | 5.71 |
Publisher’s Note: MDPI stays neutral with regard to jurisdictional claims in published maps and institutional affiliations. |
© 2020 by the authors. Licensee MDPI, Basel, Switzerland. This article is an open access article distributed under the terms and conditions of the Creative Commons Attribution (CC BY) license (http://creativecommons.org/licenses/by/4.0/).
Share and Cite
Faqeerzada, M.A.; Lohumi, S.; Kim, G.; Joshi, R.; Lee, H.; Kim, M.S.; Cho, B.-K. Hyperspectral Shortwave Infrared Image Analysis for Detection of Adulterants in Almond Powder with One-Class Classification Method. Sensors 2020, 20, 5855. https://doi.org/10.3390/s20205855
Faqeerzada MA, Lohumi S, Kim G, Joshi R, Lee H, Kim MS, Cho B-K. Hyperspectral Shortwave Infrared Image Analysis for Detection of Adulterants in Almond Powder with One-Class Classification Method. Sensors. 2020; 20(20):5855. https://doi.org/10.3390/s20205855
Chicago/Turabian StyleFaqeerzada, Mohammad Akbar, Santosh Lohumi, Geonwoo Kim, Rahul Joshi, Hoonsoo Lee, Moon Sung Kim, and Byoung-Kwan Cho. 2020. "Hyperspectral Shortwave Infrared Image Analysis for Detection of Adulterants in Almond Powder with One-Class Classification Method" Sensors 20, no. 20: 5855. https://doi.org/10.3390/s20205855
APA StyleFaqeerzada, M. A., Lohumi, S., Kim, G., Joshi, R., Lee, H., Kim, M. S., & Cho, B.-K. (2020). Hyperspectral Shortwave Infrared Image Analysis for Detection of Adulterants in Almond Powder with One-Class Classification Method. Sensors, 20(20), 5855. https://doi.org/10.3390/s20205855