1. Introduction
In general, medical practitioners classify the breast cysts in two major categories, namely the benign and malignant tumors. It has to be noted that, even though the cysts observed in the breasts are technically stated as tumors, it can be witnessed that every observed breast tumor is not malignant (cancerous cell/tissue). Further, medical doctors state that eighty percent of the biopsied breast cysts are observed to be benign (noncancerous cell/tissue). Even though such breast cysts are benign in nature, it has to be removed surgically to avert its interference with the normal functioning of the breasts. Moreover, it can be seen that these benign breasts do not affect the neighboring cell/tissue, and it is not dangerous or life-threatening. On the other side, the malignant breast tumors are cancerous, and if it is not diagnosed and treated premature, it will cause severe damage to the neighboring cells and tissues. In addition, it gets spread to the nearby lymph glands (nodes). Further, these malignant cancerous cells start spreading throughout the body via the lymph system and bloodstream, which is known as metastasis. Moreover, breast cancer at this point is dangerous, and the probability of cure is very minimal.
According to the study conducted by the Taiwanese government in 2015 and 2016, there was a substantial increase in deaths due to cancer [
1]. In addition, this information is evident from the details portrayed in
Table 1 [
1]. Moreover, in Taiwan, breast cancer in females ranks fourth amongst the top 10 leading causes of cancer deaths for the year 2016. Therefore, many researchers are trying to devise better approaches for the early detection of breast cancer [
2,
3]. Extensive use of intelligent sensing in medical imaging has begun to correctly extract and visualize all the essential details of the internal human body structures in the field of medical diagnosis [
4,
5,
6,
7,
8,
9]. Further, various intelligent sensing modalities such as ultrasound sensing system, computerized axial tomography (CAT), positron emission tomography (PET), and nuclear magnetic resonance imaging (NMR) are helping medical doctors significantly in diagnosing several ailments and health disorders. Each intelligent sensing modalities mentioned above have their own properties and utilities. The diagnosis of cancers in the breast can be achieved through mammography (gold standard), which utilizes ionizing radiation (X-rays). Since these ionizing radiations are harmful in nature and can also enhance the growth of lesion cells, usage of nonionizing diagnosis methods such as ultrasound systems has become widely popular. Moreover, it has to be noted that women with dense breasts are easily prone to breast cancer. In addition, mammography exhibits low-sensitivity in detecting dense breasts with cancer. Therefore, the role of ultrasound sensing systems becomes significant in the effective diagnosis of dense breasts with cancer.
Furthermore, persistent exposure to such radiation might even be more dangerous for the subject under scanning. Moreover, the ultrasound sensing system is considered to be a safe option by medical physicians, as it uses sound waves and has no damaging radiation effects. Moreover, such ultrasound sensing systems are widely prevalent these days in the real-time diagnosis of diseases and health disorders.
In recent investigations, it has been found that when breast cancer is detected in earlier stages, it can be diagnosed and operated upon to remove cancer altogether from the patient [
4,
5,
6,
7,
8,
9]. Moreover, several physicians have recommended the deployment of sonography sensing systems for diagnosing cancer in the breasts. Even though the sonography sensing systems are well-renowned in the premature diagnosis of cancer in the breasts, on the other hand, it is a critical fact that the sonography sensing systems in some cases produce imagery with low-resolution; therefore, suitable approaches are essential for enhancing the resolution of these images. The imaging by the sonography sensing systems can only point out at suspected masses (cysts), and the biopsy is mainly used to assess if the sampled tissue is malignant or normal. In addition, the wastage of overall resources can be avoided by the use of a suitable methodology that will enable medical doctors to make an efficient detection of breast cancer during their primary examination of the imagery. The genetic algorithm (GA) is a well-known approach for solving pattern recognition problems in medical and random image datasets [
10,
11,
12].
The works presented in [
13] established a conventional genetic algorithm for feature selection; besides, they had deployed three distinct classifiers (neural networks, discriminant analysis, logistic regression) for classifying microcalcification patterns present in the digital mammograms. Moreover, they had implemented the digital database for screening mammography (DDSM) dataset obtained from the University of South Florida (
http://www.eng.usf.edu/cvprg/Mammography/Database.html). The authors in [
14] established a conventional genetic algorithm-based approach for feature subset selection and also for fixing the parameters involved in the SVM Classification. Further, they had applied this model to 11 different datasets (German-credit card, Australian-credit card; Pima-Indian diabetes, heart disease-Statlog project, breast cancer-Wisconsin, contraceptive method choice, Ionosphere, Iris, Sonar, Statlog project: Vehicle, Vowel) obtained from UCI repository (
https://archive.ics.uci.edu/mL/datasets.php). The works [
13] and [
14] deployed the conventional genetic algorithm-based model with restricted (same) parameter settings. Moreover, these approaches were not validated under multiple distinct settings of the parameters, which makes them inappropriate for processing the ultrasound images of a patient obtained under various distinct settings of the parameters.
Further, it can be seen that numerous researchers have been working on developing better solutions for ultrasound sensing systems [
15] and also for classifying the lesion regions [
16,
17]. Currently, a few deep-learning models have become popular in diagnosing the diseases from ultrasound image datasets [
18]. The work in [
18] briefly introduces several popular deep learning architectures, and then summarizes and thoroughly discusses their applications in various specific tasks in US image analysis, such as classification, detection, and segmentation. The authors in [
19], discuss a Faster R-CNN based detector that is more suitable for thyroid papillary carcinoma detection in ultrasound images. The research in [
20] establishes an application of deep learning for predicting the low-resolution map of fiber orientation in extracted muscle regions. However, the use of deep-learning models might be challenging when the ultrasound image dataset is a small one. The work in [
21] developed a novel CAD system for mass detection and classification in breast ultrasound images based on the fuzzy SVM. However, their breast ultrasound image dataset was captured in a single (restricted) parameter setting, whereas the breast ultrasound image dataset in our work, has been captured with four different settings of the parameters. The work in [
22] established a novel and accurate method based on ultrasound RF time series analysis and an extended version of support vector machine classification for generating probabilistic prostrate cancer maps, which can augment ultrasound images of the prostate and enhance the biopsy process. The work in [
23] established an SVM system to characterize normal liver, cirrhotic liver, and hepatocellular carcinoma (HCC) using wavelet packet texture descriptors. Further, even though the works in [
22] and [
23] use the keyword SVM and ultrasound images, but it has to be noted that the work in [
22] deploys a prostate ultrasound image dataset in a single (restricted) parameter setting and the work in [
23] utilized the liver ultrasound images obtained in a single (restricted) parameter setting, whereas, our work is related to the breast ultrasound image dataset captured with four different settings of the parameters.
In general, three essential stages are part of the research methodology. The primary stage is generating the required ultrasound dataset imagery, which involves the segregation of the region-of-interest (ROI) for all the images. Then, the second stages include the extraction of the appropriate features using the segregated ROI imagery that is achieved by training the proposed model by utilizing the marked imagery. Subsequently, the third stage represents the classification of these ultrasound imageries. In addition, it is clearly evident that in several scenarios, validating the outcomes of the classification is quite challenging, since most of these approaches follow only a single (constrained) setting of the parameters.
Usually, this scenario leads to a drastic decrease in the quality of the obtained outcomes. Since such a situation where the ultrasound sensing systems having distinct settings of the parameters, can produce diverse imagery for a single subject under study. Additionally, in the computer-aided diagnosis of breast cysts, several research teams have tried to segregate appropriate feature set for successful classification; still, there is a research gap in identifying suitable optimal feature sets for such a task. Therefore, the extraction of highly discriminative and unique features is an arduous and exciting task. Due to this fact, the proposed model is established, and it also generalizes (converges) for four distinct settings of the parameters.
The key contributions of this work are summarized as follows:
This research devises an SVM-enabled intelligent genetic algorithmic model for choosing the universal features with four distinct settings of the parameters.
In addition, this proposed approach categorizes the breast cyst imagery as breast mice (BM) and invasive ductal carcinoma (IDC).
Moreover, the intelligent genetic algorithmic model amalgamates the benefits of wrapper algorithm and filter algorithm for choosing the highly discriminative and comprehensive set of features under four distinct settings of the parameters.
The results of the proposed approach exhibit the fact that the chosen set of universal features enables superior classification outcomes under four distinct settings of the parameters.
Furthermore, the proposed model also empowers the medical doctors in the detection of breast mice (BM) and invasive ductal carcinoma (IDC).
The further portions of this research are categorized as an illustration of the materials and methods available in
Section 2, the outcomes of the experiments are elucidated in
Section 3, and
Section 4 establishes the conclusion of this research.
2. Materials and Methods
The ultrasound breast cyst imagery dataset was gathered from 23 different patients at the Department of Medical Imaging, Buddhist Dalin Tzu Chi General Hospital. The physician used four different settings of the parameter in GELOGIQ 700 for obtaining four diverse ultrasound breast images from each patient. Further, the physician outlined the ROI on each ultrasound breast image, and the system cut the ROI area into many 23 × 23 blocks. A total of 4038 samples with a size of 23 × 23 were collected, including 2012 samples of invasive ductal carcinoma and 2026 samples of breast mice. Among these samples, 50% were utilized for selecting the features and the rest for testing purposes. In this research, the SVM-enabled intelligent genetic algorithmic model is proposed for identifying a superior set of features under four distinct settings of the parameters in the ultrasound sensing systems. It has to be noted that this approach blends together the benefits of both the wrapper algorithm and the filter algorithm, respectively. In addition, during the process of accomplishing the filter algorithm, the features are assessed with the help of the metrics such as Sorensen-Dice coefficient; t-test; and Pearson’s R measure. Subsequently, the wrapper algorithm comprises the deployment of the intelligent genetic algorithmic approach for choosing the universal set of features that exhibits superior performance.
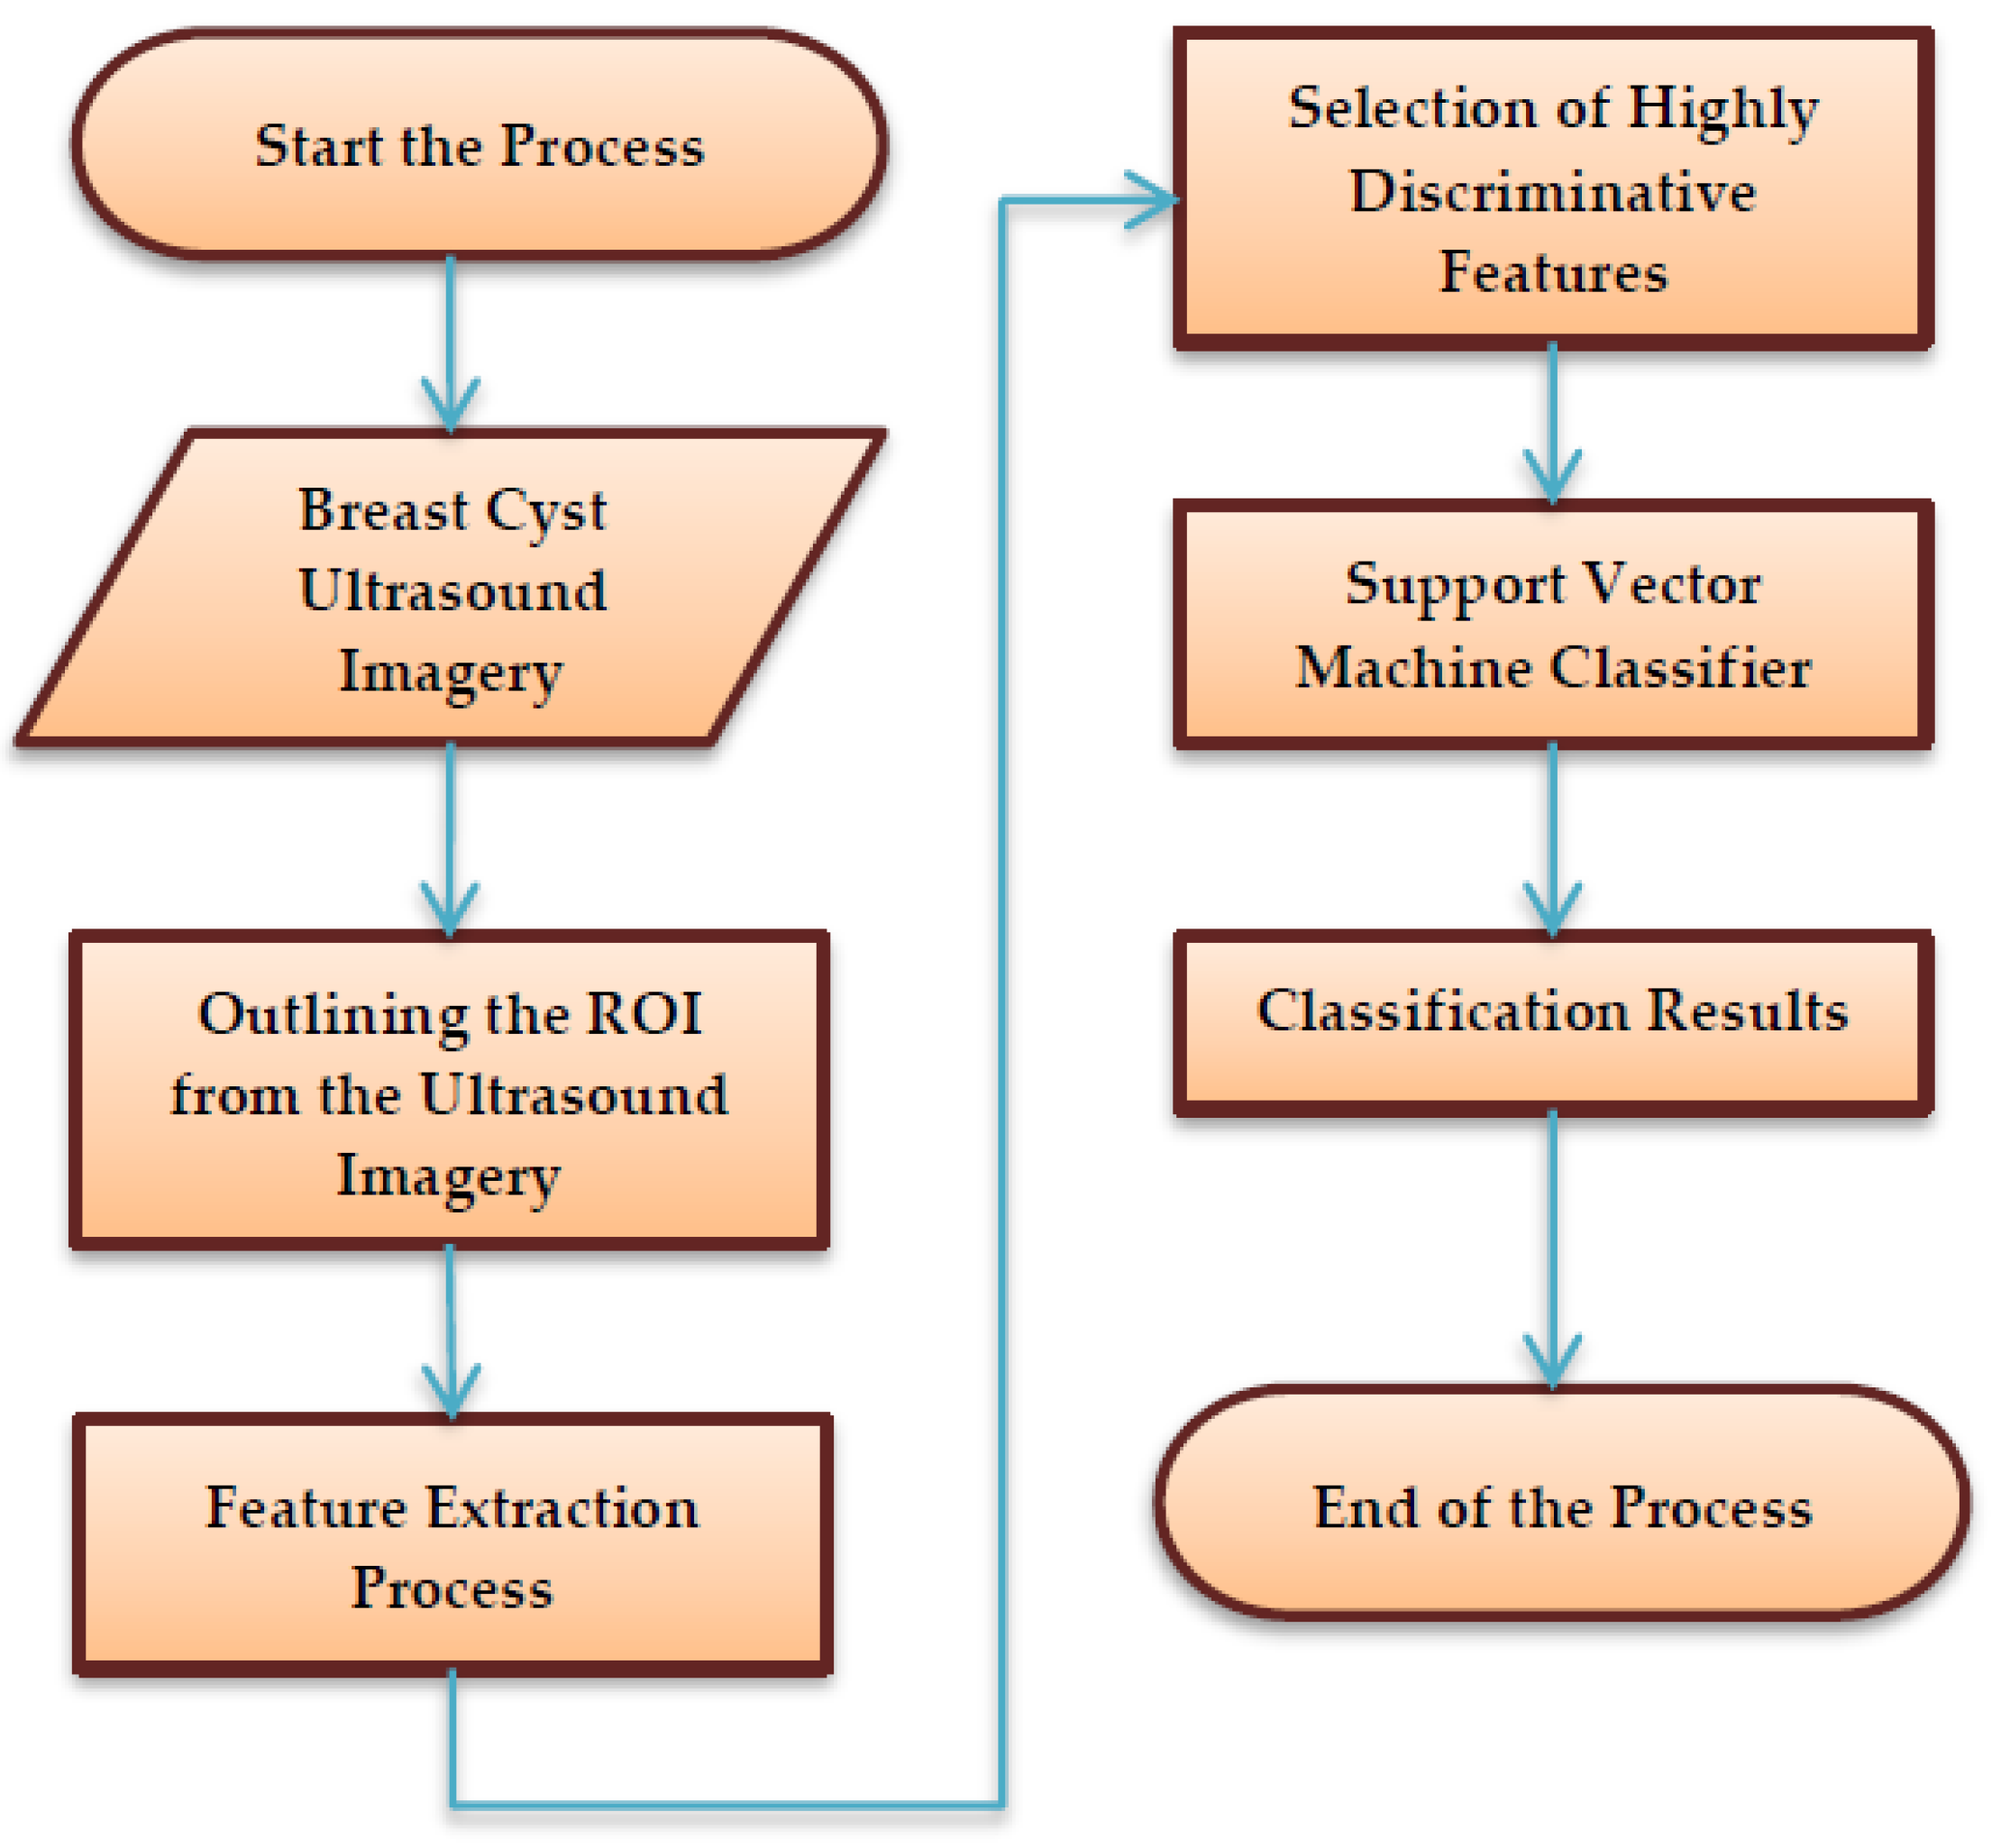
The schematic process flow diagram of the SVM-enabled intelligent genetic algorithmic model is depicted in
Figure 1. Primarily, the process begins with marking and segregating the ROI from the breast cyst ultrasound imagery by a medical practitioner based on his expertise, along with insights from the biopsy report. Then, it is followed by the extraction of 126 unique sets of features from the marked ROI ultrasound imagery utilizing a mask with a size of 23 × 23. Subsequently, the highly discriminative features that exhibit superior accuracy in classifying the images are chosen by deploying the intelligent genetic algorithmic approach. In the final step, the breast cyst ultrasound imagery is classified as breast mice and invasive ductal carcinoma with the assistance of a support vector machine (SVM) approach.
2.1. Outlining the Region-of-Interest from Ultrasound Image
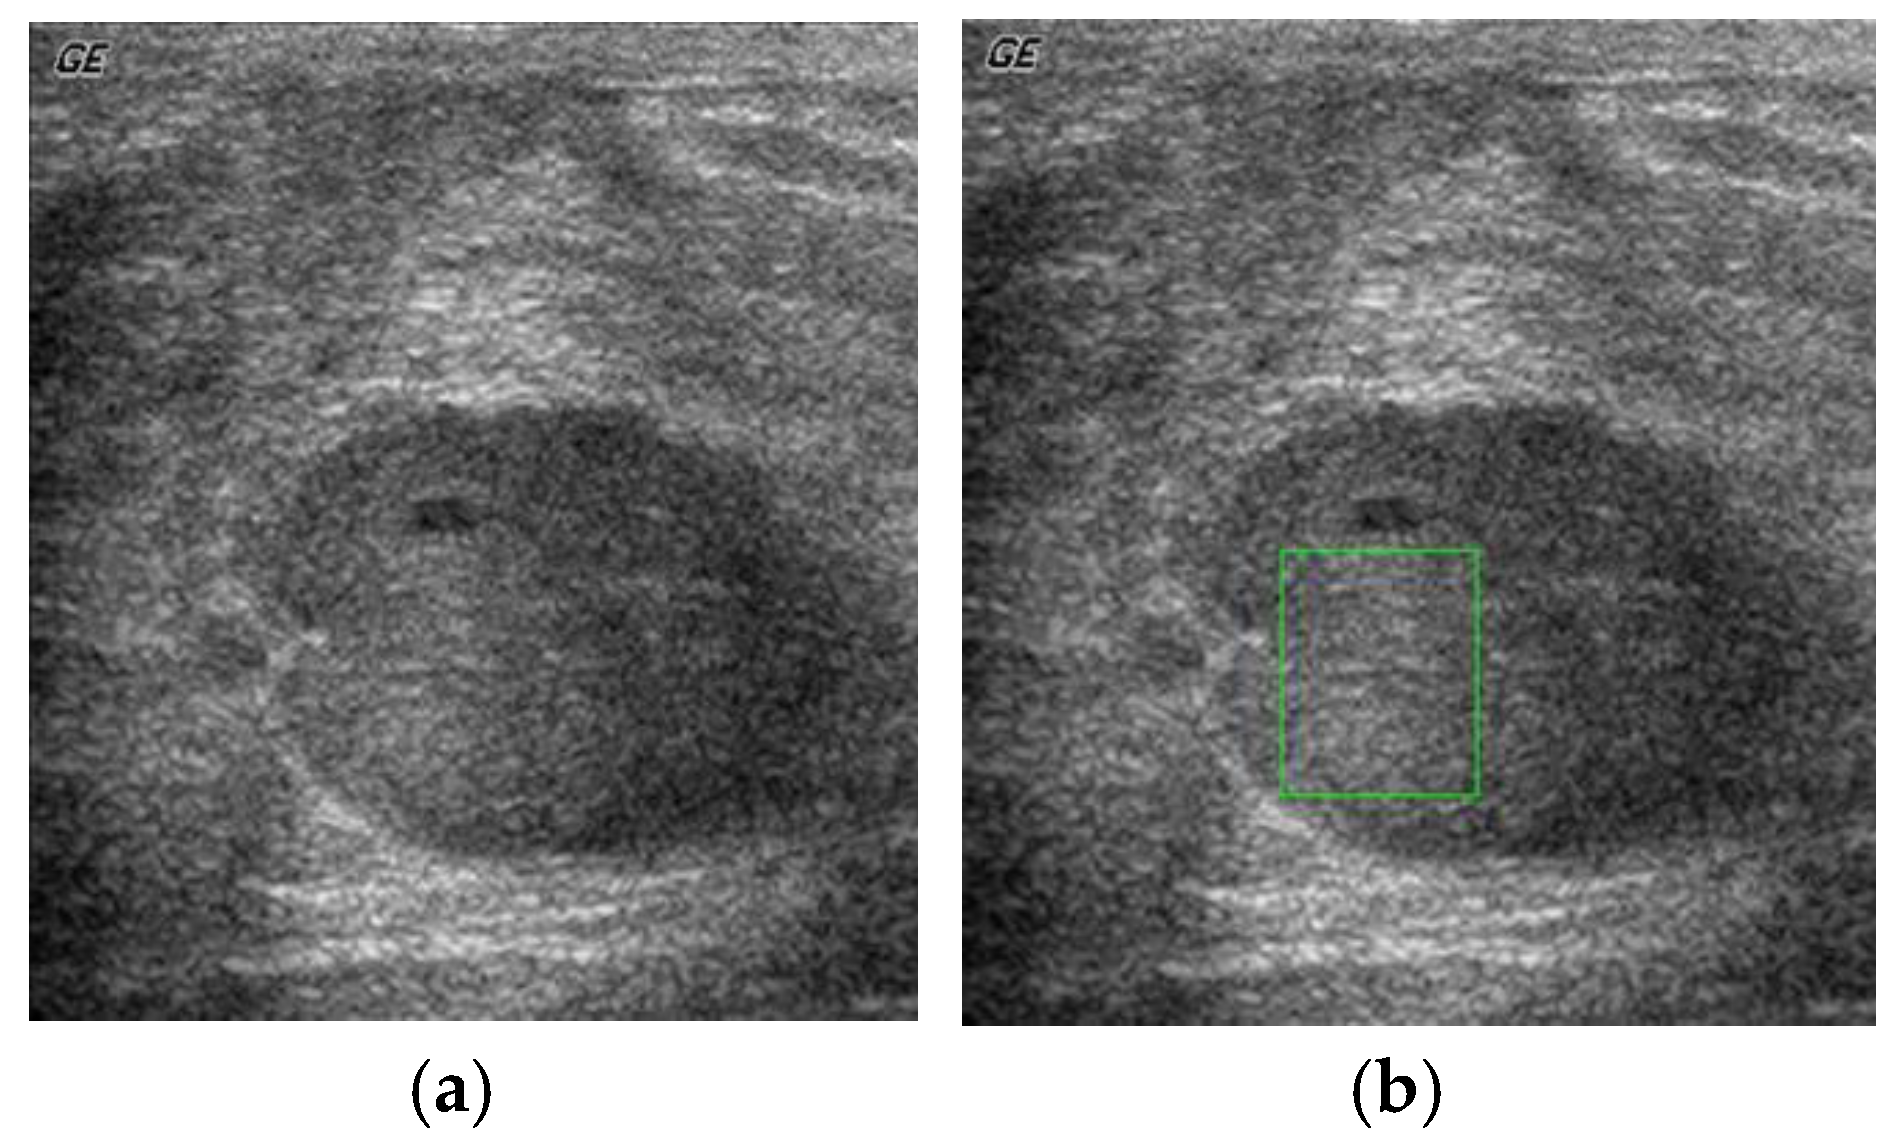
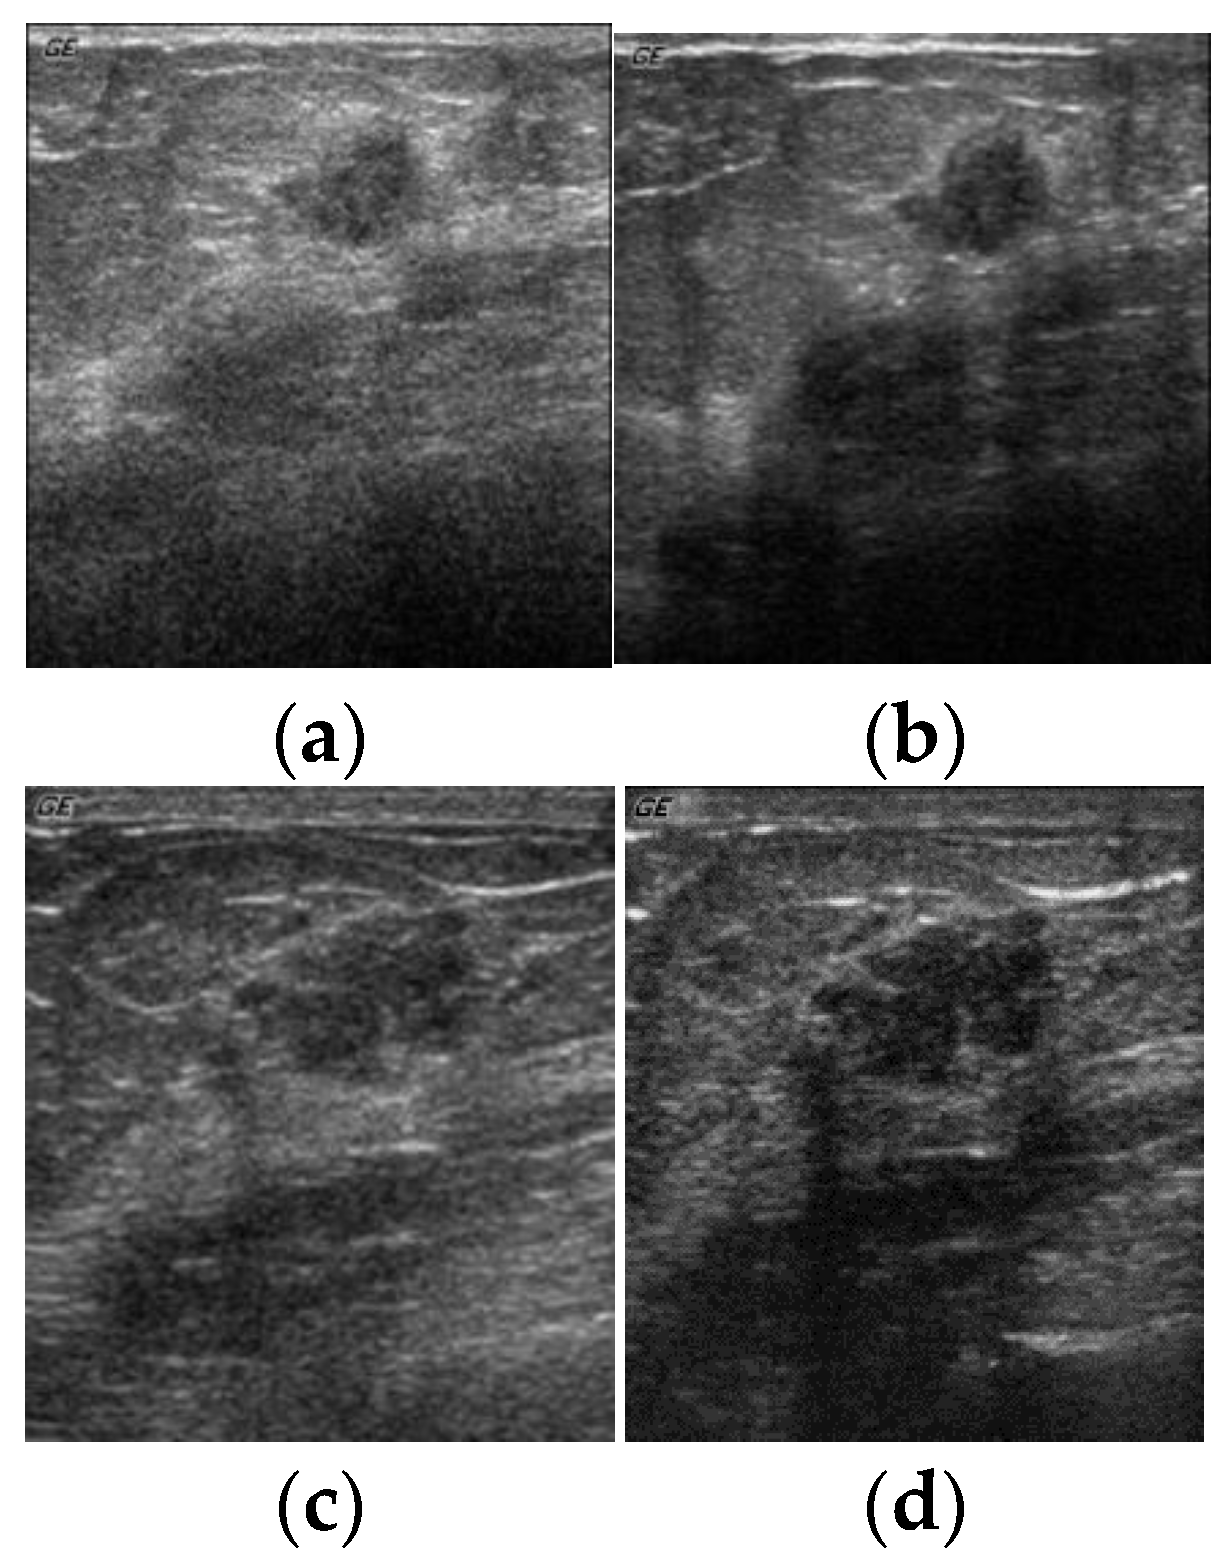
The primary step is the feature set extraction from the ultrasound breast cyst imagery. Initially, the expert medical practitioner identifies, marks, and segregates the ROI from the ultrasound breast cyst image with the ideas taken from the biopsy report. In
Figure 2a, we can observe the general representation of the ultrasound breast cyst image, and
Figure 2b portrays the marked and segregated ROI portions from these imageries.
2.2. Extraction of Feature Sets
In general, from all the ROI images, a mask with a size 23 × 23 is utilized for extracting the 126 feature sets. Further, all these feature sets can be exemplified as follows:
2.2.1. Histogram Feature Sets
The statistical information from the ultrasound breast cyst imagery can be easily obtained utilizing the histogram feature sets. Further, the gray level distribution and related properties of the ultrasound breast cyst imagery can be computed employing the histogram. In addition, the histogram is utilized in this work to extract and compute seven sets of the feature that are represented in
Table 2.
2.2.2. Gray-Level Spatial Dependence Matrix
A statistical approach for assessing the texture that assumes the spatial association between the pixels is mentioned as the gray-level spatial dependence matrix (GLSDM) [
24]. Further, this matrix produces distinct outcomes based on the distance and angle parameter values, respectively. It can be observed that the gray-level spatial dependence matrix aids in the computation of 13 sets of the feature represented in
Table 3.
2.2.3. Statistical Feature Matrix
Generally, the statistical characteristics such as the distance between the pixels of the image is computed with the aid of the statistical feature matrix (SFM) [
25]. In this research, we compute the dissimilarity (F21) feature using the statistical feature matrix, as shown in
Table 4.
2.2.4. Gray Level Run-Length Textural Matrix
The gray level run-length textural matrix can be computed using the image’s gray-level and the maximum amount of gray-level value that appears incessantly in a particular pathway [
26]. The five sets of features can be computed utilizing the gray level run-length textural matrix (GLRLM), as depicted in
Table 5.
2.2.5. Laws’ Texture Energy Matrix
The core vector of the texture can be computed using the Law’s texture energy matrix [
27]. The statistical outcomes are achieved by deploying the Law’s mask with the size 5 × 5 over the ultrasound breast cyst imagery. As a result, we could compute around ten sets of features utilizing this matrix, as represented in
Table 6.
2.2.6. Neighboring Gray Level Dependence Matrix
Usually, the gray-level association between all the image pixels and its neighbors can be utilized for generating the neighboring gray level dependence matrix (NGLDM) [
28]. The five sets of the features extracted using the neighboring gray level dependence matrix is represented in
Table 7.
2.2.7. Neighborhood Gray Tone Difference Matrix
The neighborhood gray tone difference matrix (NGTDM) aids in attaining the spatial variation of the gray intensity via the notification of the gray tone difference amidst the pixel and its neighboring pixels in an image [
29]. Then, neighborhood gray tone difference matrix is utilized for obtaining the five sets of the feature, as shown in
Table 8.
2.2.8. Wavelet Transform Feature Sets
Typically, using the wavelet transform, the images can be disintegrated as the low–low frequency subband images utilizing the low pass filters [
30]. In addition, the LL subband obtained using the wavelet transform is deployed for computing the forty-eight sets of features, as portrayed in
Table 9.
2.2.9. Fourier Features—Local Fourier Coefficients
The local Fourier coefficients of the ultrasound breast cyst imagery can be obtained by deploying the Fourier transform. Further, it can be observed that all the coefficients have two elements, namely, the magnitude and the phase angle. Moreover, utilizing the Fourier transform, we could compute around 32 features, as listed in
Table 10.
2.3. SVM-Enabled Intelligent Genetic Algorithmic Model for Selecting Appropriate Features
In this work, the SVM-enabled intelligent genetic algorithmic model encompasses the selection of features portion that entails two stages; namely, the first stage is the filter algorithm stage, and the second one is the wrapper algorithm stage. Further, in the filter algorithm stage, the features possessing a low score are removed. In addition, this is accomplished through utilizing the Sorensen-Dice coefficient, t-test, and Pearson’s R measure. Then, the highly discriminative and superior subset of features is obtained by deploying the intelligent genetic algorithmic approach.
2.3.1. Filter Algorithm
We observed that the previous section also dealt with the extraction of 126 feature sets. Furthermore, these sets of features become the input of the intelligent genetic algorithmic model. Moreover, another major point to be taken into account is that the set of features, which were obtained using four distinct settings of the parameters, become a diverse group. However, it has to be noted that the complexity of the overall computation becomes a challenging point at this juncture. Therefore, this arduous challenge can be surpassed through the deployment of the three assessment measures such as Sorensen-Dice coefficient, t-test, and Pearson’s R measure for scoring the extracted set of features and thereby eliminating the low-scoring and irrelevant features. The assessment metrics used in eliminating the irrelevant features are discussed beneath:
The augmented version of the Sorensen-Dice coefficient of the
i-th feature set for the ultrasound breast cyst datasets can be expressed using the following equation:
where the values
, and
signifies the average of the
i-th feature in for all the ultrasound breast cyst datasets and the
j-th ultrasound breast cyst dataset, correspondingly. Further, the value
specifies the average of the
i-th feature of the
k-th instance in the
j-th ultrasound breast cyst dataset and
represents the total number of features.
The values of the
t-test score for the
i-th feature in the
j-th dataset can be expressed using the following equation:
where the values
, and
specify the average value of the positive and negative instances of the
i-th feature in the
j-th ultrasound breast cyst dataset, correspondingly. The values
and
signify the total number of positive and negative instances of the
i-th feature in the
j-th ultrasound breast cyst dataset, correspondingly. Further, the values
and
characterize the standard deviation of the
i-th feature of the positive and negative instances in the
j-th ultrasound breast cyst dataset, correspondingly. The
t-test score of the
i-th feature in all ultrasound breast cyst datasets can be stated using the following equation:
where
represents the total number of ultrasound breast cyst datasets.
Pearson’s R measure of the
k-th feature between ultrasound breast cyst datasets
and
can be expressed using the following equation:
where the factors
and
specify the value of the feature
in
i-th and
j-th ultrasound breast cyst dataset, correspondingly. Further, the factors
and
signify the mean values of
and
averaged over
occurrences. Moreover, after the computation of the Pearson’s R measure for all likely groupings of the ultrasound breast cyst datasets, the Pearson’s R measure of the
k-th feature in each ultrasound breast cyst dataset is computed.
The Pearson’s R measure of the feature
in ultrasound breast cyst dataset
can be expressed using the following equation:
where
signifies the total number of ultrasound breast cyst dataset. Finally, Pearson’s R measure of the
k-th feature for all ultrasound breast cyst datasets can be computed using the following equation:
Moreover, after accomplishing the computation of the assessment metrics such as Sorensen-Dice coefficient, t-test, and Pearson’s R measure for all the sets of features, three scores for each set of features are listed. Subsequently, these features are sorted down in the decreasing order based on their assessment scores. Further, the set of irrelevant features with low assessment scores are removed. Consequently, the support vector machine classifier is utilized for computing the accuracy of classification for these set of features. Lastly, the set of ranked features in both these lists that intersect gets selected for the next phase, namely the wrapper algorithm.
2.3.2. Wrapper Algorithm
Usually, selecting the features that yield superior accuracy in classifying the ultrasound breast cyst datasets for four distinct settings of the parameters is achieved through this stage. Moreover, the SVM-enabled intelligent genetic algorithm gets utilized as the wrapper. The intelligent genetic algorithm can be seen as a smart approach for searching the highly discriminant features, which impersonates the natural selection approach. Subsequently, based on the principle known as the “survival of the fittest,” this intelligent genetic algorithm achieves optimal outcomes after a sequence of iterations. It can be observed that in this algorithm, all the chromosomes are depicted by means of a bit or an integer string. Consequently, the intelligent genetic algorithm has three major phases, namely, the reproduction, the crossover, and the mutation. Therefore, in the reproduction phase, the chromosomes are selected based on the assessment of their fitness values. Then, the crossover and mutation phases are the critical stages for producing the next generation chromosomes. In addition, the fitness function, design of chromosomes, and the intelligent genetic algorithm are discussed in the subsequent subsection.
We have initially stated that the key objective of this research is determining the universal sets of the feature that achieves superior classification outcomes for four distinct settings of the parameters. Therefore, the accuracy of the classification and the variance in the accuracy for all four distinct settings of the parameters play a vital role in designing the fitness function. In addition, the following equation represents the fitness function, which obeys the principles as mentioned above:
where
s specifies the total number of ultrasound breast cyst images, the value
signifies the accuracy of classification for the
i-th ultrasound breast cyst images.
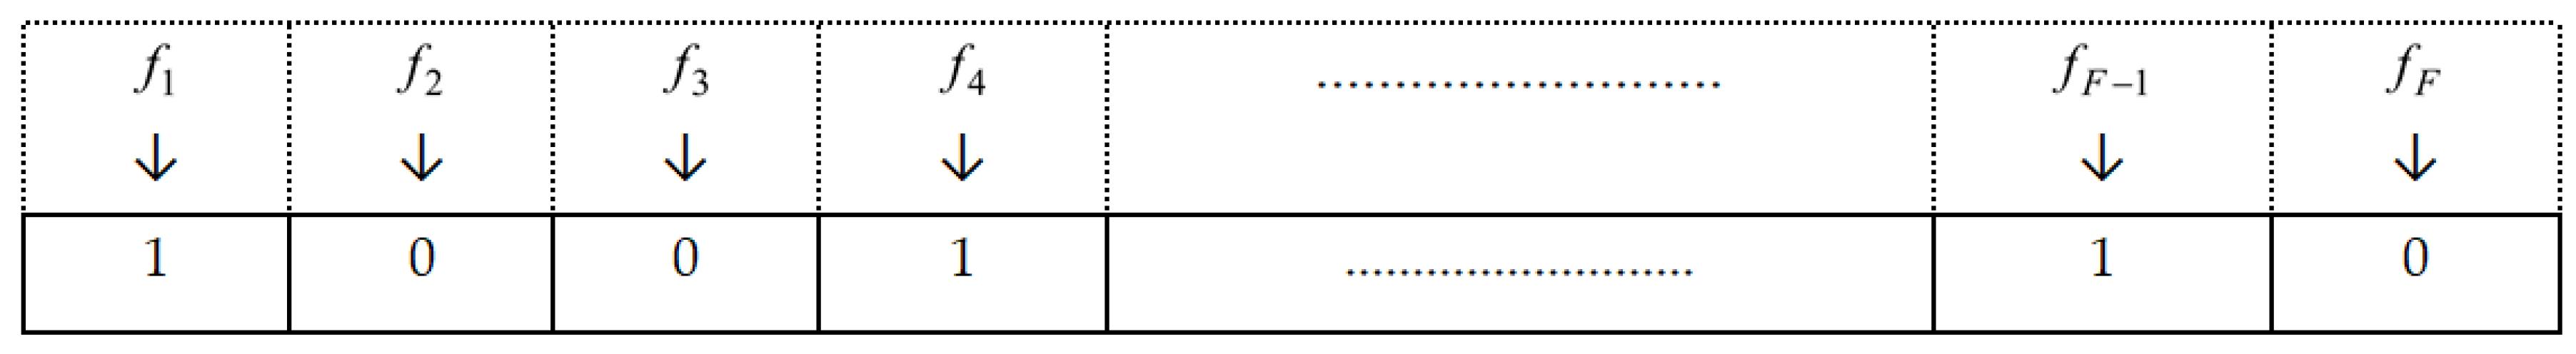
In the design of chromosomes, each chromosome can be portrayed utilizing an n-digit binary string. Further, the factor “F” signifies the total number of feature sets. Moreover, individual chromosomes designate either the digit “one” or “zero” to indicate the selection of a feature. The schematic diagram of the binary encoding of the chromosome is depicted in
Figure 3.
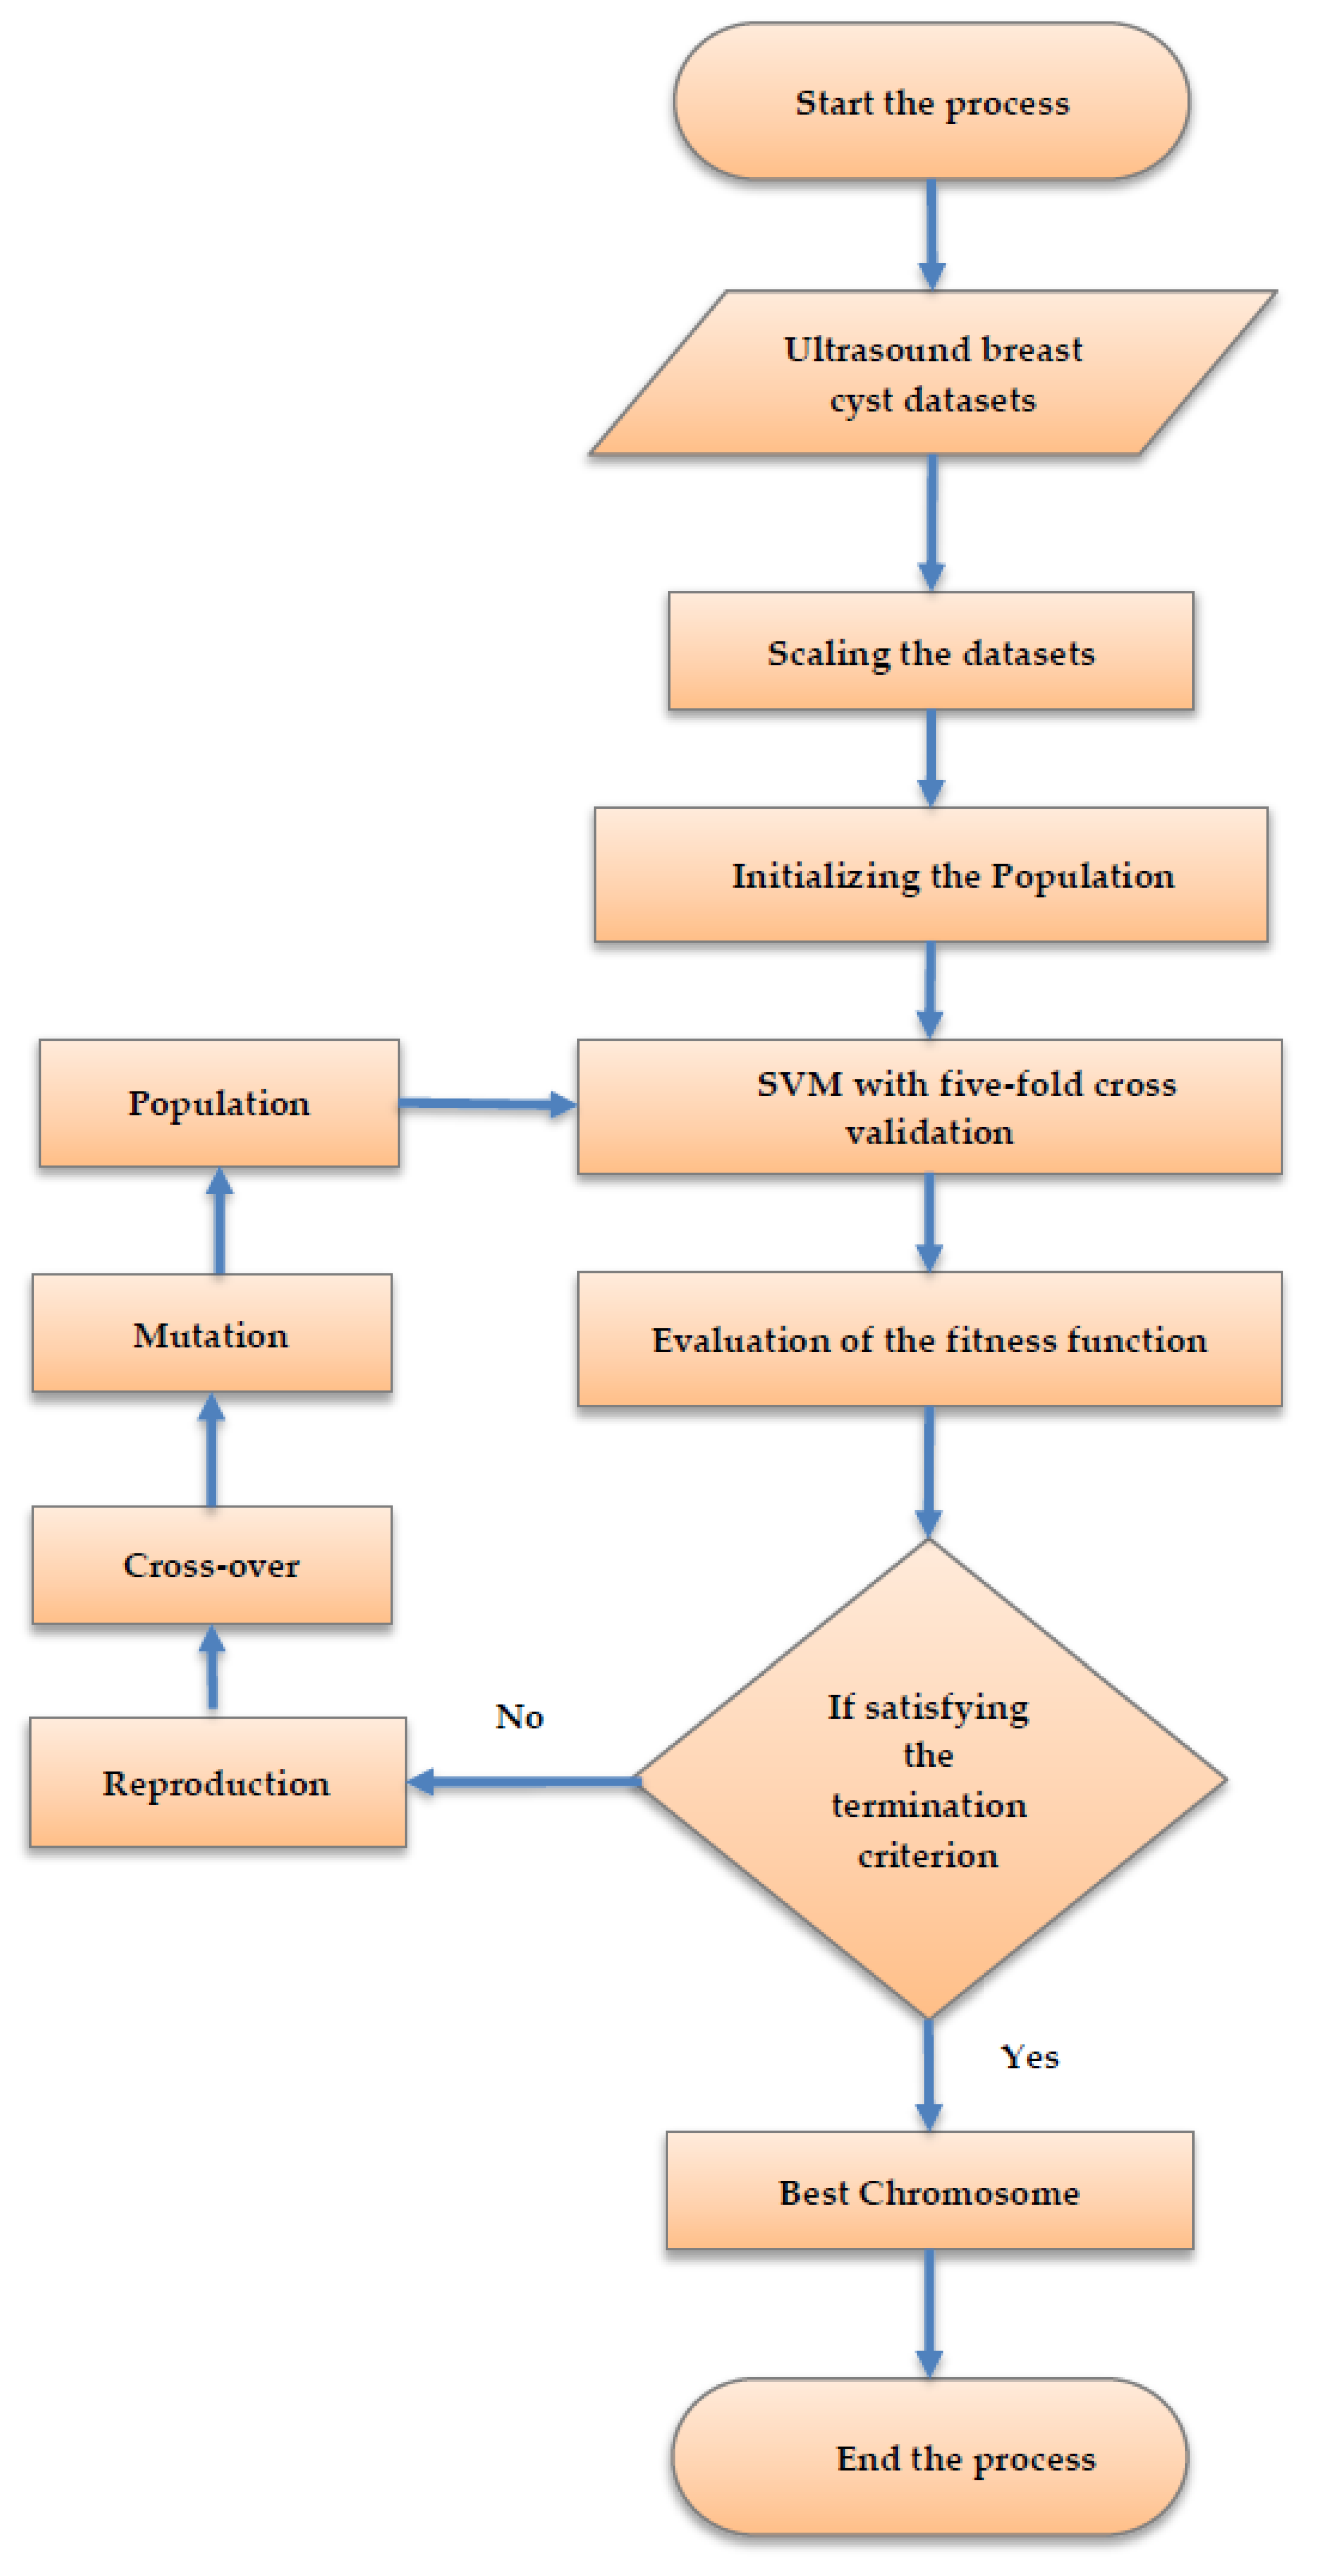
The schematic flow diagram for selecting the set of features utilizing the intelligent genetic algorithm is illustrated in
Figure 4. Subsequently, the algorithm is discussed in the following subsection.
Stage (i): The feature values are scaled into (−1, +1) using the following equation:
where
signifies the value of feature
i,
illustrates the mean value of
,
symbolizes the standard deviation of feature
i. Moreover, the scaling process is performed in order to ignore the attributes in the numeric range superseding the attributes in a smaller numeric range. In addition, the accuracy rate of the support vector machine classification can also be improved utilizing this scaling of the ultrasound breast cyst images.
Stage (ii): The process of initializing the population begins along with the chromosome encoding. These populations are generated in a random manner. Moreover, it has to be noted that all chromosomes get themselves encoded in the form of a binary string.
Stage (iii): For all the chromosomes, the accuracy rate of the support vector machine classification is computed utilizing the five-fold cross-validation approach.
Stage (iv): The fitness function is deployed to assess all the chromosomes in the ultrasound breast cyst dataset with the aid of computing the accuracy rate of the SVM classification
Stage (v): The process terminates itself when the stopping criterion gets fulfilled. In addition, this process gets terminated when the chromosome generation attains the value 500. During this stage, if the algorithm is still running, then this process proceeds to stage (vi).
Stage (vi): The process searches for superior solutions employing reproduction, crossover, and mutation. The stage (ii)–stage (vi) is repeated until this algorithm attains the stopping criterion.
2.3.3. Support Vector Machine Approach
Moreover, this research devises the fitness function that relies on the accuracy rate of the support vector machine classification. Further, the objective of the SVM is about searching the optimal hyper-plane that segregates the ultrasound breast cyst dataset into two different classes. The support vector machine hyper-plane can be expressed using the following equation:
where
signifies its respective class membership, the factor
portrays the support vectors that are feature values of the ultrasound breast cyst images,
N represents the total number of support vectors, and the factor
denotes the kernel function. In addition, it has to note that the kernel function deployed in this research is the radial basis function (RBF) and it can be expressed using the following equation:
where
specifies the kernel width.


