Abstract
This article introduces a new way of using a fibre Bragg grating (FBG) sensor for detecting the presence and number of occupants in the monitored space in a smart home (SH). CO2 sensors are used to determine the CO2 concentration of the monitored rooms in an SH. CO2 sensors can also be used for occupancy recognition of the monitored spaces in SH. To determine the presence of occupants in the monitored rooms of the SH, the newly devised method of CO2 prediction, by means of an artificial neural network (ANN) with a scaled conjugate gradient (SCG) algorithm using measurements of typical operational technical quantities (indoor temperature, relative humidity indoor and CO2 concentration in the SH) is used. The goal of the experiments is to verify the possibility of using the FBG sensor in order to unambiguously detect the number of occupants in the selected room (R104) and, at the same time, to harness the newly proposed method of CO2 prediction with ANN SCG for recognition of the SH occupancy status and the SH spatial location (rooms R104, R203, and R204) of an occupant. The designed experiments will verify the possibility of using a minimum number of sensors for measuring the non-electric quantities of indoor temperature and indoor relative humidity and the possibility of monitoring the presence of occupants in the SH using CO2 prediction by means of the ANN SCG method with ANN learning for the data obtained from only one room (R203). The prediction accuracy exceeded 90% in certain experiments. The uniqueness and innovativeness of the described solution lie in the integrated multidisciplinary application of technological procedures (the BACnet technology control SH, FBG sensors) and mathematical methods (ANN prediction with SCG algorithm, the adaptive filtration with an LMS algorithm) employed for the recognition of number persons and occupancy recognition of selected monitored rooms of SH.
1. Introduction
Recognizing the occupancy, number of individuals, location-and-movement recognition and activity recognition of an individual in an indoor space is one the key functionalities of a smart home (SH), as a prerequisite to providing services to support independent living of elderly SH occupants and has a great influence on internal loads and HVAC (heating, ventilation and air conditioning) requirement, thus increasing the energy consumption optimization. Azghandi et al. focused on the particular case of an SH with multiple occupants, they developed a location-and-movement recognition method using many inexpensive passive infrared (PIR) motion sensors and a small number of more costly radio frequency identification (RFID) readers [1]. Benmansour et al. provided an overview of existing approaches and current practices for activity recognition in multi-occupant SHs [2]. Braun et al. reported the investigation of two categories of occupancy sensors with the requirements of supporting wireless communication and a focus on the low cost of the systems (capacitive proximity sensors and accelerometers that are placed below the furniture) with a classification accuracy between 79% and 96% [3]. Chan et al. proposed the methodology and design of a voice-controlled environment, with an emphasis on speech recognition and voice control, based on Amazon Alexa and Raspberry Pi in an SH [4]. Chen et al. proposed an activity recognition system guided by an unobtrusive sensor (ARGUS) with a facing direction detection accuracy, resulting from manually defined features, that reached 85.3%, 90.6%, and 85.2% [5]. Khan et al. developed a low-cost heterogeneous radar-based activity monitoring (RAM) system for recognizing fine-grained activities in an SH with detecting accuracy of 92.84% [6]. Lee et al. investigated the use of cameras and a distributed processing method for the automated control of lights in an SH, which provided occupancy reasoning and human activity analysis [7]. Mokhtari et al. proposed a new human identification sensor, which can efficiently differentiate multiple residents in a home environment to detect their height as a unique bio-feature with three sensing/communication modules: pyroelectric infrared (PIR) occupancy, ultrasound array, and Bluetooth low-energy (BLE) communication modules [8]. A new recognition algorithm for household appliances, based on a Bayes classification model, is presented by Yan et al., in which sequential appliance power consumption data from intelligent power sockets is used and for the generalization and extraction of the characteristics of occupant behavior and power consumption of typical household appliances [9]. Yang et al. proposed a novel indoor tracking technique for SHs with multiple residents by relying only on non-wearable, environmentally deployed sensors such as passive infrared motion sensors [10]. Feng et al. presented a novel real-time, device-free, and privacy-preserving WiFi-enabled Internet of Things (IoT) platform for SH-occupancy sensing, which can promote a myriad of emerging applications with an accuracy of 96.8% and 90.6% in terms of occupancy detection and recognition, respectively [11]. Traditionally, in building energy modeling (BEM) programs, occupant behavior (OB) inputs are deterministic and less indicative of real-world scenarios, contributing to discrepancies between simulated and actual energy use in buildings. Yin et al. (2016) presented a new OB modeling tool, with an occupant behavior functional mock-up unit (obFMU) that enables co-simulation with BEM programs implementing a functional mock-up interface (FMI) [12]. Occupants are involved in a variety of activities in buildings, which drive them to move among rooms, enter or leave a building. Hong et al. (2016) defined SH occupancy using four parameters and showed how they varied with time. The four occupancy parameters were as follows: (1) the number of occupants in a building, (2) occupancy status of space, (3) the number of occupants in a space, and (4) the location of an occupant [13].
In order to detect the occupancy of the SH by indirect methods (without using cameras), common operational and technical sensors are used in this article to measure the indoor temperature, the indoor relative humidity and the CO2 indoor concentration within the BACnet technology for HVAC control. A fibre Bragg grating (FBG) sensor will be used to detect the number of occupants in the monitored space of room R104 (ground floor). The method devised for the prediction of the CO2 waveform using artificial neural network (ANN) scaled conjugate gradient (SCG) will be verified during the experiments conducted to detect the occupancy of rooms R104, R203 and R204. The input quantities measured to ANN SCG were obtained from the indoor temperature and relative indoor humidity sensors. One of the objectives of the article is to verify the possibility of minimizing investment costs by using cheaper temperature and relative humidity sensors instead of a more expensive CO2 sensor to detect the occupancy of monitored SH spaces. The other objectives of this article are the following:
- Experimental verification of FBG sensor use for the recognition of the number occupants in SH room R104.
- Experimental verification of the CO2 concentration measurement in an SH by means of common operational sensors for the occupancy status of the SH space.
- Experimental verification of the method with ANN SCG that was devised for CO2 concentration prediction (more one-day measurements in the period from 25 June 2018, to 28 June 2018) to locate an occupant (in rooms R104, R203, and R204) in an SH with the highest possible accuracy.
- Experimental verification of the possibility of ANN learning for one room only (R203) in order to predict CO2 concentrations in other rooms (R104, R204).
The experimental measurements of objective parameters of the internal environment and thermal comfort evaluation were conducted in selected SH rooms R204, R203, and R104 in a wooden building of the passive standard located in the Faculty of Civil Engineering, VSB—TU Ostrava. (Figure 1) [14].
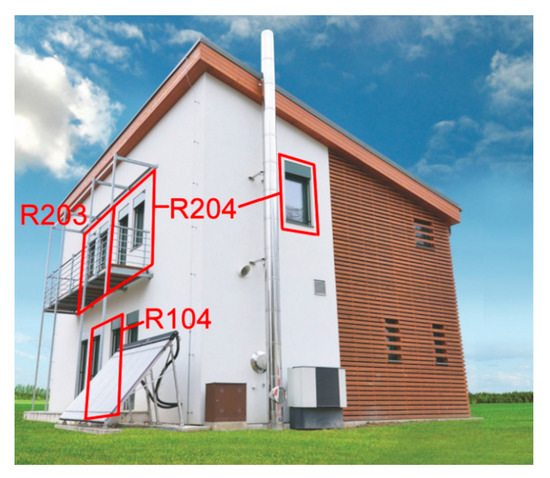
Figure 1.
The wooden building of the passive standard located in the Faculty of Civil Engineering, VSB—TU Ostrava with selected smart home (SH) rooms R204, R203, and R104 [15].
2. Materials and Methods
2.1. Fiber Bragg Grating (FBG) Sensor Using for Recognition of Number Occupants in Smart Home (SH) Room R104
Bragg gratings (FBG) are special structures created by an ultraviolet (UV) laser inside the core of a photosensitive optical fibre. This structure consists of a periodic structure of changes in the refractive index, where the layers of the refractive index of the core alternate with the layers of the increased refractive index (1):
where is the refractive index induced by UV radiation [16].
When a broad-spectrum light is introduced into the optical fibre, the Bragg grating reflects a narrow spectral portion and all the other wavelengths pass through the structure without damping (Figure 2).
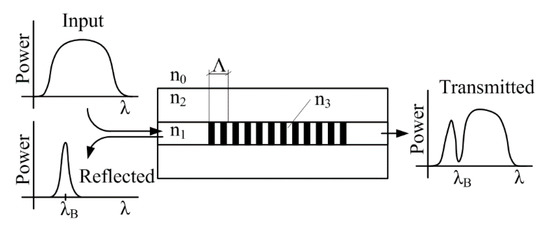
Figure 2.
The Bragg grating principle.
The central wavelength of the reflected spectral portion is called the Bragg wavelength and is defined by the optical and geometric properties of the structure according to (2):
where is the effective refractive index of the periodic structure and is the distance between the periodic changes in the refractive index. The external effects of the temperature and the deformation influence the optical and geometric properties and thus, the spectral position of the Bragg wavelength. Thanks to this feature, Bragg gratings are used in sensory applications. The dependence of the Bragg wavelength on the deformation and the temperature is expressed by (3):
where is the deformation coefficient, is the optical fibre deformation caused by measurement, is the coefficient of thermal expansion, is the thermo-optic coefficient and is the change in the operating temperature [17].
Bragg gratings in a standard optical fibre with a central wavelength of 1550 nm show a deformation sensitivity of 1.1 pm/µstrain and a temperature sensitivity of 10.3 pm/°C. By using a suitable encapsulation, it is possible to implement a sensor of almost any physical quantity. FBG sensors are used in automobile [18] and railway transport [19], the construction industry [20], power engineering, biomedical [21] or perimetric applications [22], etc.
Bragg gratings are single-point sensors. By using a wavelength or time multiplex, it is possible to connect tens or hundreds of these sensors in a single optical fibre in order to achieve a quasi-distributed sensory system [23].
2.1.1. Fiberglass Bragg Sensors
One of the most widespread applications of Bragg gratings includes deformation and compression measurements. Depending on the type of application, Bragg gratings can be encapsulated in many ways. The principle of the encapsulation is to protect the fragile glass fibre, to enhance the sensitivity to the desired quantity and to suppress the surrounding interference. Bragg gratings can be encapsulated in polymers [24] of fibreglass or composite materials [25,26], and special steel jigs [27], which are mechanically attached to the structure that is to be measured, etc. Based on the advantages of using Bragg gratings—such as their reliable and very accurate measurement—these types of sensors were used for the reference measurement of the occupancy recognition of room R104 in the SH.
Because the grating sensors were installed on a wooden staircase, the encapsulation of Bragg gratings in fibreglass strips was used. This method enables the implementation of a very thin sensor that transmits deformations from the step (passage of persons) to the optical fibre itself.
Two Bragg gratings in a single-mode optical fibre with primary acrylate protection were used for implementing the sensors. Bragg gratings A and B had the following parameters: The Bragg wavelengths were 1547.510 nm and 1552.369 nm, respectively; the reflection spectrum width was 256 pm and 227 pm, respectively; the reflectivity was 91.2% and 91.3%, respectively. Each Bragg grating was placed between the glass fabrics (2 layers below and 2 layers above the optical fibre). The glass fabric was then coated with a polymer resin. The actual curing caused a Bragg wavelength shift of 23 µm for Sensor A and of 19 µm for Sensor B to lower wavelengths (Figure 3). The Bragg grating is located in the middle of the fibreglass strip, marked in red.

Figure 3.
Implementation of the sensor by encapsulating the Bragg grating in fibreglass (a); the resulting fibre Bragg grating (FBG) fibreglass sensor (b).
2.1.2. Implementation of FBG Sensors
FBG sensors were implemented on the staircase leading from the ground floor to the first floor (Figure 4). The sensors were glued with cyanoacrylate adhesive to the bottom of the second step (FBG A) and the third step (FBG B).
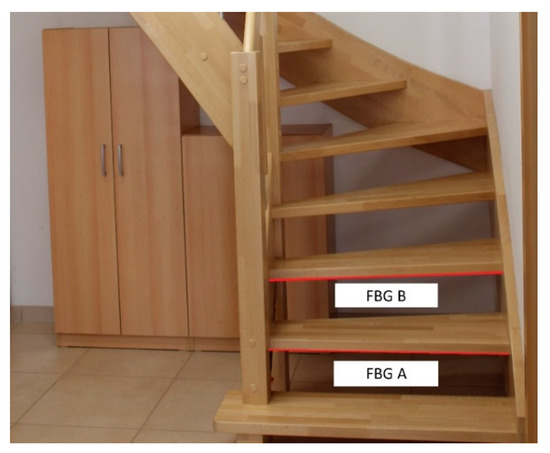
Figure 4.
Placement of FBG sensors on the staircase in the smart home (SH), room R104.
2.2. Use of a CO2 Sensor Network for Monitoring SH Space Occupancy
Common CO2 sensors can be used to detect the occupancy of individual SH spaces. In room R104, the BT 12.09 sensor (Figure 5), in room R203 the BT 12.10 sensor and in room R204 the BT 12.10 sensor (Figure 6) were used for measuring the CO2 concentration in the framework of forced Air Condition (AC) control (Figure 7). The BACnet technology is used in the SH to control HVAC (Figure 8). The presence of occupants in the SH can be detected by measuring the CO2 concentration. Figure 5 shows the ground plan of the ground floor of the SH with the location of the individual sensors for CO2 measurement.
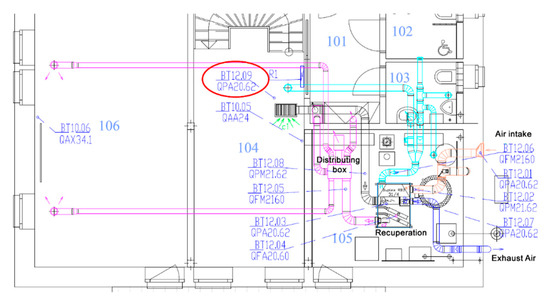
Figure 5.
The ground plan of the ground floor of the SH with the location of the sensors for CO2 measurement.
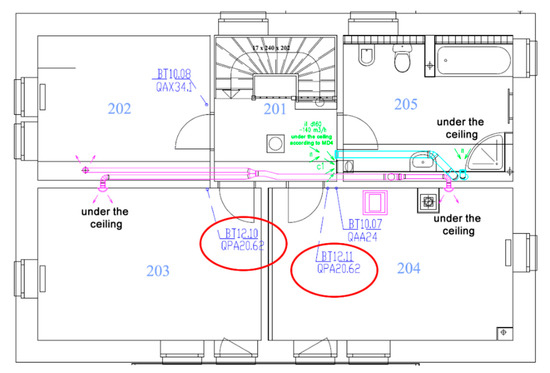
Figure 6.
The ground plan of the first floor of the SH with the location of the sensors for CO2 measurement.
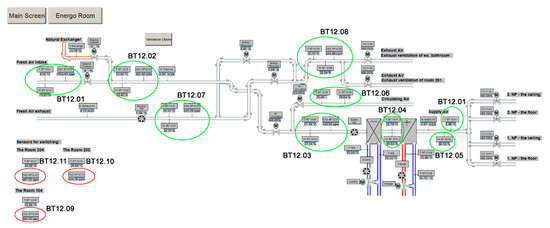
Figure 7.
The ventilation distribution technology with the location of the individual sensors for CO2 measurement in an SH.
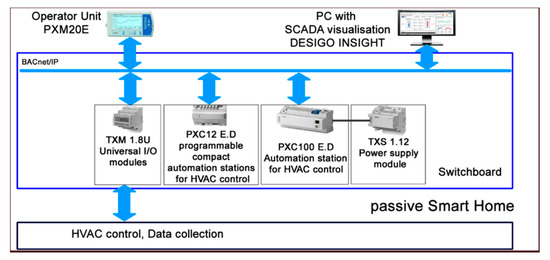
Figure 8.
Block diagram of the BACnet technology used in an SH for HVAC control.
The individual rooms on the ground floor of the SH are marked as follows (Figure 5):
- R101—door space, entrance hall,
- R102—toilet 1,
- R103—toilet 2,
- R104—entrance room; FBG sensor is placed on the staircase,
- R105—utility room, there are heating sources,
- R106—classroom.
Figure 6 shows the ground plan of the first floor of the SH with the location of the individual sensors for CO2 measurement.
The individual rooms on the SH first floor are marked as follows (Figure 6):
- R201—staircase,
- R202—control room,
- R203—classroom (office),
- R204—classroom (office),
- R205—toilet and bathroom.
- BT 12.01—Measurement at the fresh outdoor air inlet into QPA 2062 SH.
- BT 12.02—Measurement at the recirculation air inlet from SH spaces into QPM 2162 heat recovery unit.
- BT 12.03—Measurement at the recirculation air inlet from SH spaces into QPA 2062 heat recovery unit.
- BT 12.04—Measurement in QFA 2060 heat recovery unit.
- BT 12.05—Measurement at the recirculation and fresh air outlet from the heat recovery unit into QFM 2160 SH.
- BT 12.06—Measurement at the exhaust air inlet into QFM 2160 recuperation unit.
- BT 12.07—Measurement at the exhaust air outlet from QPA 2062 recuperation unit.
- BT 12.08—Measurement at the recirculation air inlet from SH spaces into QPM 2162 heat recovery unit.
- BT 12.09—sensor located in room R104, QPA 2062.
- BT 12.10—sensor located in room R203, QPA 2062.
- BT 12.11—sensor located in room R204, QPA 2062.
The technical specification of the individual sensors used:
- QPA 20.62 room sensor for measuring the air quality—CO2, relative humidity and temperature—with a measurement accuracy: (50 ppm + 2% of the value measured, long-term drift: 5% of the measuring range/5 years (typically). The CO2 sensor principle is based on non-dispersive infrared absorption (NDIR) measurement.
- QPM 21.62 channel sensors for air quality—CO2, relative humidity, temperature. Measurement accuracy: (50 ppm + 2% of the value measured), long-term drift: 5% of the measuring range/5 years (typically). The CO2 sensor is based on non-dispersive infrared absorption (NDIR) measurement.
- QFA 20.60 room sensor for temperature and relative humidity. Measurement accuracy ± 3% rHin within the comfort range. Application range −15 … +50 °C/0 … 95% rHin (no condensation).
- QFM 21.60 channel sensor for relative humidity and temperature. Measurement accuracy ± 3% rHin within the comfortable range. Application range −15 … +60 °C/0 … 95% rHin (no condensation).
Figure 7 shows the ventilation distribution technology with the location of the individual CO2 sensors.
A block diagram containing a description of the individual components and function blocks within the BACnet technology in the SH for HVAC control is shown in Figure 8.
2.3. The Design of the New Method for CO2 Prediction
The newly devised method for CO2 prediction from the temperature indoor and relative humidity indoor values measured by means of ANN SCG (multiple one-day measurements) was used for the location of an occupant (in rooms R104, R203 a R204) in SH with the highest possible accuracy. Block diagram of processing the quantities measured in SH for multiple one-day measurements in the period from 25 June 2018, to 28 June 2018, using the method devised for CO2 prediction by means of ANN SCG is shown in Figure 9.
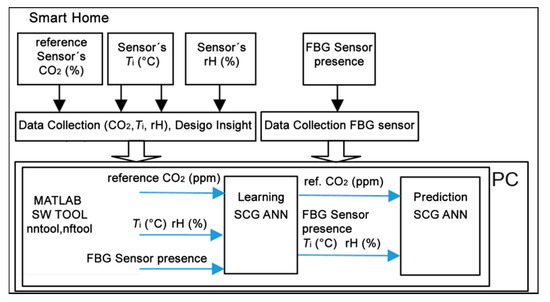
Figure 9.
Block diagram describing processing of the data measured by means of a scaled conjugate gradient artificial neural network (ANN SCG) within the method devised for CO2 prediction.
The measured values that were used in these experiments are the indoor CO2 concentration, indoor relative humidity and indoor temperature. The data were pre-processed to improve the efficiency of neural network training. That means that data were normalized so that all the values are between 0 and 1 (Figure 10, Step 1).

Figure 10.
Block scheme summarizing the experiment steps.
In Matlab, the function nftool (neural fitting) was used with neurons varying from 10 to 100 and the three methods previously mentioned. The data samples were divided into 3 sets: training (used to teach the network), validation and testing (provides an independent measure of the network training) (Figure 10, Step 2). After training the networks with data measured on 25 July for room 203, the 90 networks were used to predict data for the rest of the dates from the same room, as well as the two others. Since the learning date was different from the prediction dates, this was called “cross-validation”. In this step, the function used in Matlab was ‘nntool’ (Figure 10, Step 3). Once the results were ready, the next step was to calculate some parameters that would allow us to quantify the precision of the results, and, therefore, compare the prediction quality between the different ANN SCG (Figure 10, Step 4).
The three parameters we relied on for our experiments are as follows.
R (correlation coefficient) is a statistical measure that calculates the strength of the relationship between the relative movements of two variables and is calculated with the formula (4). The values range between −1 and 1. A value of exactly 1.0 means there is a perfect positive relationship between the two variables. For a positive increase in one variable, there is also a positive increase in the second variable. A value of −1.0 means there is a perfect negative relationship between the two variables. This shows that the variables move in opposite directions—for a positive increase in one variable, there is a decrease in the second variable. If the correlation is 0, there is no relationship between the two variables [28].
The MSE (mean squared error) parameter describes how close a regression line is to a set of points and is calculated with formula (5). It does this by taking the distances from the points to the regression line (these distances are the “errors”) and squaring them. The squaring is necessary to remove any negative signs. It also gives more weight to larger differences. It is called the mean squared error as you are finding the average of a set of errors [29]:
MAPE (average absolute percentage error) is a statistical measurement parameter of how accurate a forecast system is. It measures this accuracy as a percentage, and it can be calculated as the average absolute percent error for each time period minus actual values divided by actual values which are given by (6) [30]:
: reference value,
: predicted value,
n: total number of values,
: mean of x, y.
After calculating the MAPE, MSE, and R correlation parameters, we plot two figures. The first one has a reference and predicted CO2 over time (Figures 18, 20 and 22) and the second one is a Bland–Altmann plot (Figures 19, 21 and 23). The Bland–Altman technique allows us to make a comparison between two measurement methods of the same sample. It was established by J. Martin Bland and Douglas G. Altman. Essentially, it quantifies the difference between measurements using a graphical method. It consists of a scatterplot with the average and the difference represented on the X-axis and the Y-axis, respectively. The plot also has horizontal lines drawn at the mean difference and at the limits of agreement, which are defined as the mean difference plus and minus 1.96 times the standard deviation of the differences (Figure 10, Step 5). The final step is to compare the results and the plots, so as to decide which conditions and which methods are optimal for future predictions.
The procedure used to carry out the learning process in the neural networks is called optimization algorithms. In the following experiments, a ANN SCG type of mathematical algorithm was used to train the ANNs.
Scaled Conjugate Gradient Algorithm:
SCG is a supervised learning algorithm for feedforward neural networks and is a member of the class of conjugate gradient methods (CGMs). Let be a vector, N the sum of the number of weights and of the number of biases of the network, and E the error function we want to minimize. SCG differs from other conjugate gradient methods in two ways [31]:
Each iteration k of a CGM computes , where is a new conjugate direction, and is the size of the step in this direction. In fact, is a function of , the Hessian matrix of the error function, namely the matrix of the second derivatives. In contrast to other CGMs that avoid the complex computation of the Hessian and approximate with a time-consuming line search procedure, SCG makes the following simple approximation of the term , a key component of the computation of : [32] as the Hessian is not always positive, which prevents the algorithm from achieving good performance; SCG uses a scalar which is supposed to regulate the indefiniteness of the Hessian. This resembles the Levenberg–Marquardt method, and is performed by using the following equation (7) [33]:
and adjusting at each iteration.
The final step is to compare the results and the plots, so as to decide which conditions and which methods are optimal for future predictions [34].
2.4. The Signed–Regressor LMS Adaptive Filter
The signed–regressor LMS adaptive filter was used to filter the predicted course in order to determine the occupancy of the monitored areas more precisely (Figures 19, 21, 23, 26, 28 and 30).
2.4.1. The Conventional LMS Algorithm
The LMS algorithm is a linear adaptive filtering algorithm, which consists of two basic processes:
- (a)
- a filtering process, which involves computing the output y(n) of the linear filter in response to an input signal x(n) (8), generating an estimation error e(n) by comparing this output y(n) with the desired response d(n) (9),
- (b)
- an adaptive process (10), which involves the automatic adjustment of the parameters w(n+1) of the filter in accordance with the estimation error e(n).where w(n) is M tap—weight vector, w(n + 1) is M tap—weight vector update [35,36].
2.4.2. The Signed–Regressor LMS Algorithm
The signed–regressor algorithm is obtained from the conventional recursion (10) by replacing the tap-input vector x(n) with the vector sign(x(n)), where the sign function is applied to the vector x(n) on an element-by-element basis. The signed–regressor recursion is then [35]:
w(n+1) = w(n) + 2μe(n)sign(x(n))
3. Experiments and Results
3.1. Using Fiber Bragg Grating Sensor for Recognition of Number of Occupants in SH Room R104
The results of the experiments to detect the number of occupants in the monitored space of room R104 are described below. On 25 June 2018, we installed the individual sensors (FBG A and FBG B) on the staircase in room R104 (Figure 4). The actual measurement to unambiguously detect the number of occupants in the monitored space took place from 25 to 28 June 2018. The record of the continuous measurement conducted in the period from 25 to 28 June 2018, is shown in Figure 11. These are signals from the Bragg sensors where the individual peaks represent persons treading on a particular step. Blue shows the waveform of the FBG A sensor on the second step and red shows the signal from FBG B sensor on the third step.
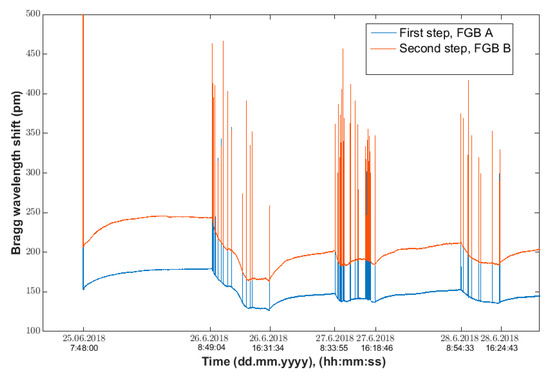
Figure 11.
The waveform of signals from FBG A and FBG B sensors during the 24-h measurement of recognition of the number occupants in room R104 in the period from 25 June 2018 (7:48:00), to 28 June 2018 (23:59:00).
To detect the number of occupants on the first floor, an algorithm was implemented in the MATLAB (Matrix Laboratory) computational software environment. The algorithm is based on the detection of peaks (treading on the step) from both FBG sensors. The time-corresponding peaks were compared over time, while the direction of the passage (up or down) was detected based on earlier treading on the first or second step. The number of occupants on the first floor was detected using a counter. The occupancy waveform of the first floor is shown in Figure 12.
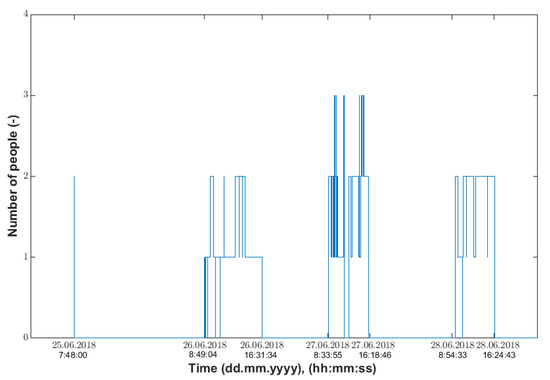
Figure 12.
First floor of the recognition of the number occupants obtained from the measurement conducted in the period from 25 June 2018 (7:48:00), to 28 June 2018 (23:59:00).
The number of occupants can be detected from the following Table 1:

Table 1.
Unambiguous determination of the number of occupants on the staircase in room R104 in the SH.
Discussion—Experiment 3.1:
On the basis of measuring the movement of occupants on the staircase in room R104 using FBG sensors in the period from 26 to 29 June 2019, it is possible to clearly identify the number of occupants (Figure 12) in the monitored SH space (Figure 4)—specifically in room R104 (Figure 5)—with an accuracy of 1 s. Within the initial testing of the experiment conducted, two persons walking up the stairs to the first floor of the SH were detected on 25 June 2018, when installing the FBG sensors in the SH (room R104) (Figure 12), (Table 1). On 26 June 2018, movement of one and two persons on the staircase from the ground floor to the first floor was detected during the day (Figure 12), (Table 1). On 27 June 2018, and 29 June 2018, movement of one, two and three persons was detected during the day. On 28 June the movement of one and two persons was detected during the day (Figure 12), (Table 1). The drawback of this method of using the FBG sensor to detect the number of occupants in the monitored space is the lack of information on the occupancy of the monitored space of R104 in the SH. This drawback has been eliminated by adding CO2 sensors to rooms R104, R203 and R204 in experiment 2, which is described below.
3.2. Use of CO2 Sensors for Monitoring SH Space Occupancy
CO2 sensors (R104 (BT12.09), R203 (BT12.10), R204 (BT12.11)) can be used to detect occupancy of the monitored spaces (rooms R104, R203, R204) in the SH (Figure 5 and Figure 6); these sensors are used to control the quality of the indoor environment in these rooms using BACnet technology in the SH (Figure 7). To control HVAC in SH (Figure 7), other CO2 sensors which provide “measurement at the fresh outdoor air inlet into QPA 2062 SH (BT 12.01) were used; measurement at the recirculation air inlet from SH spaces into the QPM 2162 heat recovery unit (BT 12.02); measurement at the recirculation air inlet from SH spaces into the QPA 2062 heat recovery unit (BT 12.03); measurement in the QFA 2060 heat recovery unit (BT 12.04); measurement at the recirculation and fresh air outlet from the heat recovery unit into the QFM 2160 SH (BT 12.05); measurement at the exhaust air inlet into the QFM 2160 recuperation unit (BT 12.06); measurement at the exhaust air outlet from the QPA 2062 recuperation unit (BT 12.07); measurement at the recirculation air inlet from SH spaces into the QPM 2162 heat recovery unit (BT 12.08)”.
Discussion—Experiment 3.2:
Using the information from the FBG sensor (Figure 13), it is possible to unambiguously detect the number of occupants present in the monitored space. Based on the measured values (CO2 concentration), it is possible to detect the occupancy of the monitored SH spaces, the arrival of a person into the monitored room or the exit from the monitored space, or the length of stay in the monitored space (Figure 14, Figure 15 and Figure 16). The aforementioned procedure enables the unambiguous determination of the occupancy rate of the monitored SH spaces, indirectly by measuring common non-electrical quantities (CO2) within the operational–technical function control in the SH.
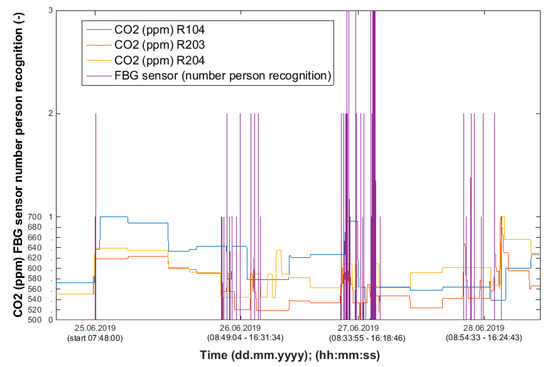
Figure 13.
Waveforms of the CO2 concentration values measured in SH rooms R104 (BT 12.09), R203 (BT 12.10), R204 (BT 12.11) in order to detect the occupancy of the monitored spaces with the representation of the recognition of the number of occupants in room R104 using the FBG sensor.
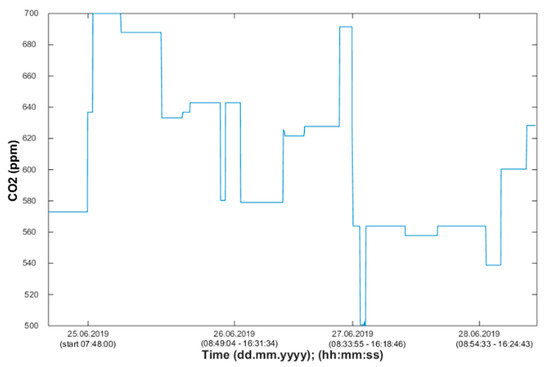
Figure 14.
Waveforms of the CO2 concentration values measured in SH room R104 (BT 12.09).
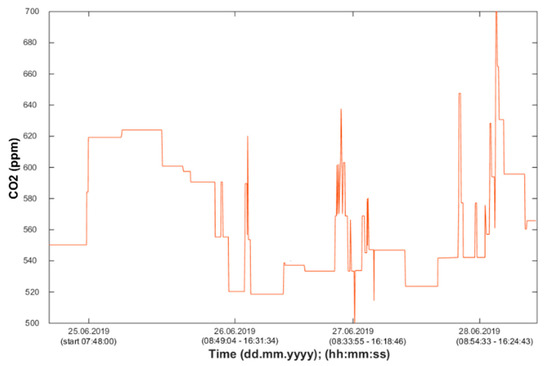
Figure 15.
Waveforms of the CO2 concentration values measured in SH room R203 (BT 12.10).
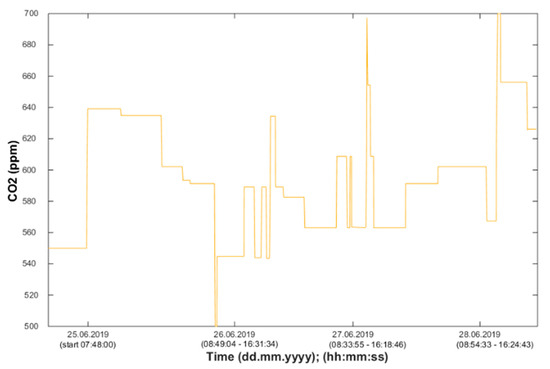
Figure 16.
Waveforms of the CO2 concentration values measured in SH room R204 (BT 12.11).
However, if the building is of an administrative type, the acquisition of CO2 sensors for dozens of rooms is a major investment. In market research, we ascertained that CO2 sensors are two to three times (in some cases, greater) more expensive than temperature and humidity sensors, which are, moreover, a common part of individual rooms in administrative buildings in the Czech Republic.
Due to the higher costs of acquiring CO2 sensors, we proposed the possibility of lowering the initial investment costs for larger administrative buildings by providing information about the occupancy of the individual rooms within the newly devised method of CO2 prediction. The mathematical method of ANN SCG was used to predict the waveform of CO2 concentration using the values measured from indoor temperature (Tin) and indoor relative humidity (rHin) sensors. The experiments performed within the newly devised method are presented in the following text.
3.3. Experimental Verification of the Method with the Devised Artificial Neural Network (ANN) Scaled Conjugate Gradient (SCG)
The conditions of experiments 3.3a and 3.3b were as follows. The experiments were performed for the waveforms of temperature (Tin), relative humidity (rHin) and CO2 concentration measured on 26 June 2018, 27 June 2018, and 28 June 2018, (step 1) for rooms R104, R203 and R204 (Figure 17).
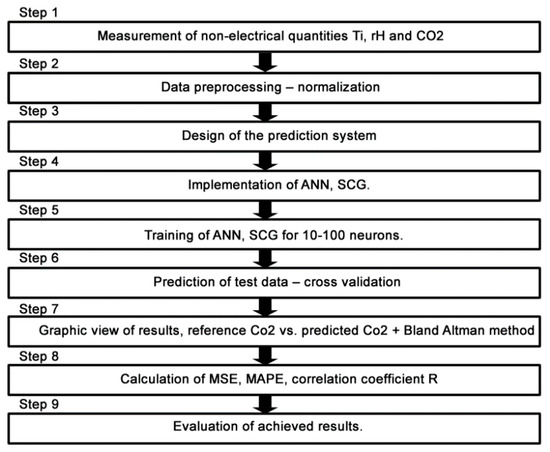
Figure 17.
The waveform of the experiments performed on 26 June 2018, 27 June 2018, and 28 June 2018 for rooms R104, R203 and R204.
Furthermore, the measured data were pre-processed (step 2) (Figure 17). The design of the prediction system structure (step 3), the implementation (step 4) and ANN SCG training (step 5) for CO2 prediction using two input values of temperature (Tin) and relative humidity (rHin) were carried out. The ANN SCG structure designed (Figure 18) for experiment 3.3a was trained (step 5) for the temperature (Tin), relative humidity (rHin) and CO2 concentration values measured in room R203. The actual CO2 prediction (step 6) was implemented for the data measured in rooms R104, R203 and R204. To increase the accuracy of the newly devised method, an additional quantity from the FBG sensor containing the number of occupants in the monitored space of R104 was added to the original two input quantities. The ANN SCG structure designed for experiment 3.3b for CO2 prediction using three input quantities—temperature (Tin), relative humidity (rHin) and the number of occupants (FBG sensor). The procedure for performing the experiments was the same as that described in Figure 17.
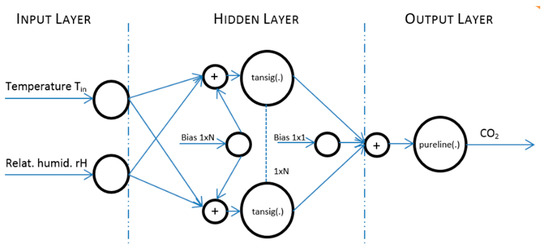
Figure 18.
The architecture of the designed ANN SCG on test data measured in R203 from 25 June 2018 for two inputs Tin and rHin without and FBG sensor for person presence measuring (PPM).
Experiment 3.3a:
Input values, Tin and rHin, to ANN SCG for prediction of CO2 in rooms R203, R204, and R104 (Figure 18). Prediction of CO2 in rooms R203, R204, R104 for the dates 26, 27 and 28 June 2018 with inputs Tin and rHin, using learned ANN SCG (Figure 18) from 25 June 2018. Table 2, Table 3 and Table 4 show R, MSE and MAPE parameter values, followed by plots of reference and predicted CO2, as well as Bland–Altmann plots in rooms 203 (Figure 19 and Figure 20), 204 (Figure 21 and Figure 22) and 104 (Figure 23 and Figure 24).

Table 2.
Learned ANN SCG from 25 June 2018 in R203 (with Tin and rHin) and prediction with cross-validation for 26 June 2018 in R203 (with Tin and rHin), 27 June 2018 in R203 (with Tin and rHin), 28 June 2018 in R203 (with Tin and rHin).

Table 3.
Learned ANN SCG from 25 June 2018 in R203 (with Tin and rHin) and prediction with cross-validation for 26 June 2018 in R204 (with Tin and rHin), 27 June 2018 in R204 (with Tin and rHin), and 28 June 2018 in R204 (with Tin and rHin).

Table 4.
Learned ANN SCG from 25 June 2018 in R203 (with Tin and rHin) and prediction with cross-validation for 26 June 2018 in R104 (with Tin and rHin), 27 June 2018 in R104 (with Tin and rHin), and 28 June 2018 in R104 (with Tin and rHin).
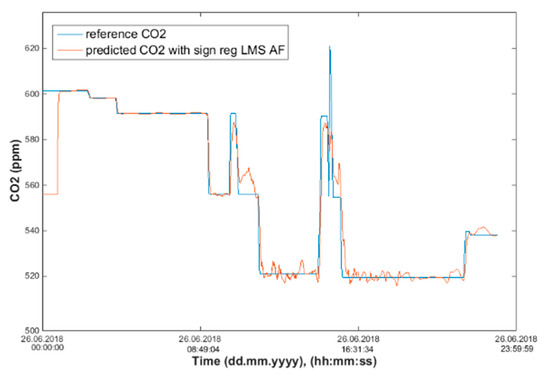
Figure 19.
Comparison of the reference CO2 concentration waveform and predicted CO2 waveforms (SRLMS AF) from 26 June 2018 in R203 with an ANN with 100 neurons and SCG method trained with data from 25 June 2018 in R203.
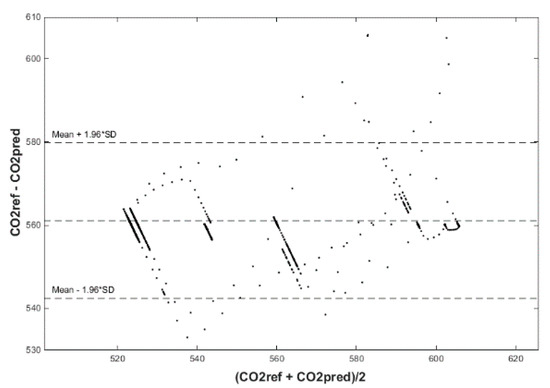
Figure 20.
Bland–Altman plot for the reference and predicted CO2 waveforms (SRLMS AF) from 26 June 2018 in R203 with an ANN with 100 neurons and SCG method trained with data from 25 June 2018 in R203.
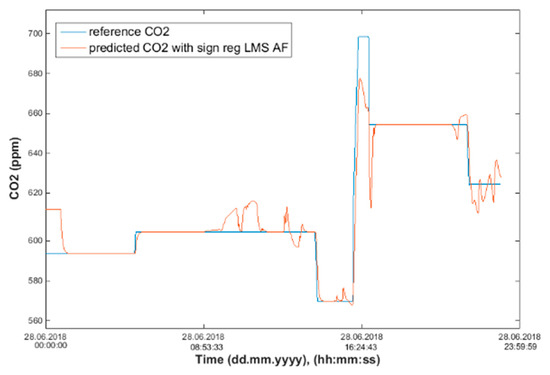
Figure 21.
Comparison of the reference and predicted CO2 waveforms (SRLMS AF) from 28 June 2018 in R204 with an ANN with 40 neurons and SCG method trained with data from 25 June 2018 in R203.
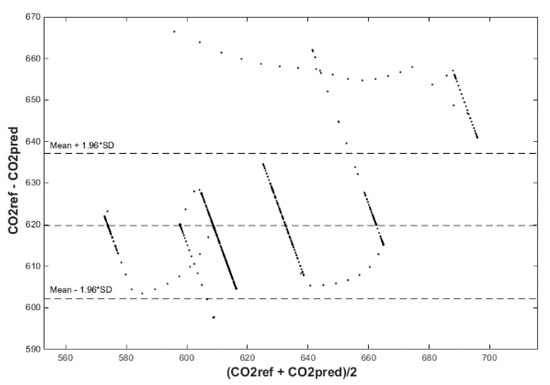
Figure 22.
Bland–Altman plot for the reference and predicted CO2 waveforms (SRLMS AF) from 28 June 2018 in R204 with an ANN with 40 neurons and SCG method trained with data from 25 June 2018 in R203.
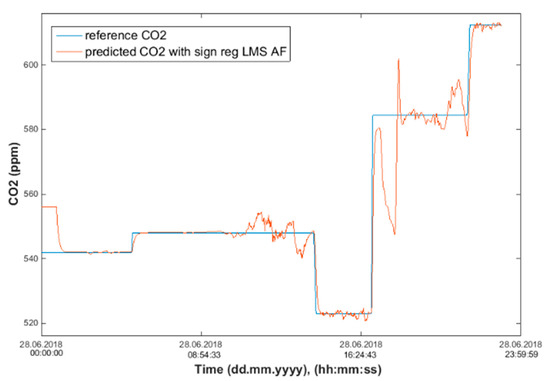
Figure 23.
Comparison of the reference and predicted CO2 waveforms (SRLMS AF) from 28 June 2018 in R104 with an ANN with 60 neurons and SCG method trained with data from 25 June 2018 in R203.
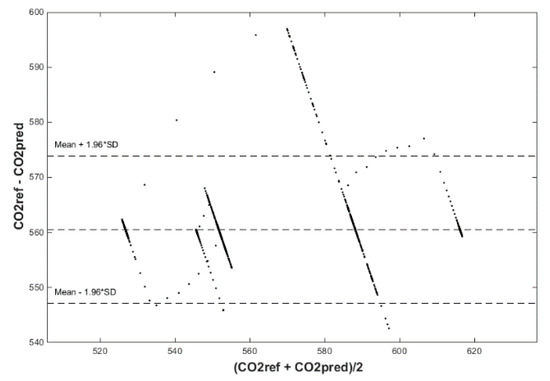
Figure 24.
Bland–Altman plot for the reference and predicted CO2 waveforms (SRLMS AF) from 28 June 2018 in R104 with an ANN with 60 neurons and SCG method trained with data from 25 June 2018 in R203.
Experiment 3b:
Our next experiment was performed with input values of Tin and rHin and presence values from the FBG sensor input into ANN SCG for the prediction of CO2 in rooms R203, R204, R104 (Figure 25). Prediction of CO2 in rooms R203, R204, R104 for the dates 26, 27 and 28 June 2018 with input values from sensors Tin, rHin and FBG using learned ANN SCG (Figure 25) from 25 June 2018. Table 5, Table 6 and Table 7 show R, MSE and MAPE parameter values, followed by plots of reference and predicted CO2 as well as Bland–Altmann plots in rooms 203 (Figure 26 and Figure 27), 204 (Figure 28 and Figure 29) and 104 (Figure 30 and Figure 31).
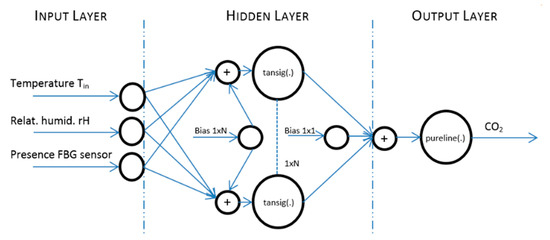
Figure 25.
The architecture of designed ANN SCG on test data measured in R203 from 25 June 2018 for three inputs Tin, rHin and those of an FBG sensor for PPM.

Table 5.
Learned ANN SCG from 25 June 2018 in R203 (with Tin, rHin and an FBG sensor for PPM) and prediction with cross-validation for 26 June 2018 in R203 (with Tin, rHin and an FBG sensor for PPM), 27 June 2018 in R203 (with Tin, rHin and an FBG sensor for PPM), 28 June 2018 in R203 (with Tin, rHin and an FBG sensor for PPM).

Table 6.
Learned ANN SCG from 25 June 2018 in R203 (with Tin, rHin and an FBG sensor for PPM) and prediction with cross-validation for 26 June 2018 in R204 (with Tin, rHin and an FBG sensor for PPM), 27 June 2018 in R204 (with Tin, rHin and an FBG sensor for PPM), 28 June 2018 in R204 (with Tin, rHin and an FBG sensor for PPM).

Table 7.
Learned ANN SCG from 25 June 2018 in R203 (with Tin, rHin and an FBG sensor for PPM) and prediction with cross-validation for 26 June 2018 in R104 (with Tin, rHin and an FBG sensor for PPM), 27 June 2018 in R104 (with Tin, rHin and an FBG sensor for PPM), 28 June 2018 in R104 (with Tin, rHin and an FBG sensor for PPM).
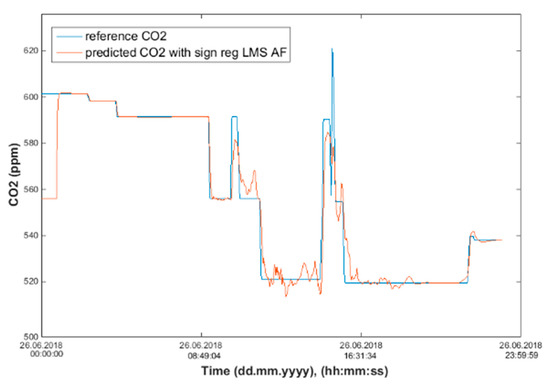
Figure 26.
Comparison of the reference and predicted CO2 waveforms (SRLMS AF) from 26 June 2018 in R203 with an ANN with 60 neurons and SCG method trained with data from 25 June 2018 in R203.
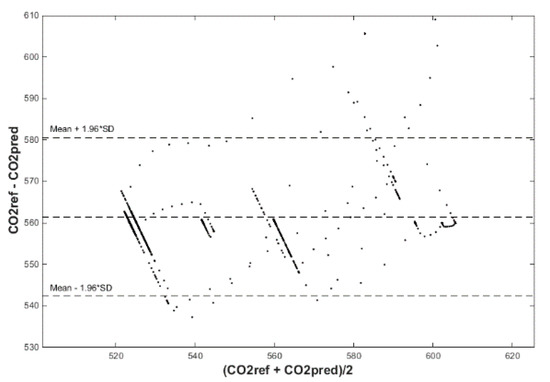
Figure 27.
Bland–Altman for the reference and predicted CO2 waveforms (SRLMS AF) from 26 June 2018 in R203 with an ANN with 60 neurons and SCG method trained with data from 25 June 2018 in R203.
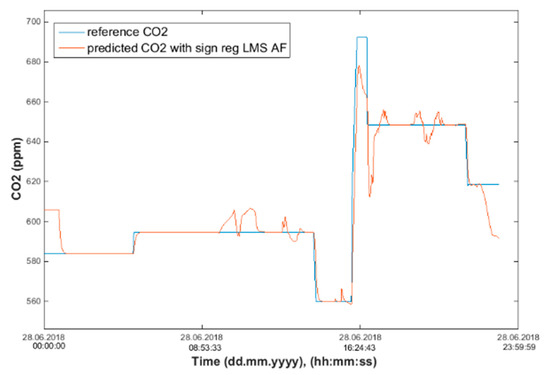
Figure 28.
Comparison of the reference and predicted CO2 waveforms (SRLMS AF) from 28 June 2018 in R204 with an ANN with 90 neurons and SCG method trained with data from 25 June 2018 in R203.
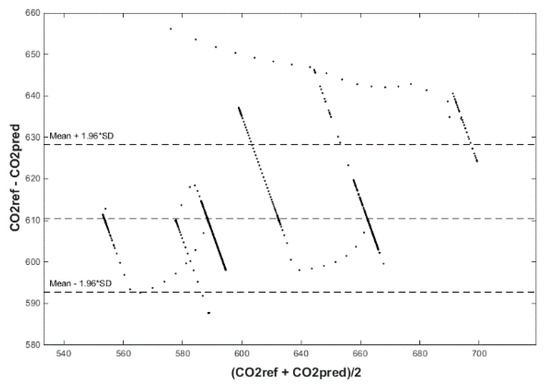
Figure 29.
Bland–Altman for the reference and predicted CO2 waveforms (SRLMS AF) from 28 June 2018 in R204 with an ANN with 90 neurons and SCG method trained with data from 25 June 2018 in R203.
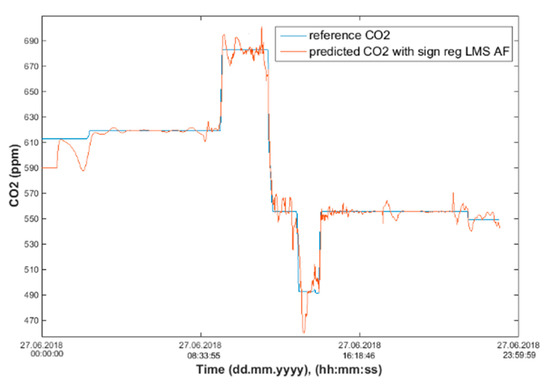
Figure 30.
Comparison of the reference and predicted CO2 waveforms (SRLMS AF) from 27 June 2018 in R104 with an ANN with 60 neurons and SCG method trained with data from 25 June 2018 in R203.
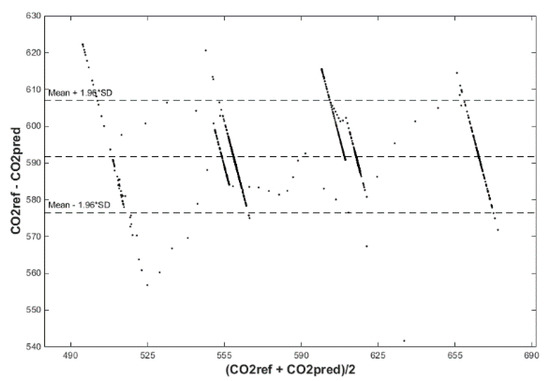
Figure 31.
Bland–Altman for the reference and predicted CO2 waveforms (SRLMS AF) from 27 June 2018 in R104 with an ANN with 60 neurons and SCG method trained with data from 25 June 2018 in R203.
Discussion—Experiments 3.3a and 3.3b:
The best result within the designed three-day (26 June to 28 June 2018) experiments for the learned ANN SCG from 25 June 2018, in R203 (with Tin and rHin) and the prediction with cross-validation for 26 June 2018, in R203, R204, R104 (with Tin and rHin), 27 June 2018, in R203, R204, R104 (with Tin and rHin), 28 June 2018, in R203, R204, R104 (with Tin and rHin), without using the FBG sensor measurements, was detected for ANN SCG in room R203 (Table 2) with the following values: R = 91.6 (%), MSE = 0.47 × 10⁻², MAPE = 25.59 × 10⁻², for 100 ANN SCG neurons (Figure 19 and Figure 20). This is because ANN SCG learned for the data measured on 25 June 2018, in room R203 was used for CO2 prediction. By contrast, the worst calculated result was detected for ANN SCG in room R104 (Table 4), where R = 21.88 (%), MSE = 1.21 × 10⁻² and MAPE = 21.47 × 10⁻² for a 10 ANN SCG neurons. This is because room R104 was the furthest away from room R203 for which ANN SCG was learned.
As for the CO2 prediction, the best result within the designed three-day experiments using the FBG sensor for learned ANN SCG from 25 June 2018, in R203 (with Tin, rHin and the FBG sensor for PPM) and prediction with cross-validation for 26 June 2018, in R203, R204, R104 (with Tin, rHin and the FBG sensor for PPM), 27 June 2018, in R203, R204, R104 (with Tin, rHin and the FBG sensor for PPM), 28 June 2018, in R203, R204, R104 (with Tin, rHin and the FBG sensor for PPM) was detected for ANN SCG—number of neurons = 60 in room R203 (Figure 26 and Figure 27), (Table 5), where, on 26 June 2018, R = 92.81 (%), MSE = 0.40 × 10⁻², and MAPE = 21.55 × 10⁻². This is because ANN SCG learned for the data measured on 25 June 2018, in room R203 was used for CO2 prediction. By contrast, the worst calculated result was detected for ANN SCG in room R204 (Table 6), where R = 21.45 (%), MSE = 1.11 × 10⁻², and MAPE = 20.39 × 10⁻², for 10 ANN SCG neurons. This is because there was no FBG sensor in room R204 to detect the presence of persons.
Based on the graphs illustrated in Figure 32a–c and Figure 33a–c, it can be stated that one universal learned ANN SCG cannot be used for the most accurate calculation of CO2 prediction for all SH spaces. In our experiments, ANN SCG was learned for the data measured in room R203 on 25 June 2018. The calculated values of the verification parameters measured (R coefficient, MSE and MAPE) in Table 2 and Table 5 (Figure 19, Figure 20, Figure 26 and Figure 27) indicate that, in order to achieve the greatest accuracy of CO2 prediction, it is necessary that ANN SCG is always learned for a specific room, for a specific monitored space in the SH. The expectations related to the use of the FBG sensor to increase the accuracy of CO2 prediction by means of ANN SCG were not fulfilled in the above-mentioned experiments (Figure 32 and Figure 33). However, the use of the FBG sensor in the SH is very useful from the point of view of a robust and stable solution for recognizing the number of occupants in the monitored SH spaces or intelligent administrative buildings. The mathematical method with ANN SCG is not the most suitable for the devised CO2 prediction method. For greater accuracy, it is necessary to implement filter algorithms [28] to remove additive noise from the predicted CO2 concentration waveform. Based on the results achieved and described above, further experiments on CO2 prediction will be conducted using more precise mathematical methods [29,30,31,32,33,34,37,38,39] within the IoT platform [40].
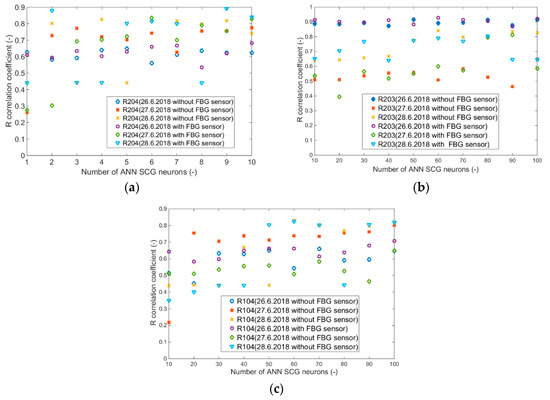
Figure 32.
R-correlation coefficients for (a) room R203 with and without FBG, (b) room R204 with and without FBG, (c) room R104 with and without FBG.
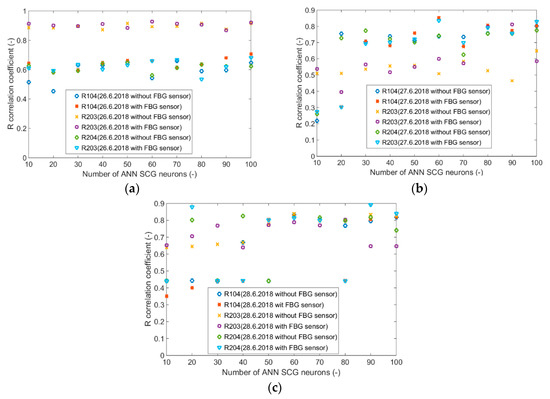
Figure 33.
R-correlation coefficients for rooms R104, R203, R204 with and without FBG (a) 26 June 2018, (b) 27 June 2018, (c) 28 June 2018.
4. Conclusions
In order to detect the occupancy of the individual SH spaces by indirect methods (without using cameras), common operational and technical sensors were used in the experiments conducted to measure the indoor temperature, the indoor relative humidity and the indoor CO2 concentration within the BACnet technology for HVAC control in the SH.
Based on the experiments conducted in rooms R104, R203 and R204, it is possible to unambiguously detect the suitability of the sensors used for measuring the CO2 concentration in order to detect the occupancy and the length of stay in the monitored SH space. Moreover, the CO2 sensors used in the technology that were exclusively for HVAC control in the SH can be used to detect the occupancy and the length of stay in the monitored spaces, which will make the required information more accurate.
From the perspective of cost reduction, a method for predicting the CO2 concentration waveform by means of ANN SCG from the indoor temperature and indoor relative humidity values measured were devised and verified for the space location of an occupant (in rooms R104, R203, and R204) in the SH with the highest possible accuracy. The ANN SCG mathematical method used does not achieve such accuracy compared to the methods used in [28,29,30] and [34,37,38,39,40]. For selected experiments, nevertheless, the correlation coefficient in this article was greater than 90%. An increase in the correlation coefficient value can be achieved by using filter methods for suppressing additive noise from the predicted CO2 concentration waveform [28]. In the experiments conducted, we verified that, for each monitored space in the SH, the ANN SCG should be learned so that the CO2 prediction was as accurate as possible.
The FBG sensor was used to unambiguously detect the number of occupants in the monitored space of room R104. The experiments confirmed the suitability of using FBG sensors for reasons of robustness, accuracy and high reliability in the detection of the number of occupants moving in the monitored SH or Intelligent Building space without the need to deploy cameras. The experiments did not confirm the assumption that the input value of the presence of occupants added from the FBG sensor to the ANN SCG will make the prediction of the CO2 concentration using the ANN SCG method more accurate.
The application of FBG sensors in a passive SH is described. These sensors are electrically passive, while allowing the evaluation of multiple quantities at the same time, and with suitable encapsulation of FBG, the sensor is immune to EMI (electromagnetic interference). Due to its small size and weight, implementation in an SH is both straightforward and cost-effective. Using a spectral approach, tens of FBG sensors can be evaluated using a single evaluation unit [21].
In the next work, the authors will focus on verifying the practical implementation of the method devised for CO2 prediction in an SH for monitoring the occupancy of the SH within the IoT platform [40].
Author Contributions
J.V., methodology; J.V., J.N., M.F. software; J.V., J.N., M.F. validation; J.V., formal analysis; J.V. investigation; J.V., J.N., M.F. resources; J.V., J.N., M.F., data creation; J.V., J.N., M.F. writing—original draft preparation; J.V., J.N., M.F. writing—review and editing; J.V., visualization; J.V., supervision; R.M., project administration; and R.M., funding acquisition. All authors have read and agreed to the published version of the manuscript.
Funding
This work was supported by the European Regional Development Fund in the Research Centre of Advanced Mechatronic Systems project, project number CZ.02.1.01/0.0/0.0/16_019/0000867 within the Operational Programme Research, Development and Education.
Acknowledgments
This work was supported by the Student Grant System of VSB Technical University of Ostrava, grant number SP2019/118. This work was supported by the European Regional Development Fund in the Research Centre of Advanced Mechatronic Systems project, project number CZ.02.1.01/0.0/0.0/16_019/0000867 within the Operational Programme Research, Development and Education.
Conflicts of Interest
The authors declare no conflict of interest.
Abbreviations
The following abbreviations are used in this manuscript:
| (ANN) | artificial neural network |
| (FBG) | fiber Bragg grating |
| (SCG) | scaled conjugate gradient |
| (LMS) | least mean squares |
| (SRLMS) | signed—regressor least mean squares algorithm |
| (AF) | adaptive filter |
| (SH) | smart home |
| (SW) | software |
| (CO2) | carbon dioxide |
| (rHin) | relative humidity indoor |
| (Tin) | temperature indoor |
| R104 | room 104 in the smart home |
| R203 | room 203 in the smart home |
| R204 | room 204 in the smart home |
| (HVAC) | heating, ventilation and air conditioning |
| (IoT) | internet of things |
| (MSE) | mean squared error |
| (MAPE) | average absolute percentage error |
| (R) | correlation coefficient |
| (BACnet) | data communication protocol for building automation and control networks |
| (PPM) | person presence measuring |
References
- Azghandi, M.V.; Nikolaidis, I.; Stroulia, E. Multi–occupant movement tracking in smart home environments. In Proceedings of the International Conference on Smart Homes and Health Telematics, Geneva, Switzerland, 10–12 June 2015; Volume 9102, pp. 319–324. [Google Scholar]
- Benmansour, A.; Bouchachia, A.; Feham, M. Multioccupant activity recognition in pervasive smart home environments. ACM Comput. Surv. 2015, 48, 34. [Google Scholar] [CrossRef]
- Braun, A.; Majewski, M.; Wichert, R.; Kuijper, A. Investigating low-cost wireless occupancy sensors for beds. In Proceedings of the 2016 International Conference on Distributed, Ambient, and Pervasive Interactions, Toronto, ON, Canada, 17–22 July 2016; Volume 9749, pp. 26–34. [Google Scholar]
- Chan, Z.Y.; Shum, P. Smart Office—A Voice-Controlled Workplace for Everyone; Nanyang Technological University: Singapore, 2018. [Google Scholar]
- Chen, Z.; Wang, Y.; Liu, H. Unobtrusive sensor-based occupancy facing direction detection and tracking using advanced machine learning algorithms. IEEE Sens. J. 2018, 18, 6360–6368. [Google Scholar] [CrossRef]
- Khan, M.A.A.H.; Kukkapalli, R.; Waradpande, P.; Kulandaivel, S.; Banerjee, N.; Roy, N.; Robucci, R. RAM: Radar-Based Activity Monitor. In Proceedings of the IEEE INFOCOM 2016—The 35th Annual IEEE International Conference on Computer Communications, San Francisco, CA, USA, 10–14 April 2016. [Google Scholar]
- Lee, H.; Wu, C.; Aghajan, H. Vision-based user-centric light control for smart environments. Pervasive Mob. Comput. 2011, 7, 223–240. [Google Scholar] [CrossRef]
- Mokhtari, G.; Zhang, Q.; Nourbakhsh, G.; Ball, S.; Karunanithi, M. BLUESOUND: A New Resident Identification Sensor—Using Ultrasound Array and BLE Technology for Smart Home Platform. IEEE Sens. J. 2017, 17, 1503–1512. [Google Scholar] [CrossRef]
- Yan, D.; Jin, Y.; Sun, H.; Dong, B.; Ye, Z.; Li, Z.; Yuan, Y. Household appliance recognition through a Bayes classification model. Sustain. Cities Soc. 2019, 46, 101393. [Google Scholar] [CrossRef]
- Yang, J.; Zou, H.; Jiang, H.; Xie, L. Device-Free Occupant Activity Sensing Using WiFi-Enabled IoT Devices for Smart Homes. IEEE Internet Things J. 2018, 5, 3991–4002. [Google Scholar] [CrossRef]
- Feng, X.; Yan, D.; Hong, T. Simulation of occupancy in buildings. Energy Build. 2015, 87, 348–359. [Google Scholar] [CrossRef]
- Yin, J.; Fang, M.; Mokhtari, G.; Zhang, Q. Multi-resident location tracking in smart home through non-wearable unobtrusive sensors. In Proceedings of the 14th International Conference on Smart Homes and Health Telematics (ICOST 2016), Wuhan, China, 25–27 May 2016; Volume 9677, pp. 3–13. [Google Scholar]
- Hong, T.; Sun, H.; Chen, Y.; Taylor-Lange, S.C.; Yan, D. An occupant behavior modeling tool for co-simulation. Energy Build. 2016, 117, 272–281. [Google Scholar] [CrossRef]
- Vanus, J.; Martinek, R.; Bilik, P.; Zidek, J.; Skotnicova, I. Evaluation of thermal comfort of the internal environment in smart home using objective and subjective factors. In Proceedings of the 17th International Scientific Conference on Electric Power Engineering, Prague, Czech Republic, 16–18 May 2016. [Google Scholar]
- Polednik, J.; Pavlik, J.; Skotnicova, I. Research and Innovation Centre. Available online: http://www.vyzkumneinovacnicentrum.cz/wp-content/uploads/2014/10/Vyzkumne-inovacni-centrum.pdf (accessed on 15 August 2019).
- Hill, K.O.; Malo, B.; Bilodeau, F.; Johnson, D.C.; Albert, J. Bragg gratings fabricated in monomode photosensitive optical fiber by UV exposure through a phase mask. Appl. Phys. Lett. 1993, 62, 1035–1037. [Google Scholar] [CrossRef]
- Othonos, A. Fiber bragg gratings. Rev. Sci. Instrum. 1997, 68, 4309–4341. [Google Scholar] [CrossRef]
- Kunzler, M.; Udd, E.; Taylor, T.; Kunzler, W. Traffic Monitoring Using Fiber Optic Grating Sensors on the I-84 Freeway & Future Uses in WIM. In Proceedings of the Sixth Pacific Northwest Fiber Optic Sensor Workshop, Troutdale, OR, USA, 14 May 2003; Volume 5278, pp. 122–127. [Google Scholar]
- Wei, C.-L.; Lai, C.-C.; Liu, S.-Y.; Chung, W.H.; Ho, T.K.; Tam, H.-Y.; Ho, S.L.; McCusker, A.; Kam, J.; Lee, K.Y. A fiber Bragg grating sensor system for train axle counting. IEEE Sens. J. 2010, 10, 1905–1912. [Google Scholar]
- Moorman, W.; Taerwe, L.; De Waele, W.; Degrieck, J.; Himpe, J. Measuring ground anchor forces of a quay wall with Bragg sensors. J. Struct. Eng. 2005, 131, 322–328. [Google Scholar] [CrossRef]
- Fajkus, M.; Nedoma, J.; Martinek, R.; Vasinek, V.; Nazeran, H.; Siska, P. A non-invasive multichannel hybrid fiber-optic sensor system for vital sign monitoring. Sensors 2017, 17, 111. [Google Scholar] [CrossRef] [PubMed]
- Fajkus, M.; Nedoma, J.; Siska, P.; Bednarek, L.; Zabka, S.; Vasinek, V. Perimeter system based on a combination of a Mach-Zehnder interferometer and the bragg gratings. Adv. Electr. Electron. Eng. 2016, 14, 318–324. [Google Scholar] [CrossRef]
- Fajkus, M.; Navruz, I.; Kepak, S.; Davidson, A.; Siska, P.; Cubik, J.; Vasinek, V. Capacity of wavelength and time division multiplexing for quasi-distributed measurement using fiber bragg gratings. Adv. Electr. Electron. Eng. 2015, 13, 575–582. [Google Scholar] [CrossRef]
- Nedoma, J.; Fajkus, M.; Bednarek, L.; Frnda, J.; Zavadil, J.; Vasinek, V. Encapsulation of FBG sensor into the PDMS and its effect on spectral and temperature characteristics. Adv. Electr. Electron. Eng. 2016, 14, 460–466. [Google Scholar] [CrossRef]
- Zhang, Y.; Chang, X.; Zhang, X.; He, X. The Packaging Technology Study on Smart Composite Structure Based on the Embedded FBG Sensor. In IOP Conference Series: Materials Science and Engineering; IOP Publishing Ltd.: Bristol, UK, 2018; Volume 322. [Google Scholar]
- Anoshkin, A.N.; Shipunov, G.S.; Voronkov, A.A.; Shardakov, I.N. Effect of temperature on the spectrum of fiber Bragg grating sensors embedded in polymer composite. In AIP Conference Proceedings; AIP Publishing: Tomsk, Russia, 2017; Volume 1909. [Google Scholar]
- Wang, T.; He, D.; Yang, F.; Wang, Y. Fiber Bragg grating sensors for strain monitoring of steelwork. In Proceedings of the 2009 International Conference on Optical Instruments and Technology, Shanghai, China, 19–22 October 2009; Volume 7508. [Google Scholar]
- Vanus, J.; Belesova, J.; Martinek, R.; Nedoma, J.; Fajkus, M.; Bilik, P.; Zidek, J. Monitoring of the daily living activities in smart home care. Human Cent. Comput. Inf. Sci. 2017, 7, 30. [Google Scholar] [CrossRef]
- Vanus, J.; Kubicek, J.; Gorjani, O.M.; Koziorek, J. Using the IBM SPSS SW Tool with Wavelet Transformation for CO2 Prediction within IoT in Smart Home Care. Sensors 2019, 19, 1407. [Google Scholar] [CrossRef]
- Vanus, J.; Machac, J.; Martinek, R.; Bilik, P.; Zidek, J.; Nedoma, J.; Fajkus, M. The design of an indirect method for the human presence monitoring in the intelligent building. Human Cent. Comput. Inf. Sci. 2018, 8, 28. [Google Scholar] [CrossRef]
- Moller, M.F. A scaled conjugate gradient algorithm for fast supervised learning. Neural Netw. 1993, 6, 525–533. [Google Scholar] [CrossRef]
- Steihaug, T. The conjugate gradient method and trust regions in large scale optimization. SIAM J. Numer. Anal. 1983, 20, 626–637. [Google Scholar] [CrossRef]
- Branch, M.A.; Coleman, T.F.; Li, Y. Subspace, interior, and conjugate gradient method for large-scale bound-constrained minimization problems. SIAM J. Sci. Comput. 1999, 21, 1–23. [Google Scholar] [CrossRef]
- Vanus, J.; Martinek, R.; Bilik, P.; Zidek, J.; Dohnalek, P.; Gajdos, P. New method for accurate prediction of CO2 in the Smart Home. In Proceedings of the 2016 IEEE International Instrumentation and Measurement Technology Conference Proceedings, Taipei, Taiwan, 23–26 May 2016. [Google Scholar]
- Farhang-Boroujeny, B. Adaptive Filters: Theory and Applications; John Wiley & Sons: Chichester, UK, 1998. [Google Scholar]
- Poularikas, A.D.; Ramadan, Z.M. Adaptive Filtering Primer with MATLAB; CRC Press: Boca Raton, FL, USA, 2017. [Google Scholar]
- Vanus, J.; Martinek, R.; Nedoma, J.; Fajkus, M.; Cvejn, D.; Valicek, P.; Novak, T. Utilization of the LMS Algorithm to Filter the Predicted Course by Means of Neural Networks for Monitoring the Occupancy of Rooms in an Intelligent Administrative Building. IFAC-PapersOnLine 2018, 51, 378–383. [Google Scholar] [CrossRef]
- Vanus, J.; Martinek, R.; Nedoma, J.; Fajkus, M.; Valicek, P.; Novak, T. Utilization of Interoperability between the BACnet and KNX Technologies for Monitoring of Operational-Technical Functions in Intelligent Buildings by Means of the PI System SW Tool. IFAC-PapersOnLine 2018, 51, 372–377. [Google Scholar] [CrossRef]
- Vanus, J.; Sykora, J.; Martinek, R.; Bilik, P.; Koval, L.; Zidek, J.; Fajkus, M.; Nedoma, J. Use of the software PI system within the concept of smart cities. In Proceedings of the 9th International Scientific Symposium on Electrical Power Engineering (ELEKTROENERGETIKA 2017), Stará Lesná, Slovakia, 12–14 September 2017. [Google Scholar]
- Petnik, J.; Vanus, J. Design of Smart Home Implementation within IoT with Natural Language Interface. IFAC-PapersOnLine 2018, 51, 174–179. [Google Scholar] [CrossRef]
© 2020 by the authors. Licensee MDPI, Basel, Switzerland. This article is an open access article distributed under the terms and conditions of the Creative Commons Attribution (CC BY) license (http://creativecommons.org/licenses/by/4.0/).
