Author Contributions
Conceptualization, K.N.; methodology, K.N., Z.G., S.A.; software, K.N., Z.G.; validation, K.N., Z.G., S.A.; formal analysis, K.N.; investigation, K.N., Z.G., P.D.; resources, K.N., Z.G.; data curation, K.N., Z.G.; writing—original draft preparation, K.N., Z.G., P.D.; writing—review and editing, K.N., P.D.; visualization, K.N., Z.G., P.D.; supervision, P.D., Z.G. and K.N.,; project administration, K.N.; funding acquisition, K.N. and Z.G. All authors have read and agreed to the published version of the manuscript.
Figure 1.
Geometrical deviation measurement methods: (a) horizontal on a set of rigid vee-block supports, (b) vertical using precision measuring machines (courtesy of ADCOLE).
Figure 1.
Geometrical deviation measurement methods: (a) horizontal on a set of rigid vee-block supports, (b) vertical using precision measuring machines (courtesy of ADCOLE).
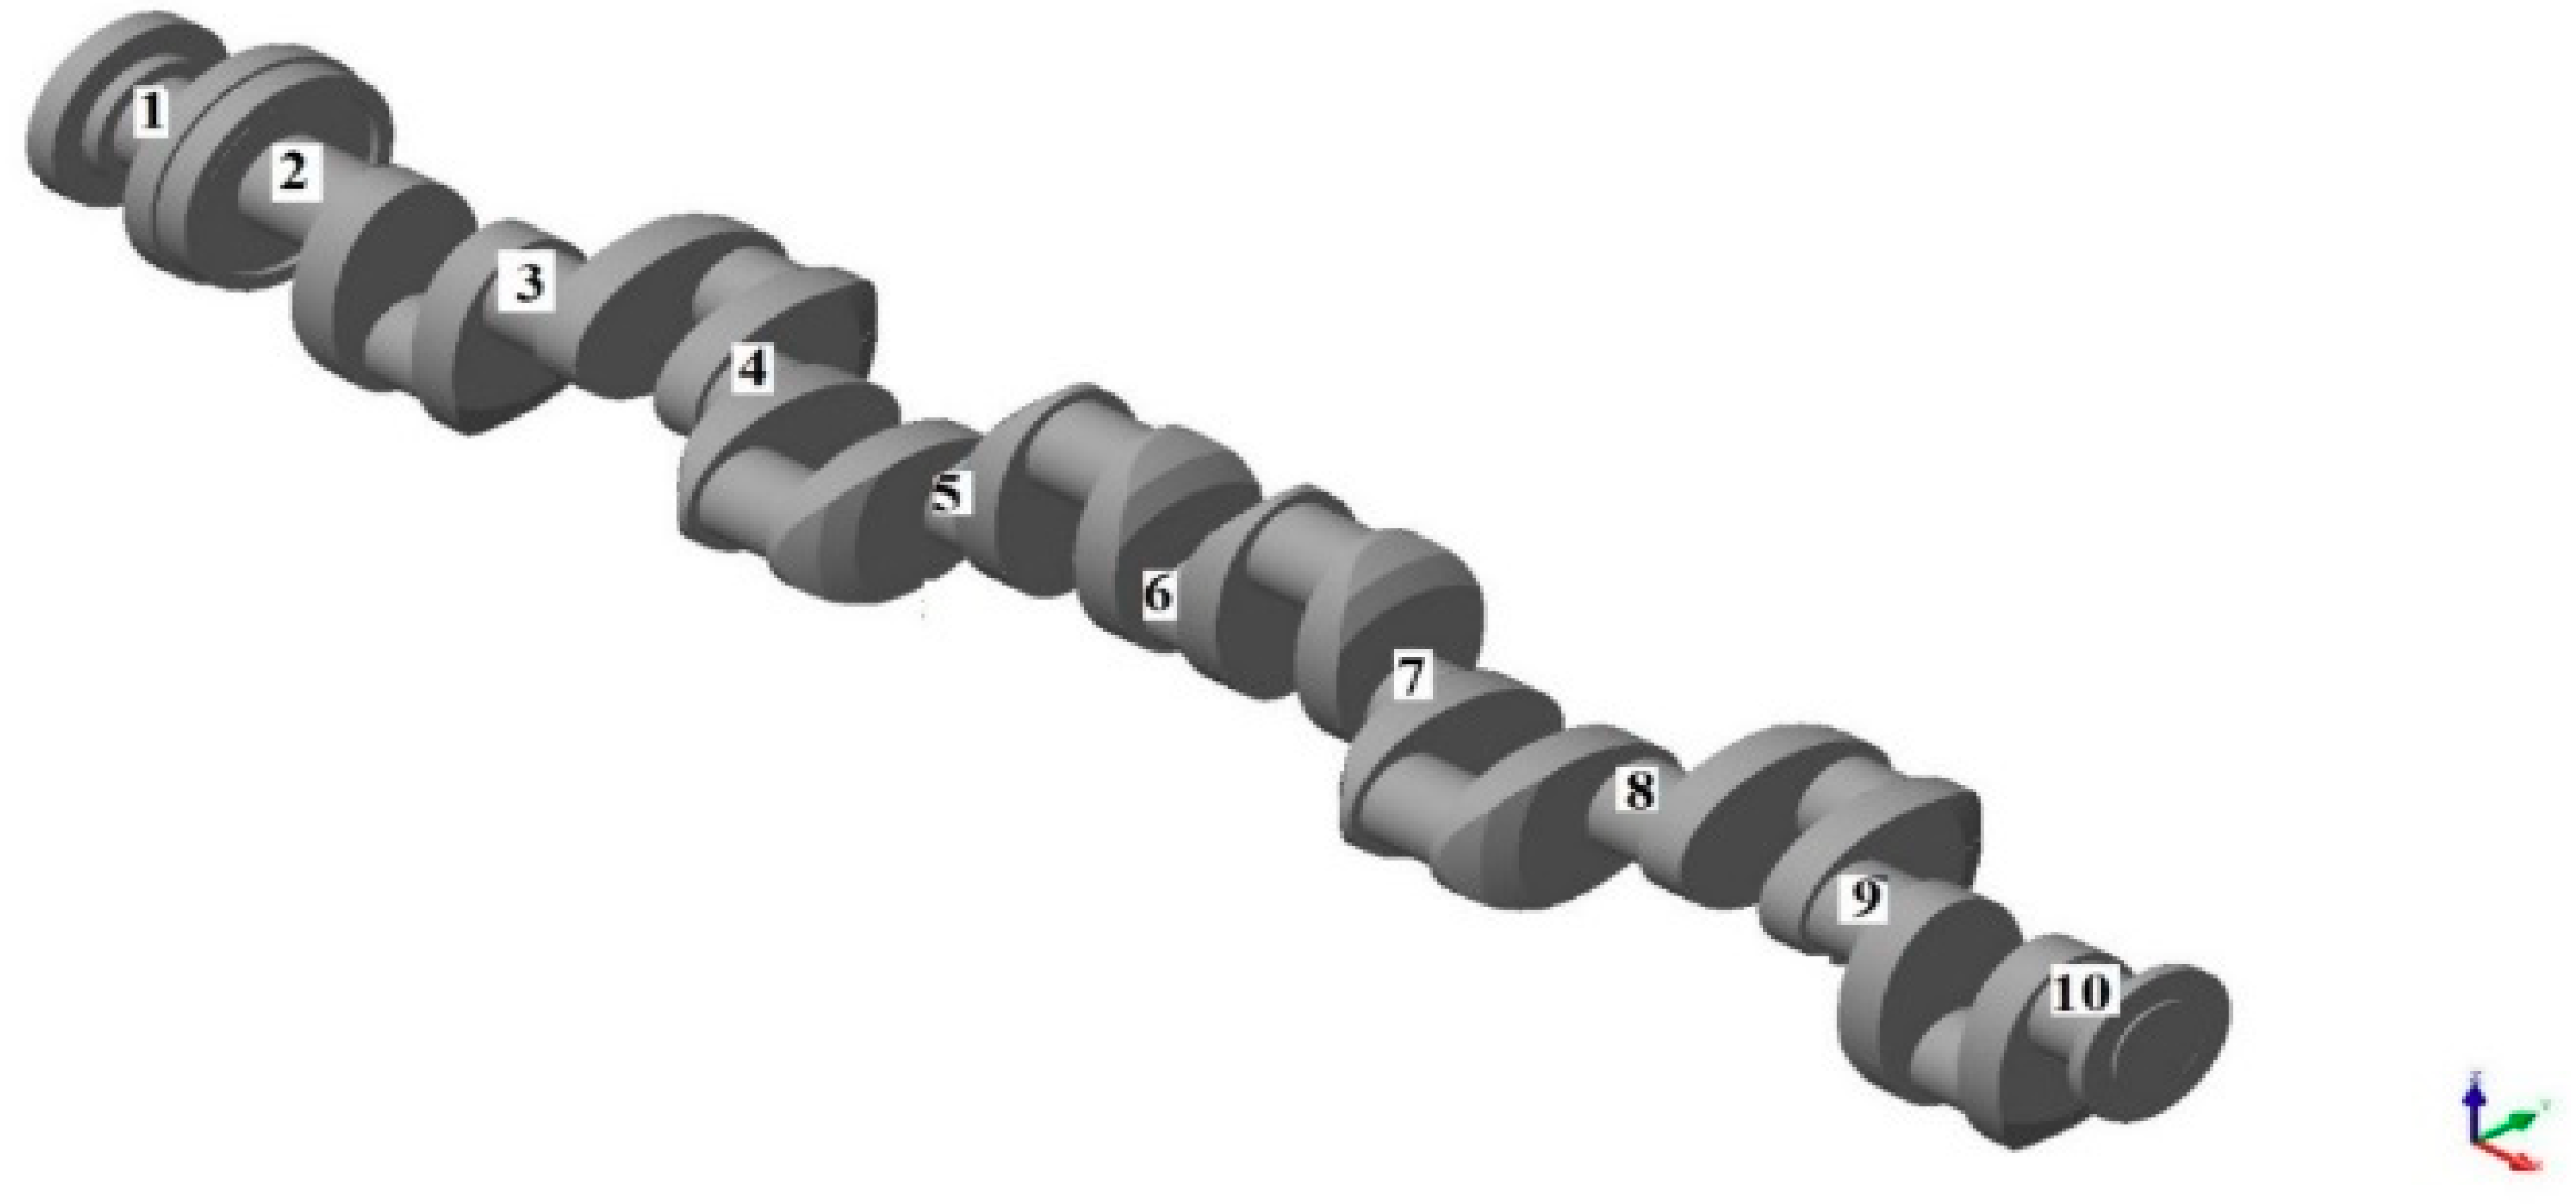
Figure 2.
Geometrical model of the analyzed shaft with journal numeration.
Figure 2.
Geometrical model of the analyzed shaft with journal numeration.
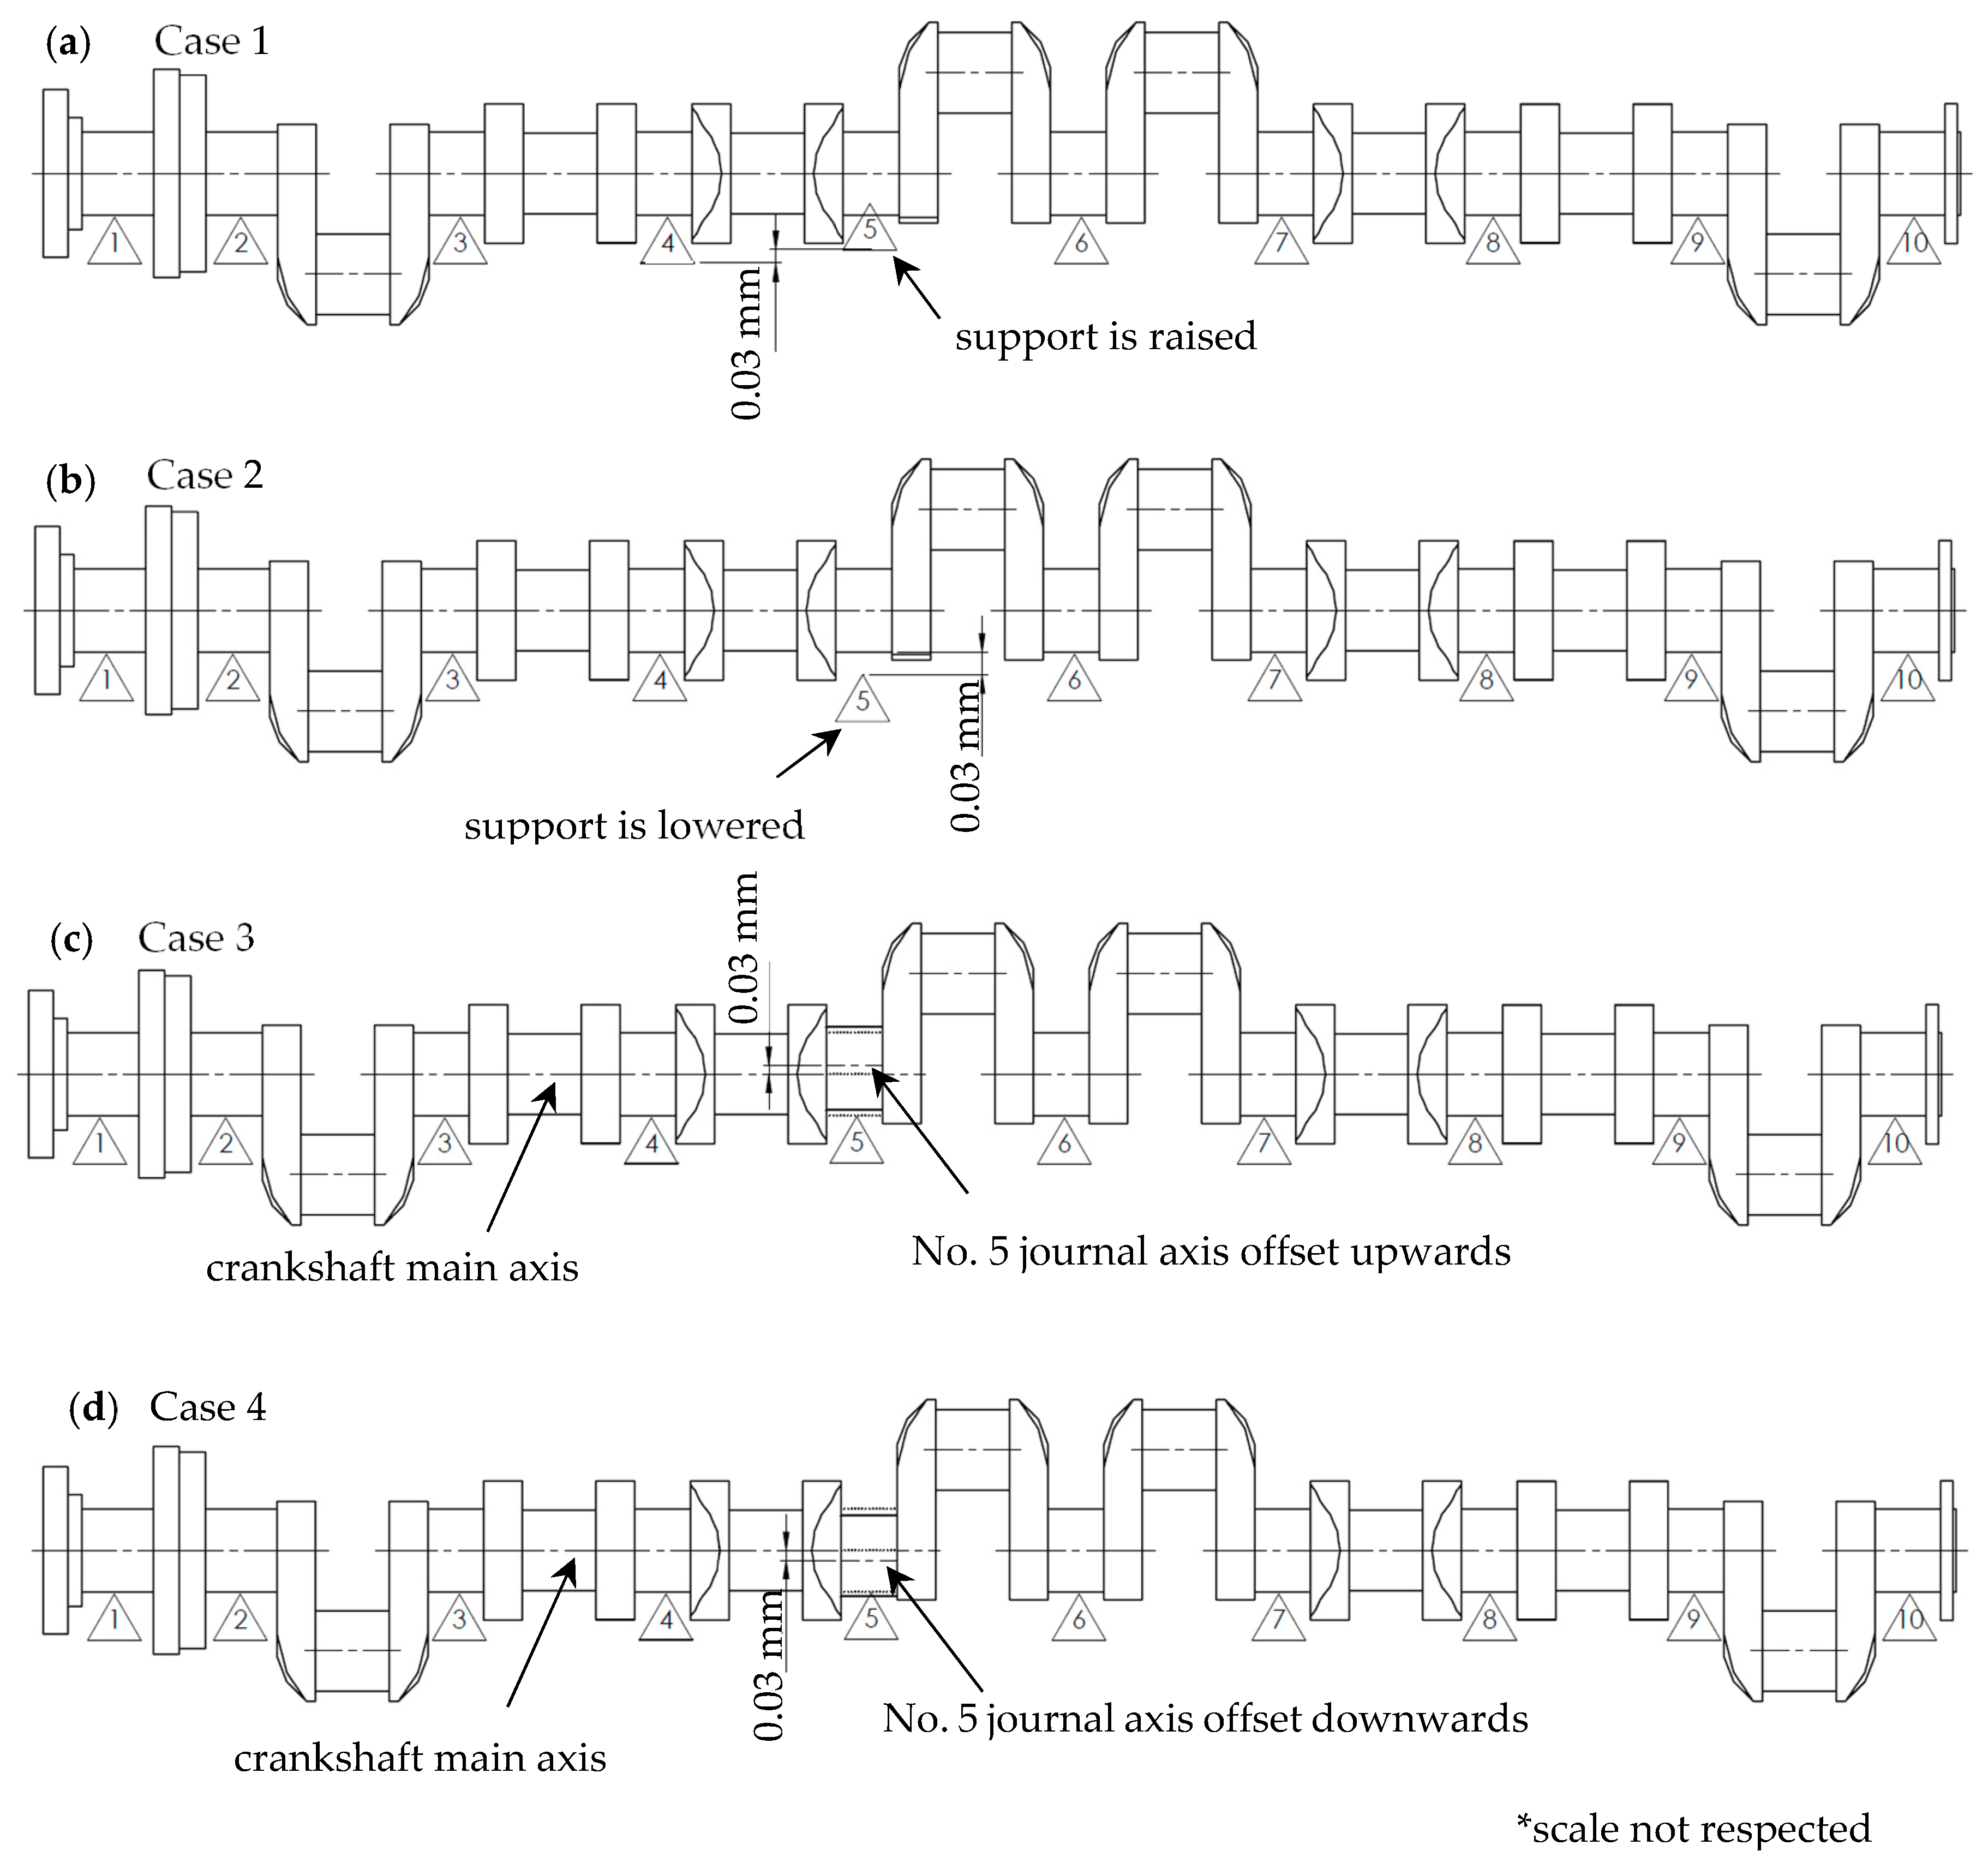
Figure 3.
A graphic representation of the cases under consideration.
Figure 3.
A graphic representation of the cases under consideration.
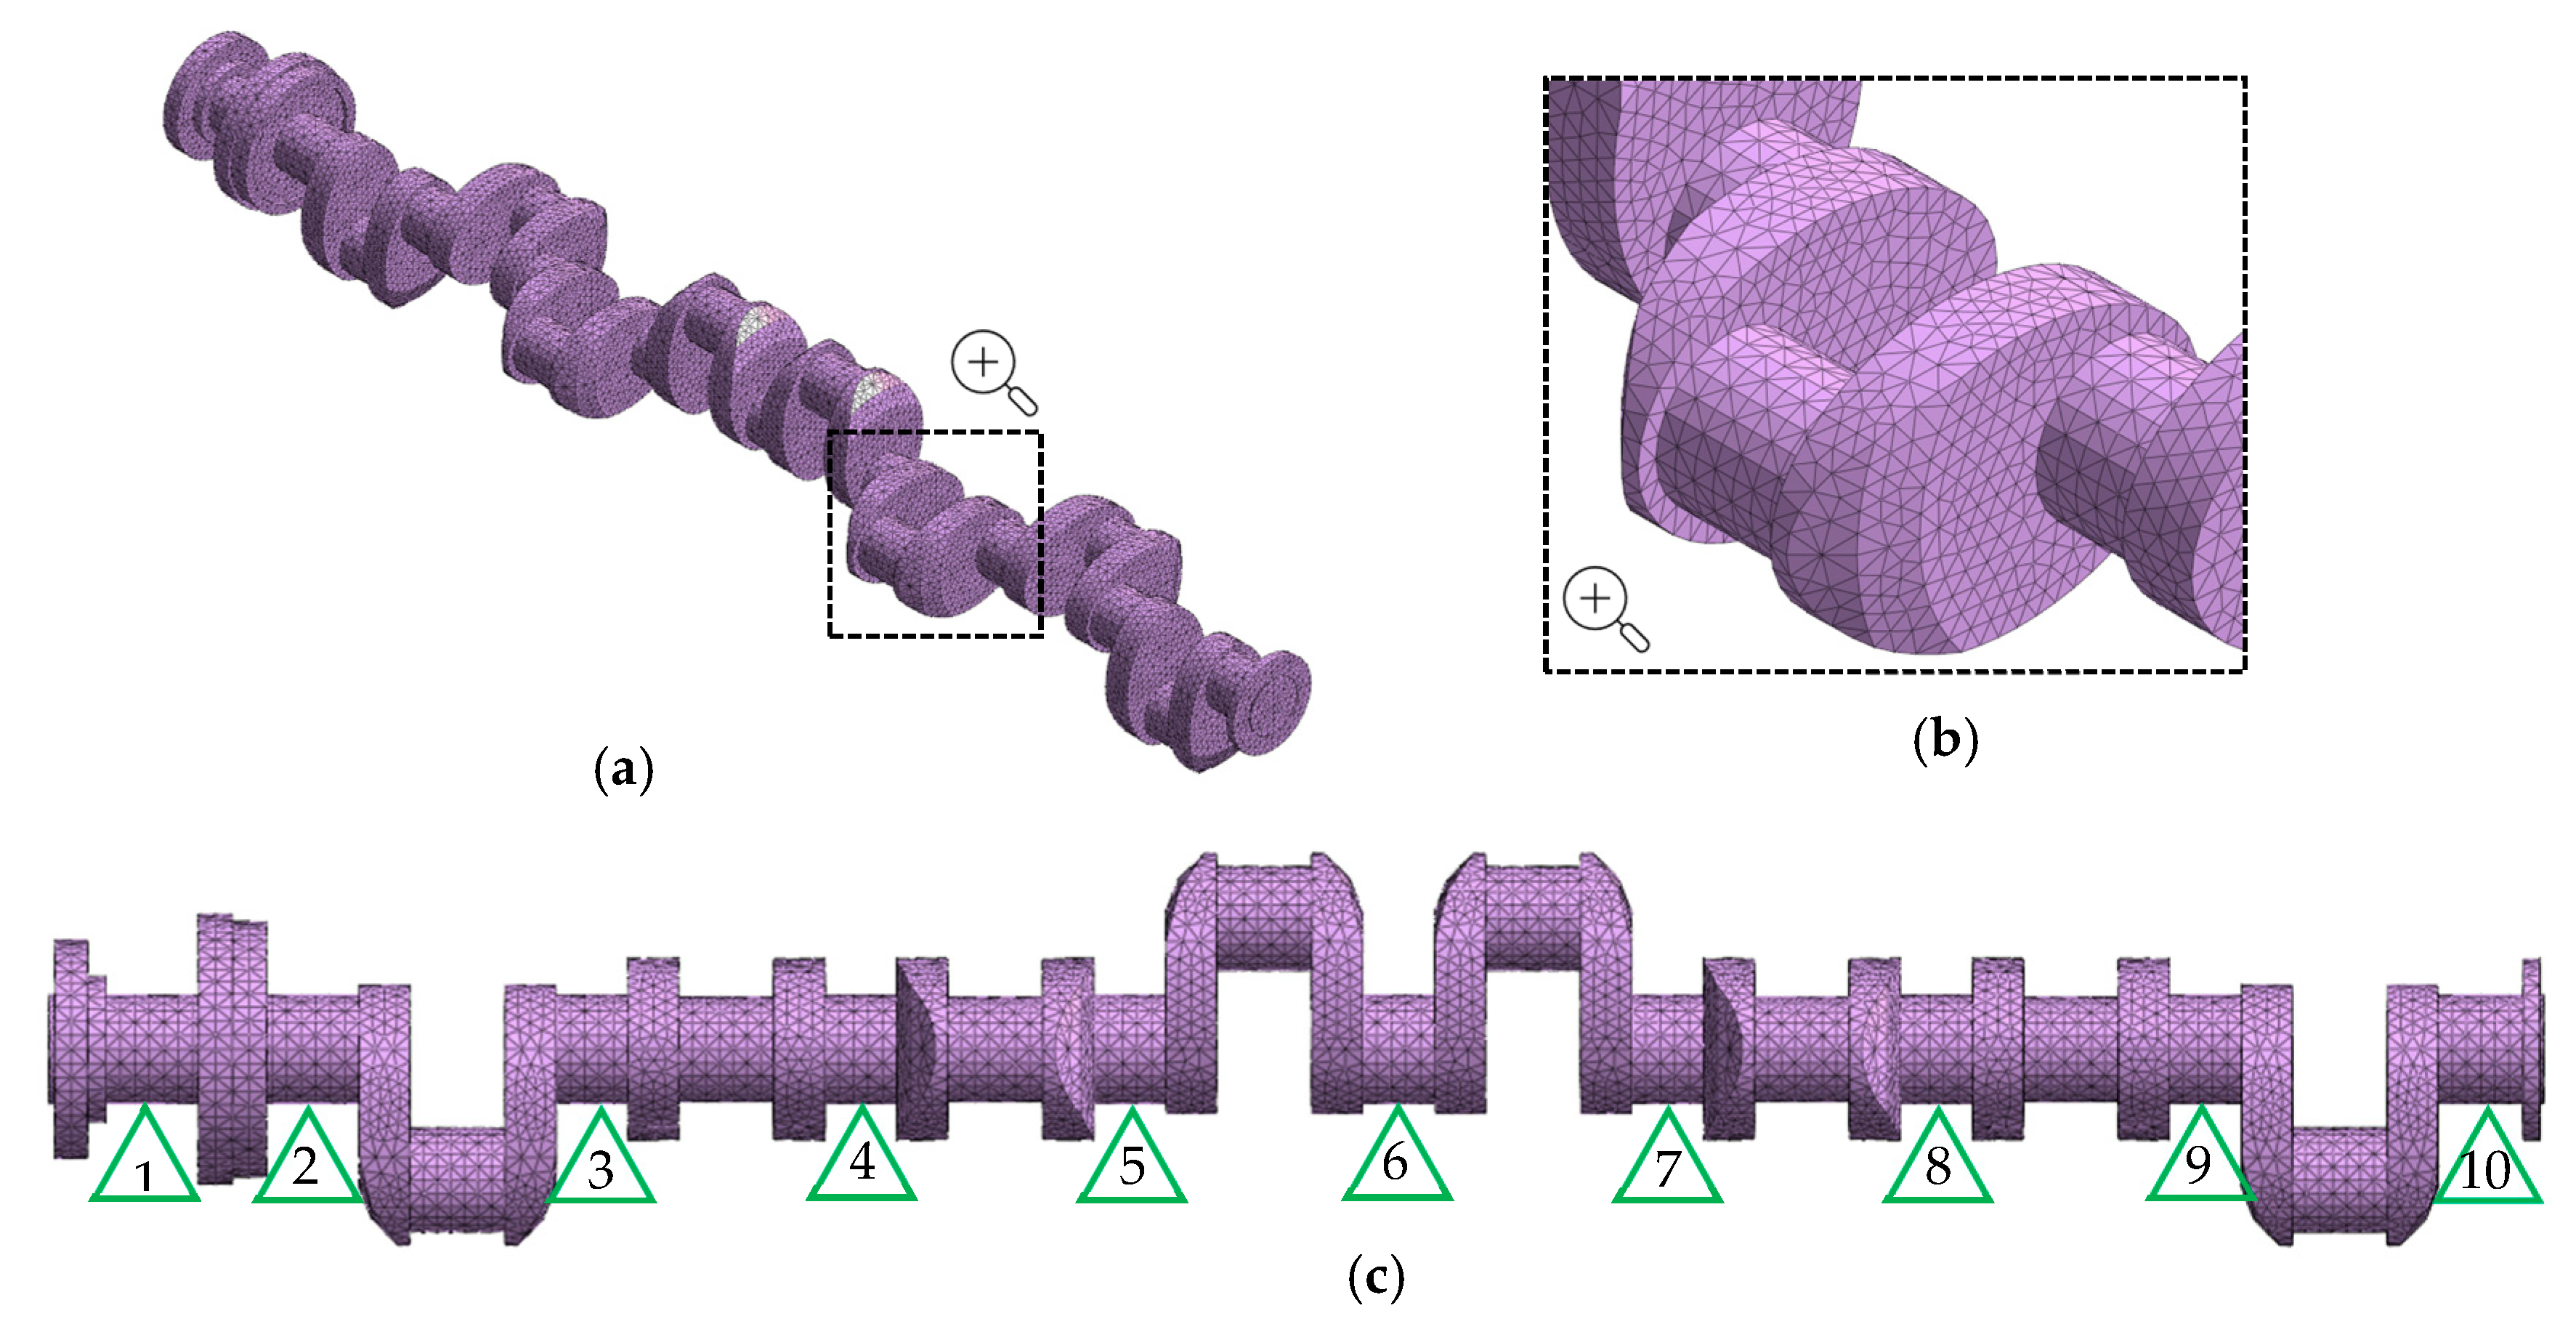
Figure 4.
Finite element model of the analyzed shaft (a) isometric view; (b) mesh close-up; (c) main journals support.
Figure 4.
Finite element model of the analyzed shaft (a) isometric view; (b) mesh close-up; (c) main journals support.
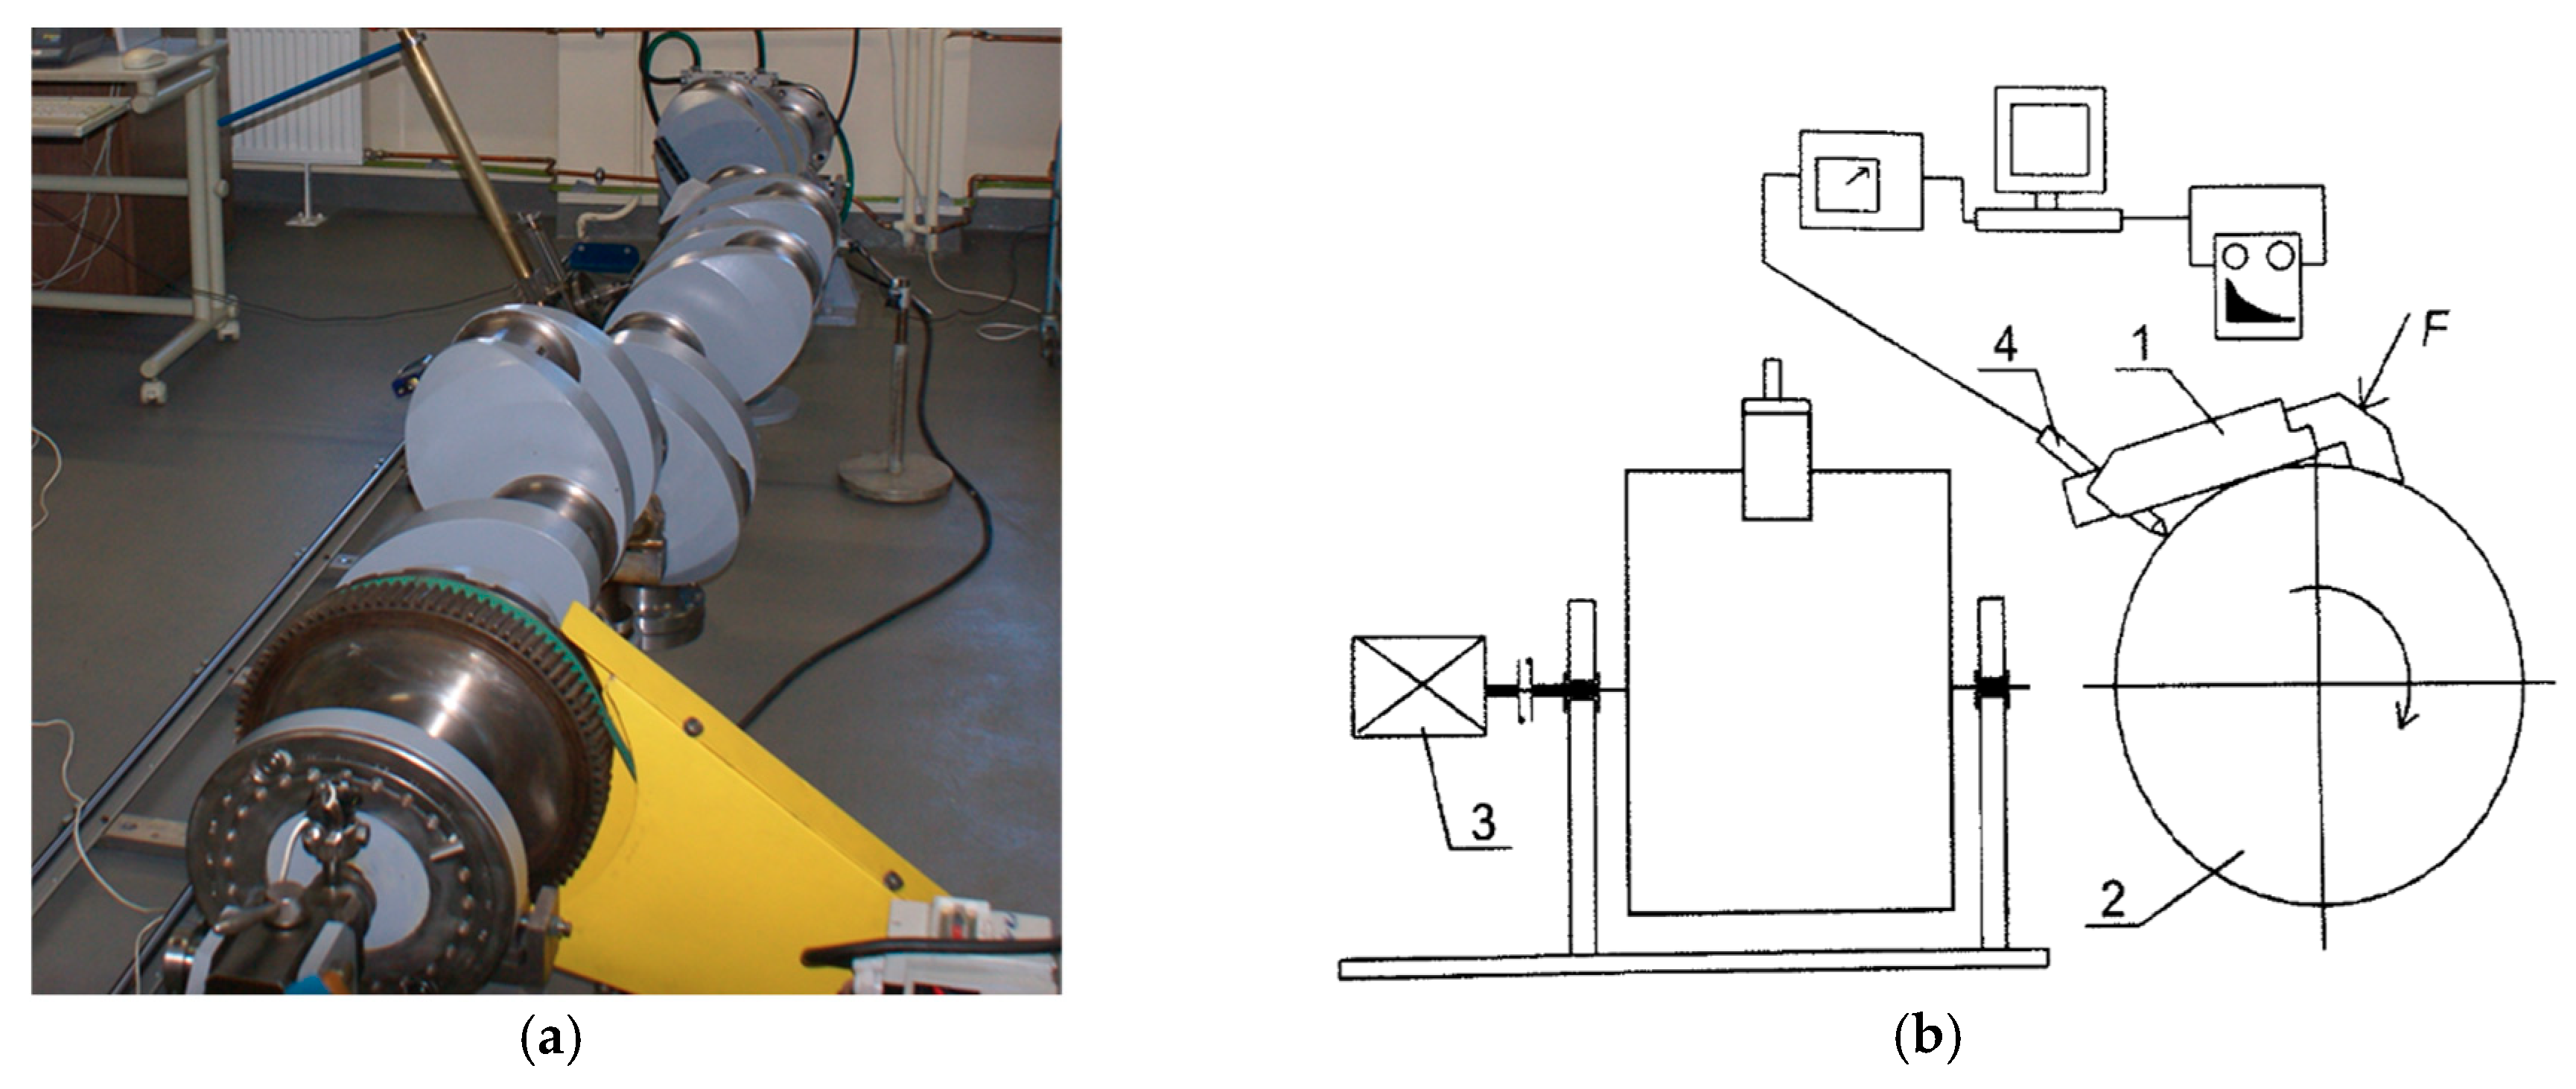
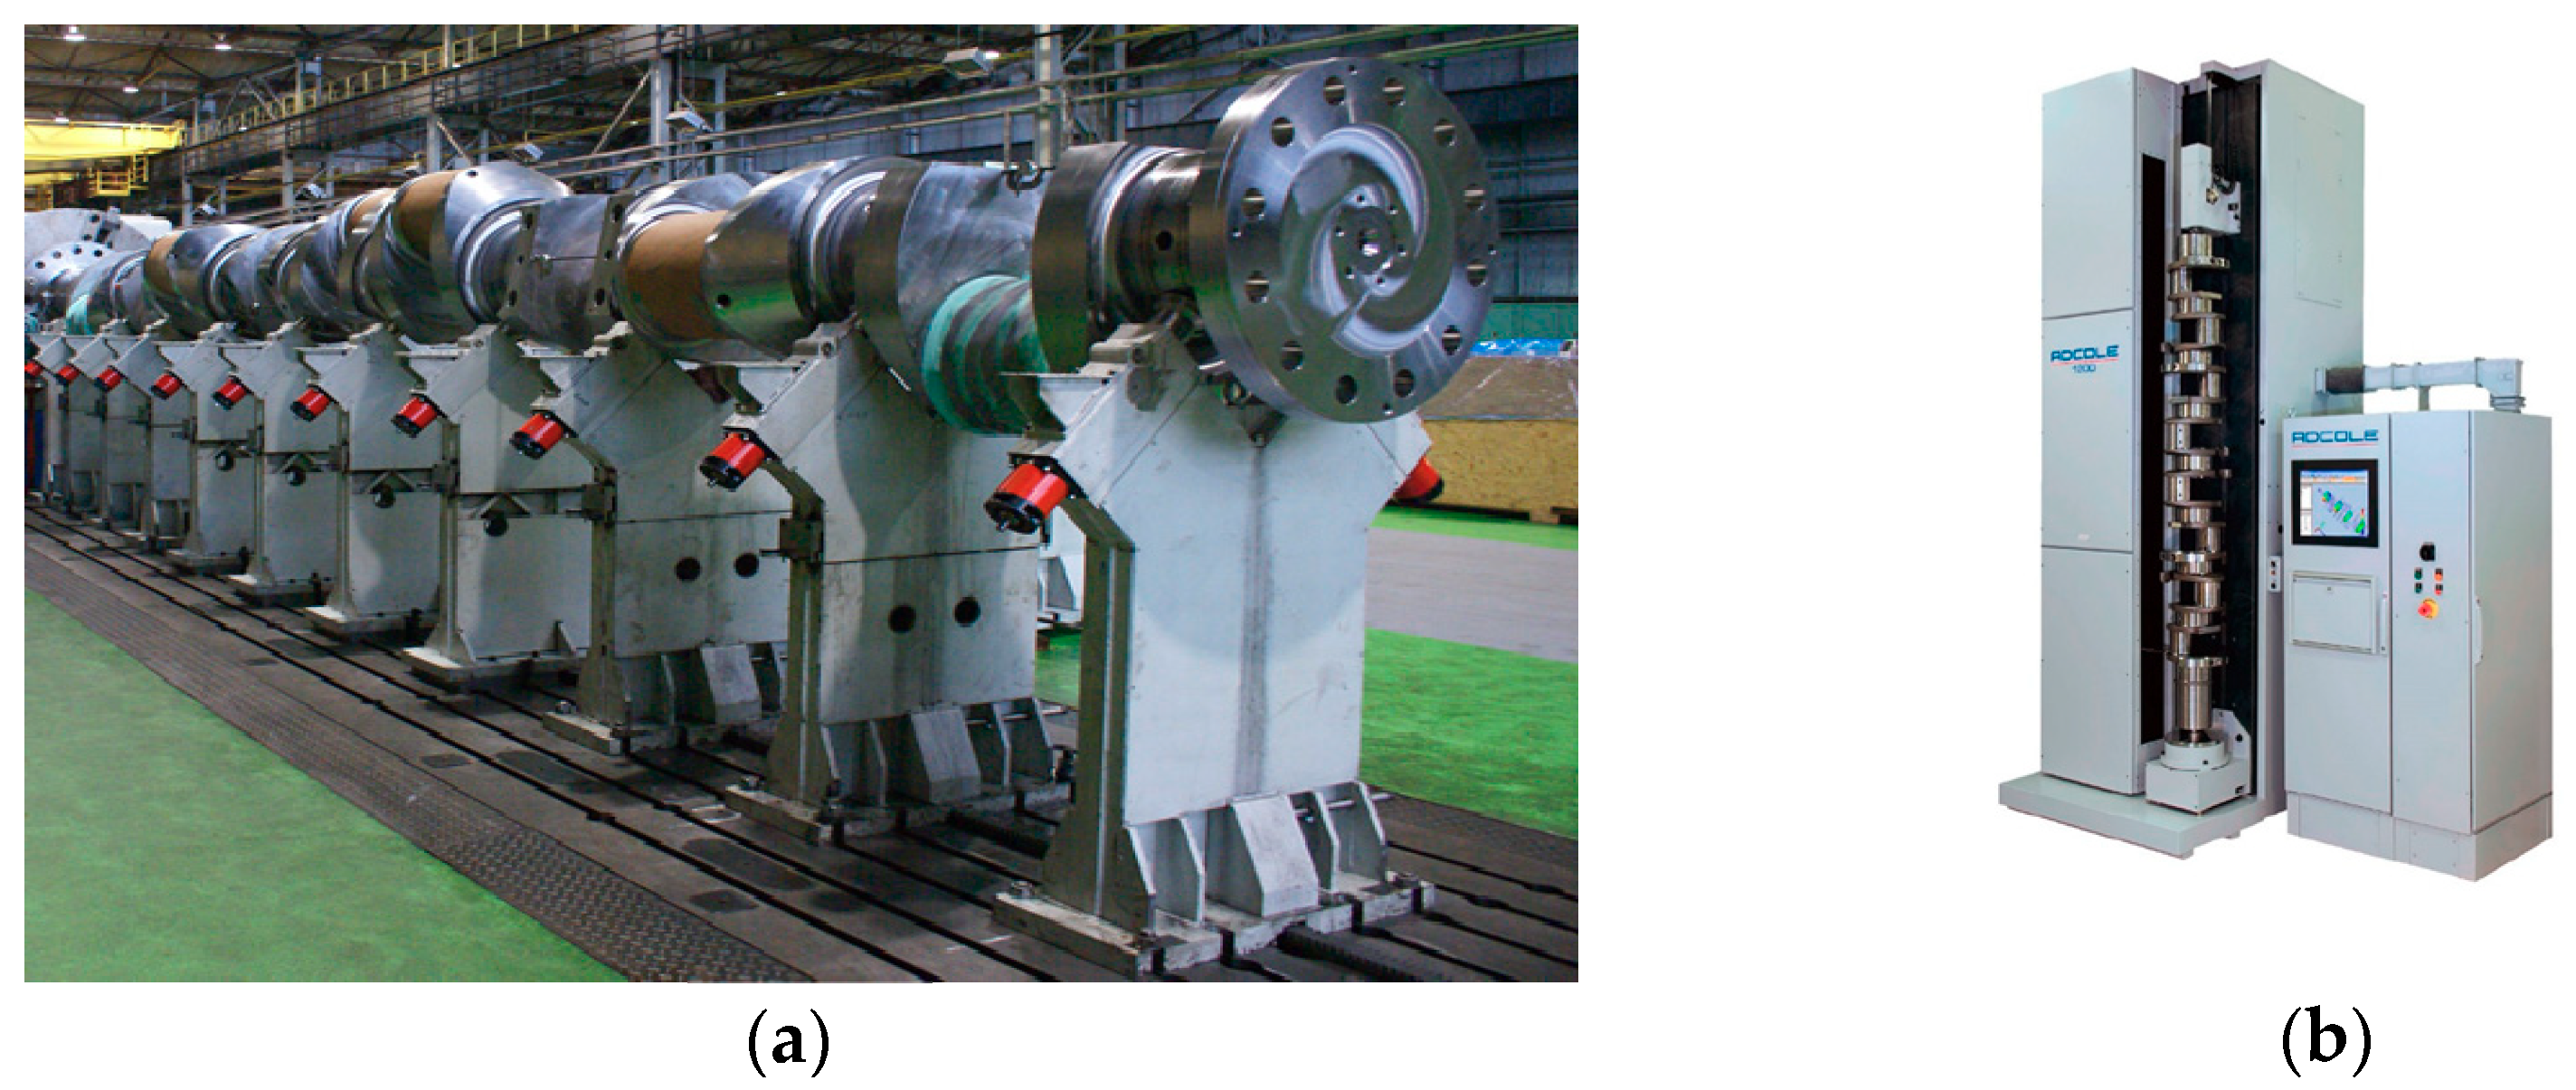
Figure 5.
SAJD measurement system: (
a) layout of the system; (
b) measurement method [
11]: 1—measuring head MUK 25-600, 2—shaft journal, 3—drive motor, 4—displacement sensor, F—measuring head pressing force.
Figure 5.
SAJD measurement system: (
a) layout of the system; (
b) measurement method [
11]: 1—measuring head MUK 25-600, 2—shaft journal, 3—drive motor, 4—displacement sensor, F—measuring head pressing force.
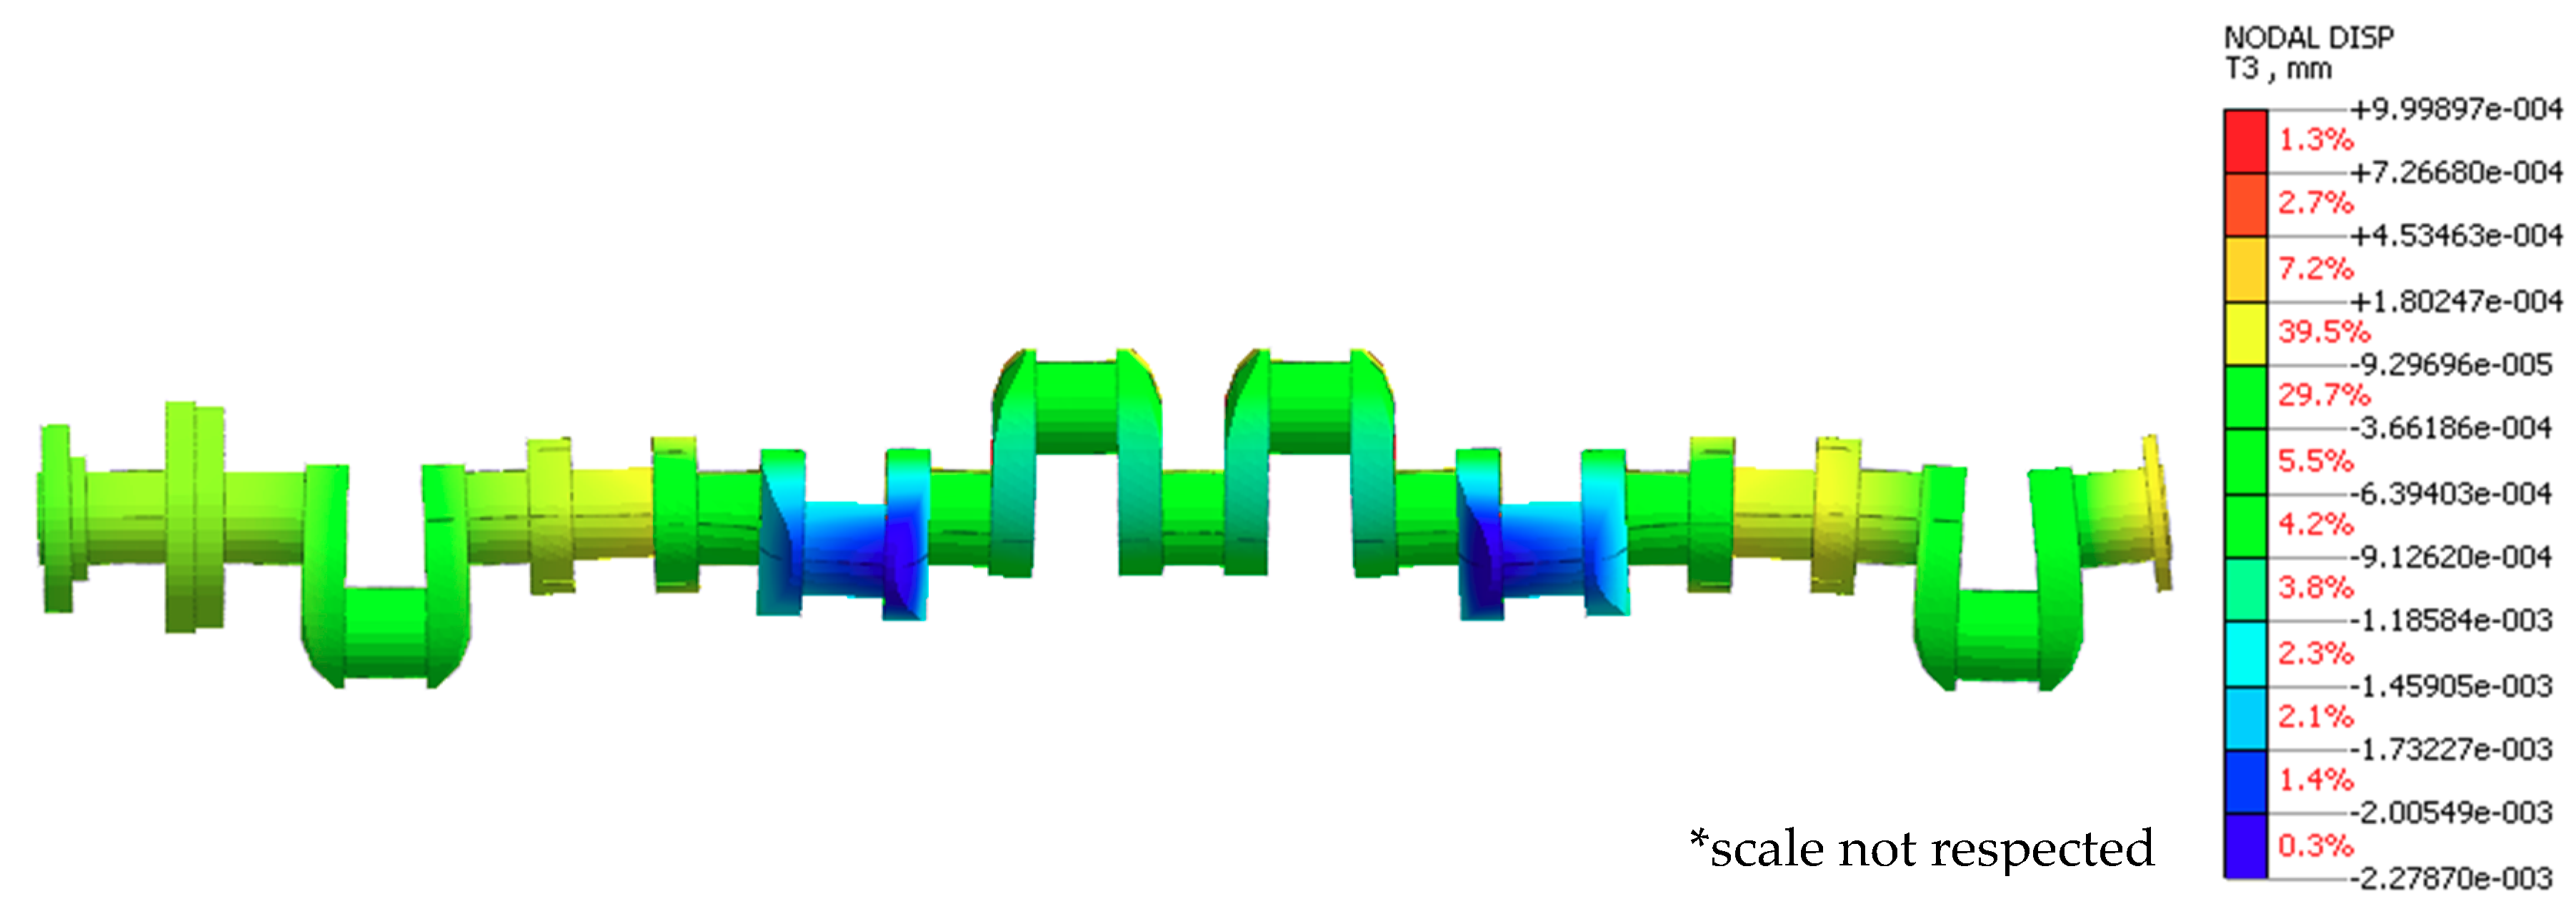
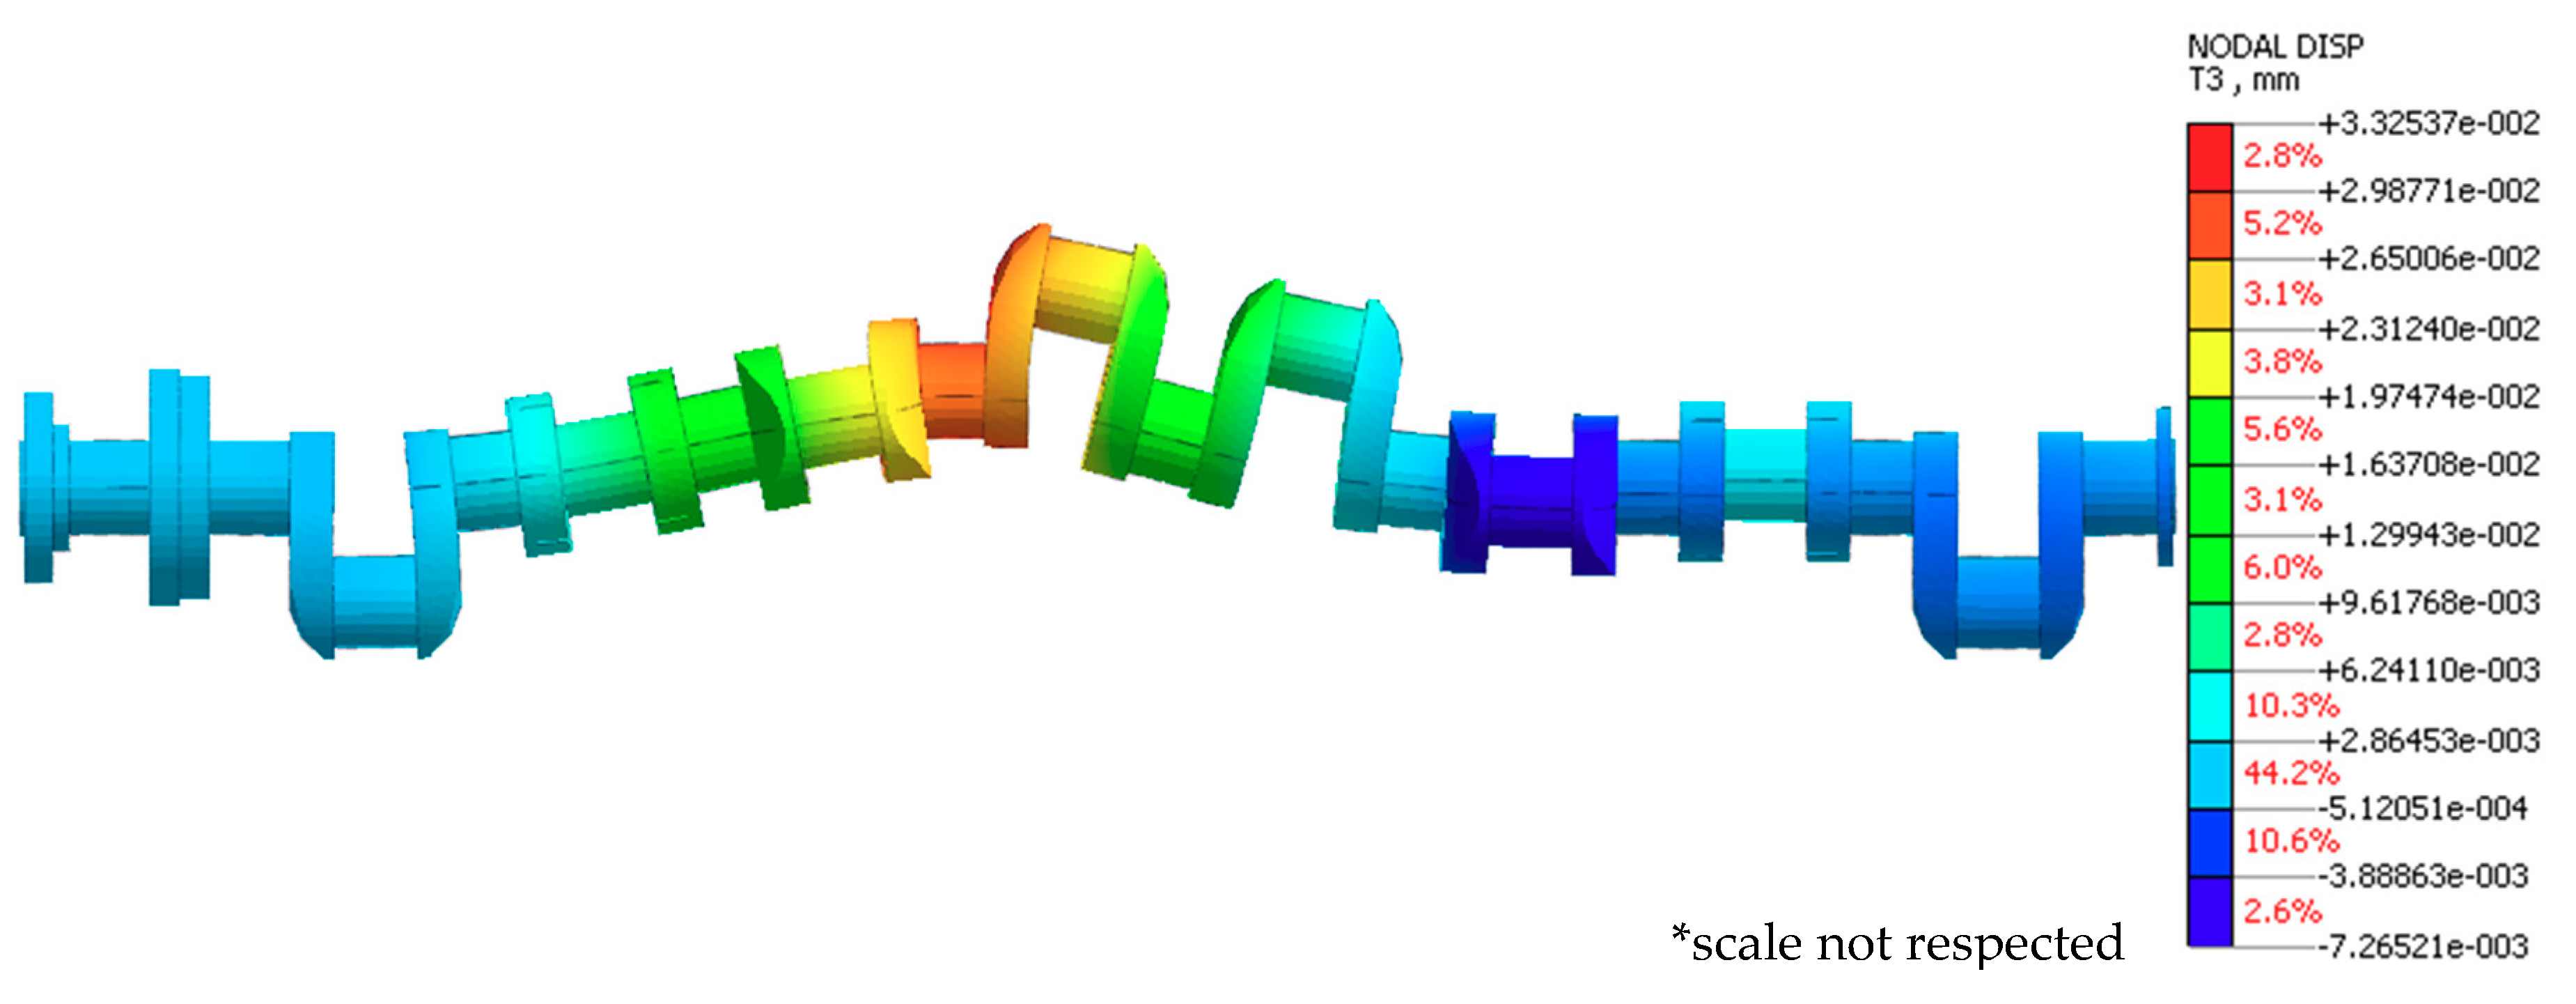
Figure 6.
Exemplary finite element analysis results for case 1.
Figure 6.
Exemplary finite element analysis results for case 1.
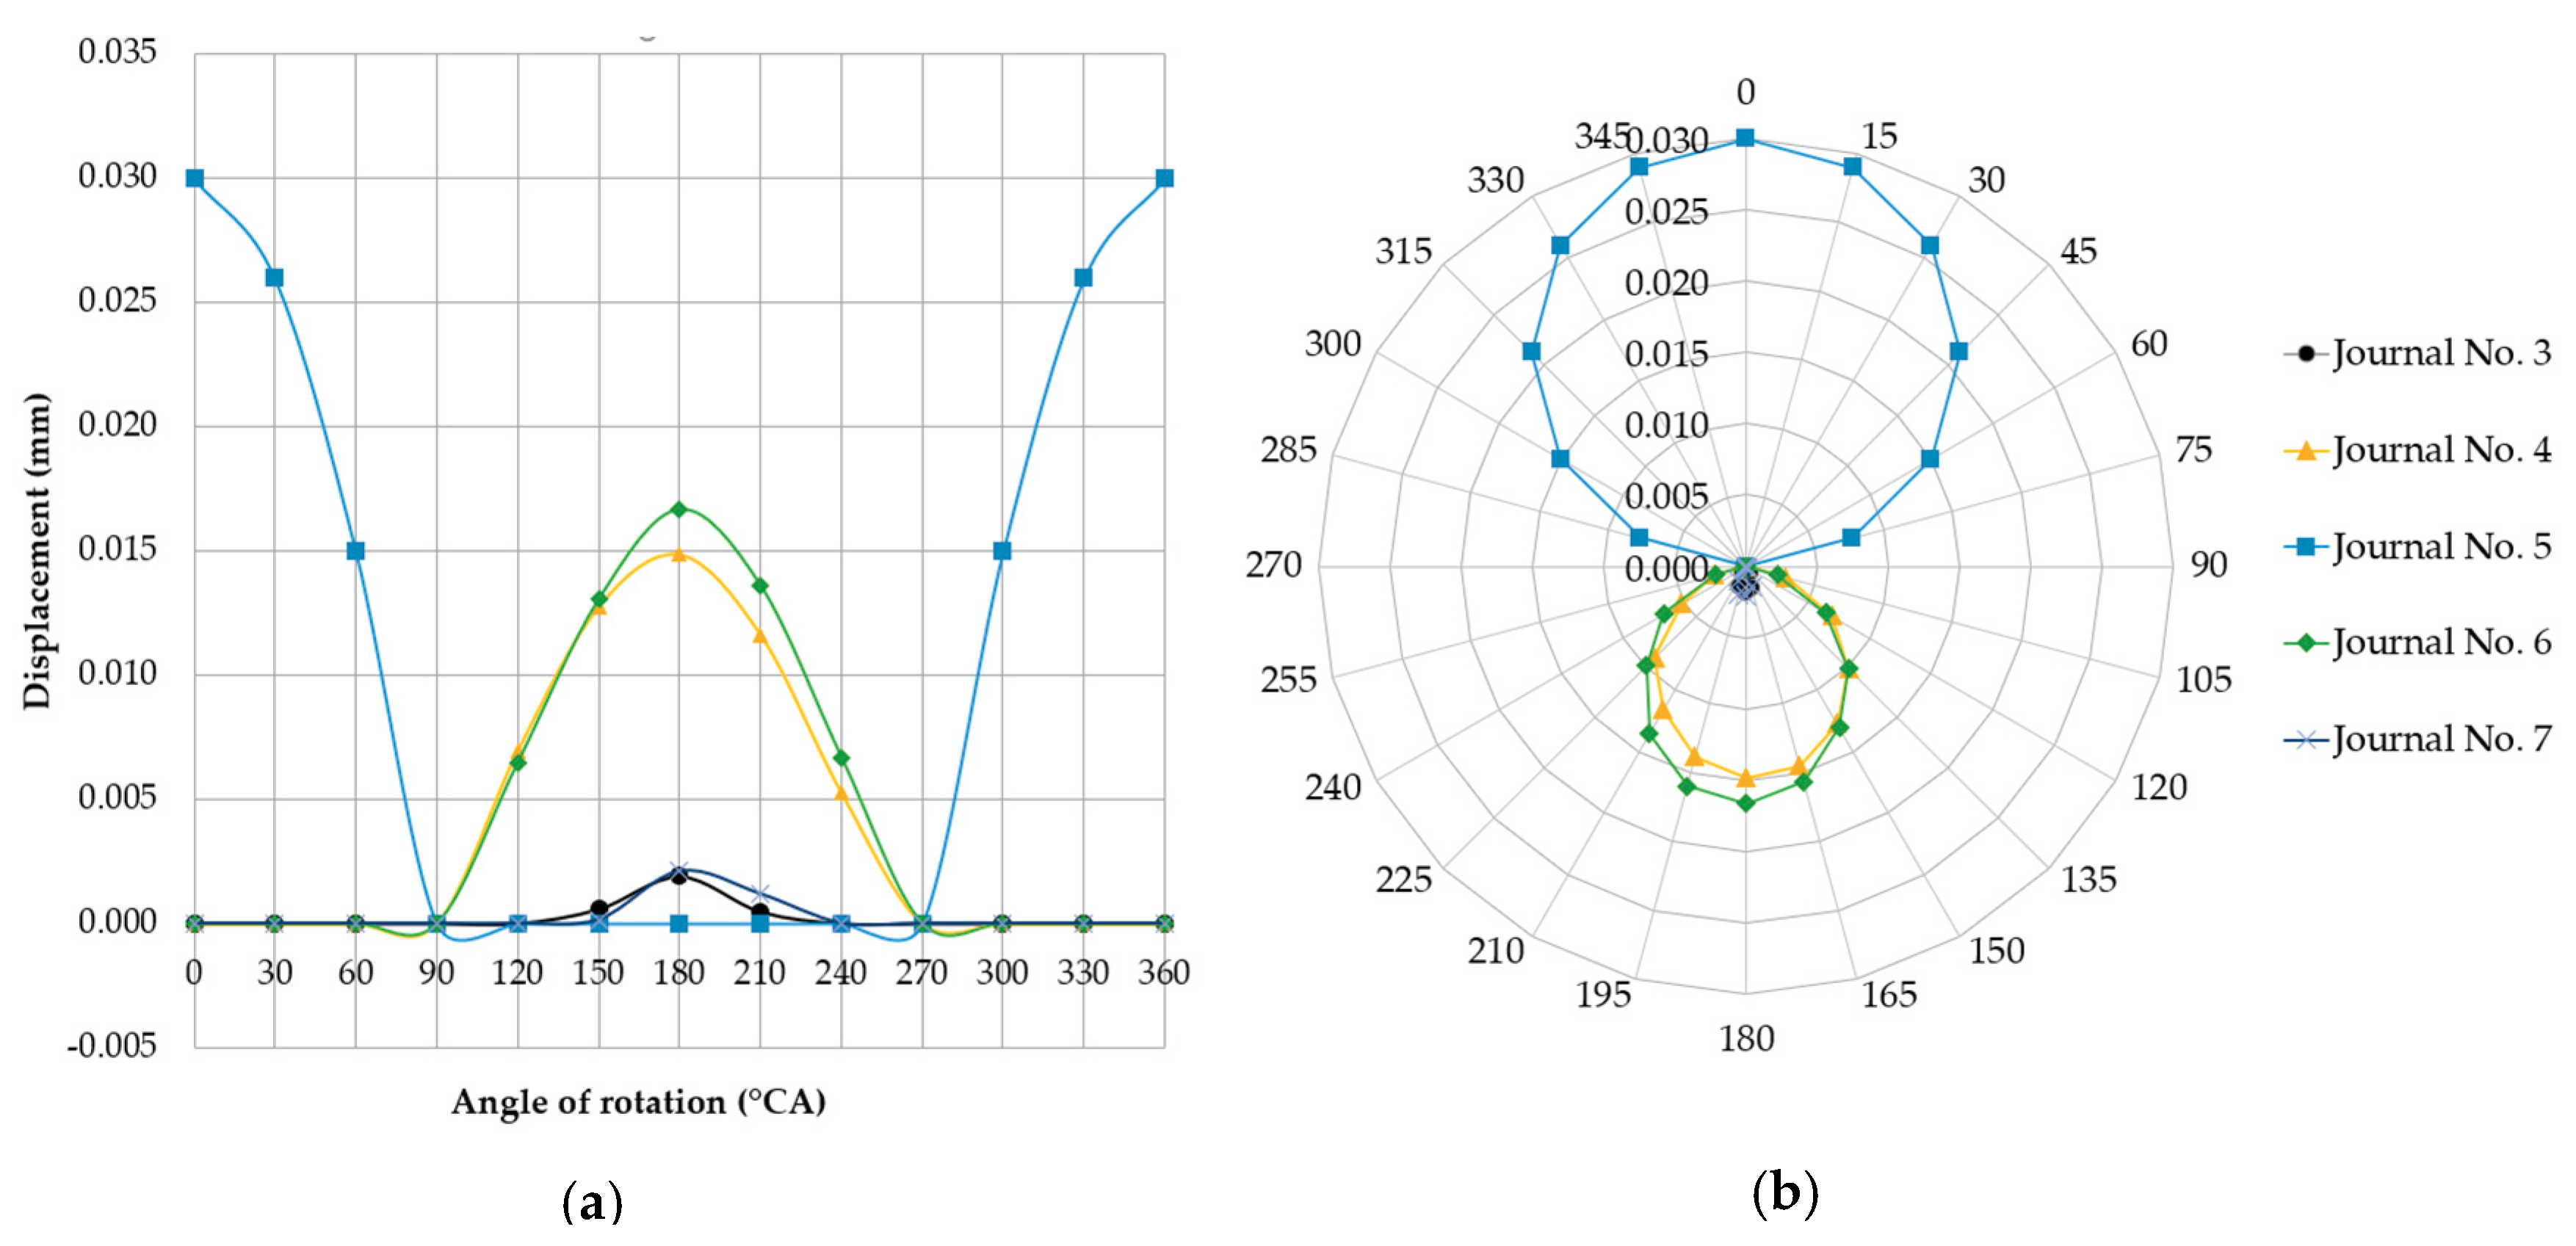
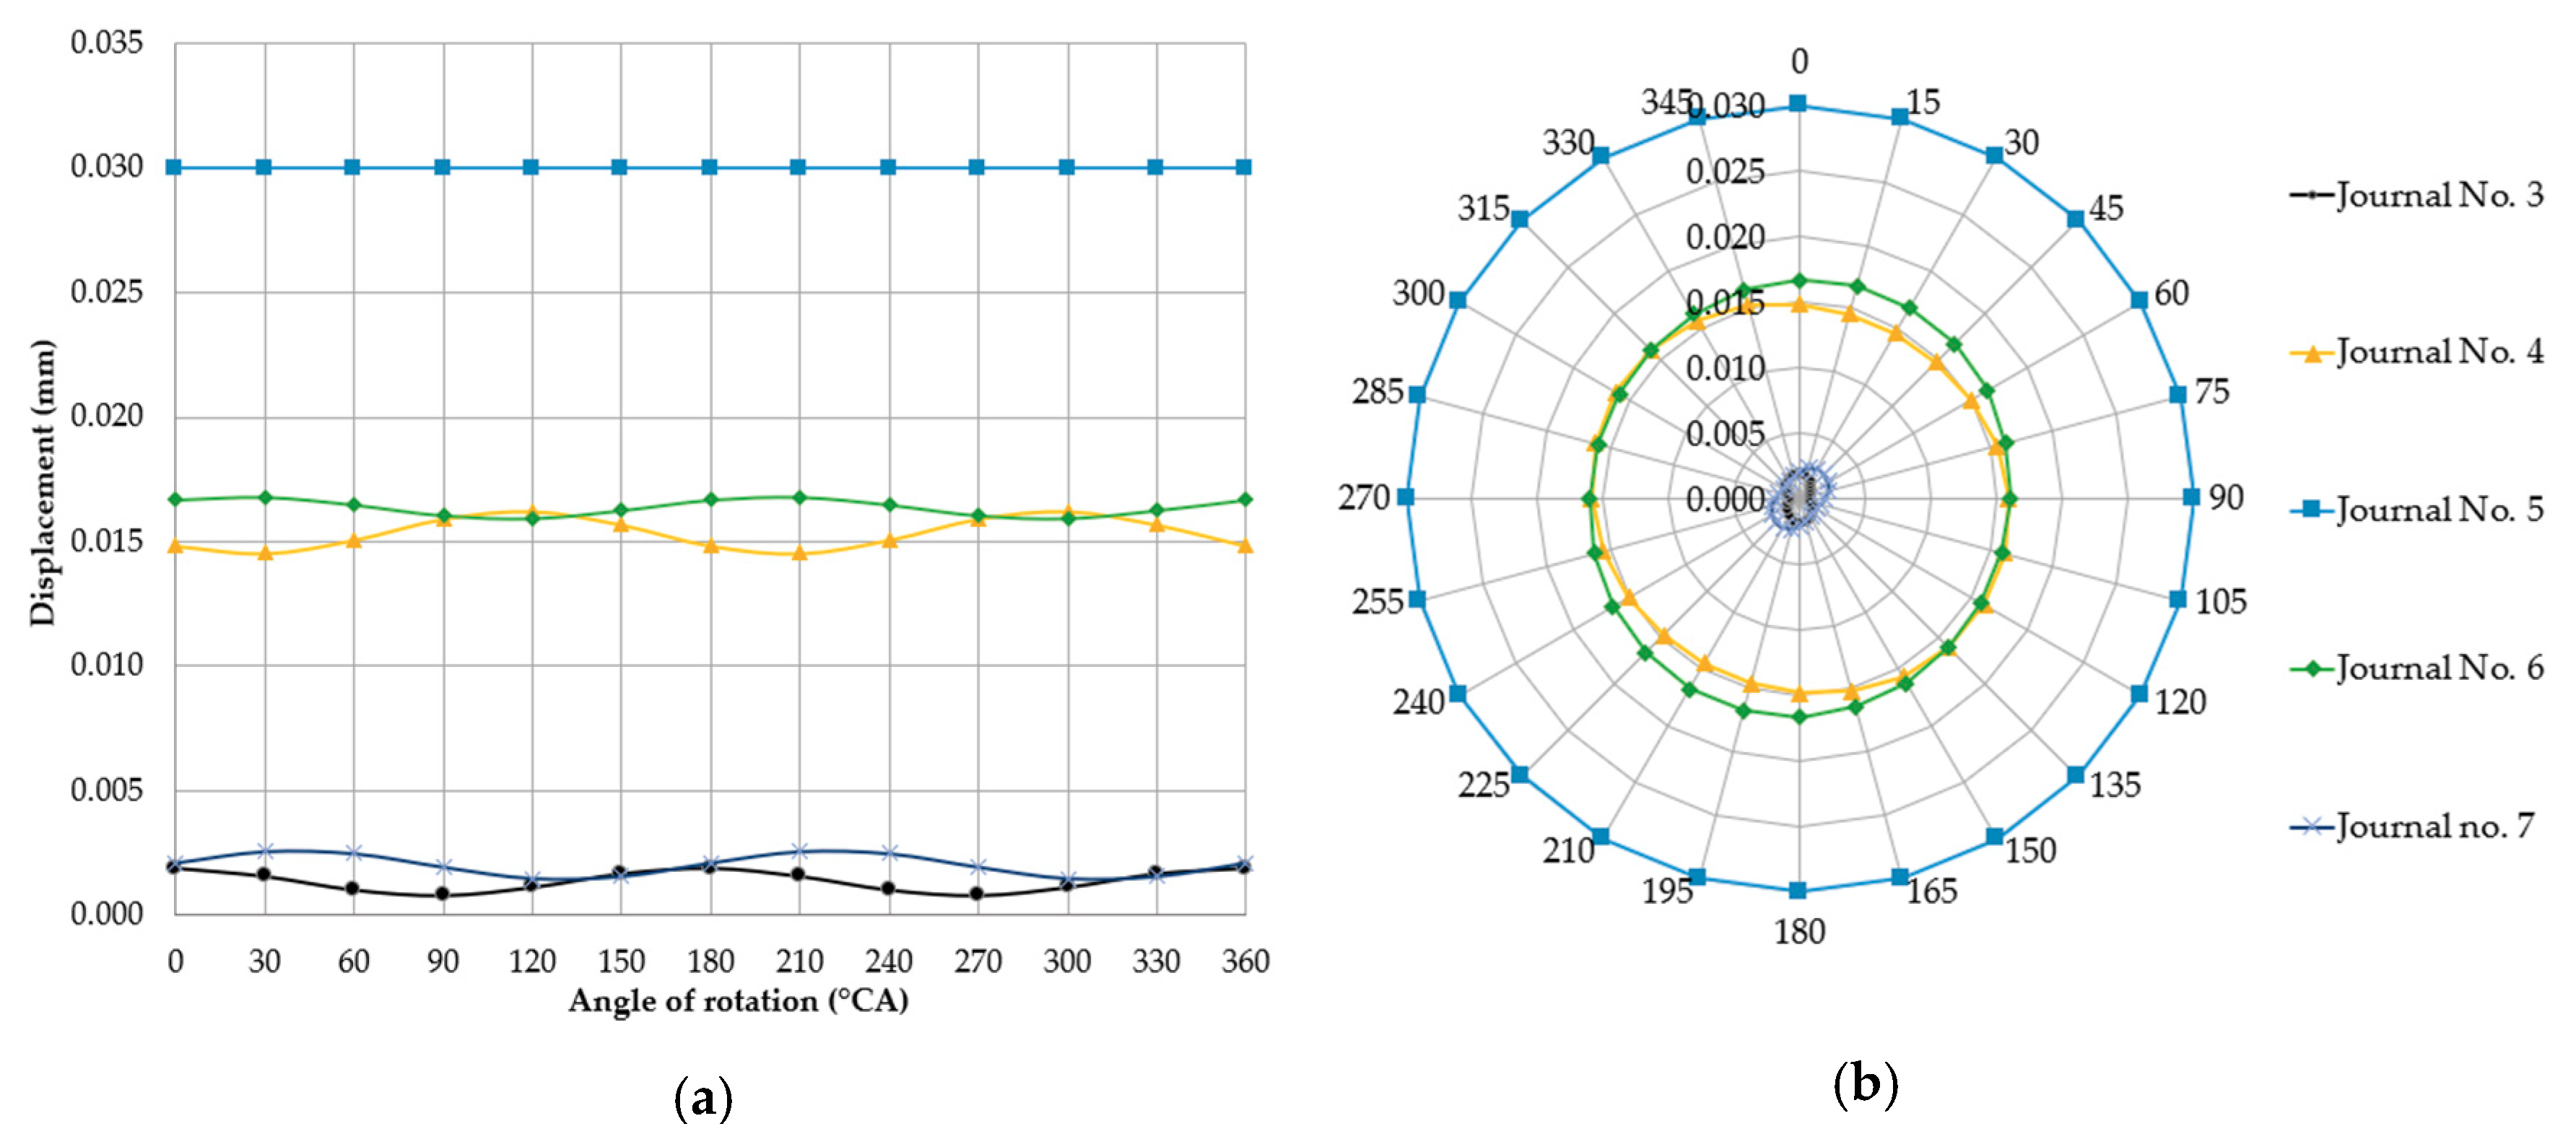
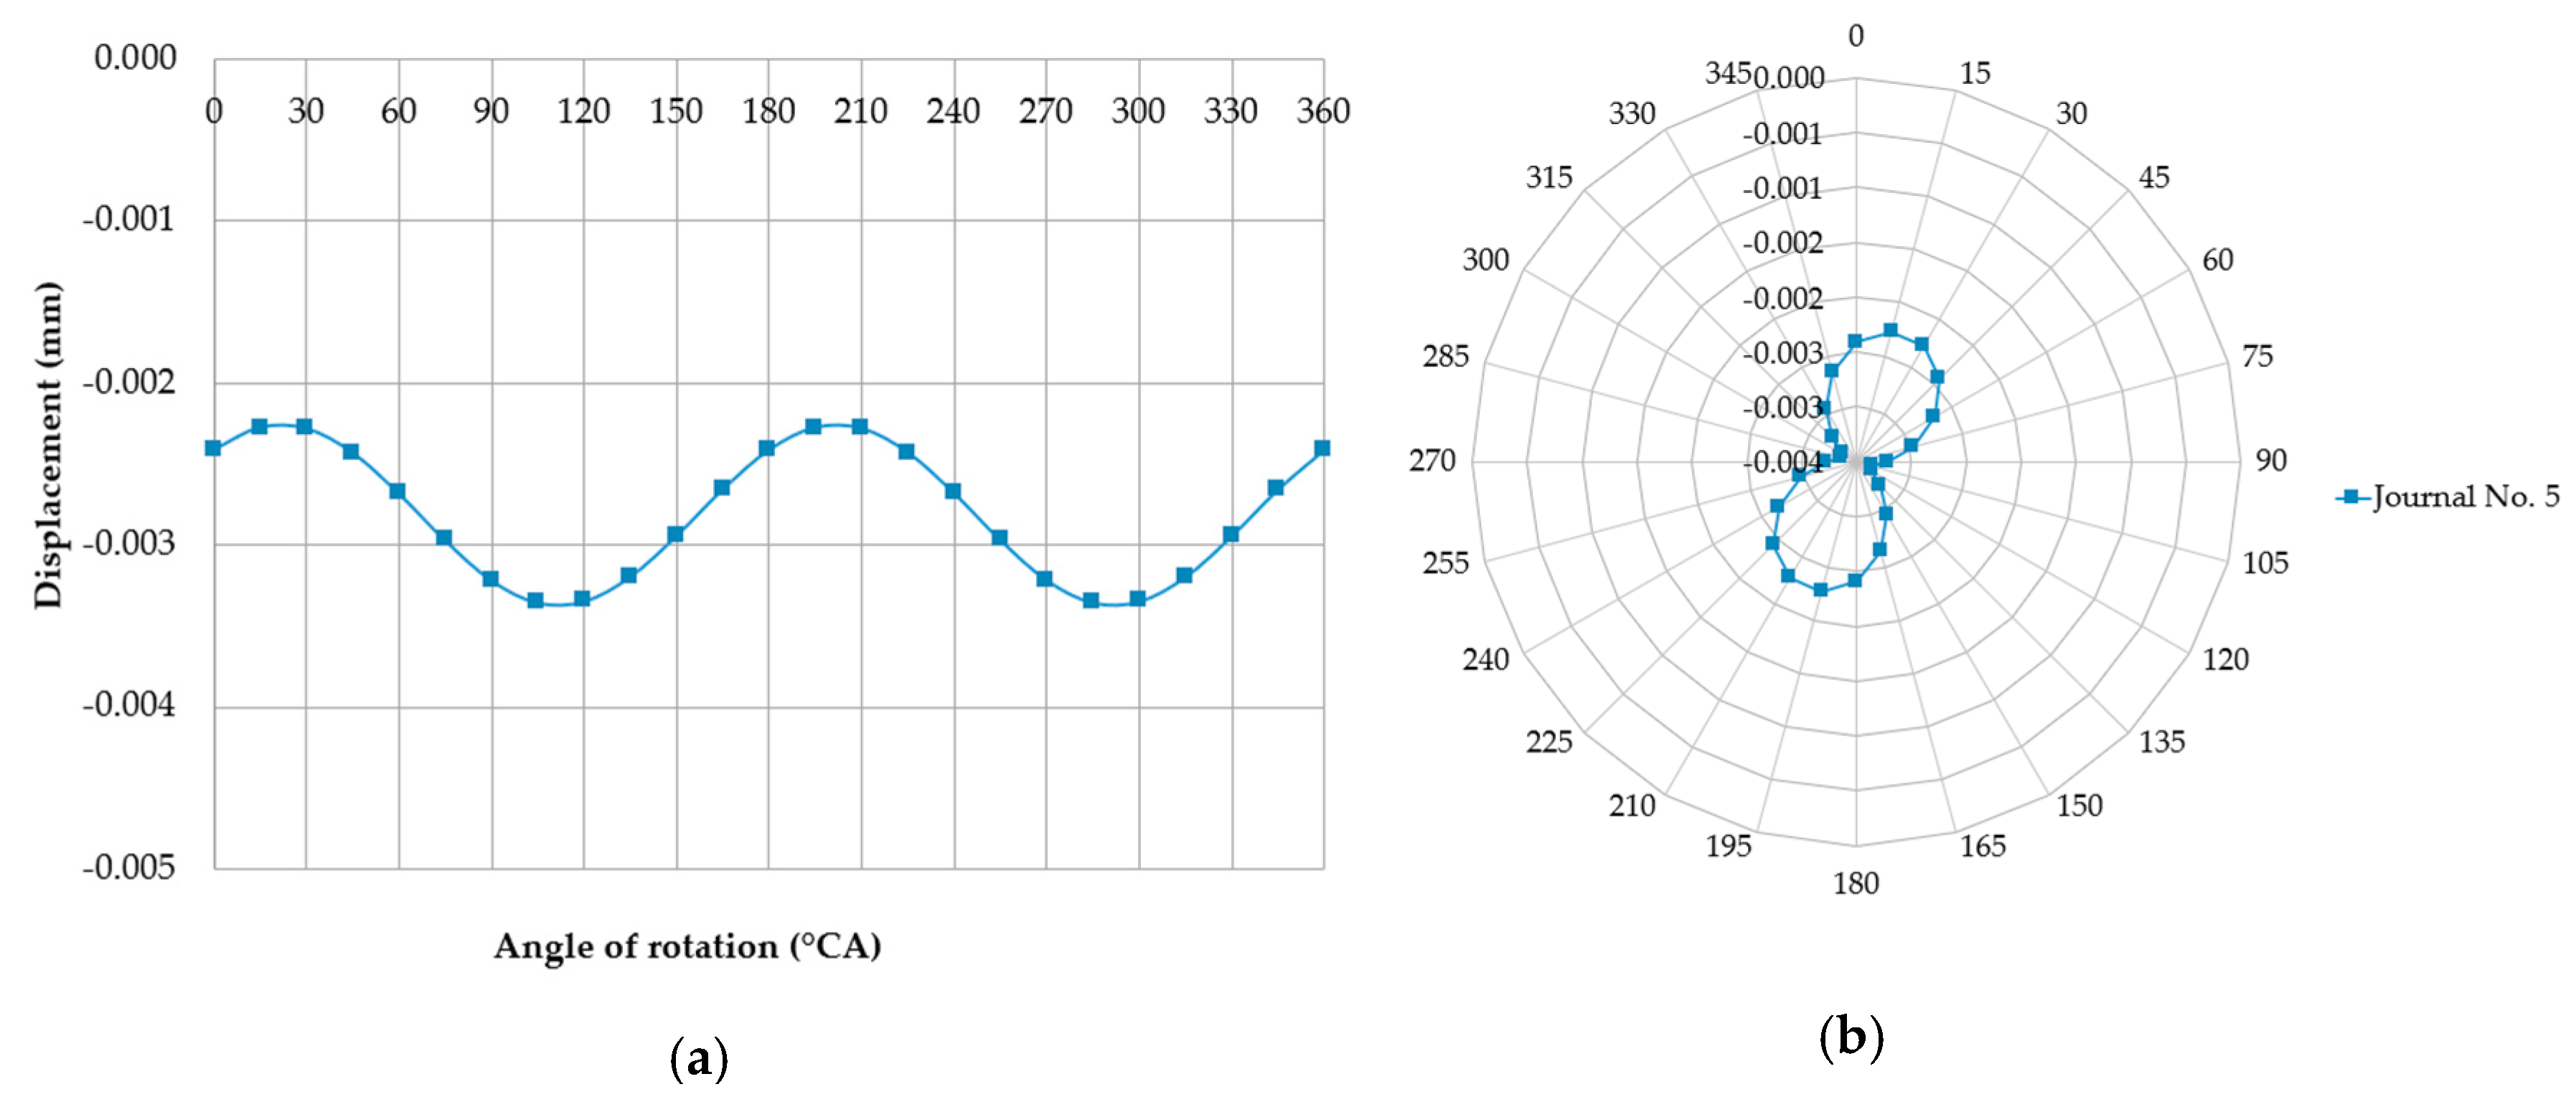
Figure 7.
Changes in deflections measured in the vertical plane at individual main journals with the shaft rotated by 15° at a time and when one of the supports (of journal no. 5 counting from the timing gear end) is offset upwards by 0.03 mm relative to the others, shown in the charts in the (a) Cartesian and (b) polar coordinate systems.
Figure 8.
Exemplary finite element analysis results for case 2.
Figure 8.
Exemplary finite element analysis results for case 2.
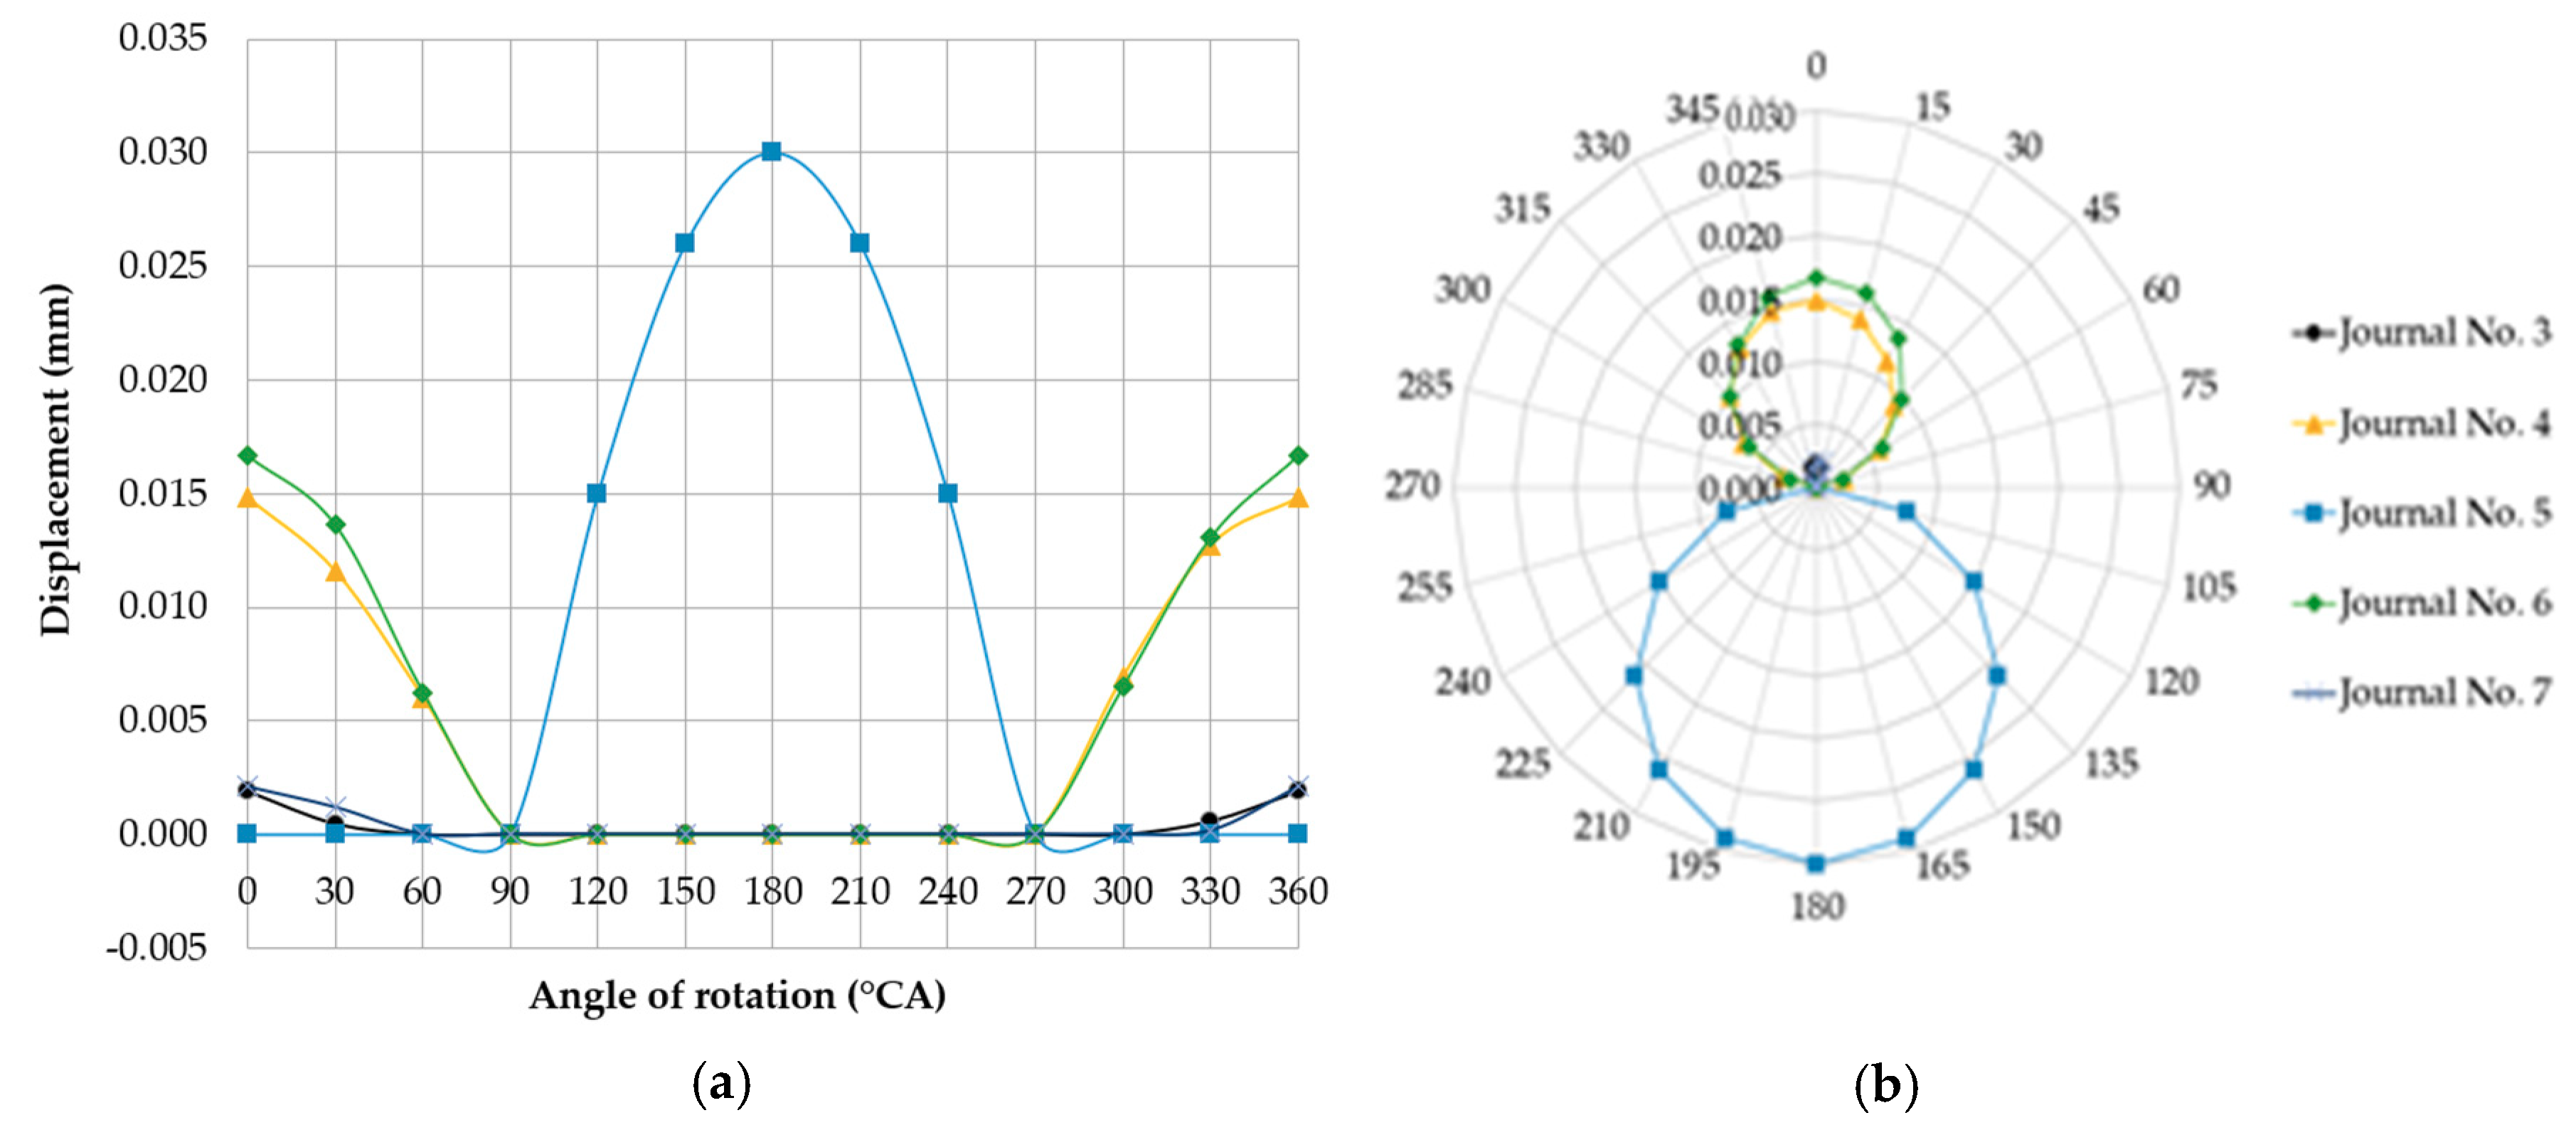
Figure 9.
Changes in deflections measured in the vertical plane at individual main journals with the shaft rotated by 15° at a time and when one of the supports (of journal no. 5 counting from the timing gear end) was offset downwards by 0.03 mm relative to the others, in the (a) Cartesian and (b) polar coordinate systems.
Figure 10.
Changes in deflections measured in the vertical plane at individual main journals with the shaft changed by 15° at a time, and when one of the main journal axes (of journal no. 5 counting from the timing gear end) was offset eccentrically upwards by 0.03 mm relative to the others, shown in the (a) Cartesian and (b) polar coordinate systems.
Figure 11.
Changes in deflections measured in the vertical plane at individual main journals, when one of the main journal axes (no. 5 counting from the timing gear end) was offset eccentrically downwards by 0.03 mm relative to the others, shown in the (a) Cartesian and (b) polar coordinate systems.
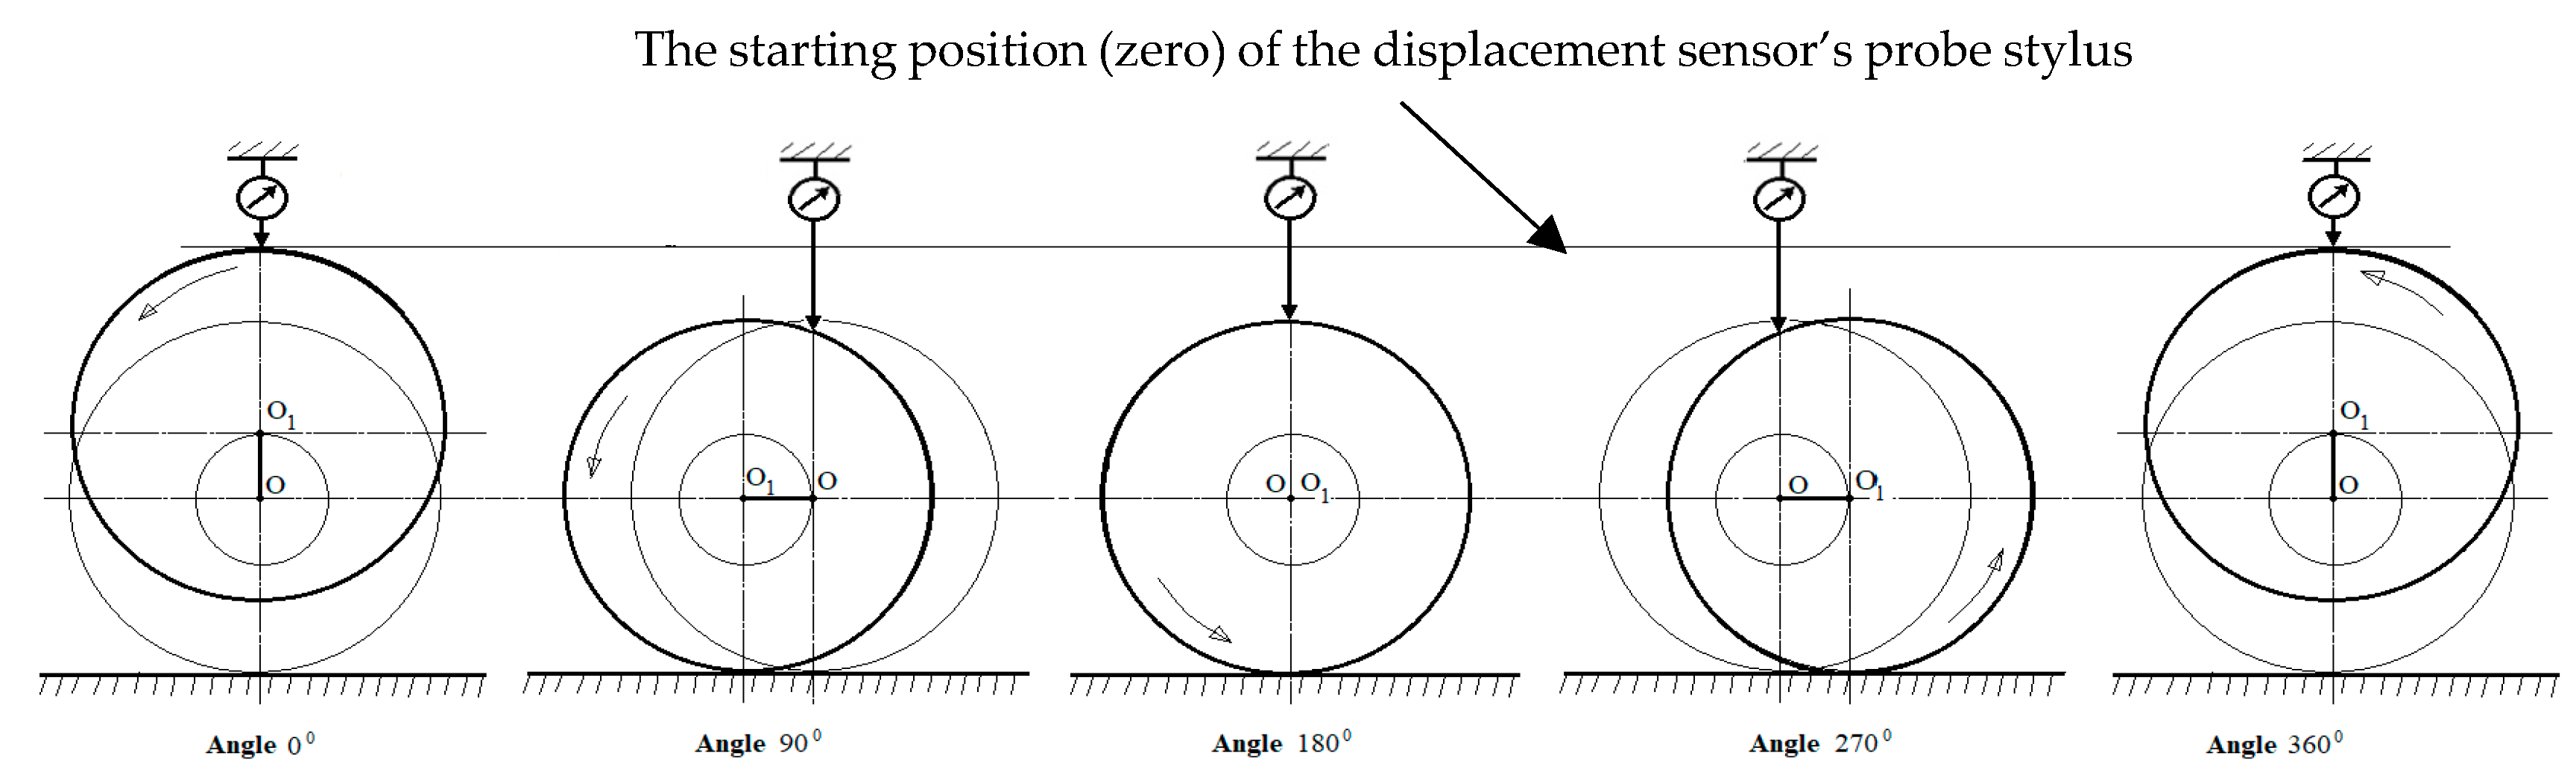
Figure 12.
Supplementary diagram of the successive stages of shaft deflection caused by its eccentricity with respect to the axis of rotation of the measuring system when the support retains its fixed height.
Figure 12.
Supplementary diagram of the successive stages of shaft deflection caused by its eccentricity with respect to the axis of rotation of the measuring system when the support retains its fixed height.
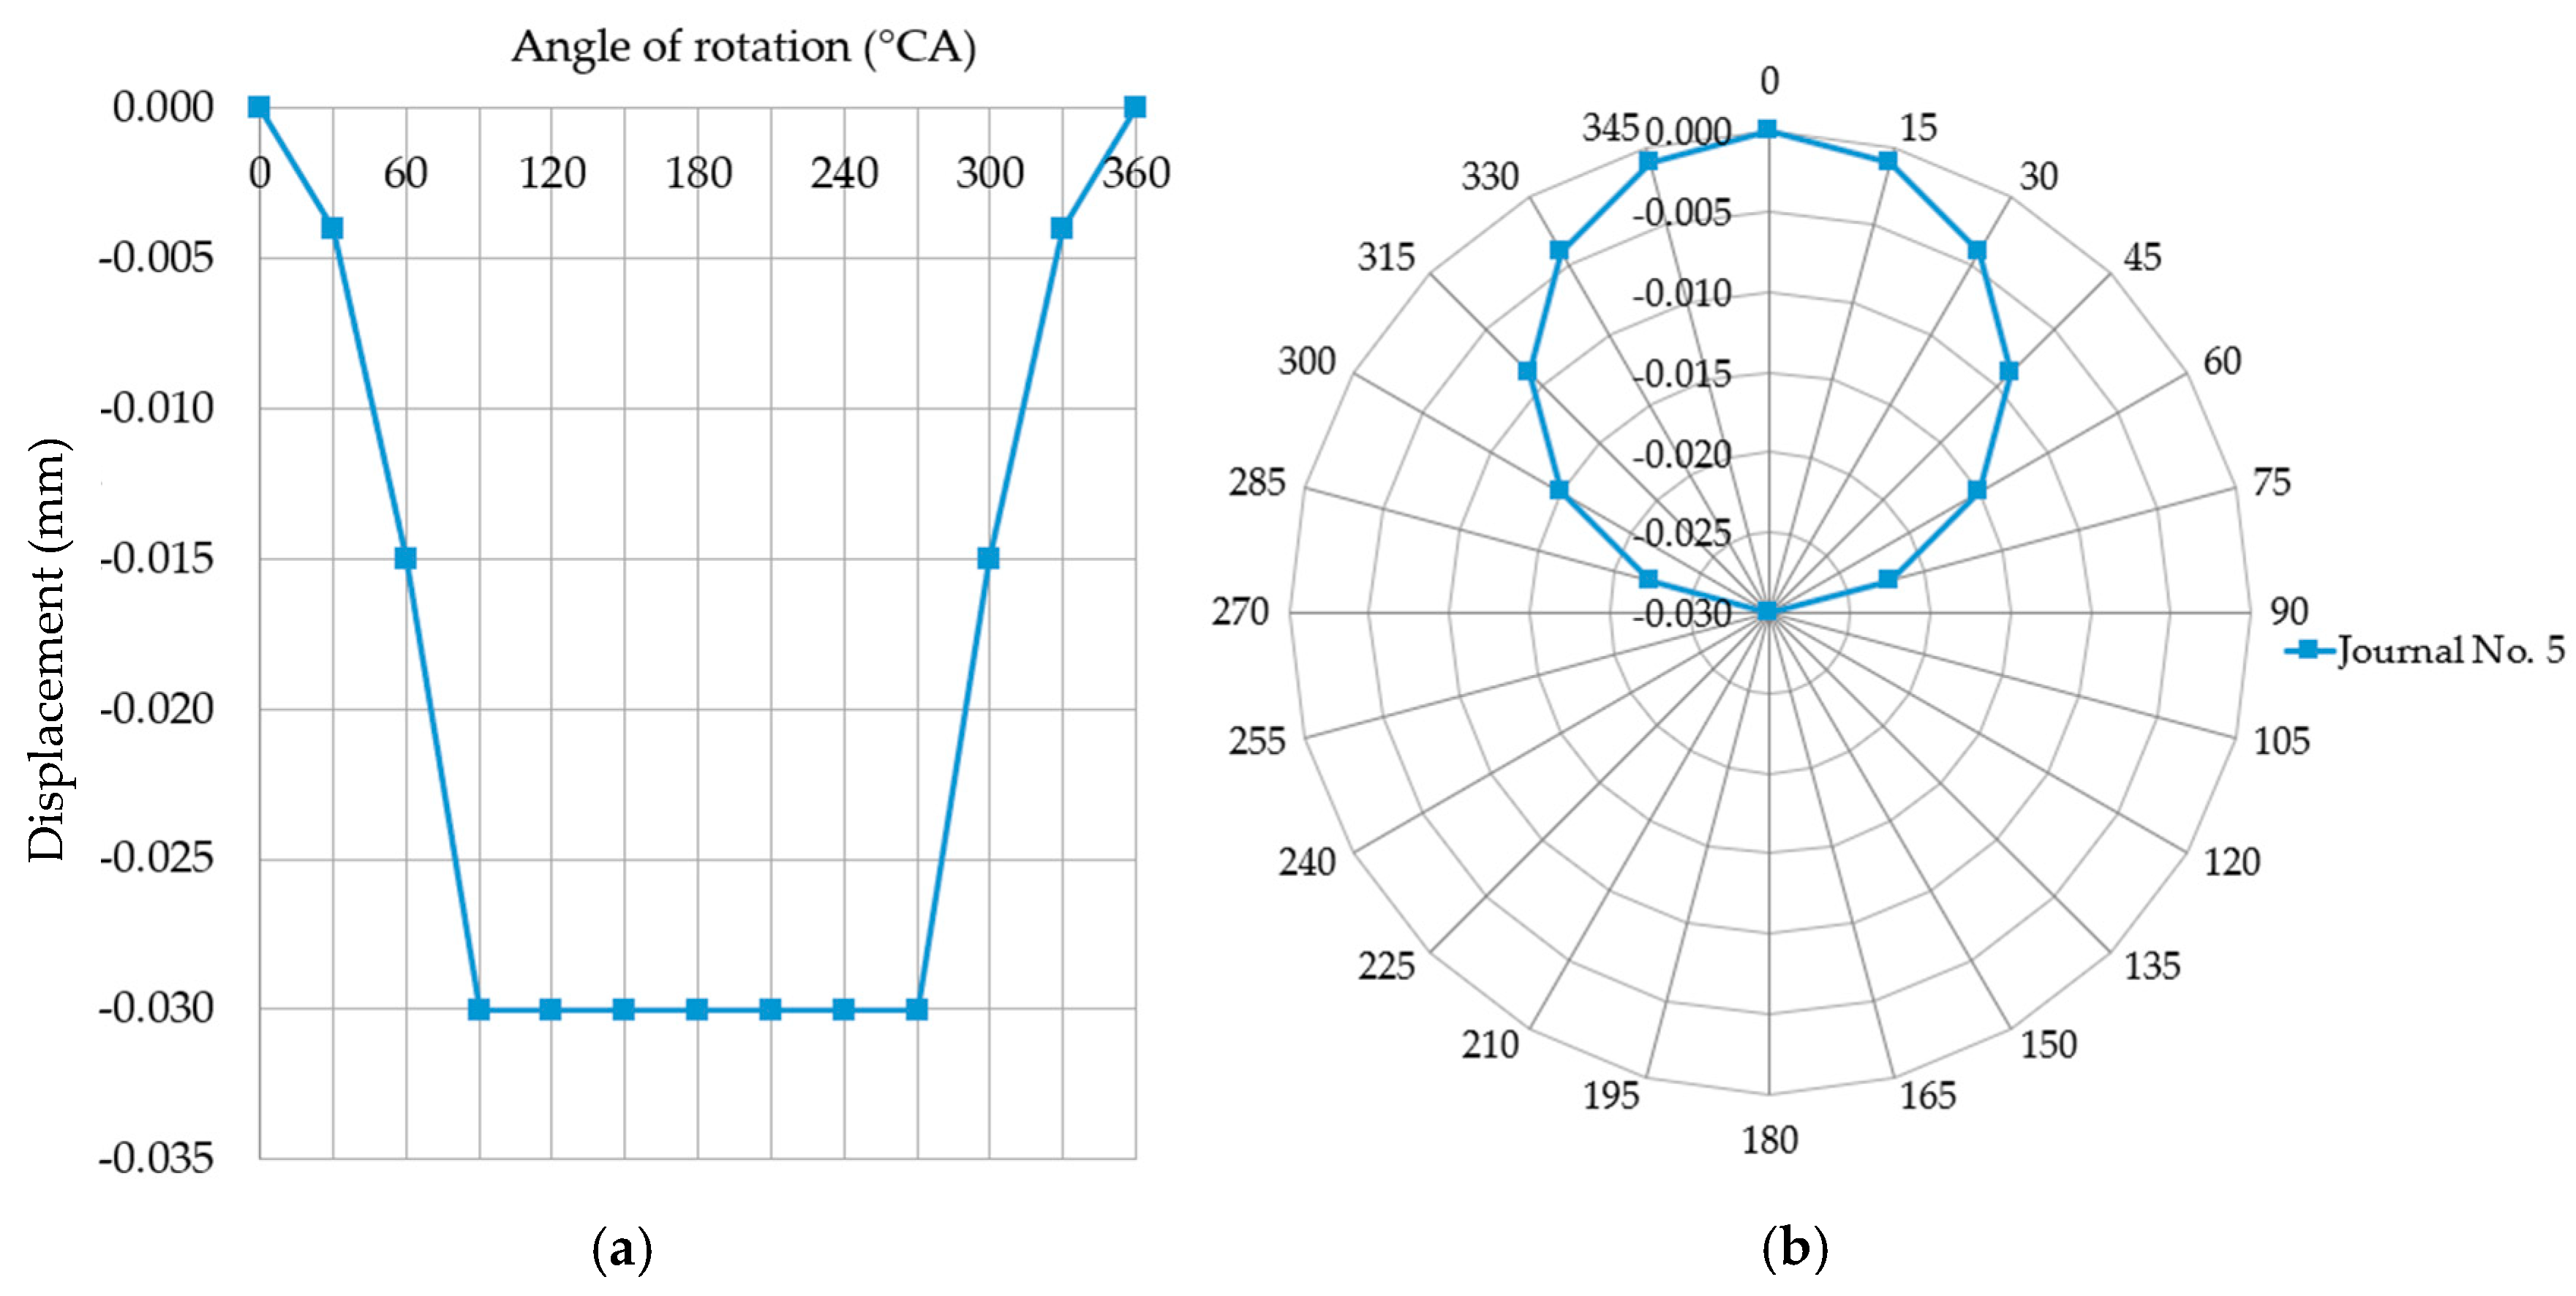
Figure 13.
The journal displacements measured by the sensor for a full shaft rotation (0°–360° angle) are recorded when the support maintaining a constant height restricts these displacements, as shown in the (a) Cartesian and (b) polar coordinate systems.
Figure 13.
The journal displacements measured by the sensor for a full shaft rotation (0°–360° angle) are recorded when the support maintaining a constant height restricts these displacements, as shown in the (a) Cartesian and (b) polar coordinate systems.
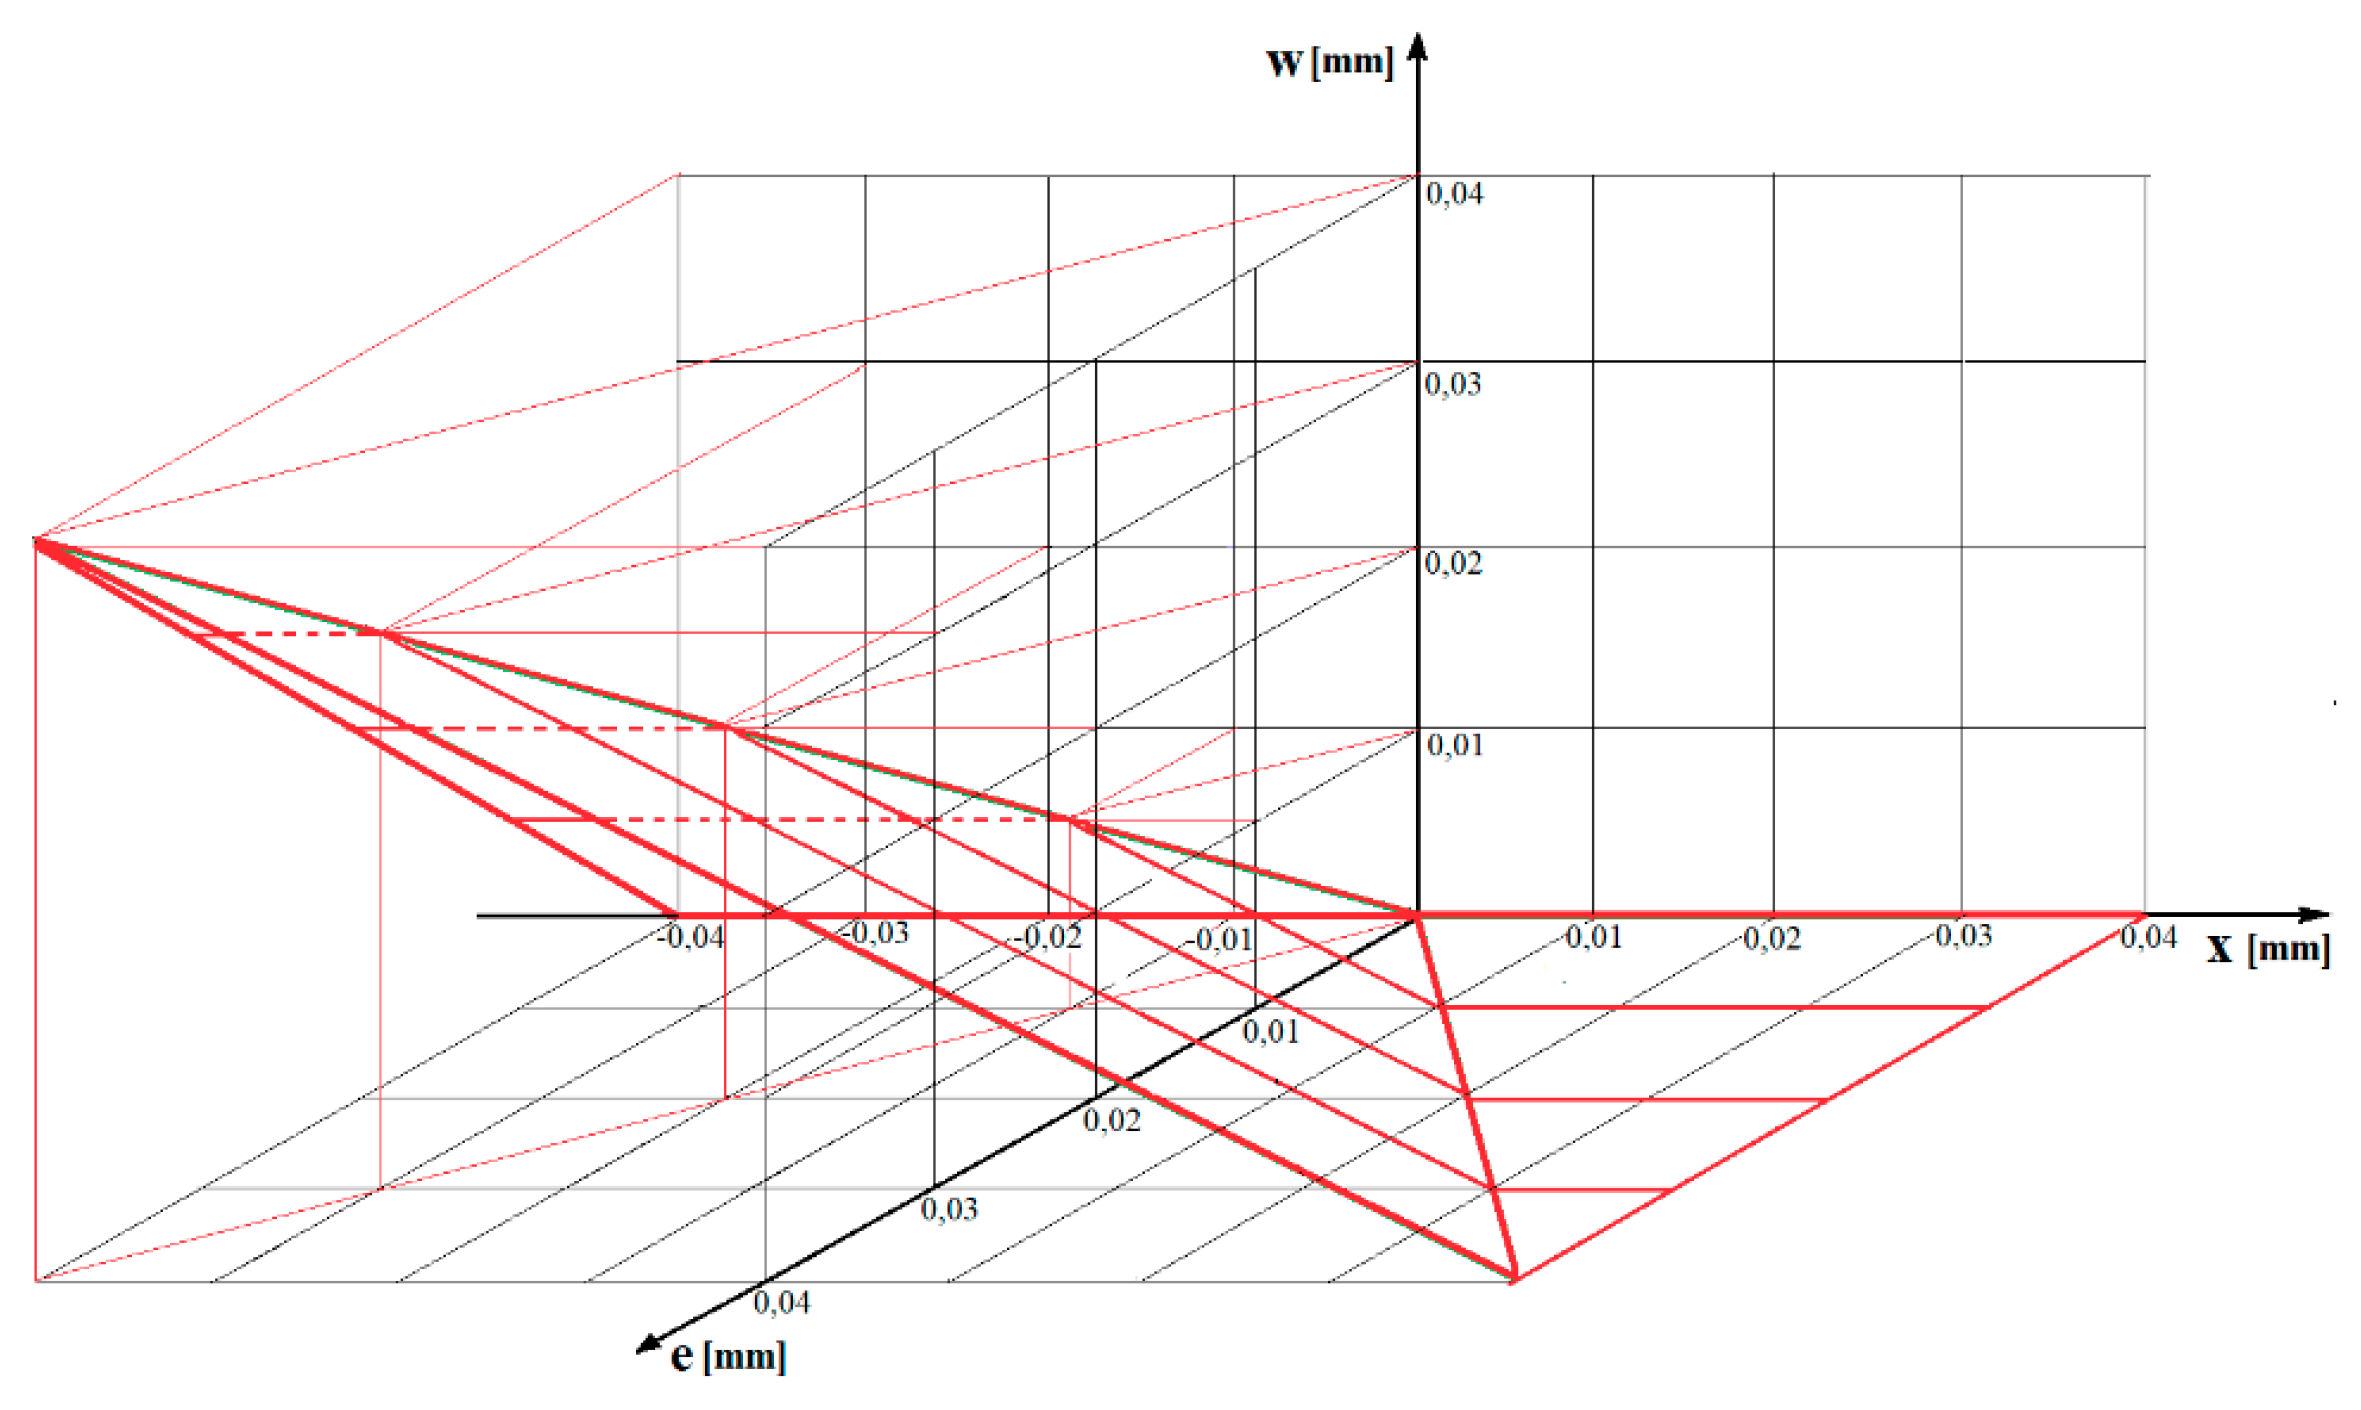
Figure 14.
Graph showing the measurable value w of eccentricity as a function of the vertical position of the support.
Figure 14.
Graph showing the measurable value w of eccentricity as a function of the vertical position of the support.
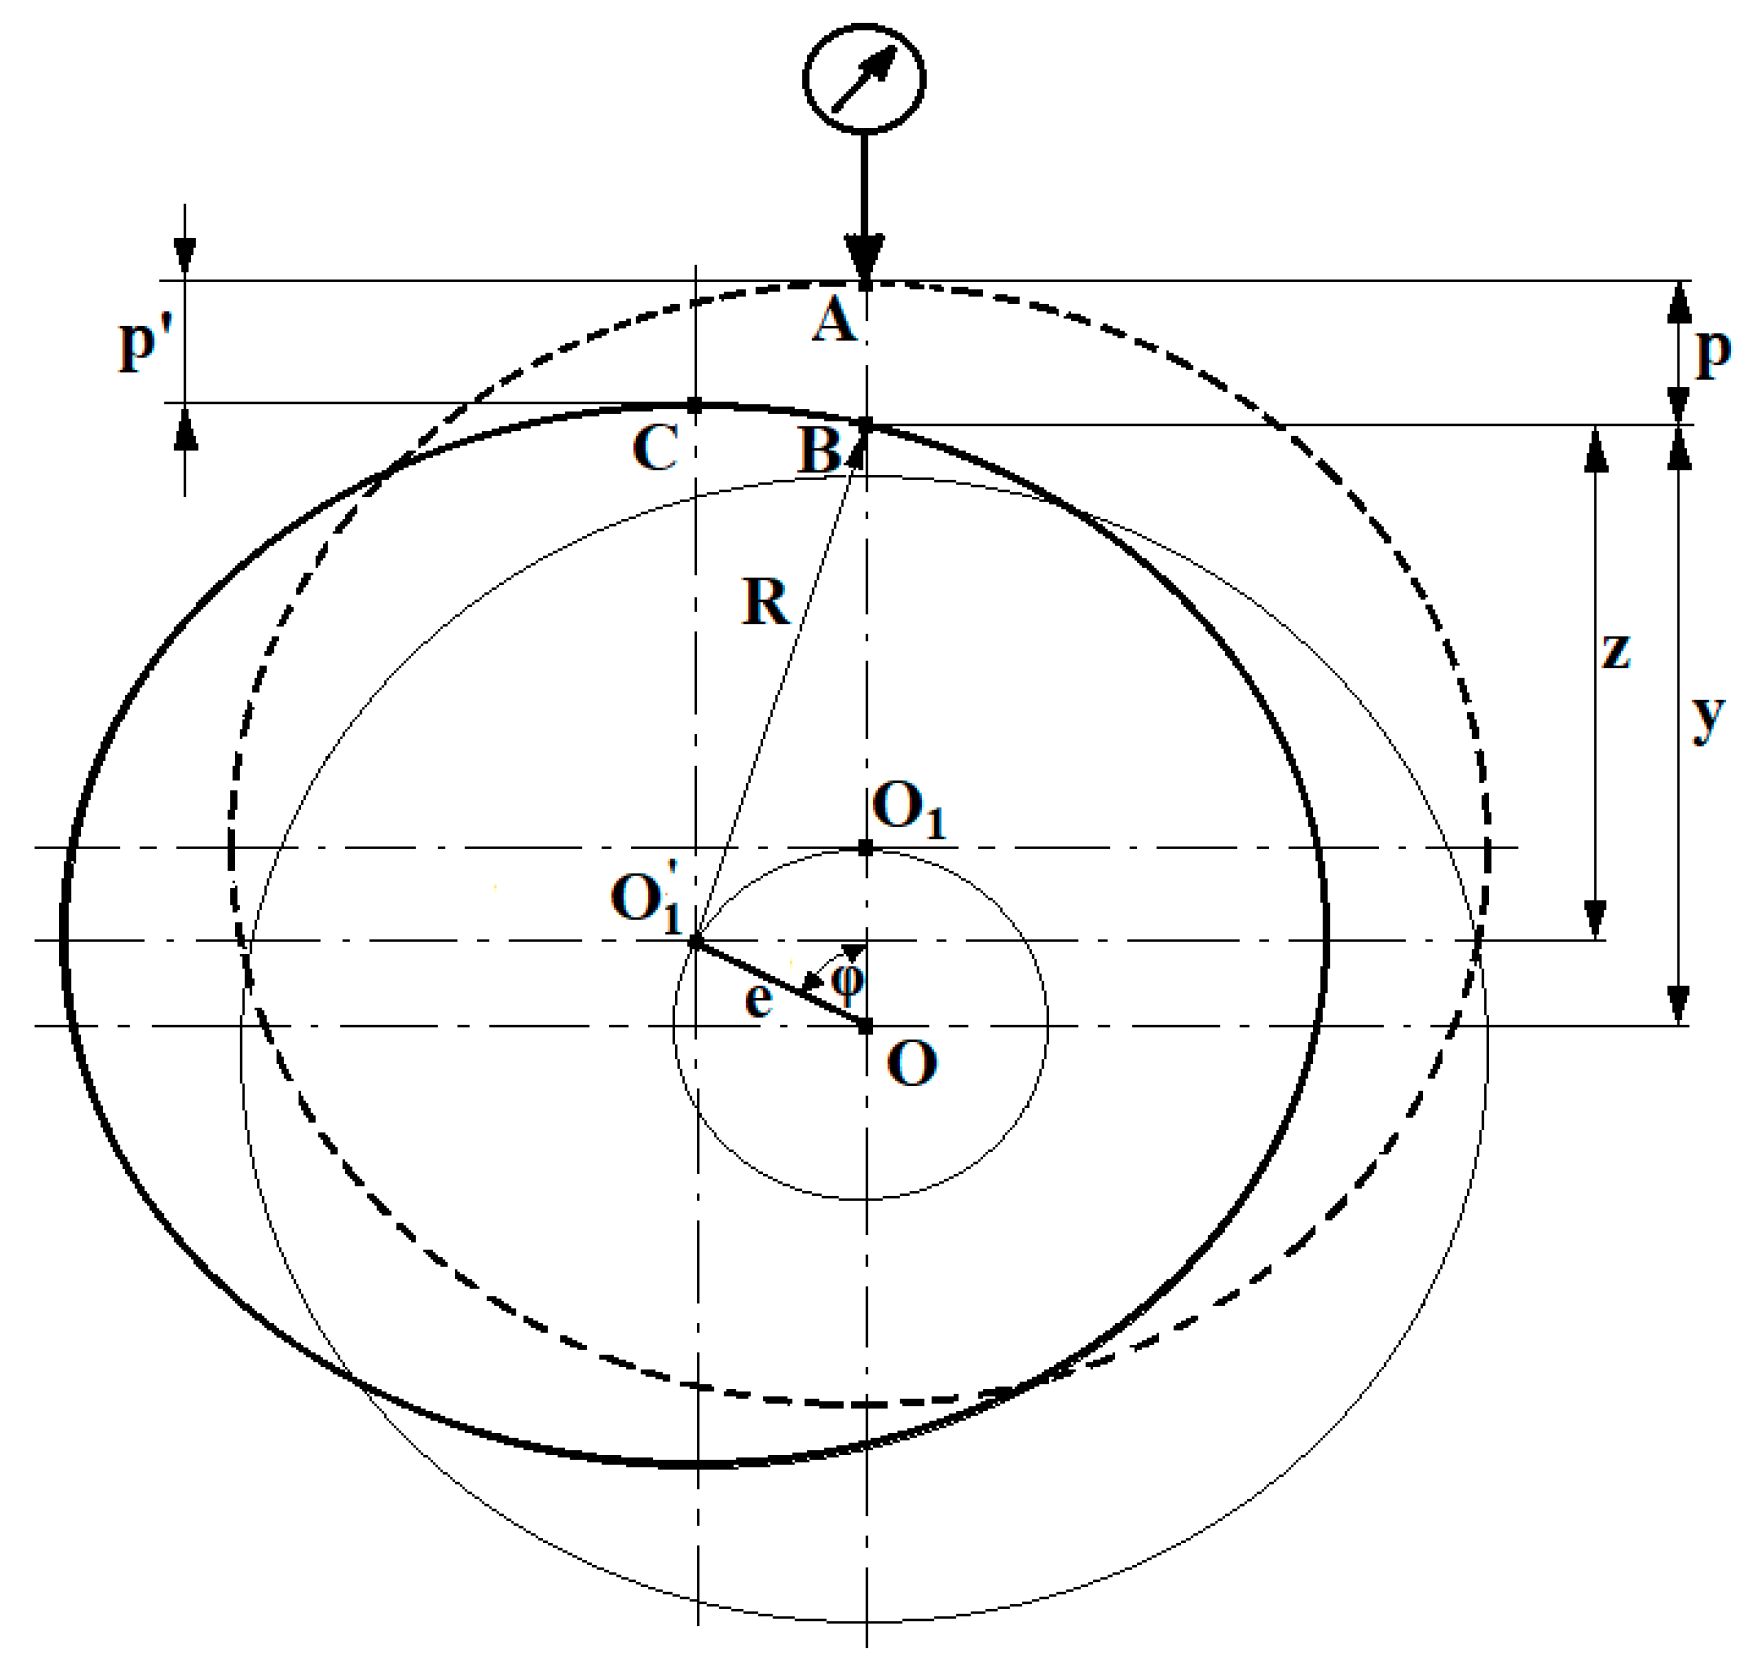
Figure 15.
A supplementary diagram to determine the measurement error caused by a journal’s eccentric displacement when measuring geometric deviations of the shaft.
Figure 15.
A supplementary diagram to determine the measurement error caused by a journal’s eccentric displacement when measuring geometric deviations of the shaft.
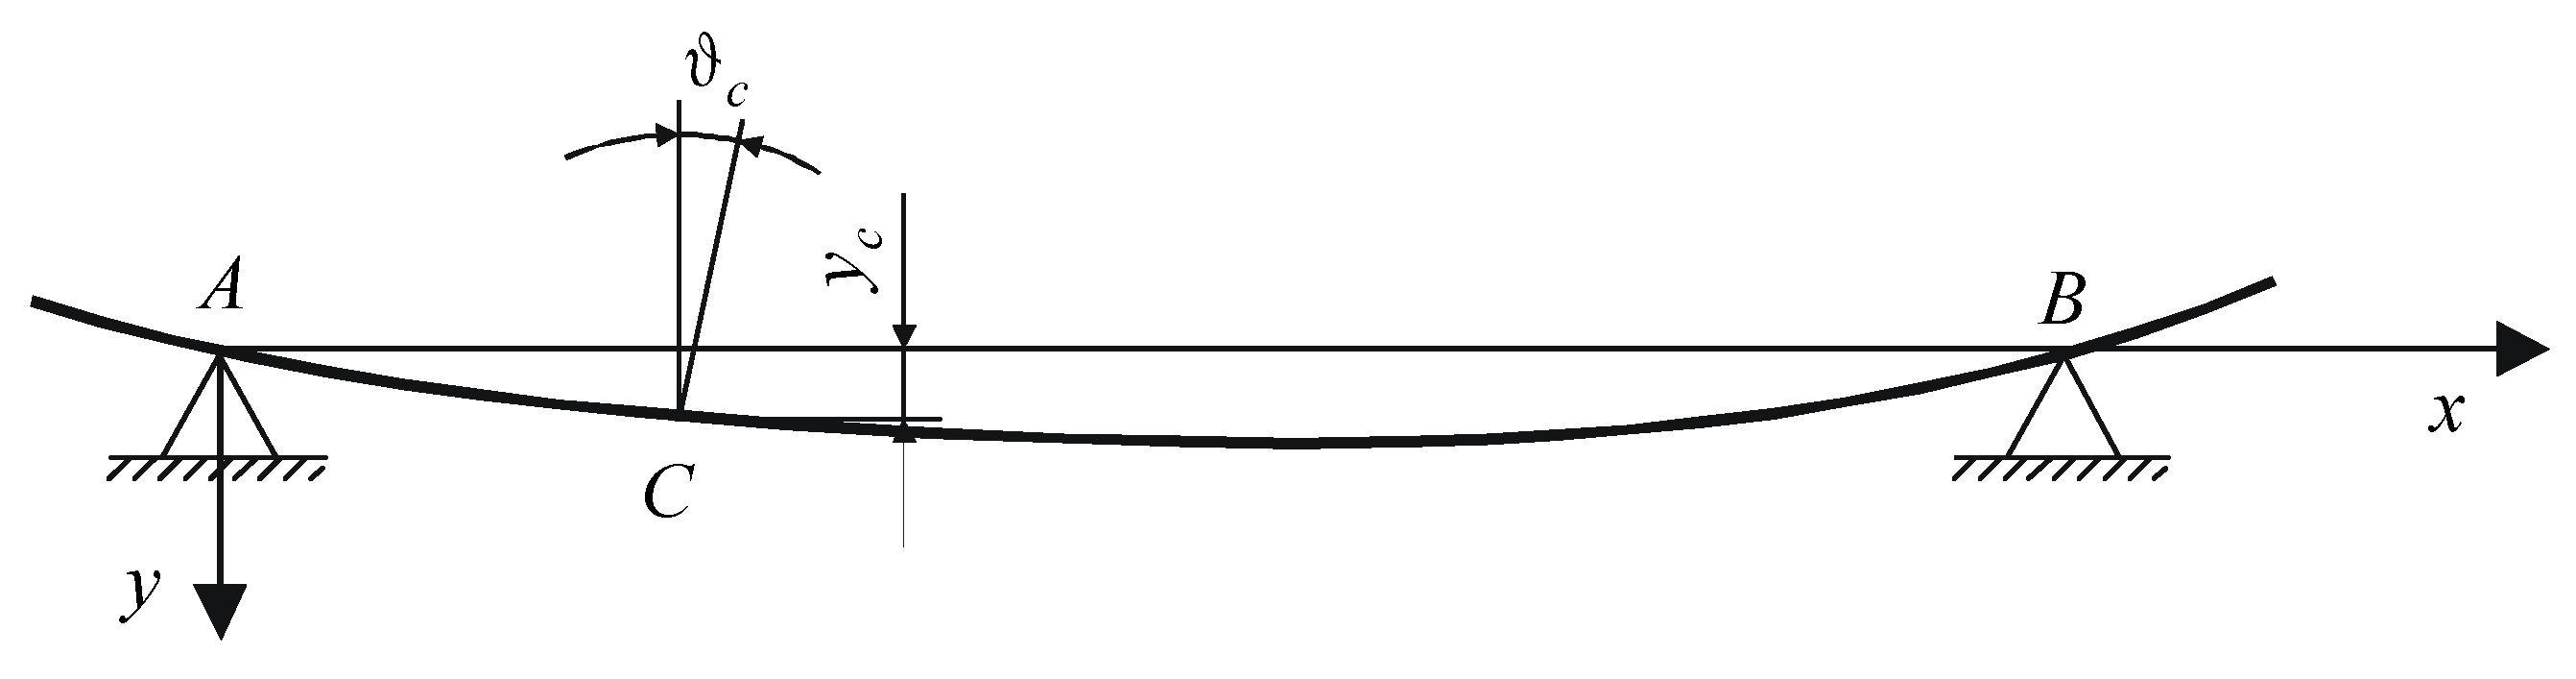
Figure 16.
Deformation of the object supported by two vee-blocks and the linear and angular displacements resulting from this deformation.
Figure 16.
Deformation of the object supported by two vee-blocks and the linear and angular displacements resulting from this deformation.
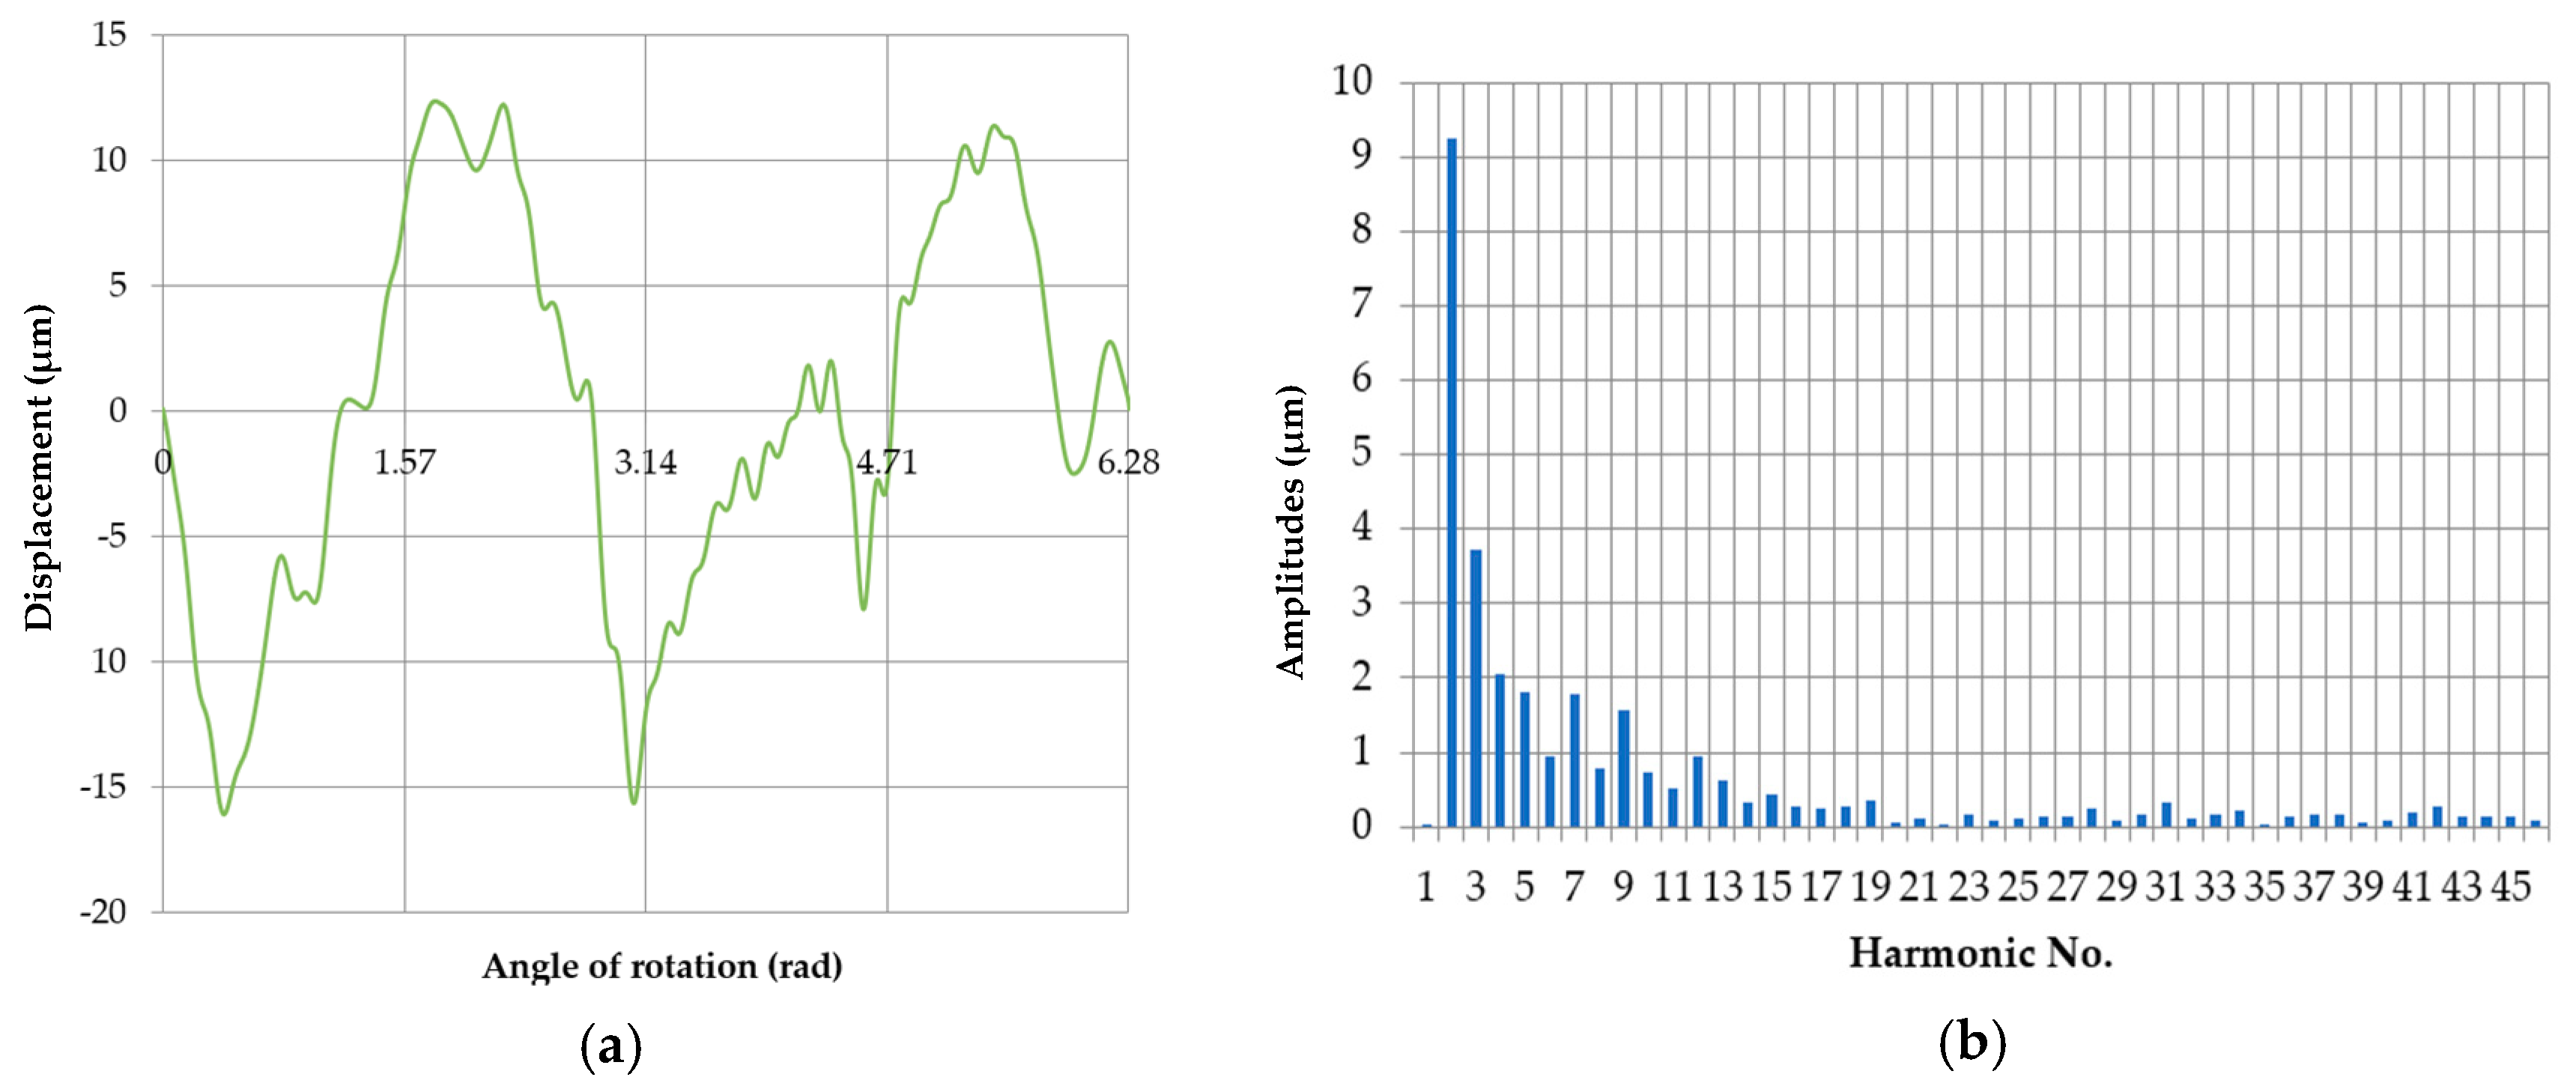
Figure 17.
Roundness profile of journal no. 5 measured by the reference method (a); the discrete amplitude spectrum (b).
Figure 17.
Roundness profile of journal no. 5 measured by the reference method (a); the discrete amplitude spectrum (b).
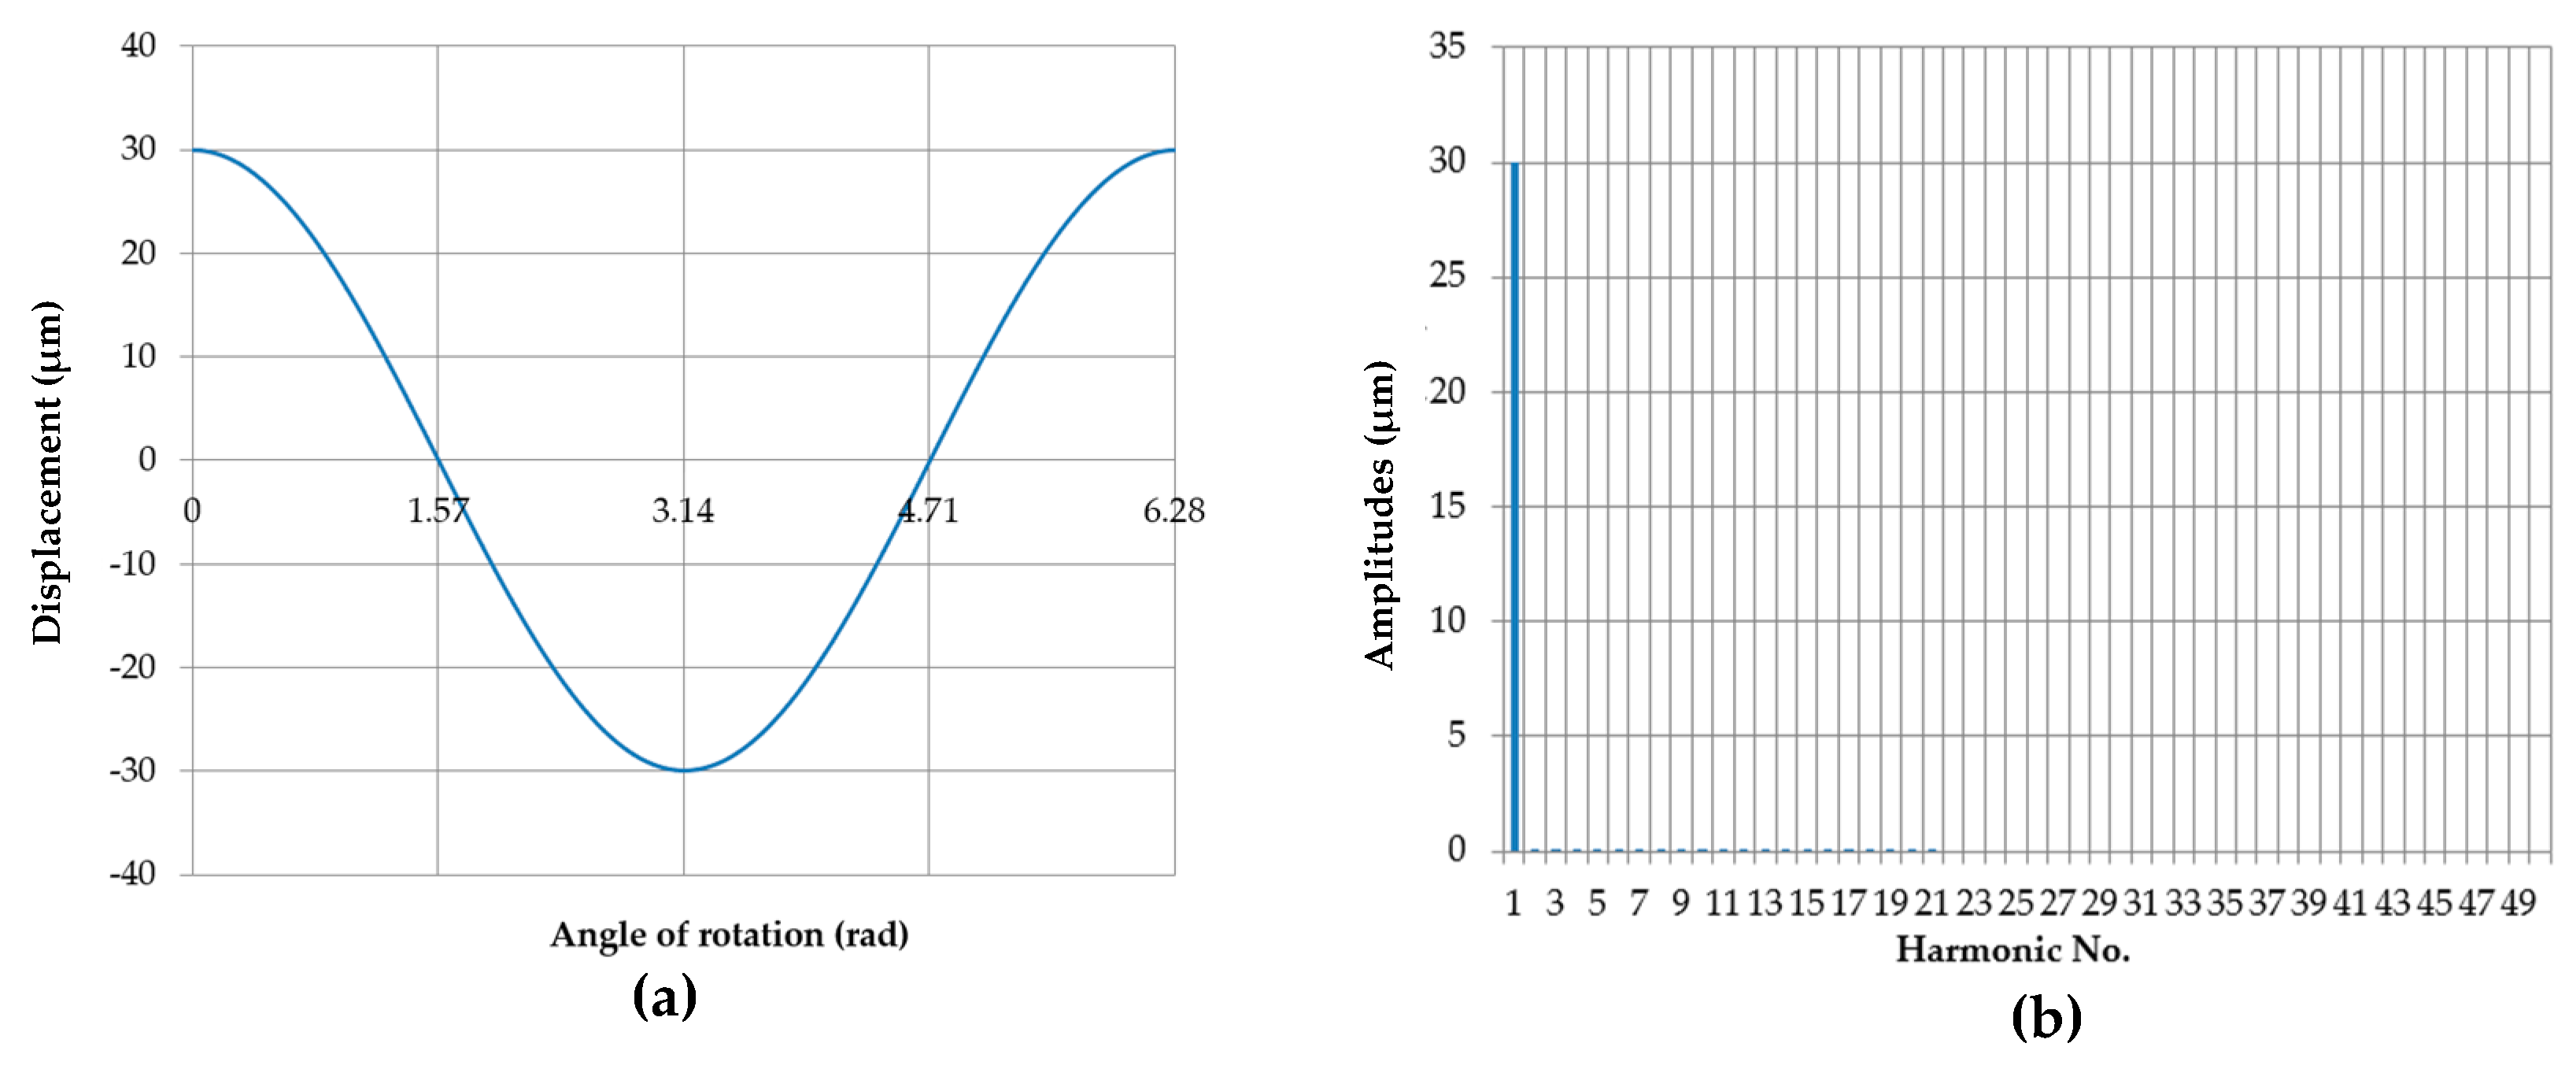
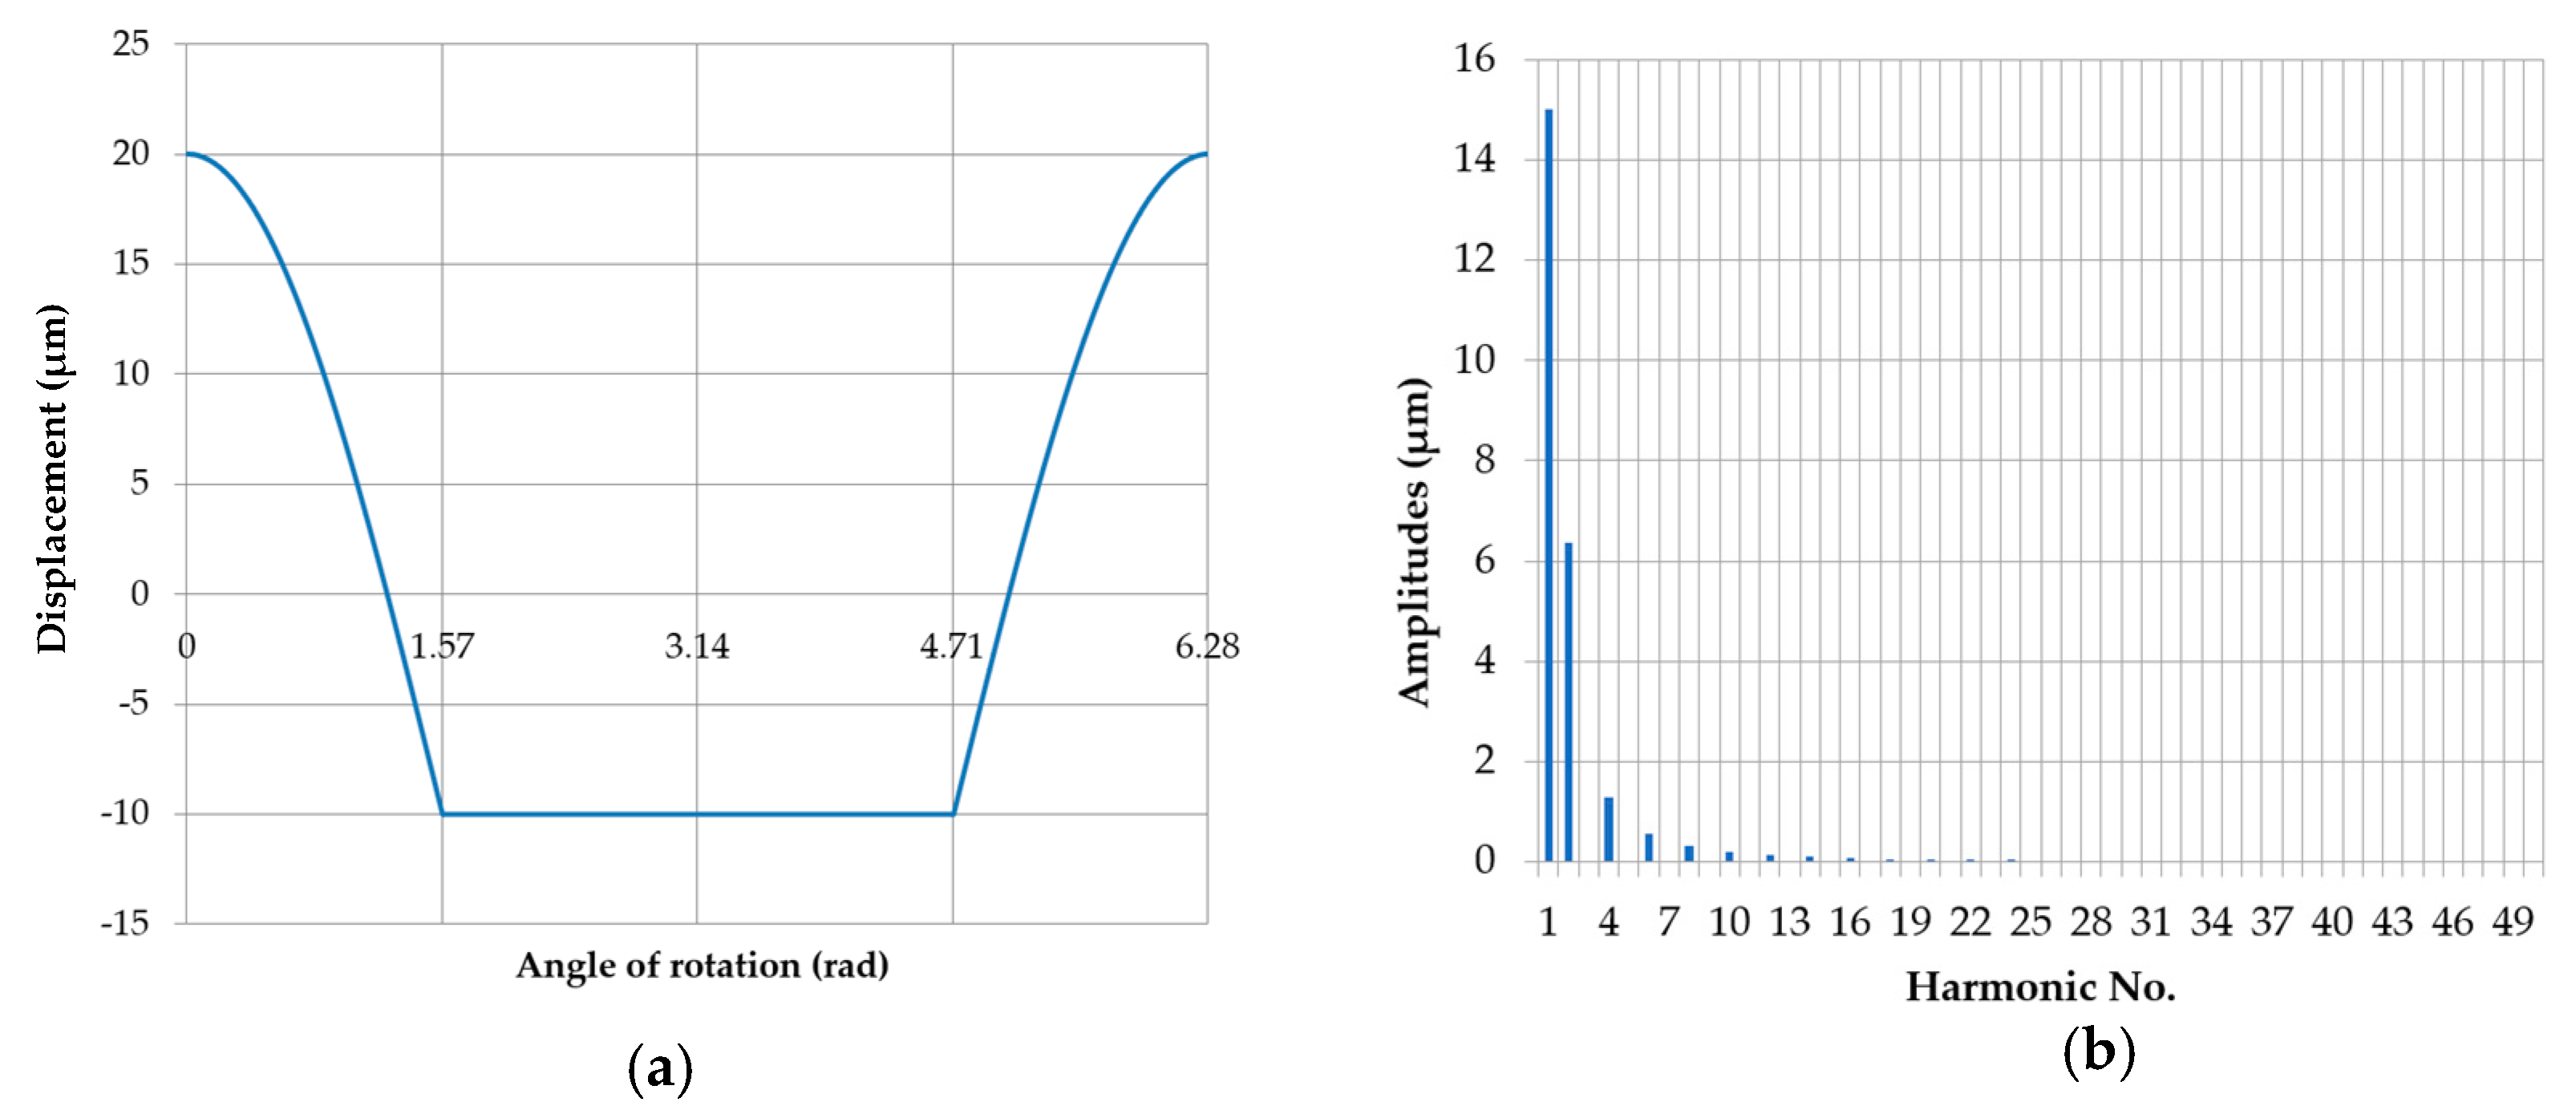
Figure 18.
Eccentric movement profile of the center of the roundness profile being measured. The eccentricity was 0.03 mm, and the support did not limit the shaft displacement (a); discrete amplitude spectrum (b).
Figure 18.
Eccentric movement profile of the center of the roundness profile being measured. The eccentricity was 0.03 mm, and the support did not limit the shaft displacement (a); discrete amplitude spectrum (b).
Figure 19.
Eccentric movement profile of the center of the roundness profile being measured when the supports were set at the same height (), with an eccentricity of the main journal e = 0.03 mm (a); discrete amplitude spectrum (b).
Figure 19.
Eccentric movement profile of the center of the roundness profile being measured when the supports were set at the same height (), with an eccentricity of the main journal e = 0.03 mm (a); discrete amplitude spectrum (b).
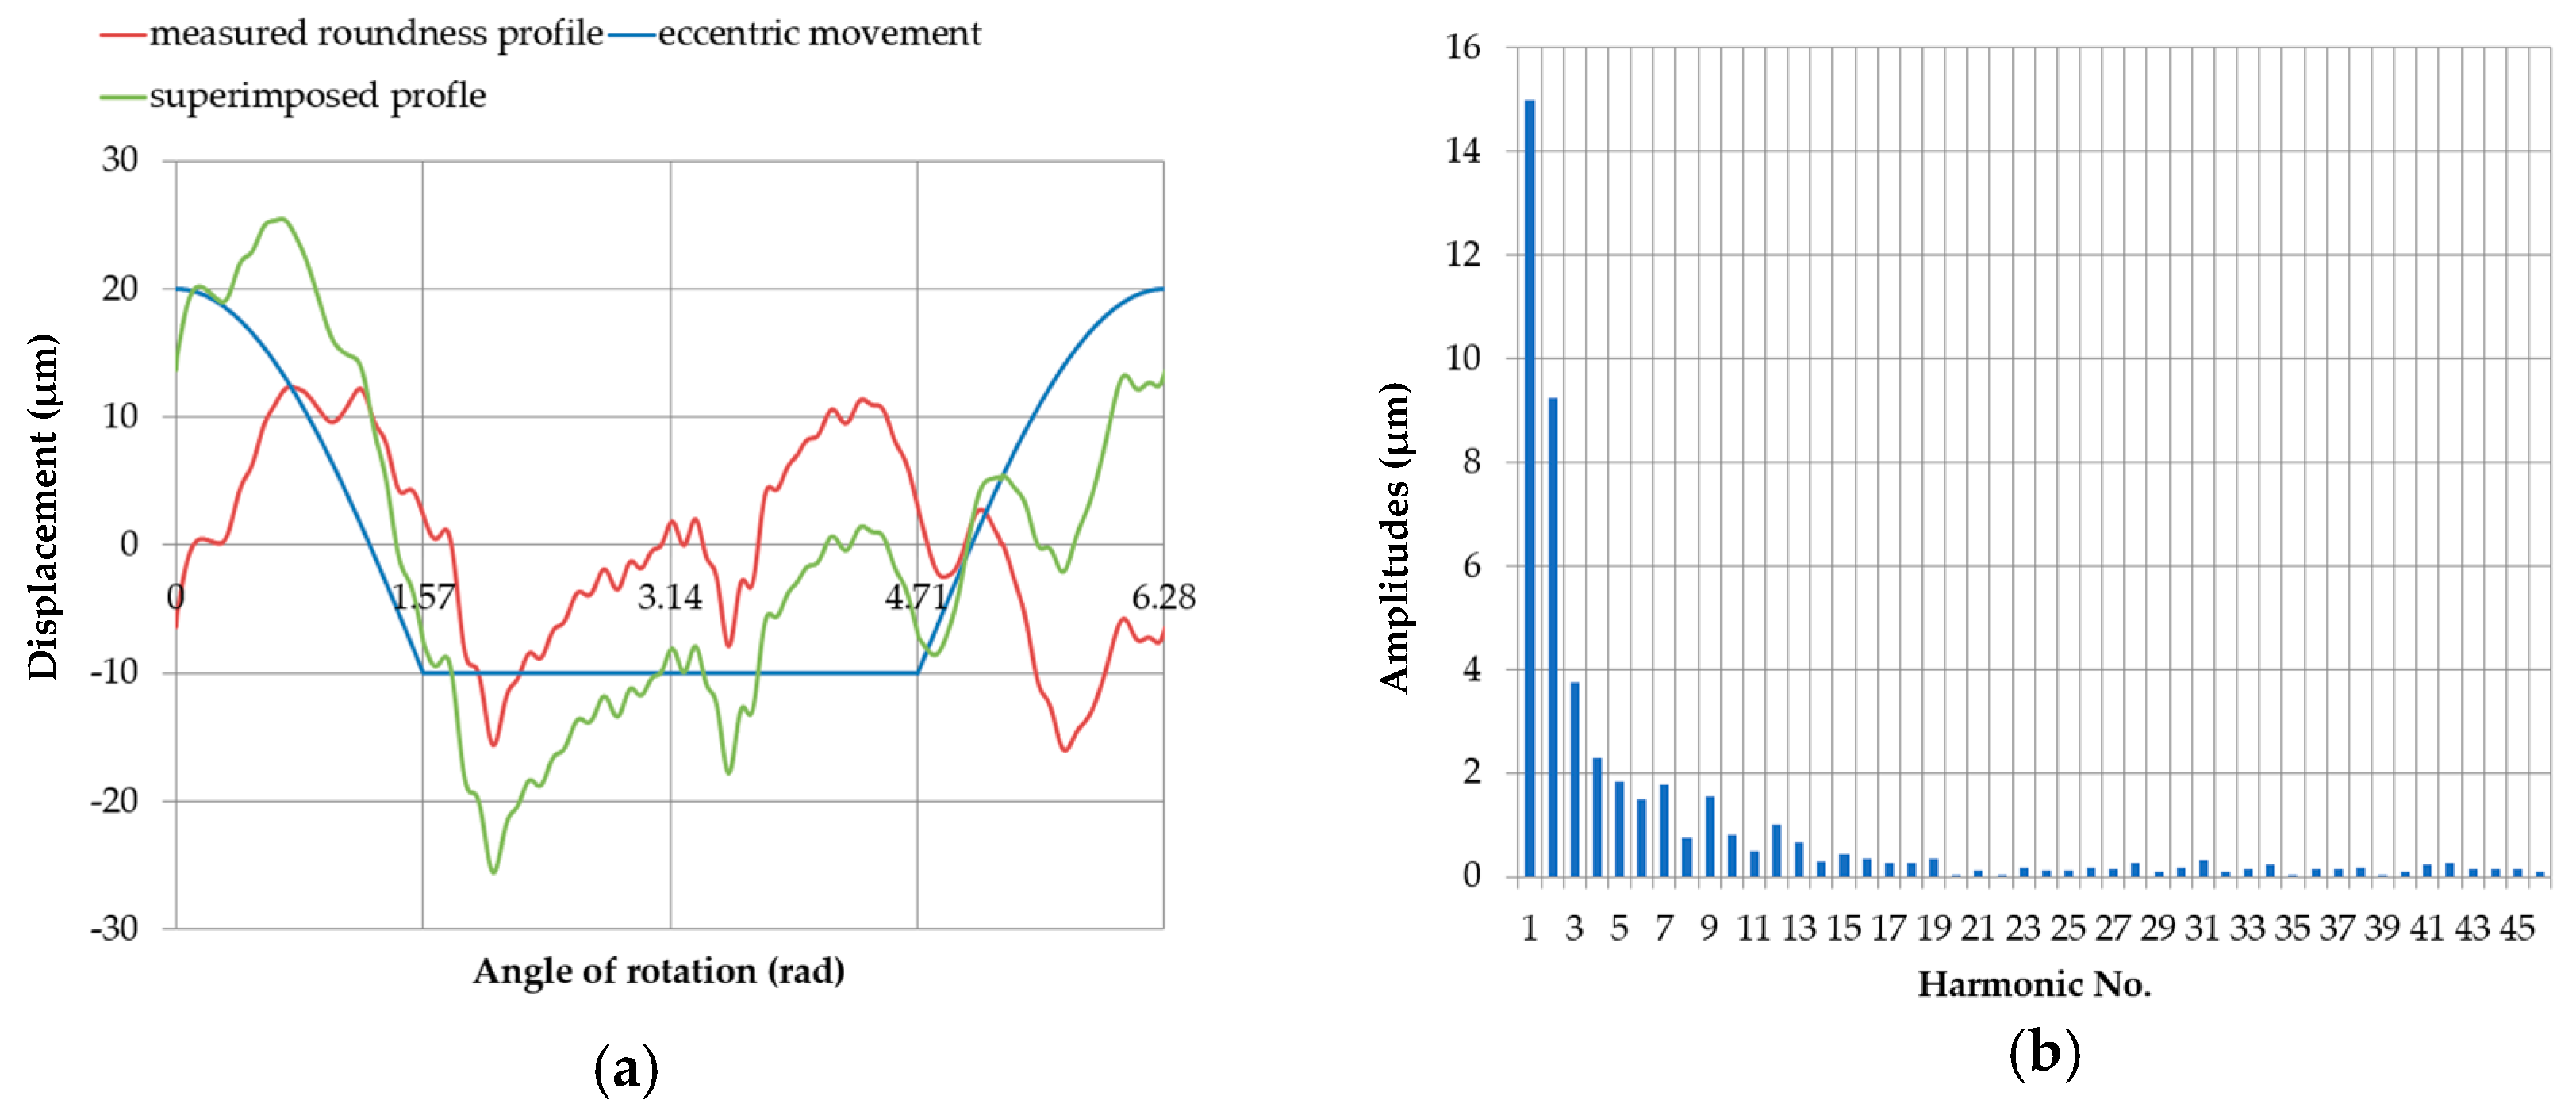
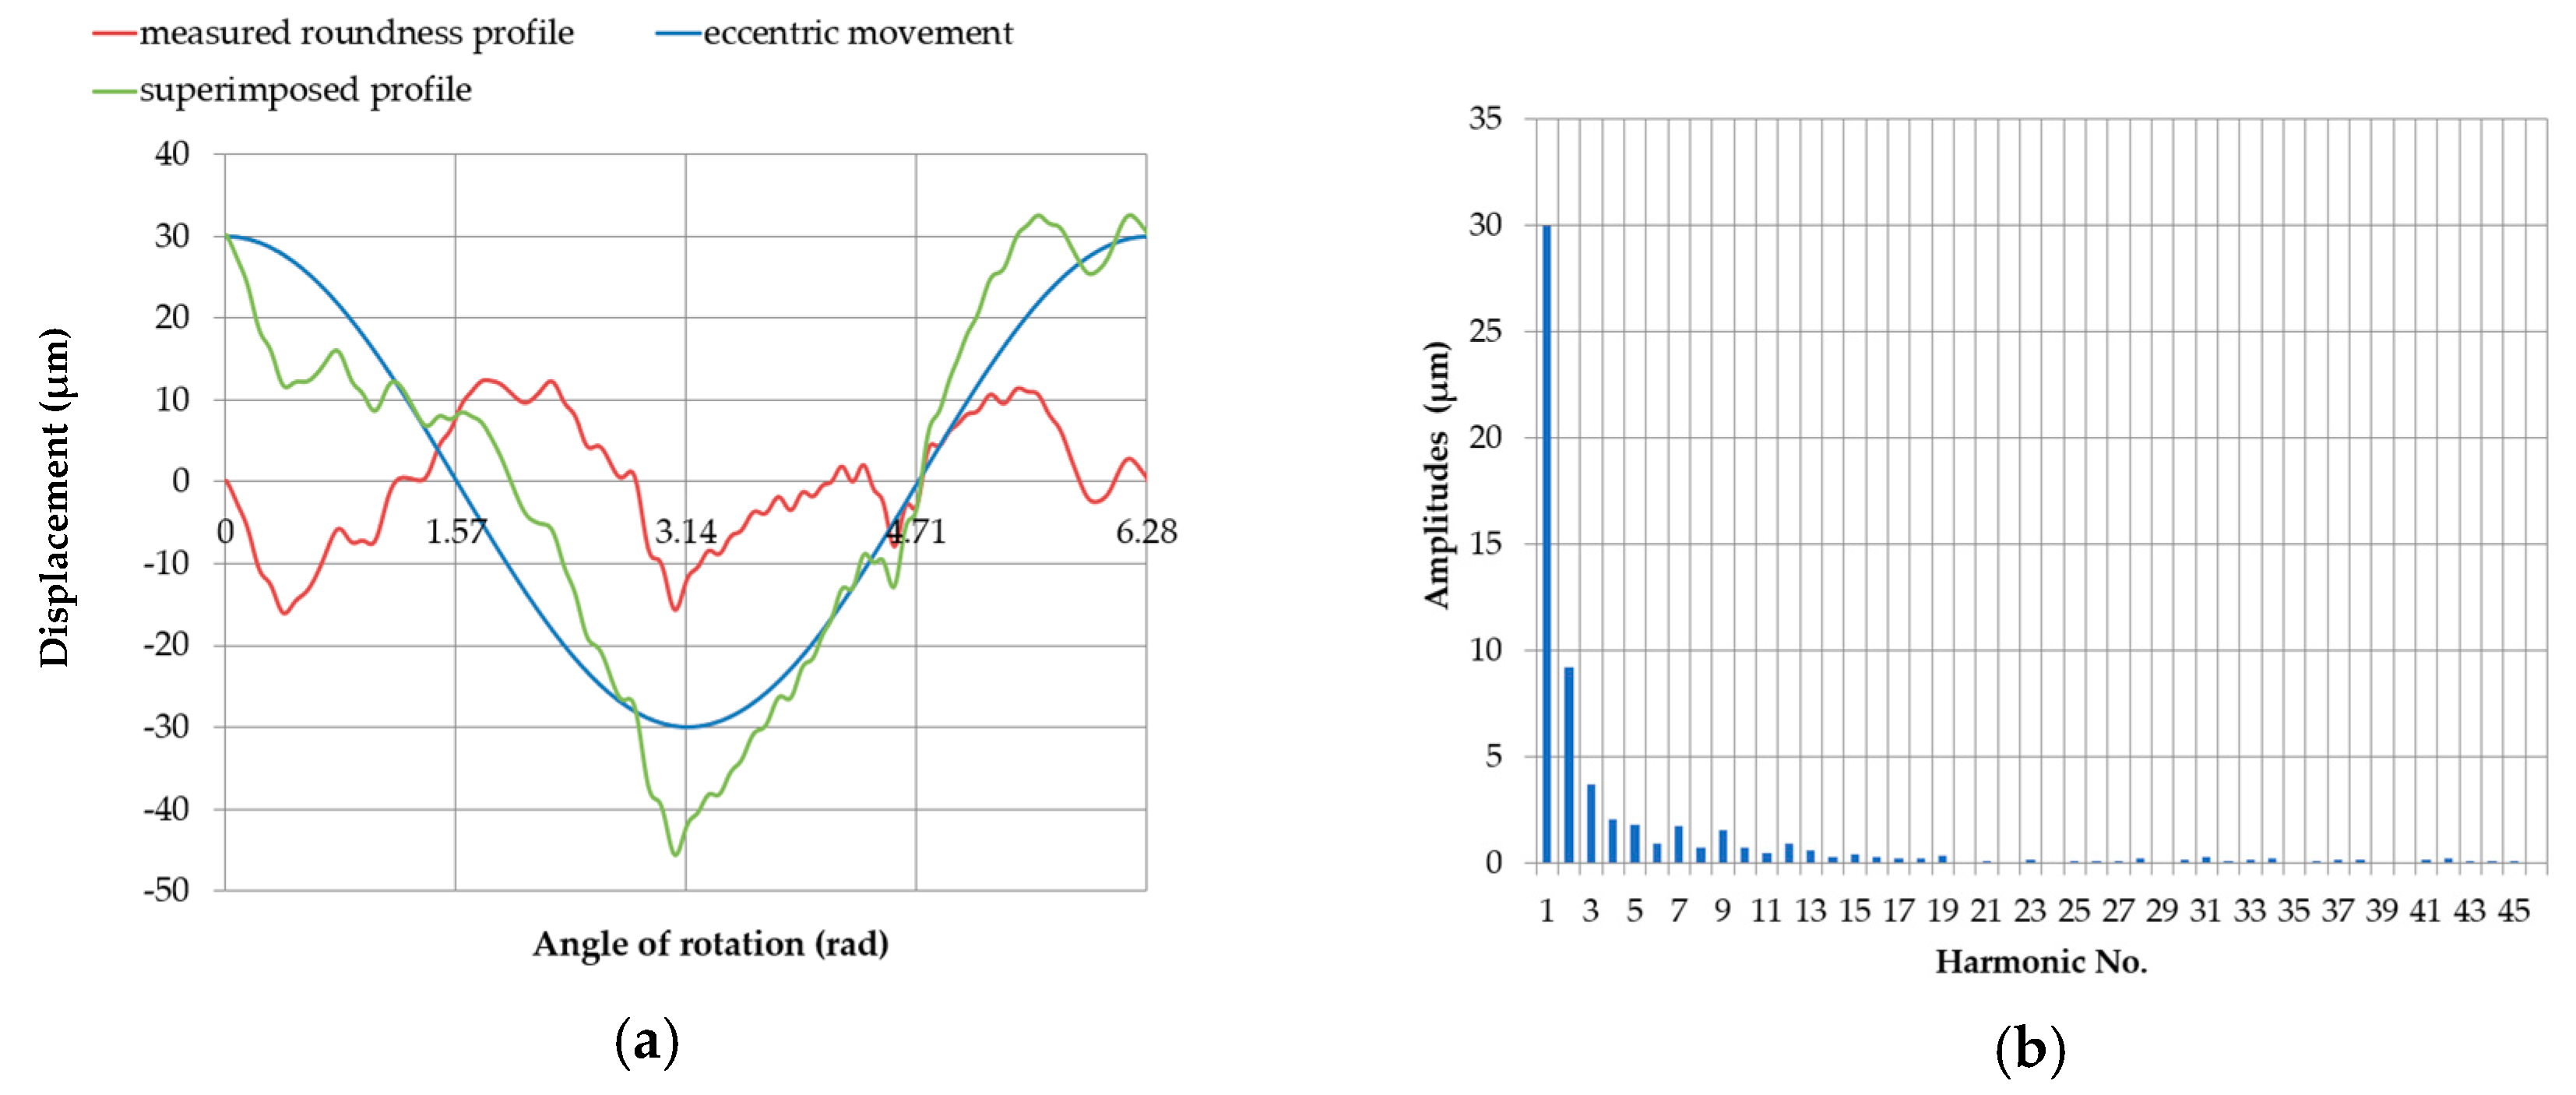
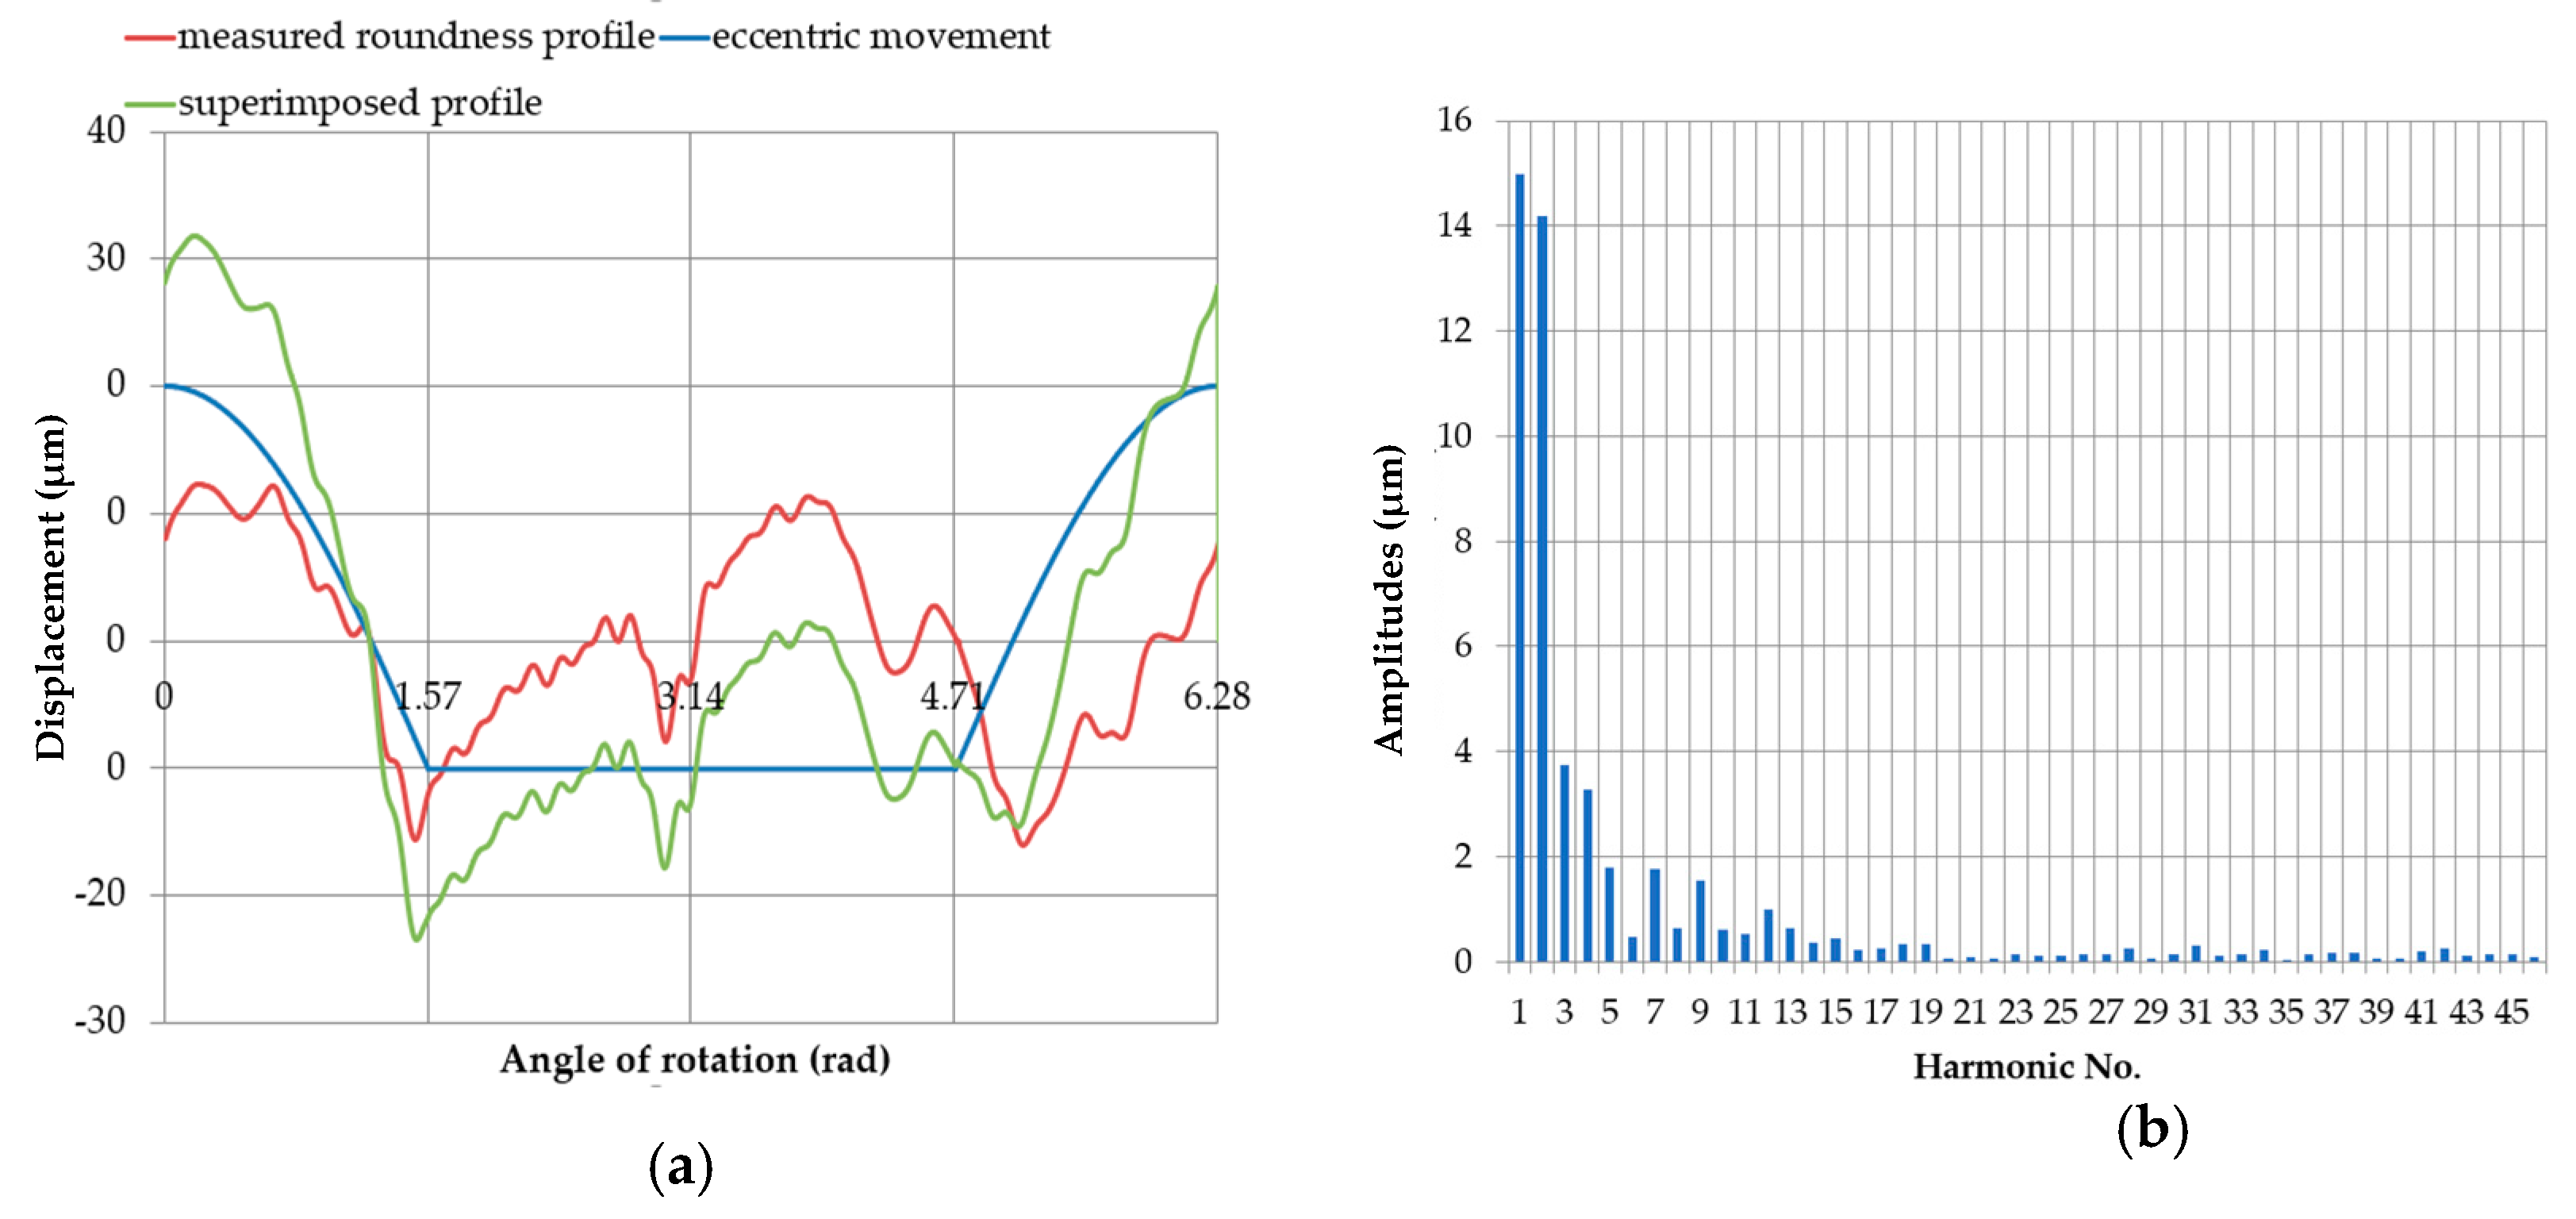
Figure 20.
The profile obtained by superimposing the measured roundness profile of journal no. 5 on the full profile of the eccentric movement of the measured roundness profile center (a); discrete amplitude spectrum of the superimposed profile (b).
Figure 20.
The profile obtained by superimposing the measured roundness profile of journal no. 5 on the full profile of the eccentric movement of the measured roundness profile center (a); discrete amplitude spectrum of the superimposed profile (b).
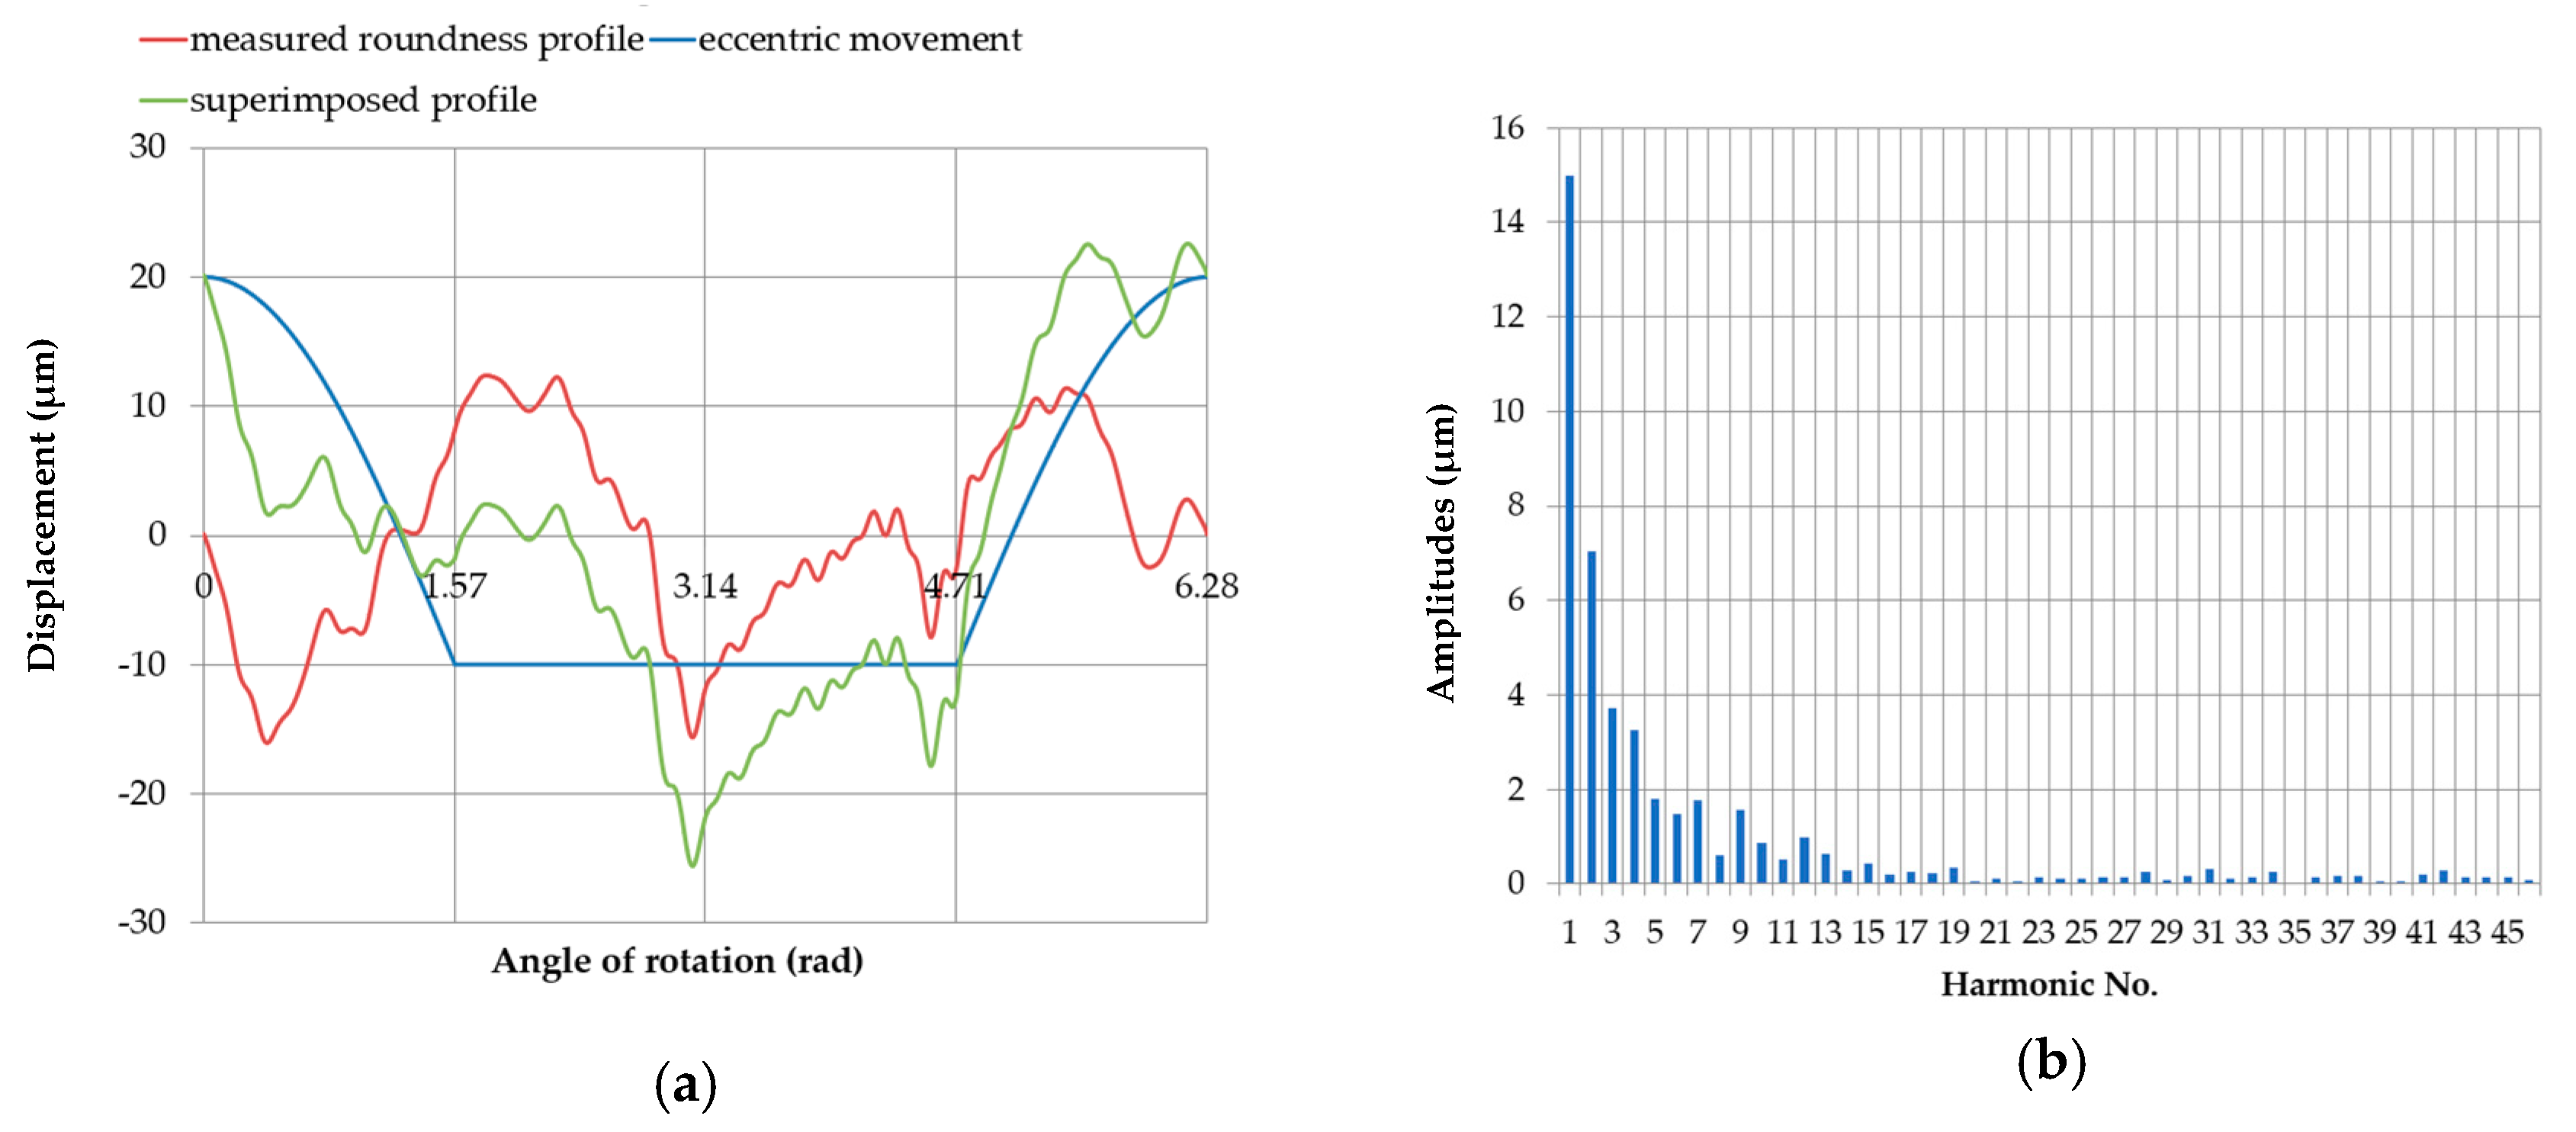
Figure 21.
Profile obtained by superimposing the measured roundness profile of journal no. 5 on the eccentric movement profile of the center of the measured roundness profile with the supports set at the same height (), with an eccentricity of the main journal e = 0.03 mm (a); discrete amplitude spectrum of the superimposed profile (b).
Figure 22.
Profile obtained by superimposing the measured roundness profile of journal no. 5—rotated by 60° with respect to the reference profile—onto the profile of the eccentric movement of the center of the measured roundness profile, with the supports set at the same height (); with an eccentricity of the main journal (a); discrete amplitude spectrum of the superimposed profile (b).
Figure 23.
Profile obtained by superimposing the measured roundness profile of journal no. 5 (green)—rotated by 90° with respect to the reference profile—onto the eccentric movement profile of the center of the measured roundness profile (blue), with the supports set at the same height (x = 0 mm), with an eccentricity of the main journal (a); discrete amplitude spectrum of the superimposed profile (b).
Figure 24.
Measured and theoretical profiles (excluding harmonic component no. 1) obtained by superimposing the measured roundness profile of journal no. 5 onto the full eccentric movement profile of the center of the measured roundness profile.
Figure 24.
Measured and theoretical profiles (excluding harmonic component no. 1) obtained by superimposing the measured roundness profile of journal no. 5 onto the full eccentric movement profile of the center of the measured roundness profile.
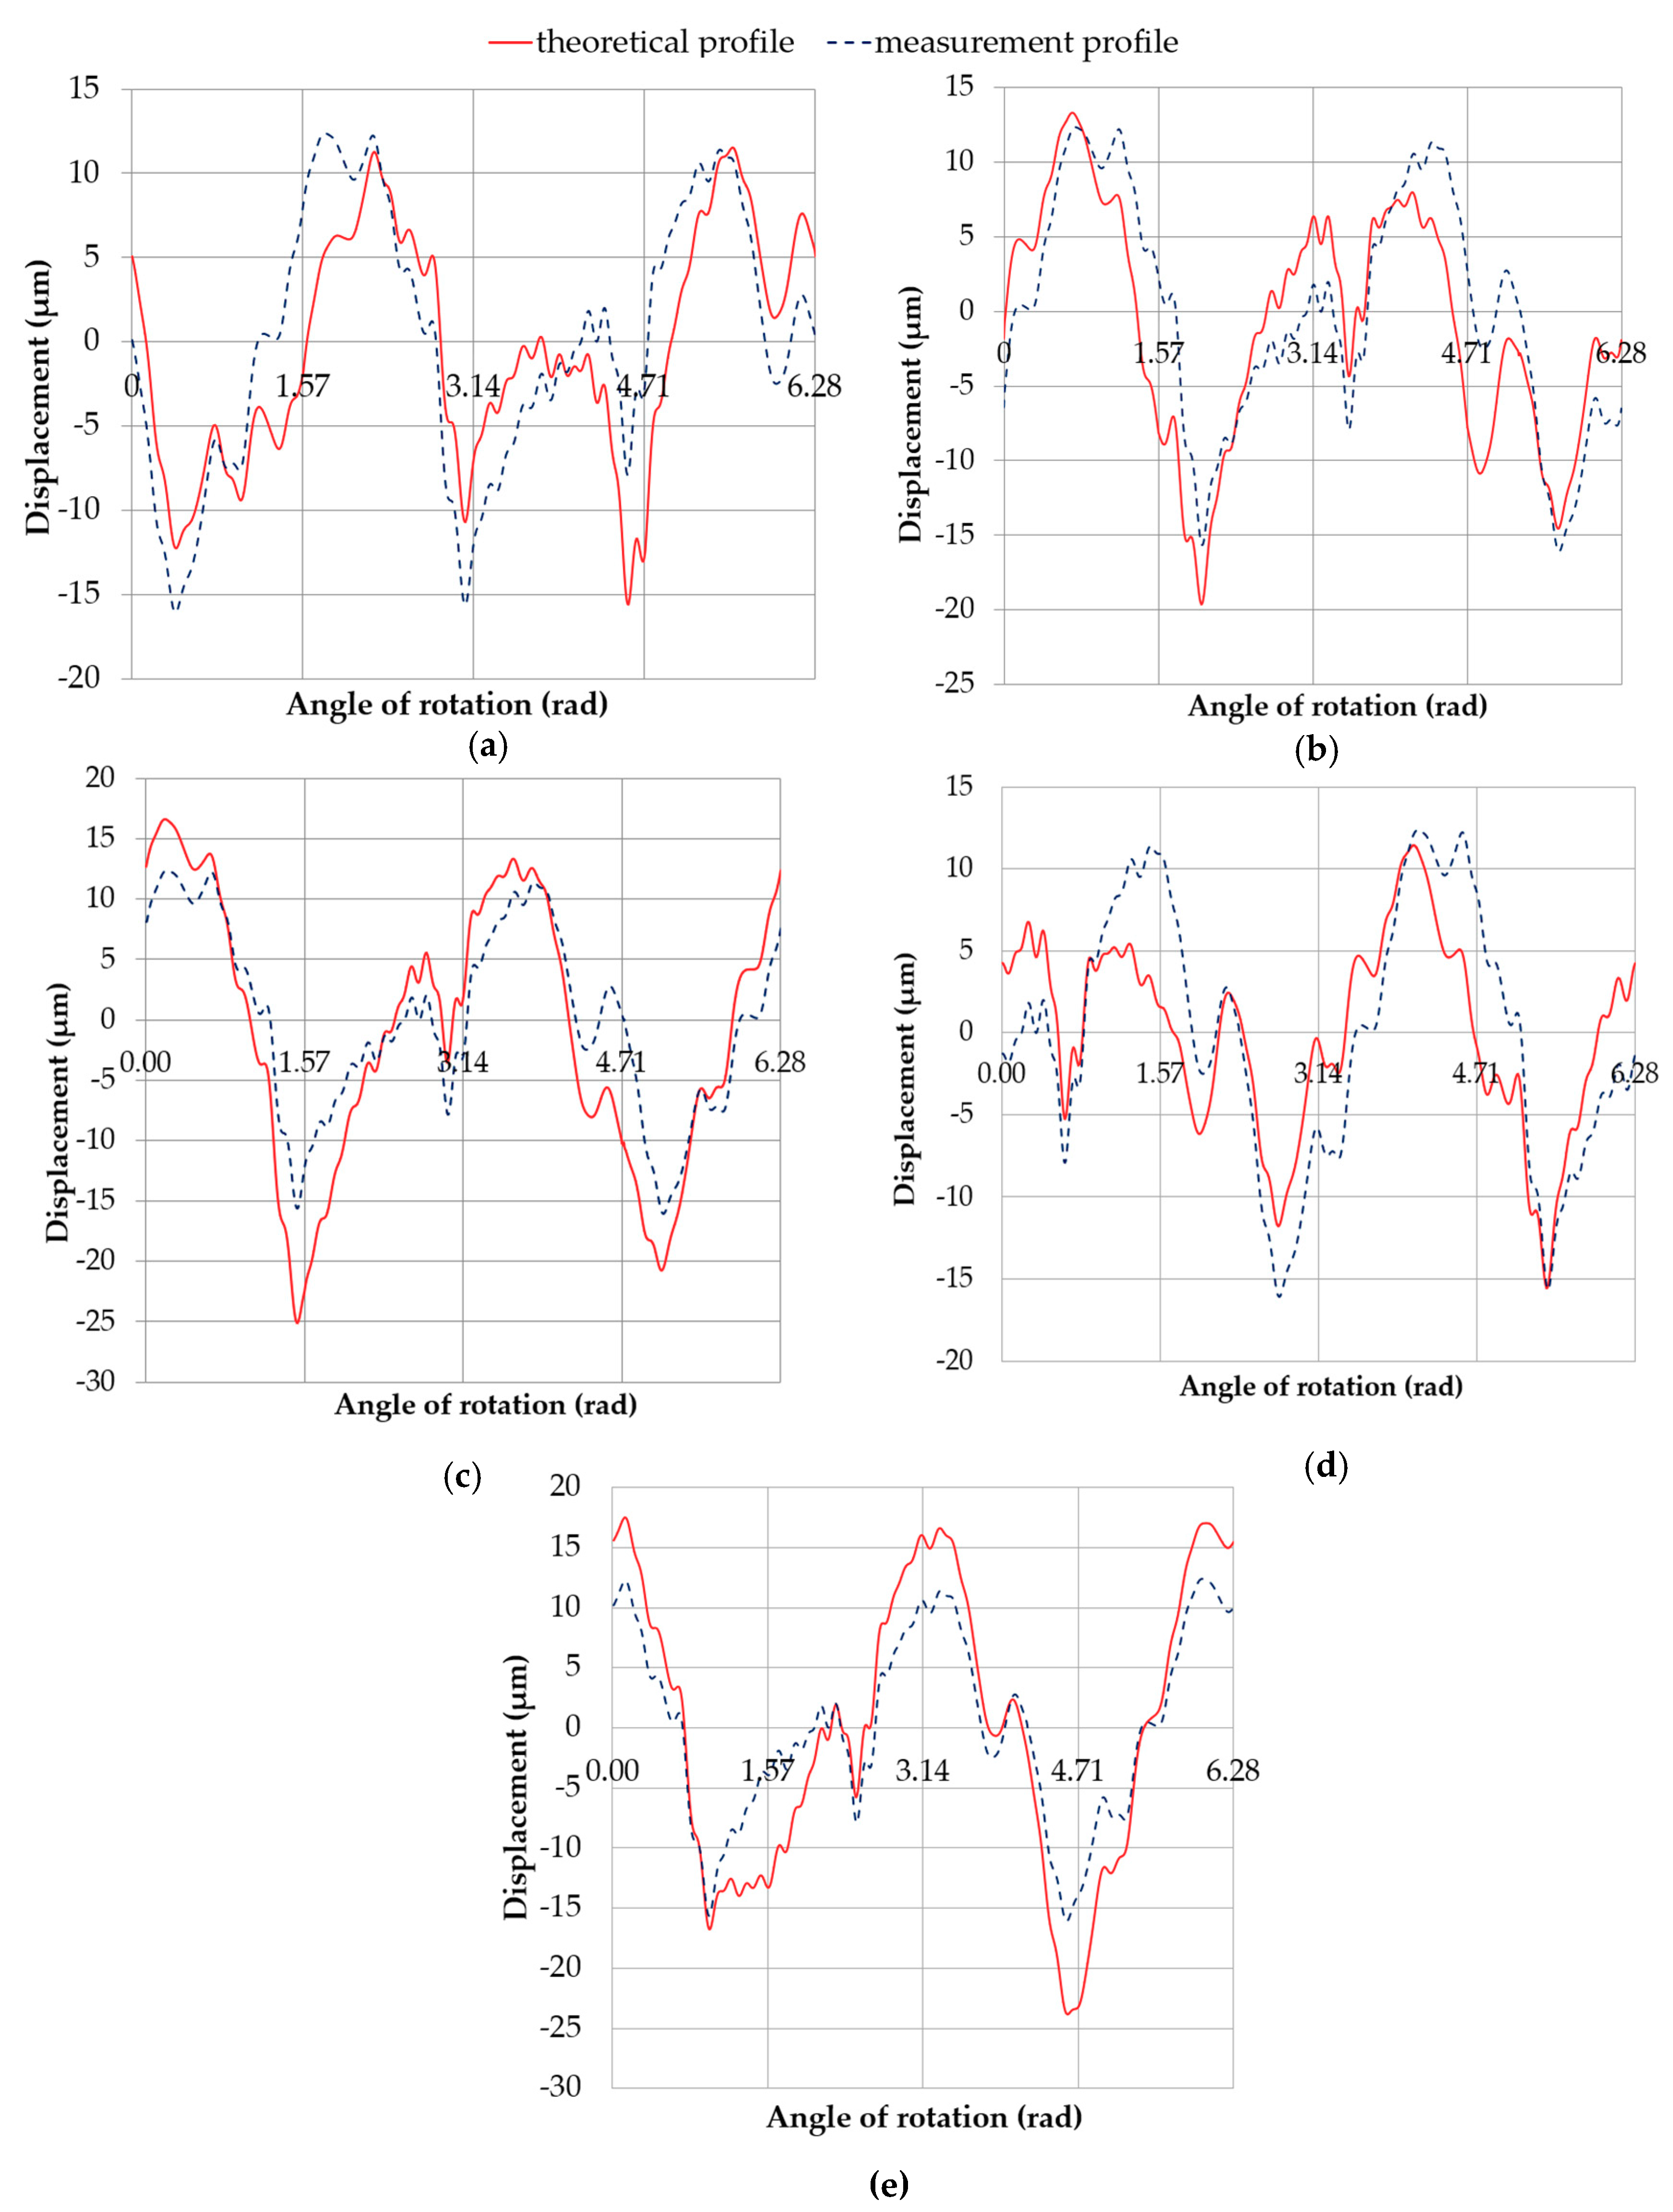
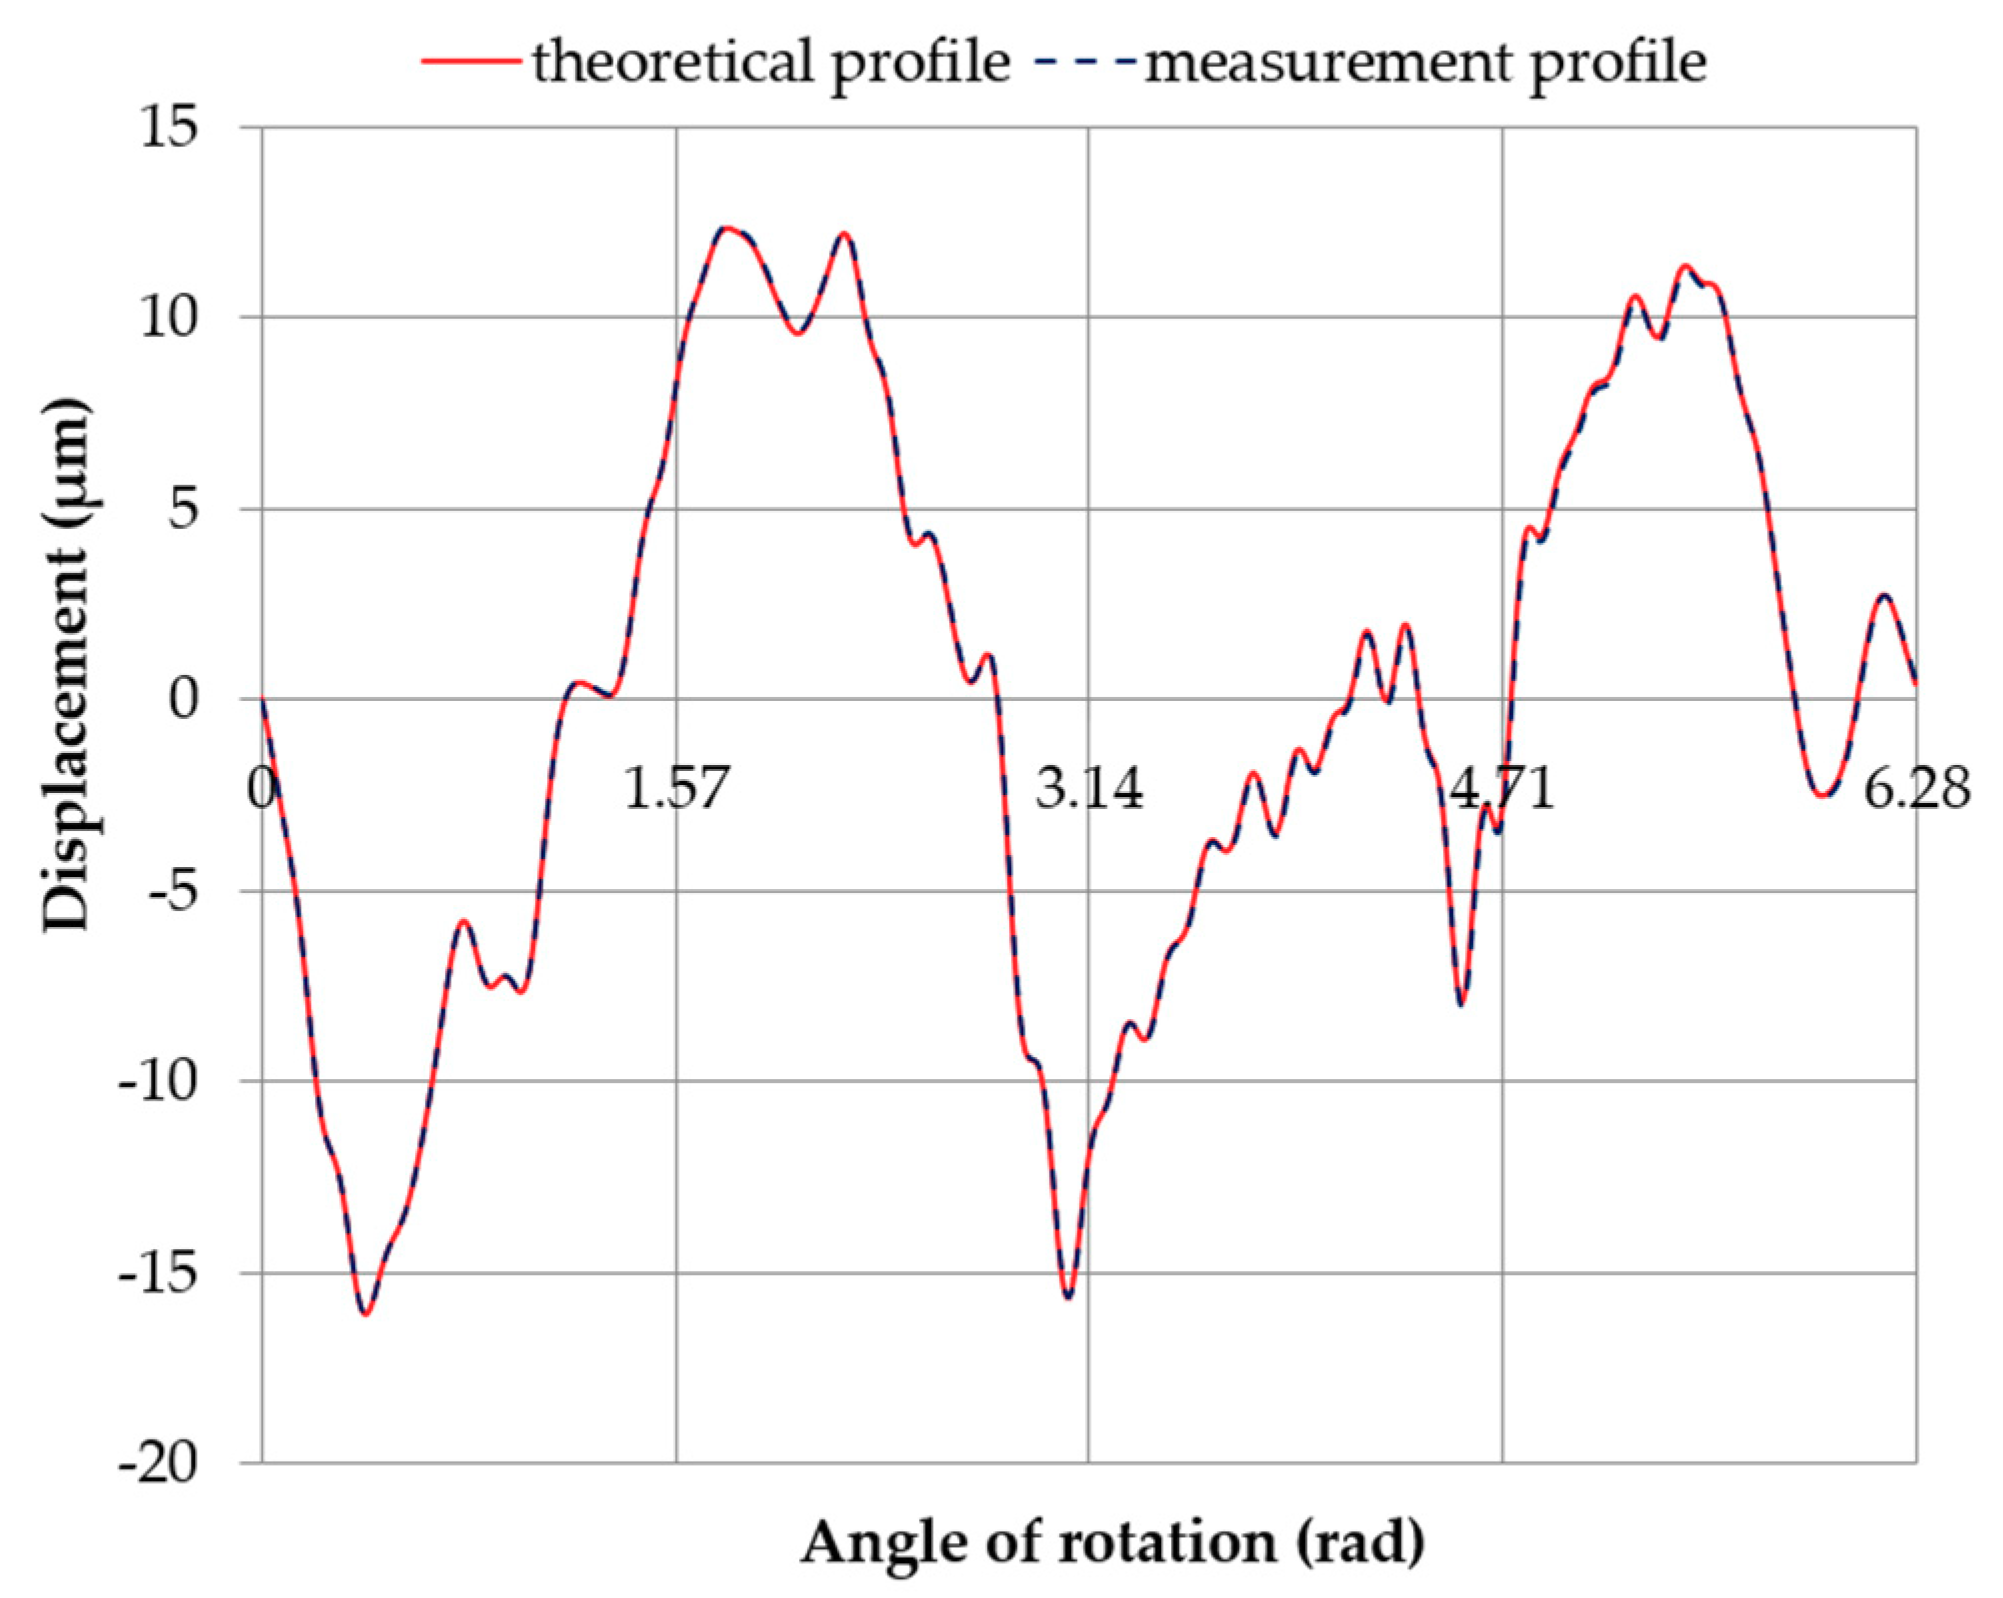
Figure 25.
Measured and theoretical profiles (excluding harmonic component no. 1) obtained by superimposing the measured roundness profile of journal no. 5 onto the eccentric movement profile of the center of the measured roundness profile with the supports set at the same height (x = 0 mm), with an eccentricity of the main journal e = 0.03 mm, (a) at a starting position; (b) rotated 60°; (c) rotated by 90°; (d) rotated by 225°; (e) rotated by 300°.
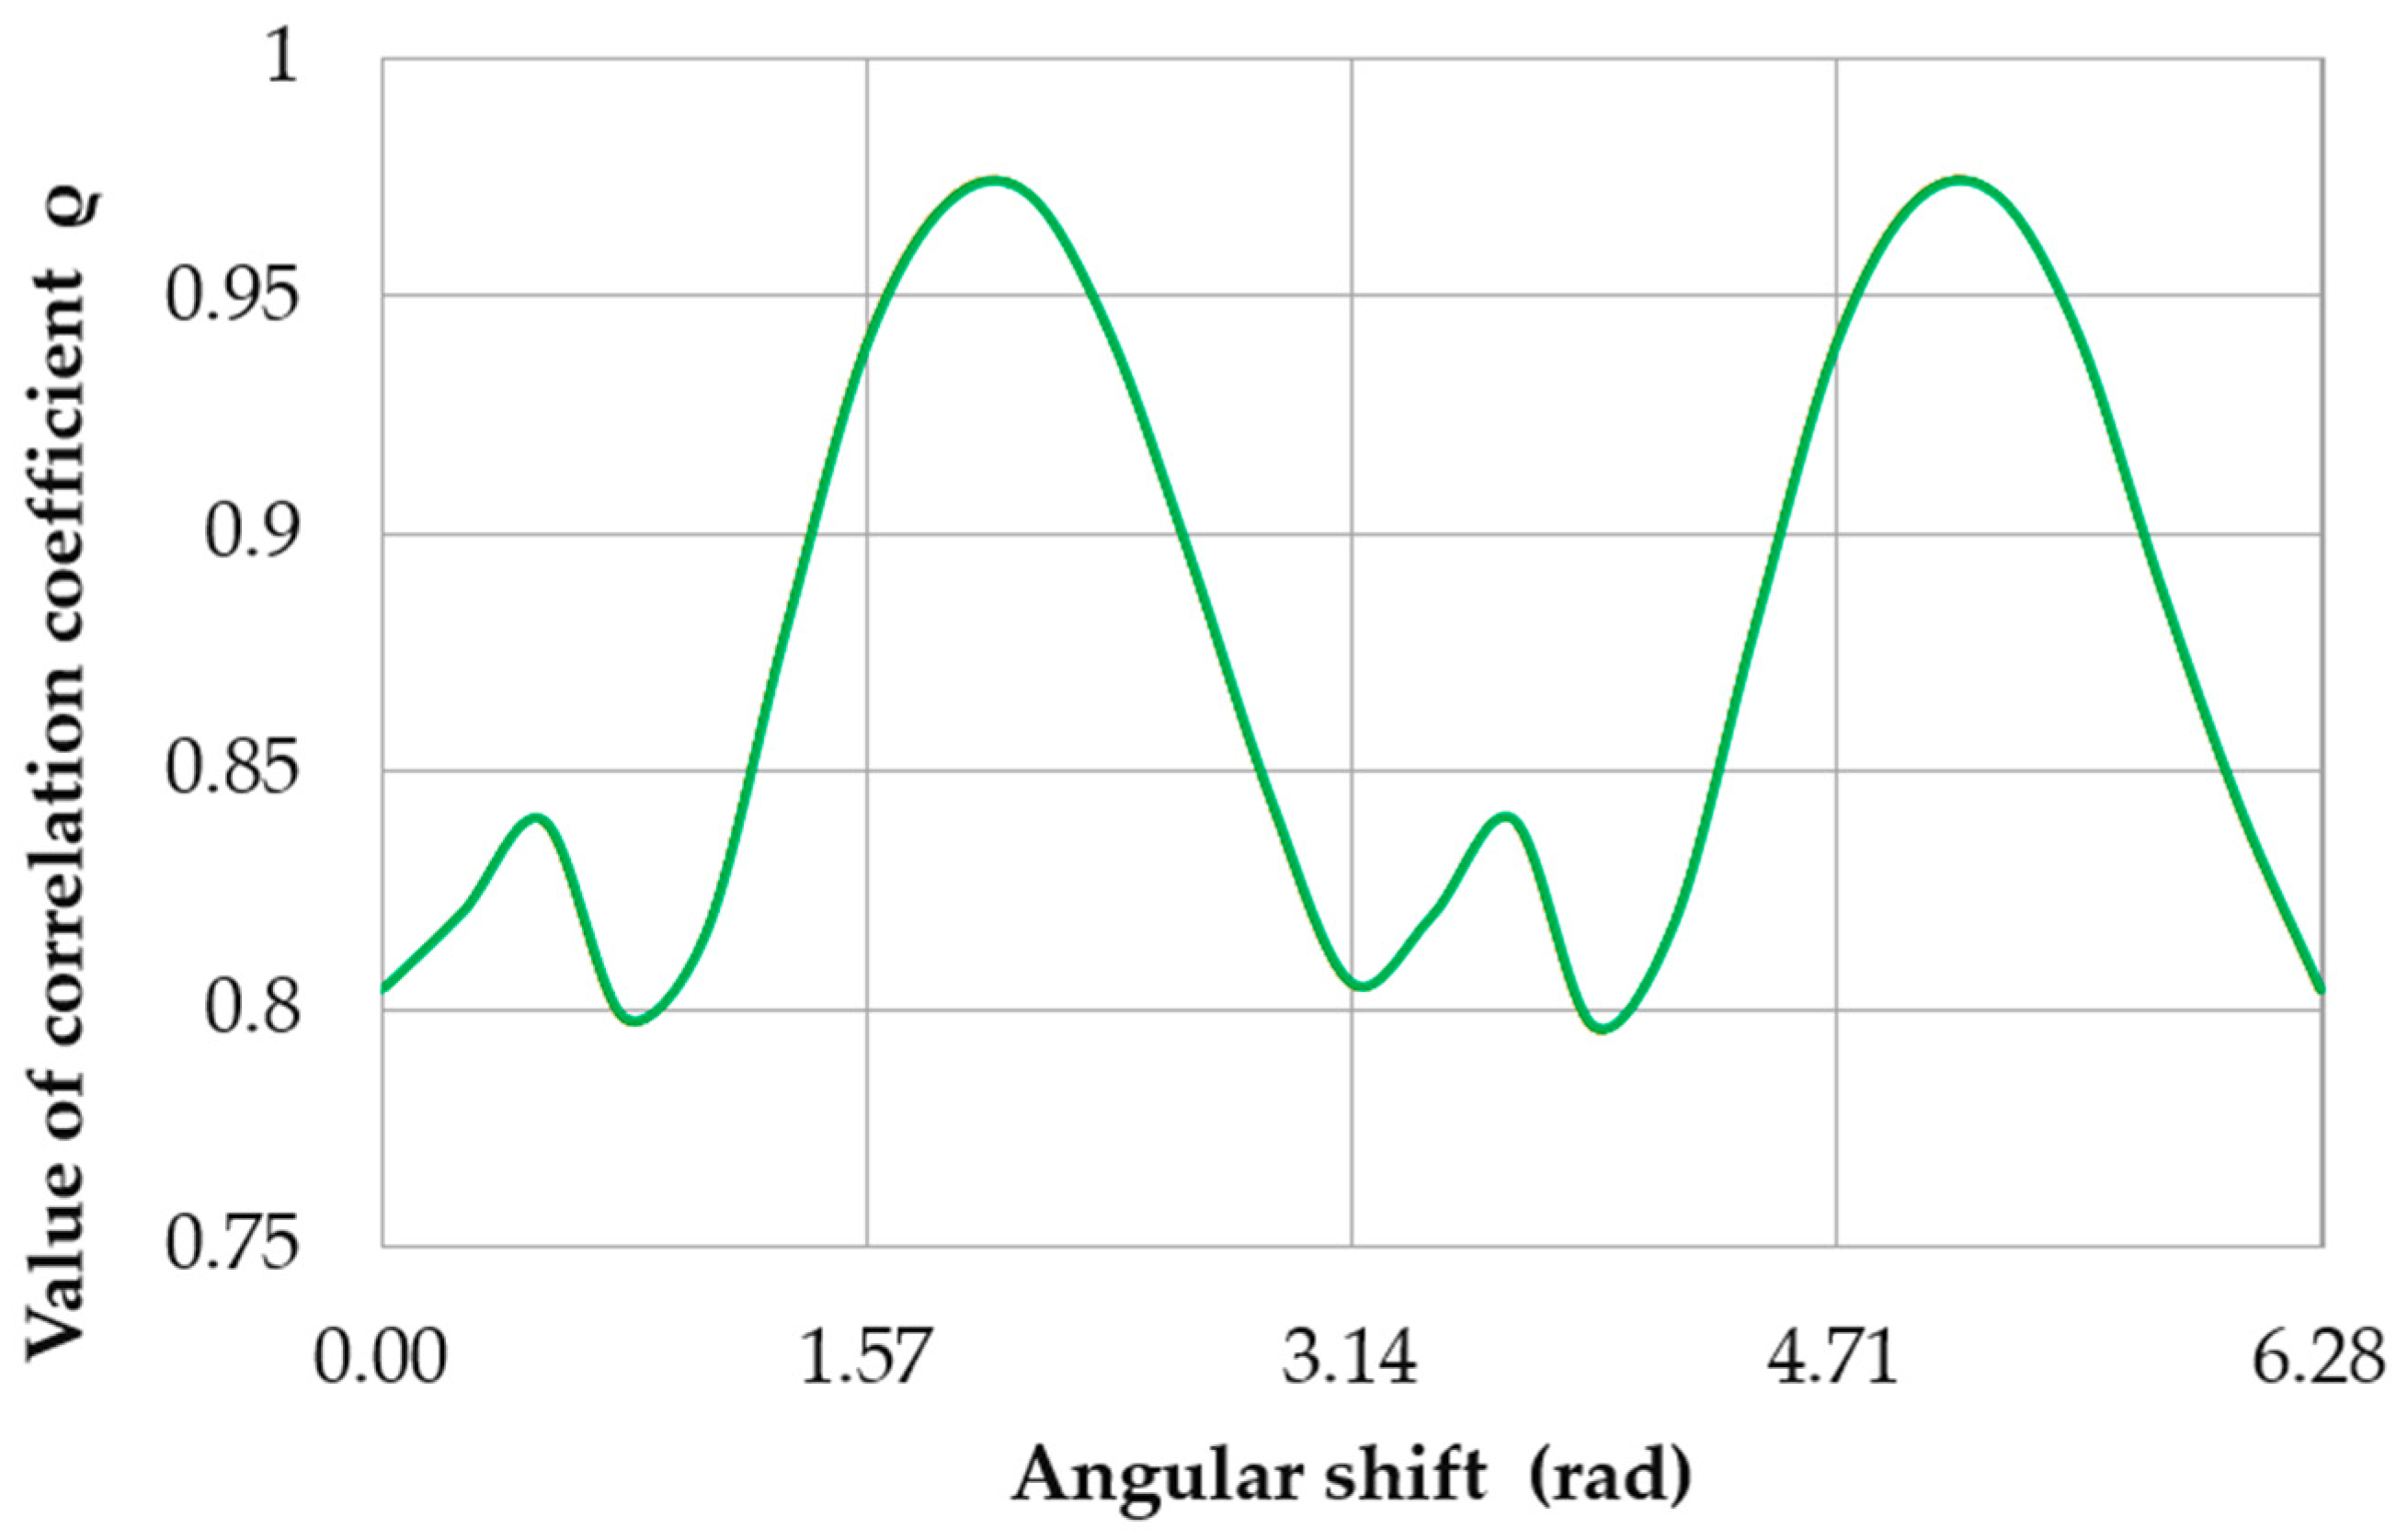
Figure 26.
Variation in the correlation coefficient ρ as a function of the angular shift between the measured and evaluated profiles.
Figure 26.
Variation in the correlation coefficient ρ as a function of the angular shift between the measured and evaluated profiles.
Table 1.
Changes in the reaction forces at the contact of the supports with each main journal when the shaft rotation angle was changed by 90° and one of the supports (of journal no. 5 counting from the timing gear end) was offset upwards by 0.03 mm relative to the others.
Table 1.
Changes in the reaction forces at the contact of the supports with each main journal when the shaft rotation angle was changed by 90° and one of the supports (of journal no. 5 counting from the timing gear end) was offset upwards by 0.03 mm relative to the others.
| Angular Position [°CA] | Main Journal Number [-] |
|---|
| 1 | 2 | 3 | 4 | 5 | 6 | 7 | 8 | 9 | 10 |
|---|
| Reaction Forces in Main Journals [N] |
|---|
| 0° | 681.2 | 1545.4 | 0 | 0 | 3891.3 | 0 | 0 | 1441.7 | 1157.6 | 566.5 |
| 90° | 878.8 | 1302.2 | 0 | 0 | 3928.8 | 0 | 0 | 1470.9 | 1162.4 | 540.7 |
| 180° | 681.2 | 1545.4 | 0 | 0 | 3891.3 | 0 | 0 | 1441.7 | 1157.6 | 566.5 |
| 270° | 878.8 | 1302.2 | 0 | 0 | 3928.8 | 0 | 0 | 1470.9 | 1162.4 | 540.7 |
Table 2.
Changes in the reaction forces where the supports contact each main journal when the shaft rotation angle was changed by 90° with one of the supports (of journal no. 5 counting from the timing gear end) offset downwards by 0.03 mm relative to the others.
Table 2.
Changes in the reaction forces where the supports contact each main journal when the shaft rotation angle was changed by 90° with one of the supports (of journal no. 5 counting from the timing gear end) offset downwards by 0.03 mm relative to the others.
| Angular Position [°CA] | Main Journal Number [-] |
|---|
| 1 | 2 | 3 | 4 | 5 | 6 | 7 | 8 | 9 | 10 |
|---|
| Reaction Forces in Main Journals [N] |
|---|
| 0° | 725.4 | 996.9 | 729.4 | 1714.0 | 0 | 1750.0 | 584.3 | 1183.4 | 1025.2 | 572.3 |
| 90° | 817.3 | 844.7 | 775.5 | 1773.6 | 0 | 1541.2 | 914.9 | 907.9 | 1168.4 | 540.3 |
| 180° | 725.4 | 996.9 | 729.4 | 1714.0 | 0 | 1750.0 | 584.3 | 1183.4 | 1025.2 | 575.3 |
| 270° | 817.3 | 844.7 | 775.5 | 1773.6 | 0 | 1541.2 | 914.9 | 907.9 | 1168.4 | 540.3 |
Table 3.
Changes in the reaction forces where the supports contact each main journal when the shaft rotation angle changes by 90° and when one of the axis main journals (journal no. 5 counting from the timing gear end) is offset upwards by 0.03 mm relative to the others.
Table 3.
Changes in the reaction forces where the supports contact each main journal when the shaft rotation angle changes by 90° and when one of the axis main journals (journal no. 5 counting from the timing gear end) is offset upwards by 0.03 mm relative to the others.
| Angular Position [°CA] | Main Journal Number [-] |
|---|
| 1 | 2 | 3 | 4 | 5 | 6 | 7 | 8 | 9 | 10 |
|---|
| Reaction Forces in Main Journals [N] |
|---|
| 0° | 725.5 | 996.9 | 729.4 | 1714.0 | 0 | 1750.0 | 584.3 | 1183.4 | 1025.2 | 575.3 |
| 90° | 833.3 | 763.1 | 1134.1 | 891.3 | 1126.1 | 809.9 | 1127.1 | 886.2 | 1173.4 | 539.5 |
| 180° | 681.2 | 1545.4 | 0 | 0 | 3891.3 | 0 | 0 | 1441.7 | 1157.6 | 566.5 |
| 270° | 833.3 | 763.1 | 1134.0 | 891.3 | 1126.1 | 809.9 | 1127.1 | 886.2 | 1173.4 | 539.5 |
Table 4.
Amplitudes of the harmonic components for the roundness profile of journal no. 5, measured by the reference method.
Table 4.
Amplitudes of the harmonic components for the roundness profile of journal no. 5, measured by the reference method.
| Harmonic Amplitudes [μm] |
|---|
| n | 0 | 10 | 20 | 30 | 40 |
| n + 0 | | 0.733112 | 0.048821 | 0.160022 | 0.078616 |
| n + 1 | | 0.519559 | 0.100569 | 0.321846 | 0.20063 |
| n + 2 | 9.253684 | 0.958851 | 0.030333 | 0.117518 | 0.266181 |
| n + 3 | 3.736699 | 0.637086 | 0.153547 | 0.154698 | 0.127993 |
| n + 4 | 2.063435 | 0.326033 | 0.084396 | 0.233796 | 0.136985 |
| n + 5 | 1.80228 | 0.441492 | 0.116786 | 0.028151 | 0.134468 |
| n + 6 | 0.958385 | 0.279591 | 0.139388 | 0.128674 | 0.082787 |
| n + 7 | 1.778264 | 0.254698 | 0.142395 | 0.159856 | 0.062551 |
| n + 8 | 0.773096 | 0.277479 | 0.244795 | 0.176508 | 0.088632 |
| n + 9 | 1.558816 | 0.344293 | 0.073347 | 0.049974 | 0.007096 |
Table 5.
Amplitudes of the harmonic components for the eccentric movement of the center of the roundness profile being measured for eccentricity where the support does not limit the shaft displacement.
Table 5.
Amplitudes of the harmonic components for the eccentric movement of the center of the roundness profile being measured for eccentricity where the support does not limit the shaft displacement.
| | Harmonic Amplitudes [μm] | |
|---|
| n | 0 | 10 | 20 | 30 | 40 |
| n + 0 | | 0.009154 | 0.002274 | 0.001011 | 0.00057 |
| n + 1 | 29.99956 | 0.007553 | 0.002062 | 0.000947 | 0.000542 |
| n + 2 | 0.00059 | 0.006339 | 0.001879 | 0.000889 | 0.000517 |
| n + 3 | 0.000221 | 0.005396 | 0.001719 | 0.000836 | 0.000493 |
| n + 4 | 0.000118 | 0.004649 | 0.001579 | 0.000788 | 0.000471 |
| n + 5 | 7.37 × 10⁻⁵ | 0.004048 | 0.001455 | 0.000743 | 0.000451 |
| n + 6 | 5.06 × 10⁻⁵ | 0.003556 | 0.001345 | 0.000703 | 0.000431 |
| n + 7 | 3.69 × 10⁻⁵ | 0.003149 | 0.001248 | 0.000665 | 0.000413 |
| n + 8 | 2.81 × 10⁻⁵ | 0.002808 | 0.00116 | 0.000631 | 0.000397 |
| n + 9 | 2.21 × 10⁻⁵ | 0.00252 | 0.001082 | 0.000599 | 0.000381 |
Table 6.
Amplitudes of the harmonic components for the eccentric movement of the center of the roundness profile being measured when the supports were set at the same height (), with an eccentricity of the main journal .
Table 6.
Amplitudes of the harmonic components for the eccentric movement of the center of the roundness profile being measured when the supports were set at the same height (), with an eccentricity of the main journal .
| Harmonic Amplitudes [μm] |
|---|
| n | 0 | 10 | 20 | 30 | 40 |
| n + 0 | | 0.1930 | 0.0479 | 0.0213 | 0.0120 |
| n + 1 | 14.9993 | 0.0001 | 0.0000 | 0.0000 | 0.0000 |
| n + 2 | 6.3665 | 0.1336 | 0.0396 | 0.0187 | 0.0109 |
| n + 3 | 0.0006 | 0.0001 | 0.0000 | 0.0000 | 0.0000 |
| n + 4 | 1.2731 | 0.0980 | 0.0333 | 0.0166 | 0.0099 |
| n + 5 | 0.0001 | 0.0001 | 0.0000 | 0.0000 | 0.0000 |
| n + 6 | 0.5458 | 0.0750 | 0.0284 | 0.0148 | 0.0091 |
| n + 7 | 0.0002 | 0.0000 | 0.0000 | 0.0000 | 0.0000 |
| n + 8 | 0.3032 | 0.0592 | 0.0245 | 0.0133 | 0.0084 |
| n + 9 | 0.0001 | 0.0001 | 0.0000 | 0.0000 | 0.0000 |
Table 7.
Amplitudes of harmonic components for the profile obtained by superimposing the measured roundness profile of journal no. 5 on the full eccentric movement profile of the center of the measured roundness profile.
Table 7.
Amplitudes of harmonic components for the profile obtained by superimposing the measured roundness profile of journal no. 5 on the full eccentric movement profile of the center of the measured roundness profile.
| Harmonic Amplitudes (μm) |
|---|
| n | 0 | 10 | 20 | 30 | 40 |
| n + 0 | | 0.73 | 0.05 | 0.16 | 0.08 |
| n + 1 | 30.00 | 0.52 | 0.10 | 0.32 | 0.20 |
| n + 2 | 9.25 | 0.96 | 0.03 | 0.12 | 0.27 |
| n + 3 | 3.74 | 0.64 | 0.15 | 0.15 | 0.13 |
| n + 4 | 2.06 | 0.33 | 0.08 | 0.23 | 0.14 |
| n + 5 | 1.80 | 0.44 | 0.12 | 0.03 | 0.13 |
| n + 6 | 0.96 | 0.28 | 0.14 | 0.13 | 0.08 |
| n + 7 | 1.78 | 0.25 | 0.14 | 0.16 | 0.06 |
| n + 8 | 0.77 | 0.28 | 0.24 | 0.18 | 0.09 |
| n + 9 | 1.56 | 0.34 | 0.07 | 0.05 | 0.01 |
Table 8.
Amplitudes of harmonic components for the profile obtained by superimposing the measured roundness profile of journal no. 5 on the profile of the eccentric movement of the center of the measured roundness profile when the supports are set at the same height (); with an eccentricity of the main journal .
| Harmonic Amplitudes [μm] |
|---|
| n | 0 | 10 | 20 | 30 | 40 |
| n + 0 | | 0.8665 | 0.0542 | 0.1725 | 0.0686 |
| n + 1 | 14.9990 | 0.5196 | 0.1006 | 0.3218 | 0.2006 |
| n + 2 | 7.0416 | 0.9778 | 0.0484 | 0.1178 | 0.2767 |
| n + 3 | 3.7370 | 0.6371 | 0.1536 | 0.1547 | 0.1280 |
| n + 4 | 3.2658 | 0.2978 | 0.1164 | 0.2504 | 0.1456 |
| n + 5 | 1.8022 | 0.4414 | 0.1168 | 0.0282 | 0.1345 |
| n + 6 | 1.4820 | 0.2104 | 0.1314 | 0.1350 | 0.0857 |
| n + 7 | 1.7784 | 0.2547 | 0.1424 | 0.1599 | 0.0625 |
| n + 8 | 0.6172 | 0.2376 | 0.2624 | 0.1841 | 0.0867 |
| n + 9 | 1.5587 | 0.3442 | 0.0734 | 0.0500 | 0.0071 |
Table 9.
Amplitudes of the harmonic components for the profile obtained by superimposing the measured roundness profile of journal no. 5—and by rotating it by 60° with respect to the reference profile—onto the eccentric movement profile of the center of the measured roundness profile when the supports were set at the same height (), with an eccentricity of the main journal e = 0.03 mm.
| Harmonic Amplitudes [μm] |
|---|
| n | 0 | 10 | 20 | 30 | 40 |
| n + 0 | | 0.7893 | 0.0343 | 0.1623 | 0.0844 |
| n + 1 | 15.0011 | 0.4982 | 0.1035 | 0.3275 | 0.2169 |
| n + 2 | 9.2514 | 0.9881 | 0.0176 | 0.0956 | 0.2657 |
| n + 3 | 3.7533 | 0.6462 | 0.1620 | 0.1455 | 0.1292 |
| n + 4 | 2.2880 | 0.2782 | 0.1145 | 0.2314 | 0.1355 |
| n + 5 | 1.8372 | 0.4334 | 0.1085 | 0.0266 | 0.1317 |
| n + 6 | 1.5002 | 0.3518 | 0.1749 | 0.1302 | 0.0869 |
| n + 7 | 1.7701 | 0.2455 | 0.1344 | 0.1570 | 0.0000 |
| n + 8 | 0.7415 | 0.2474 | 0.2530 | 0.1678 | 0.0000 |
| n + 9 | 1.5501 | 0.3552 | 0.0730 | 0.0419 | 0.0000 |
Table 10.
Amplitudes of harmonic components for the profile obtained by superimposing the measured roundness profile of journal no. 5—and rotating it by 90° with respect to the reference profile—onto the profile of the eccentric movement of the center of the measured roundness profile with the supports set at the same height (), with an eccentricity of the main journal e = 0.03 mm.
| Harmonic Amplitudes [μm] |
|---|
| n | 0 | 10 | 20 | 30 | 40 |
| n + 0 | | 0.6211 | 0.0587 | 0.1537 | 0.0677 |
| n + 1 | 14.9993 | 0.5201 | 0.1002 | 0.3213 | 0.2007 |
| n + 2 | 14.1993 | 0.9872 | 0.0539 | 0.1215 | 0.2559 |
| n + 3 | 3.7376 | 0.6367 | 0.1542 | 0.1540 | 0.1275 |
| n + 4 | 3.2729 | 0.3710 | 0.1142 | 0.2185 | 0.1461 |
| n + 5 | 1.8030 | 0.4409 | 0.1167 | 0.0283 | 0.1351 |
| n + 6 | 0.4735 | 0.2148 | 0.1557 | 0.1315 | 0.0783 |
| n + 7 | 1.7790 | 0.2554 | 0.1431 | 0.1595 | 0.0000 |
| n + 8 | 0.6317 | 0.3263 | 0.2645 | 0.1673 | 0.0000 |
| n + 9 | 1.5596 | 0.3435 | 0.0730 | 0.0496 | 0.0000 |
Table 11.
Roundness deviations Δ
o for the profiles compared in
Figure 21 and
Figure 22. The correlation coefficients
ρ between the compared profiles.
Table 11.
Roundness deviations Δ
o for the profiles compared in
Figure 21 and
Figure 22. The correlation coefficients
ρ between the compared profiles.


