Biosensors Based on Mechanical and Electrical Detection Techniques


Abstract
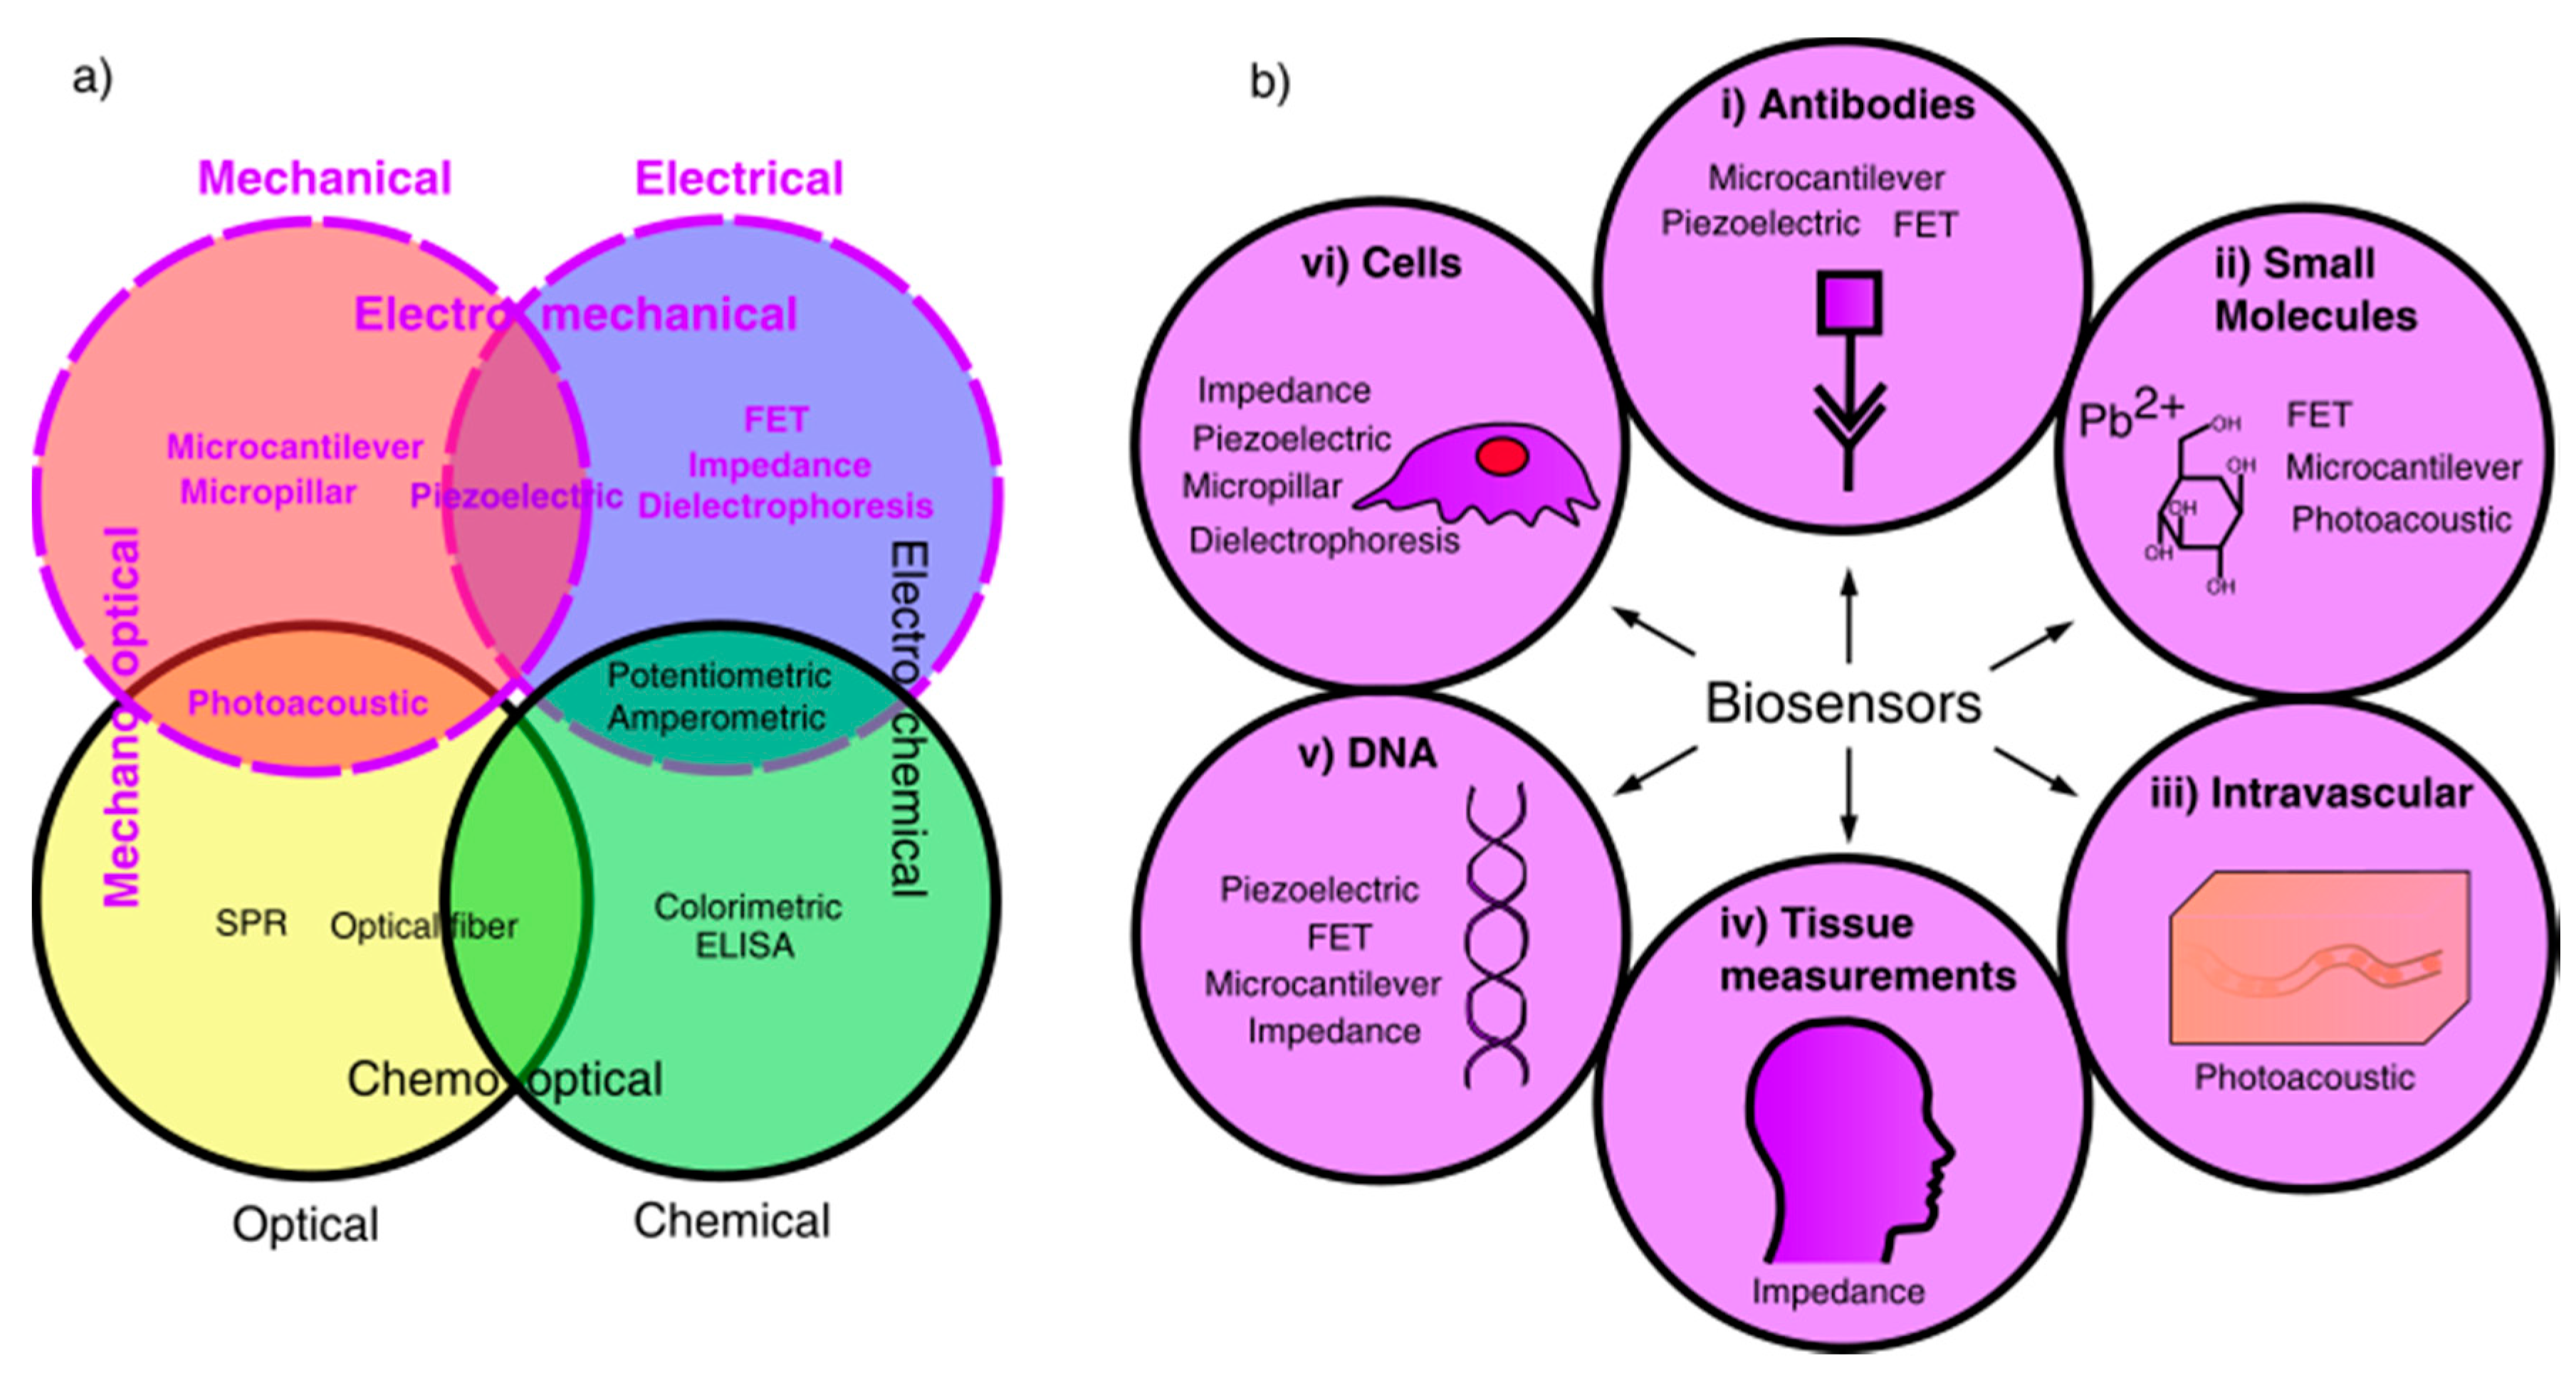
1. Introduction
2. Mechanical Biosensors
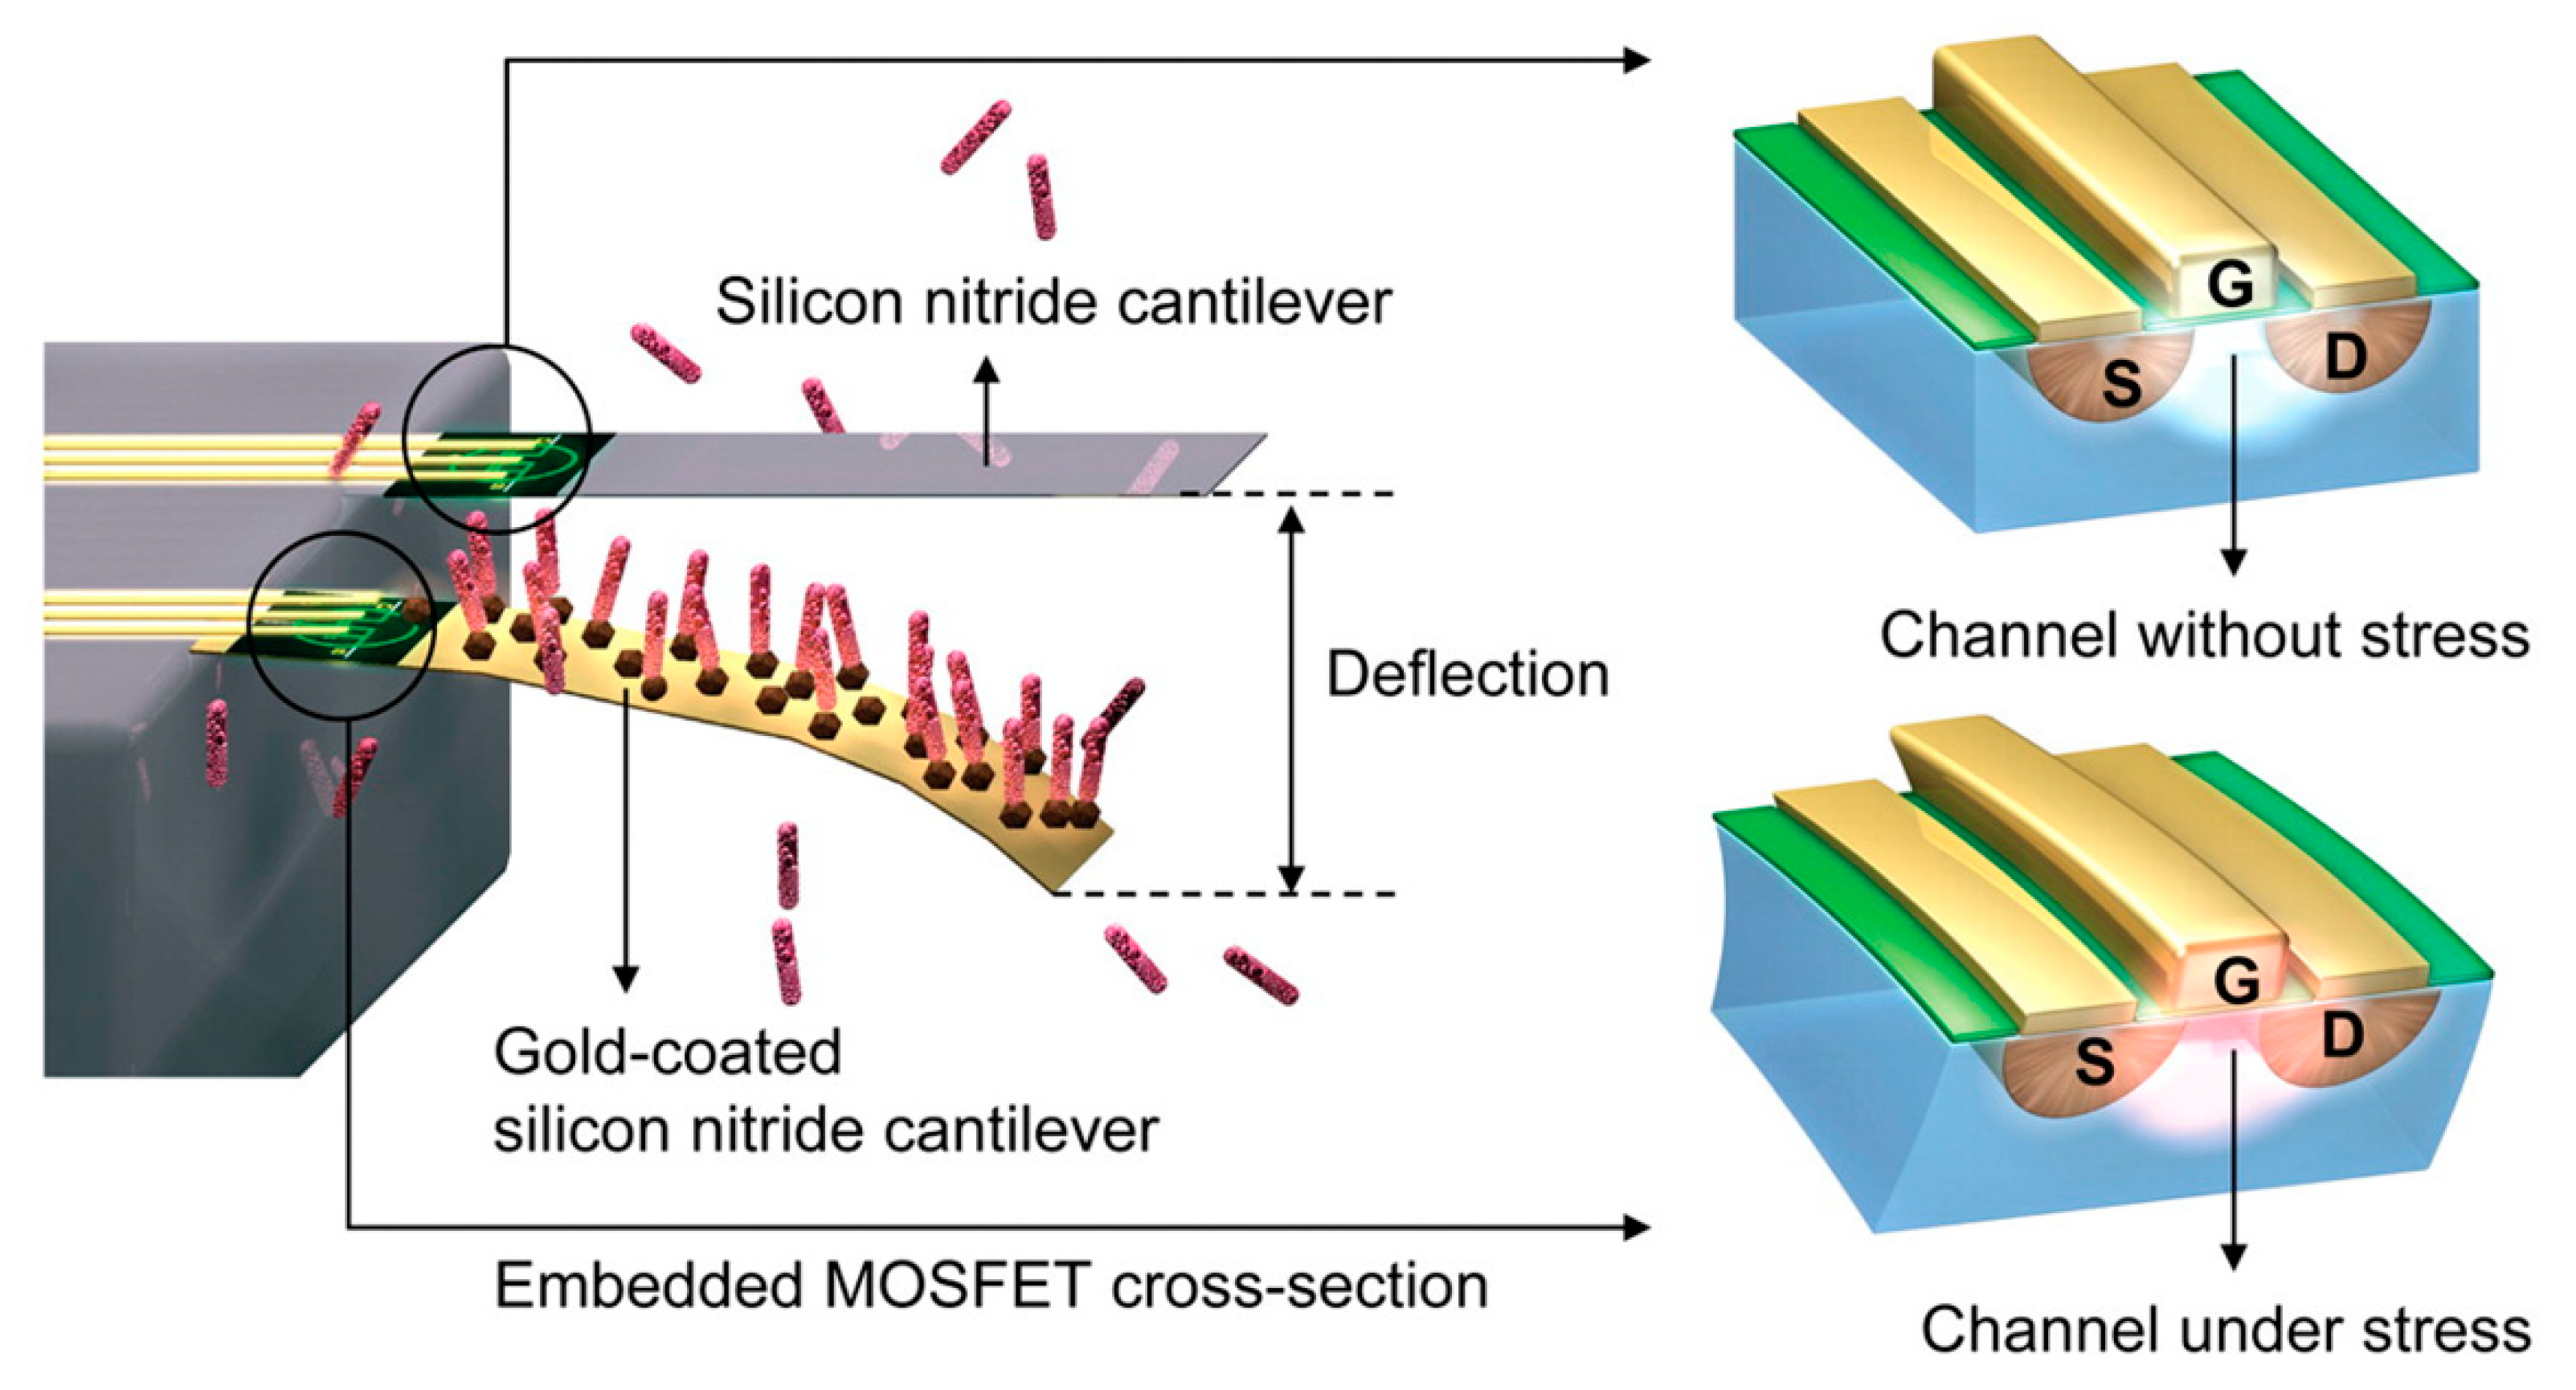
2.1. Microcantilevers
2.1.1. Static Mode MCs
2.1.2. Dynamic Mode MCs
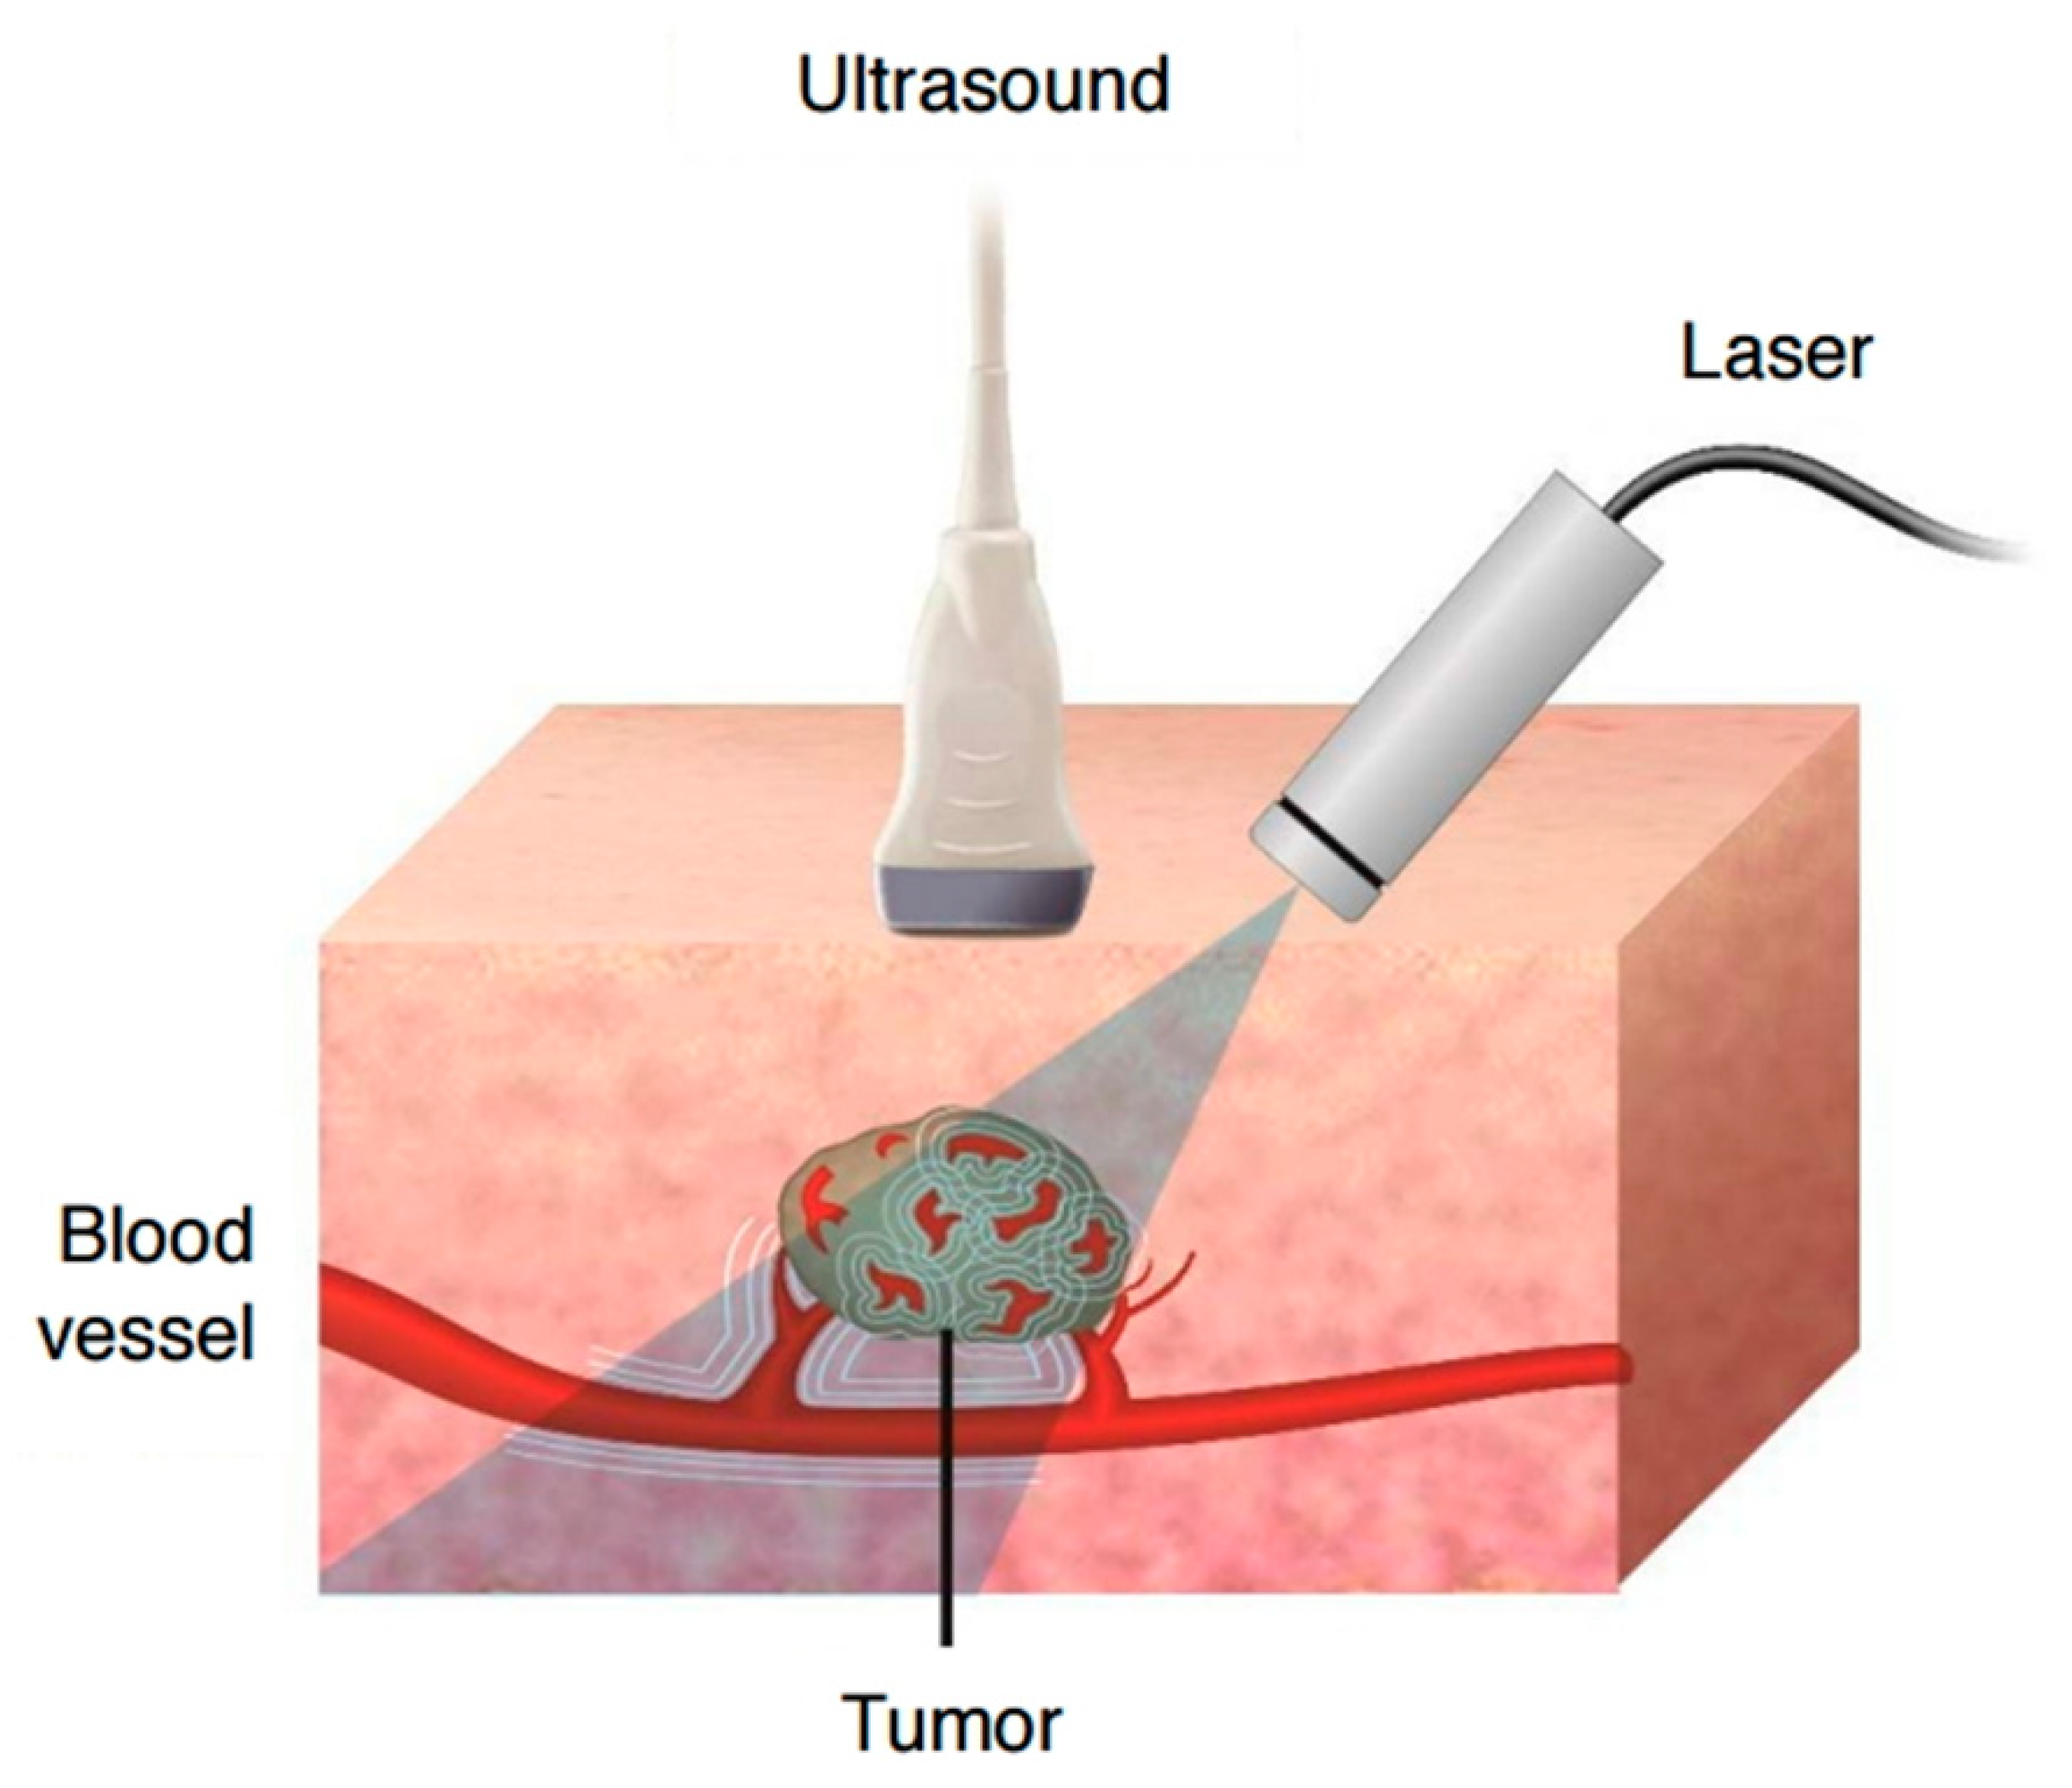
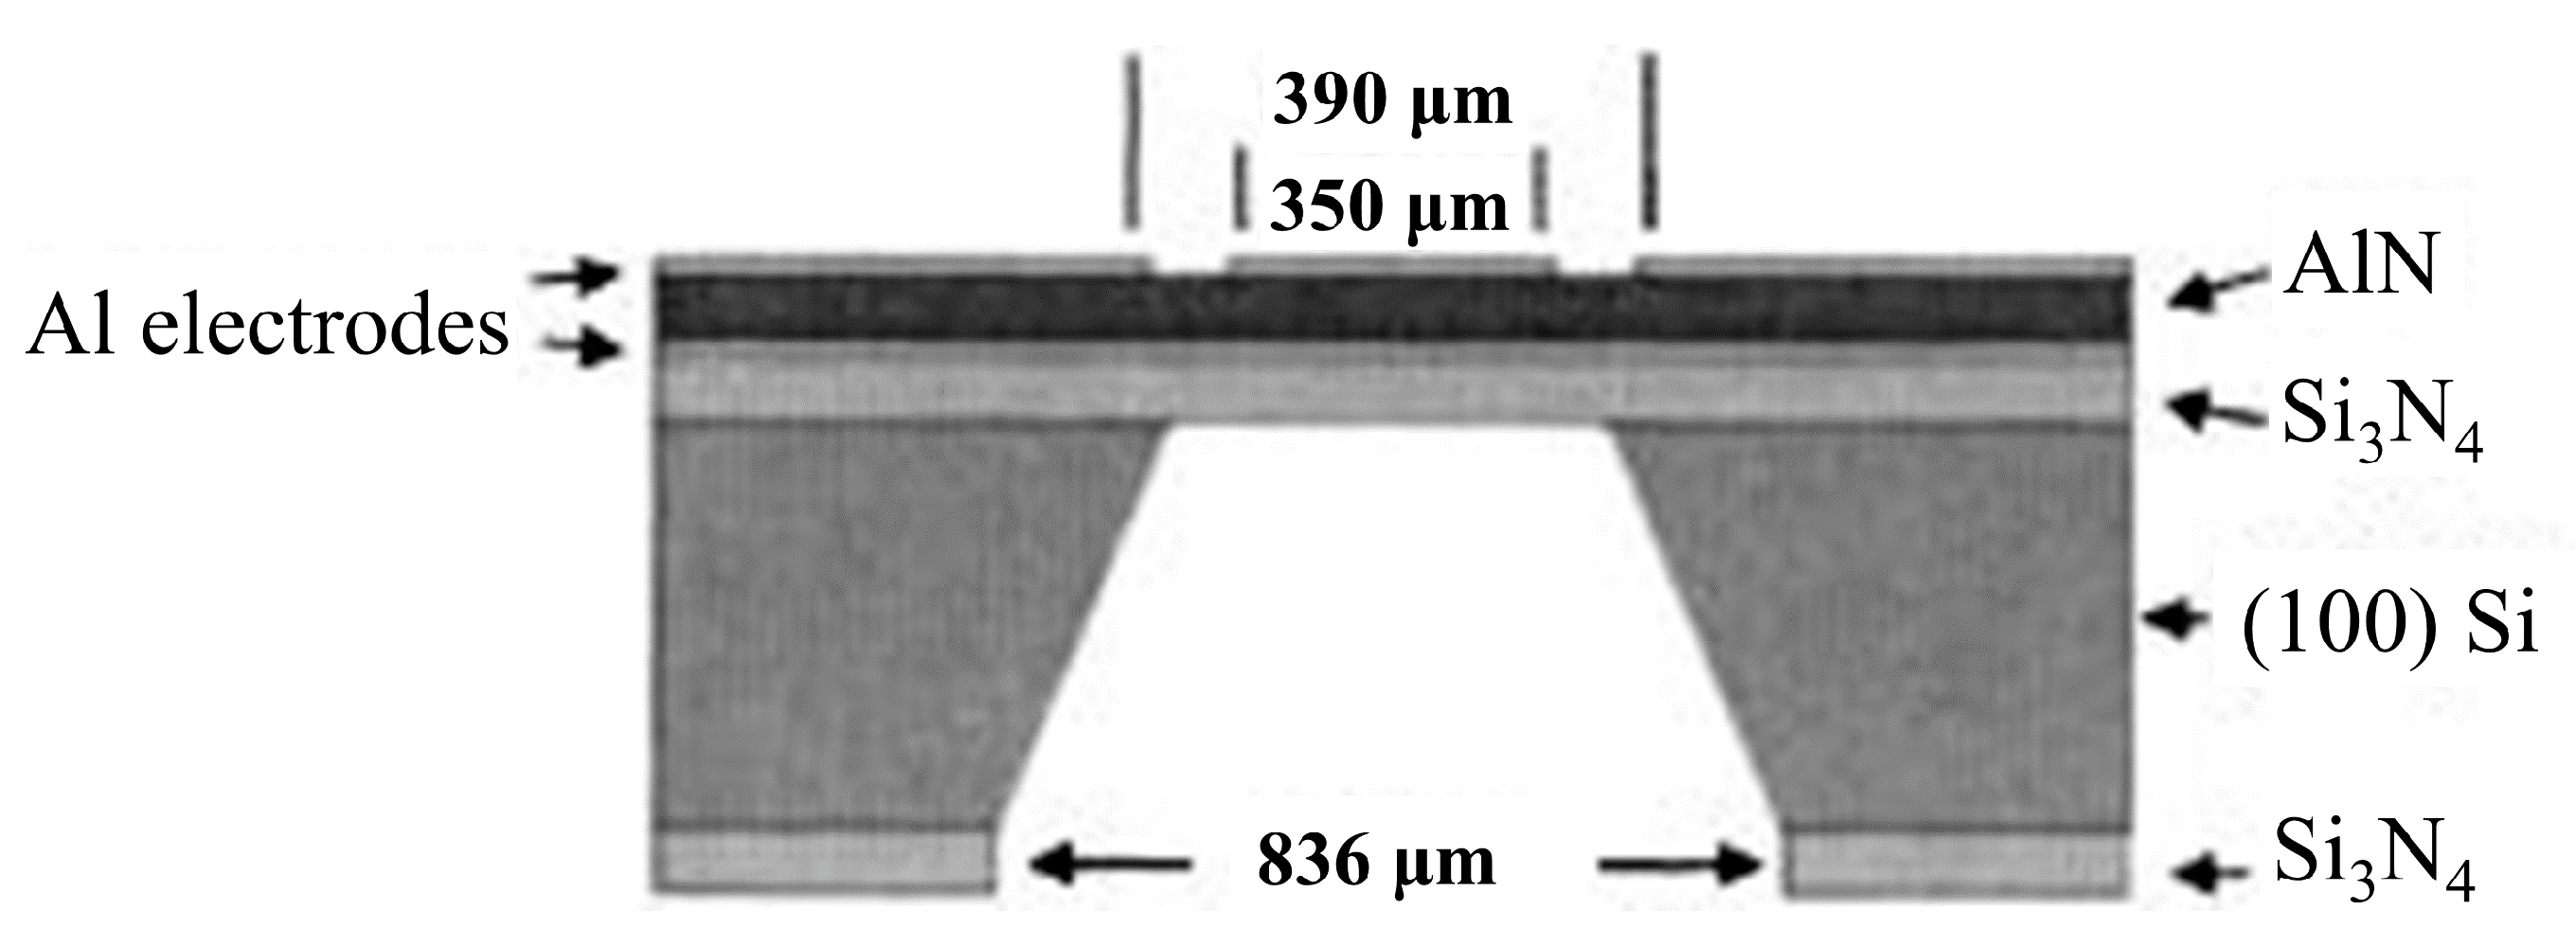
2.2. Photoacoustics
2.3. Micropillar Sensors
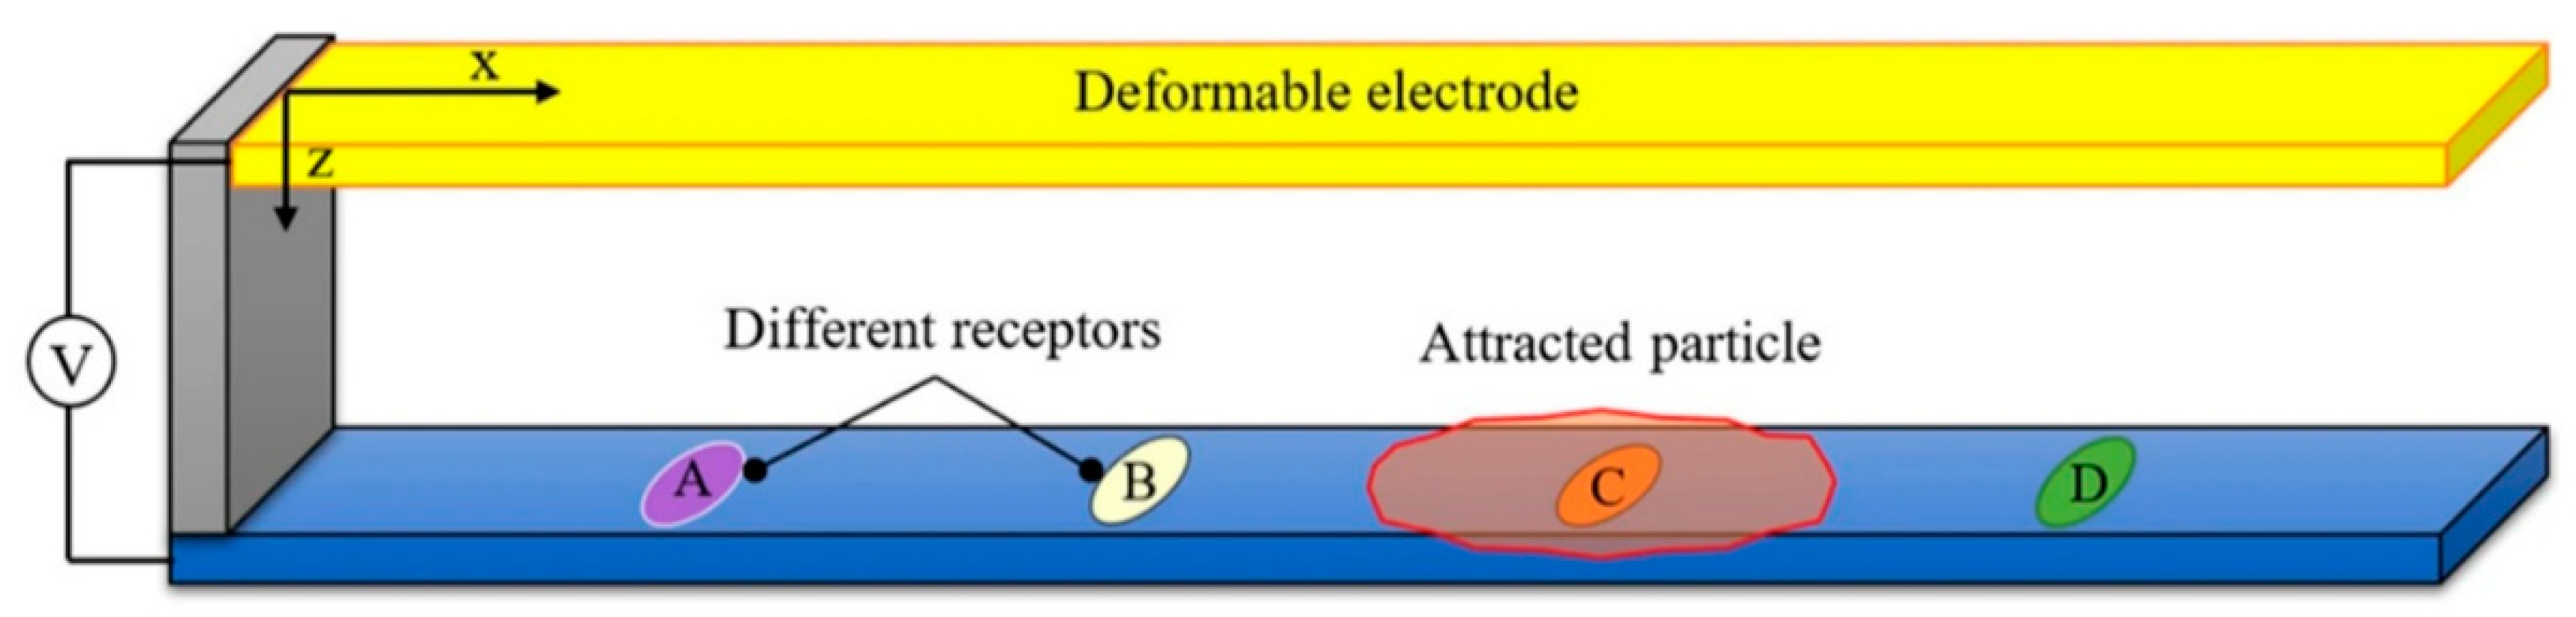
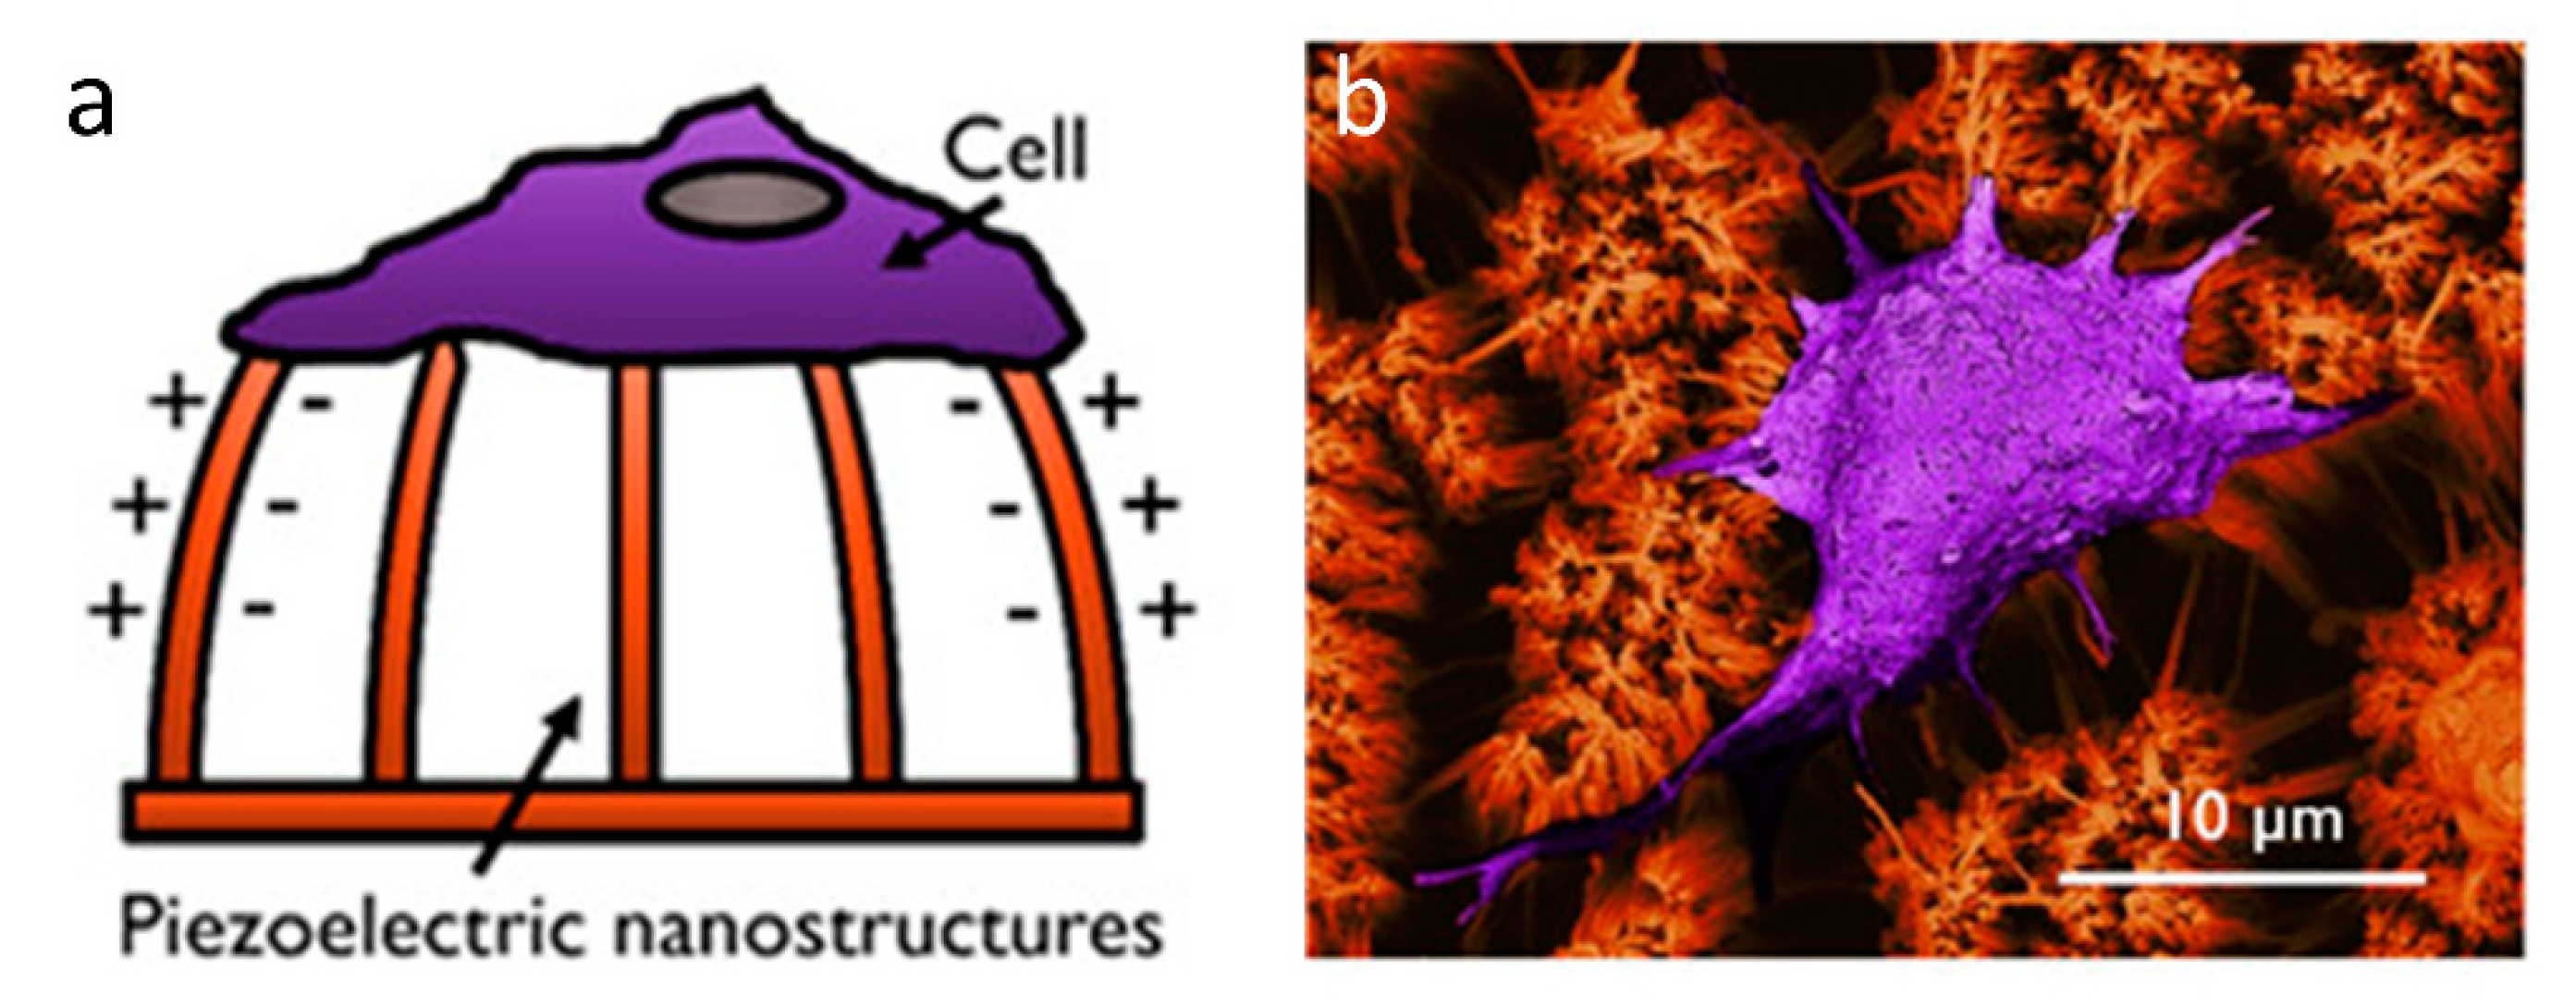
2.4. Piezoelectric Sensors
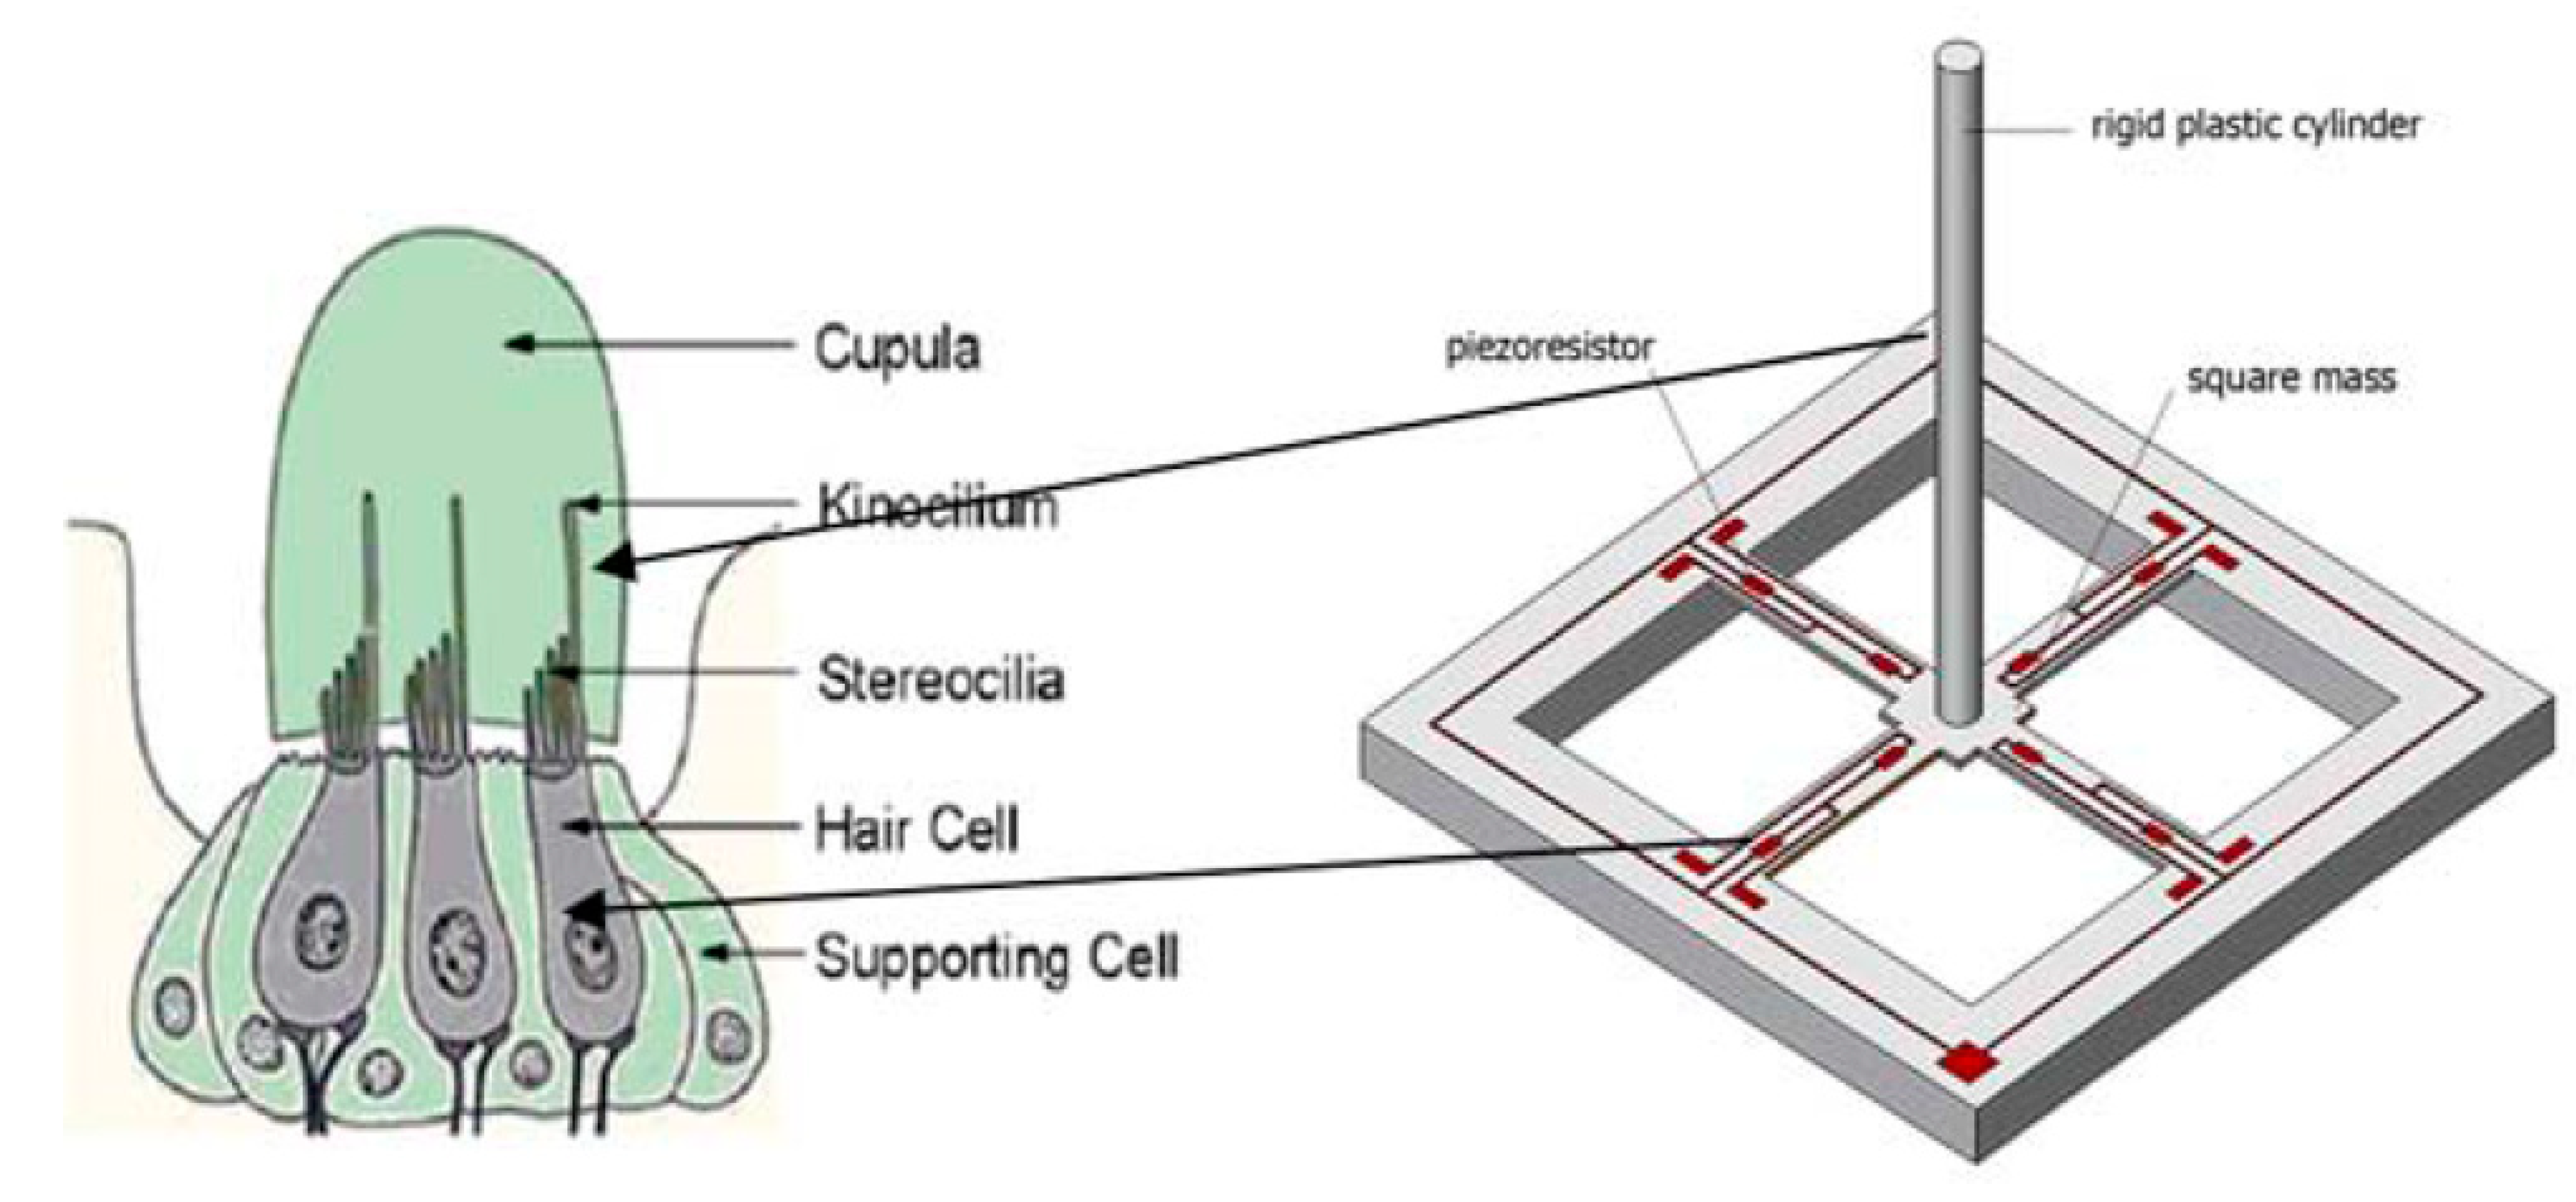
2.5. Other Mechanical Biosensors
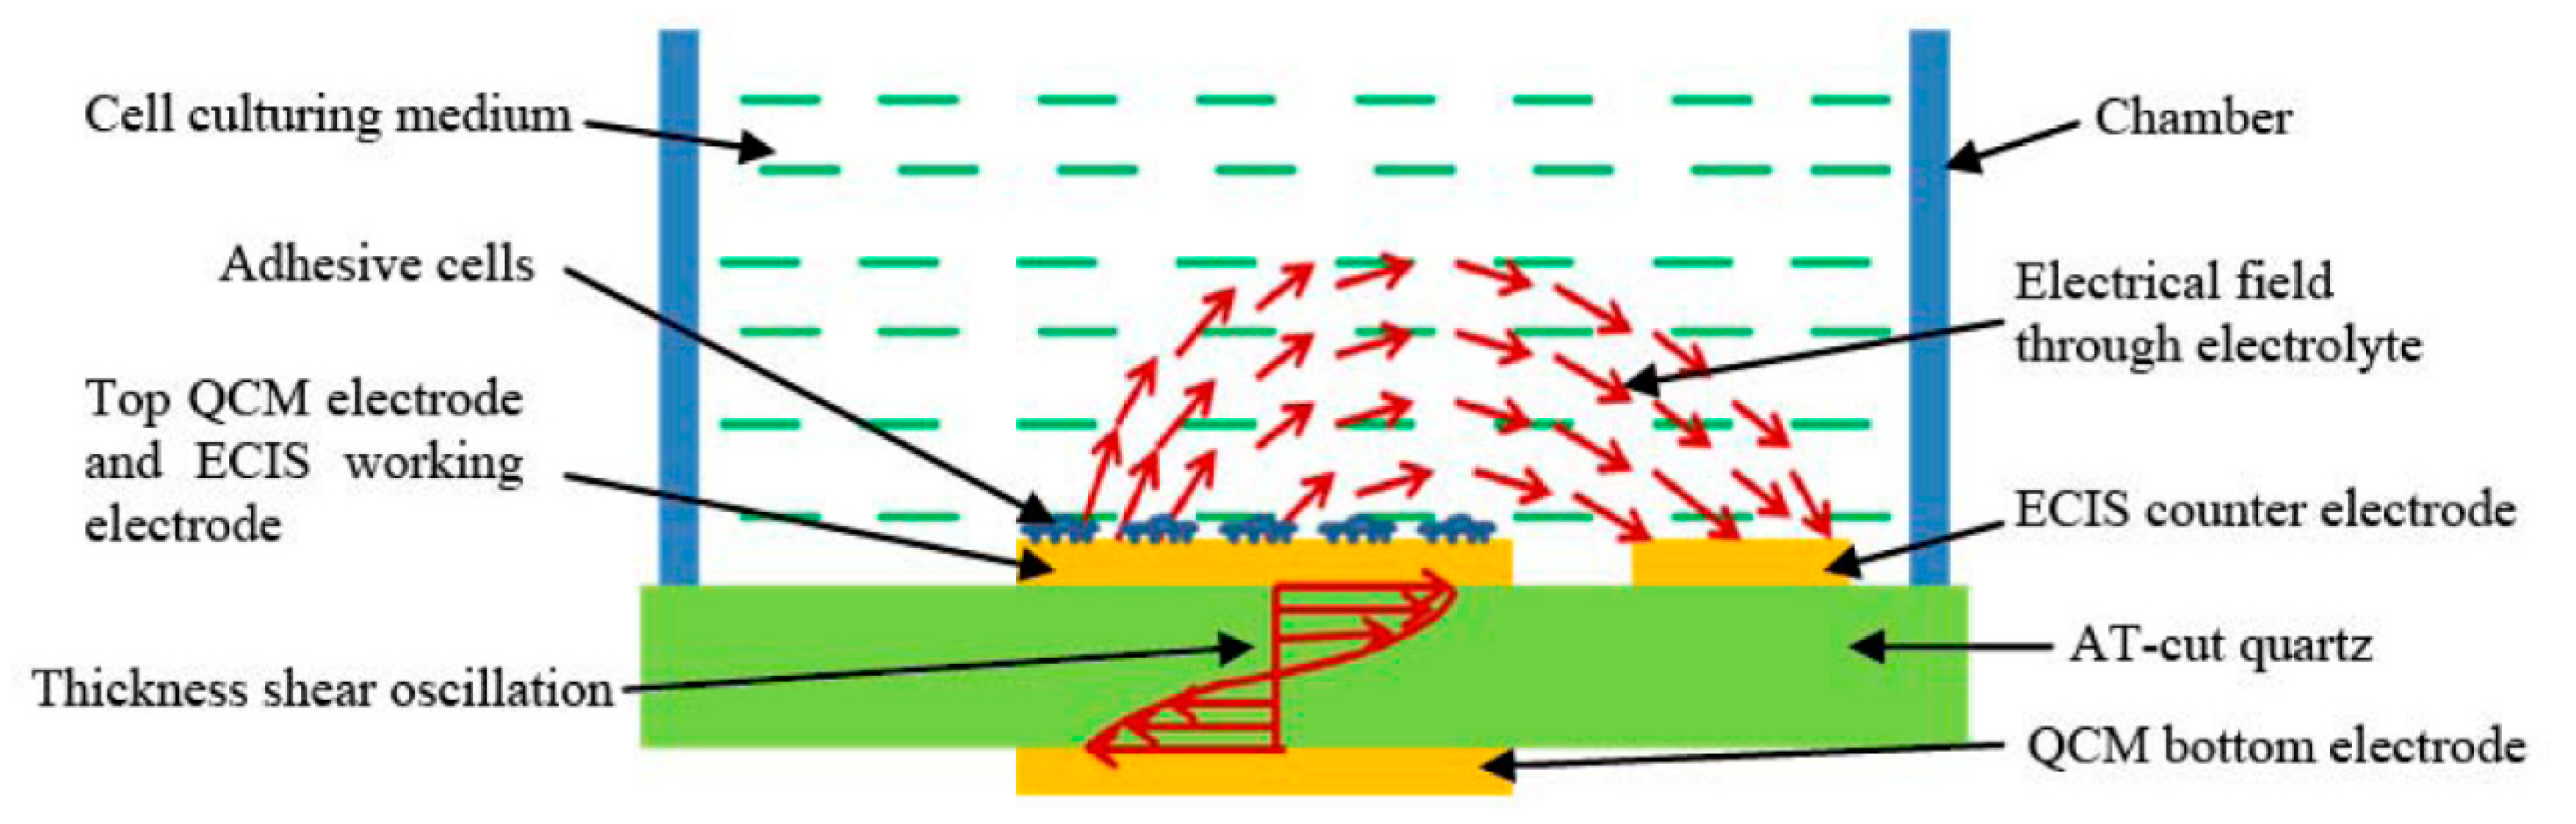
3. Electrical Biosensors
3.1. Impedance Techniques
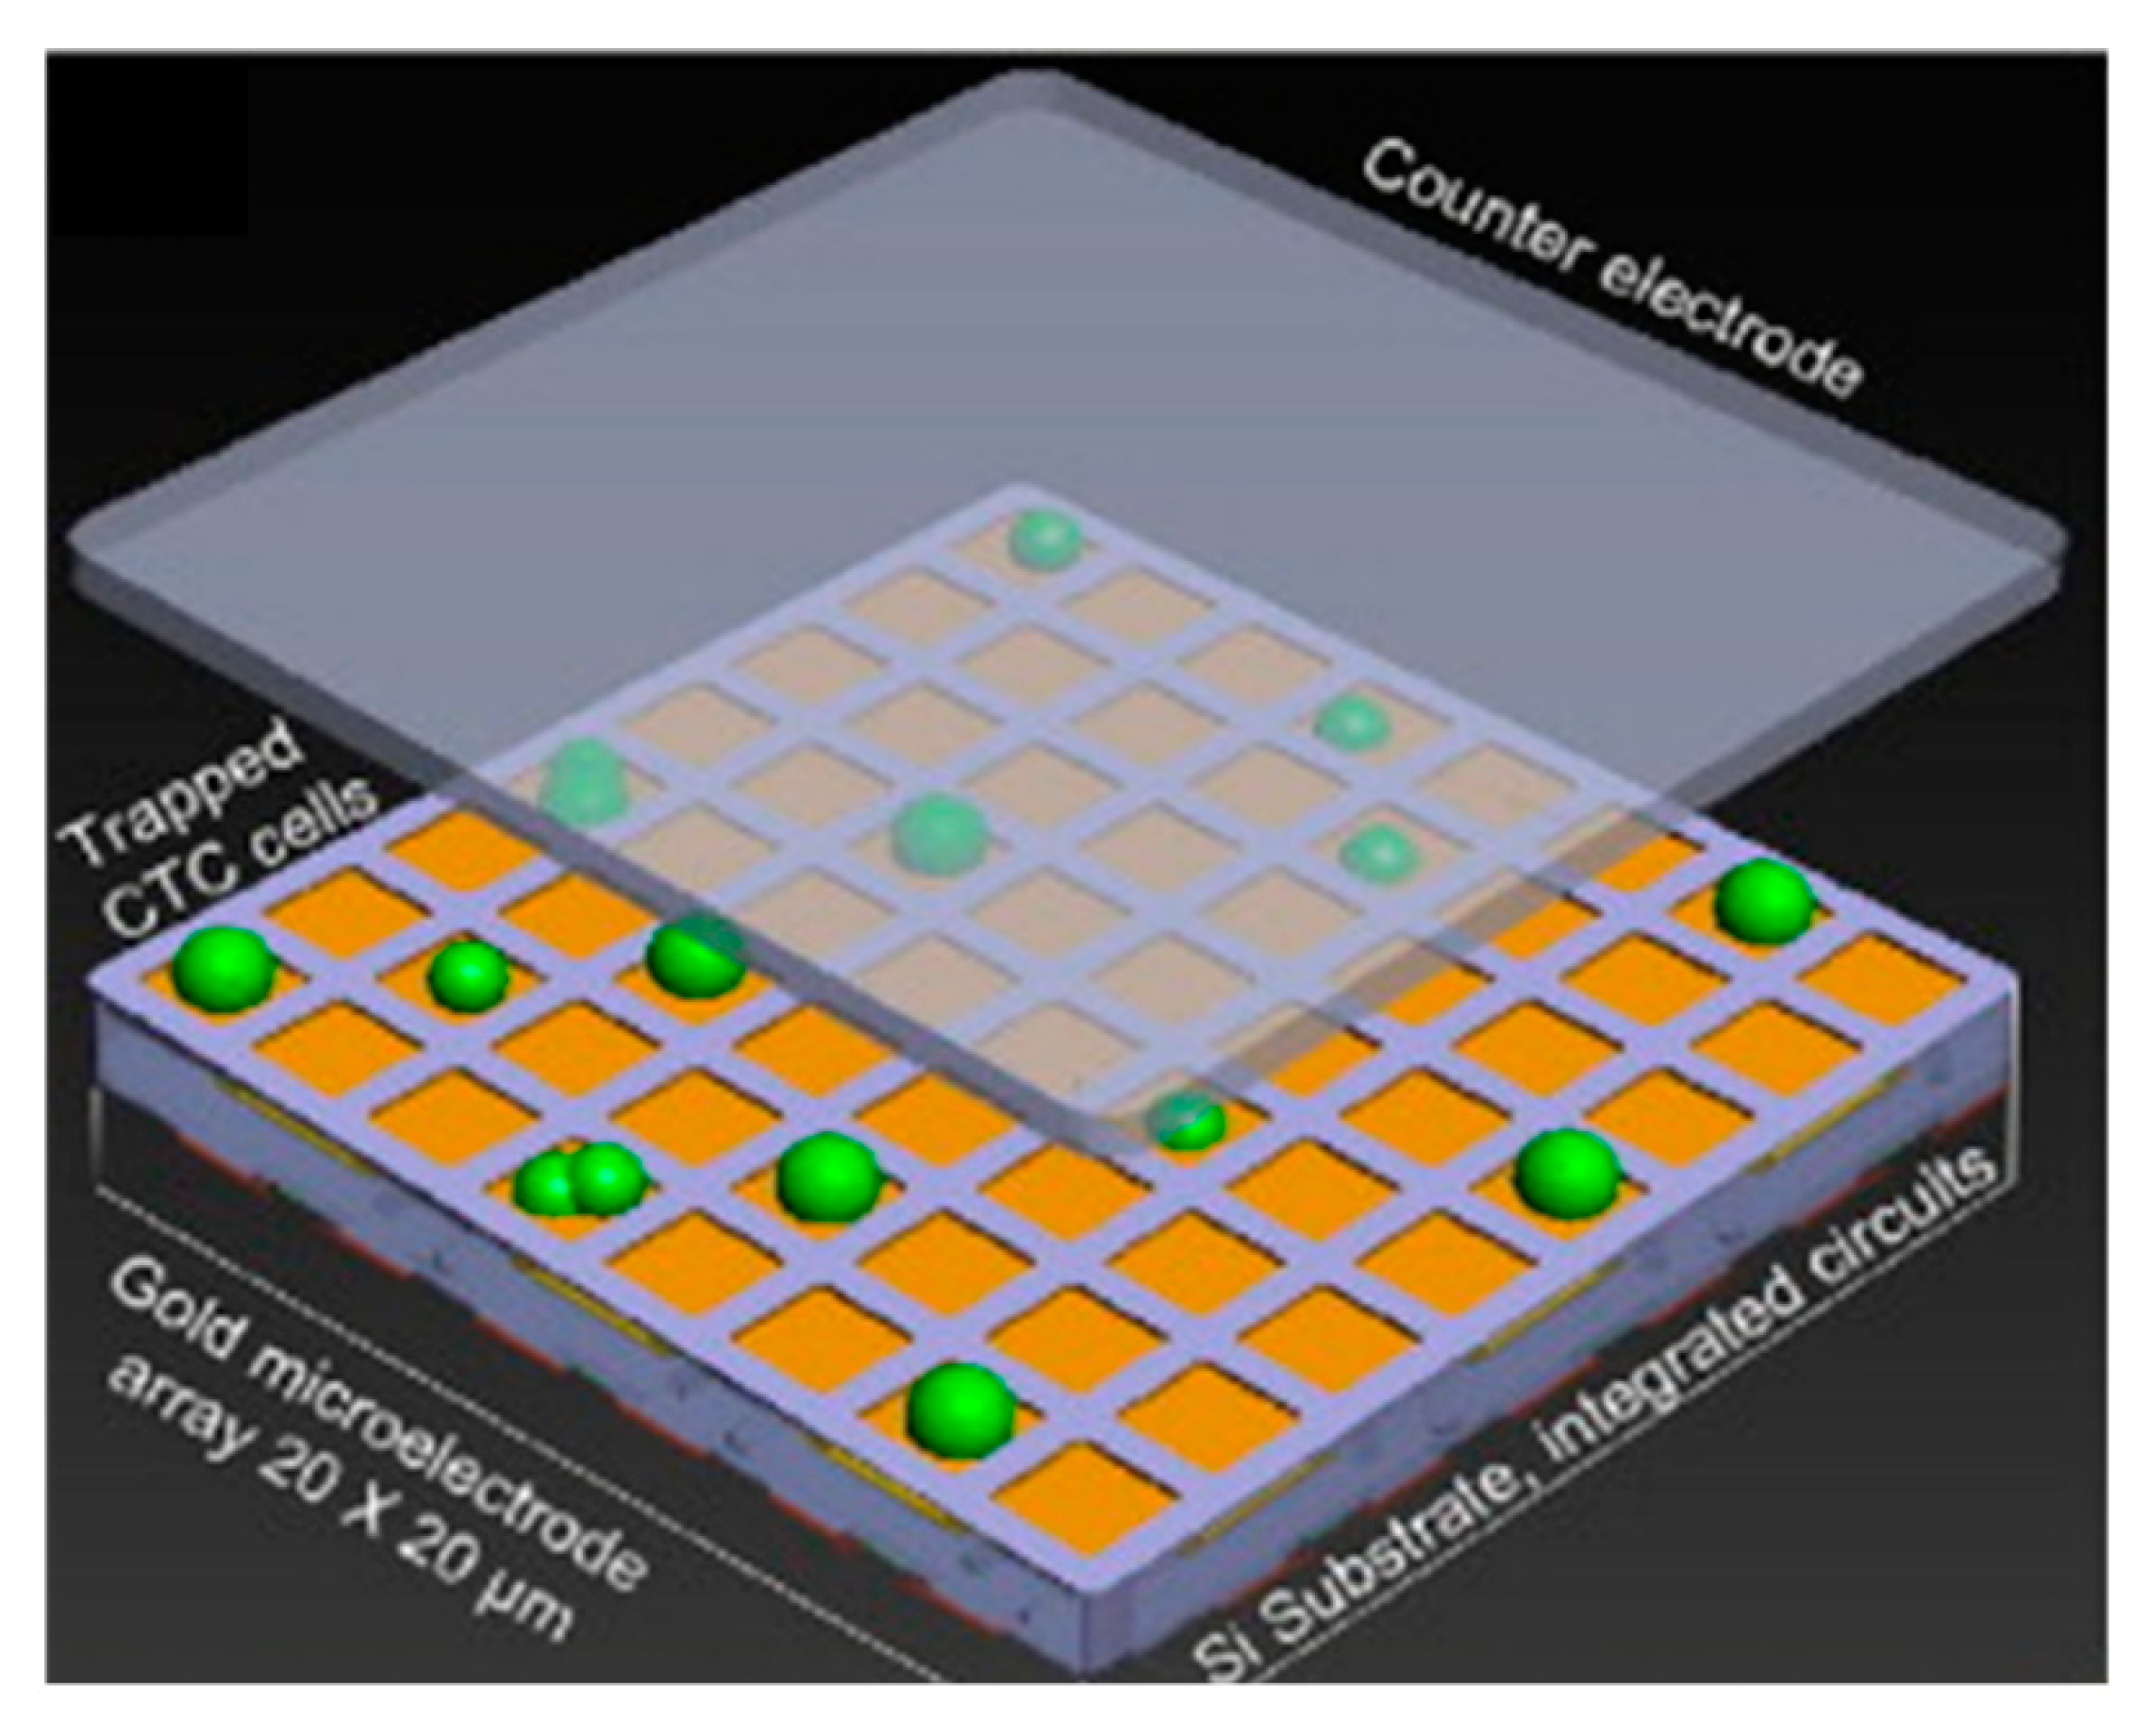
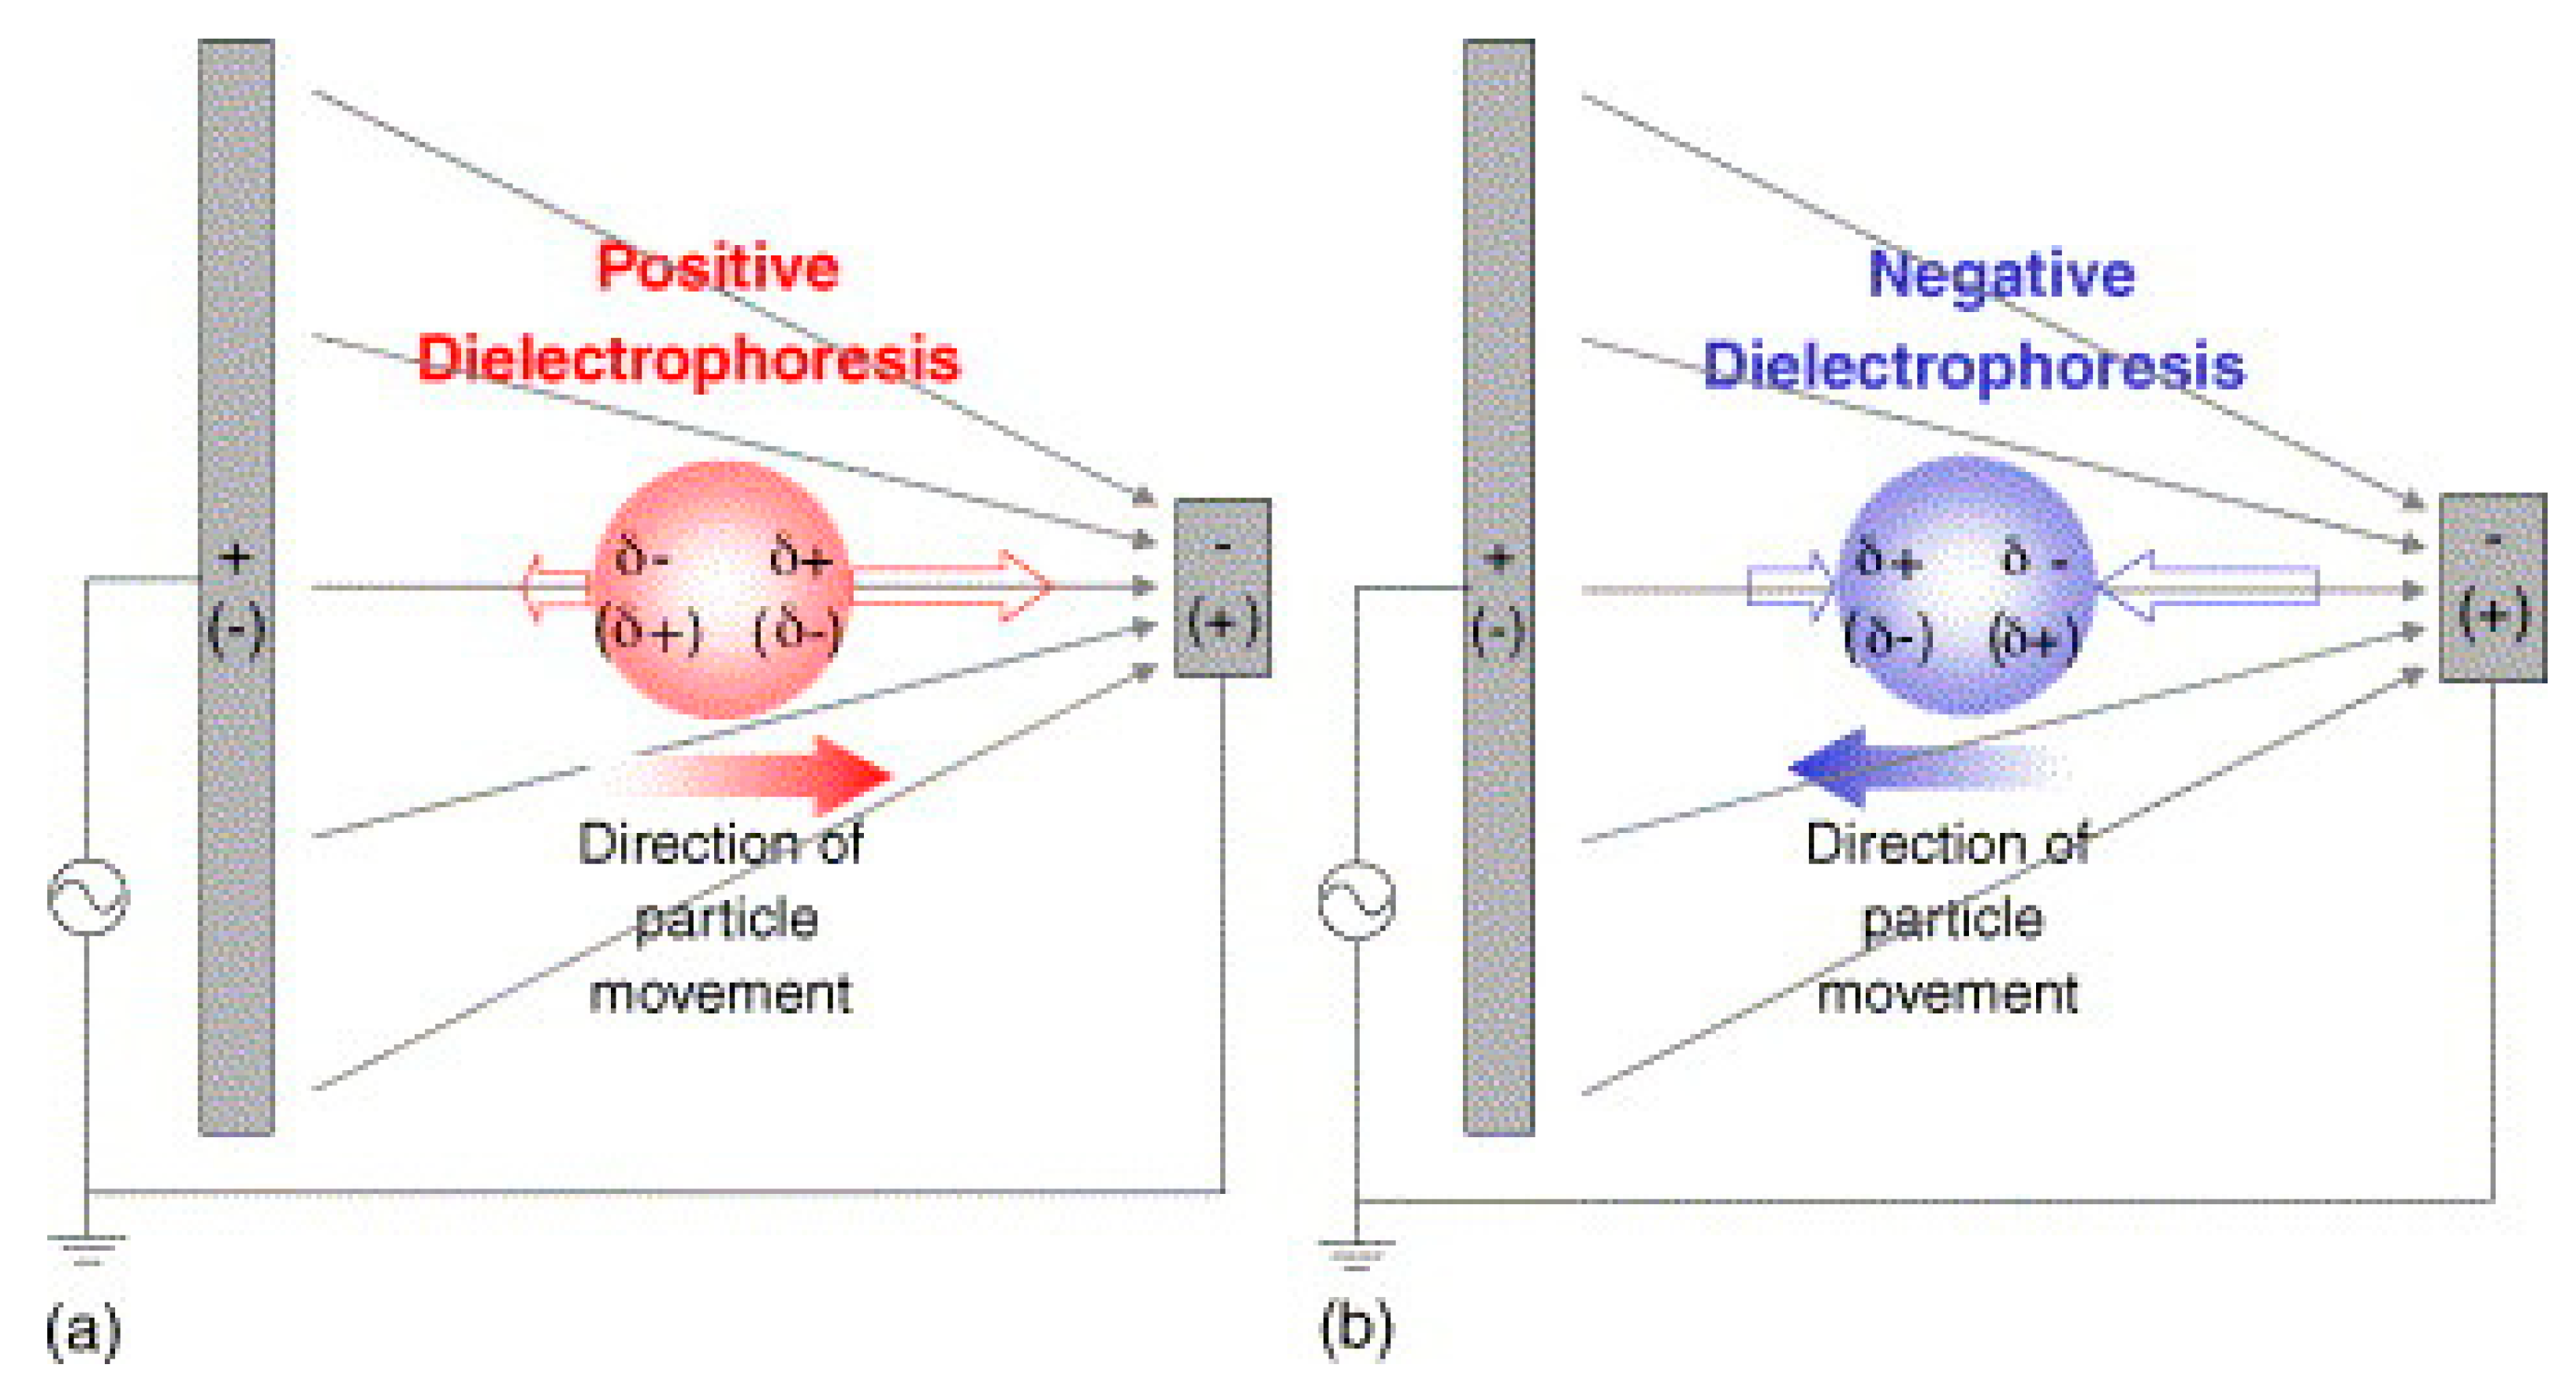
3.2. Dielectrophoresis
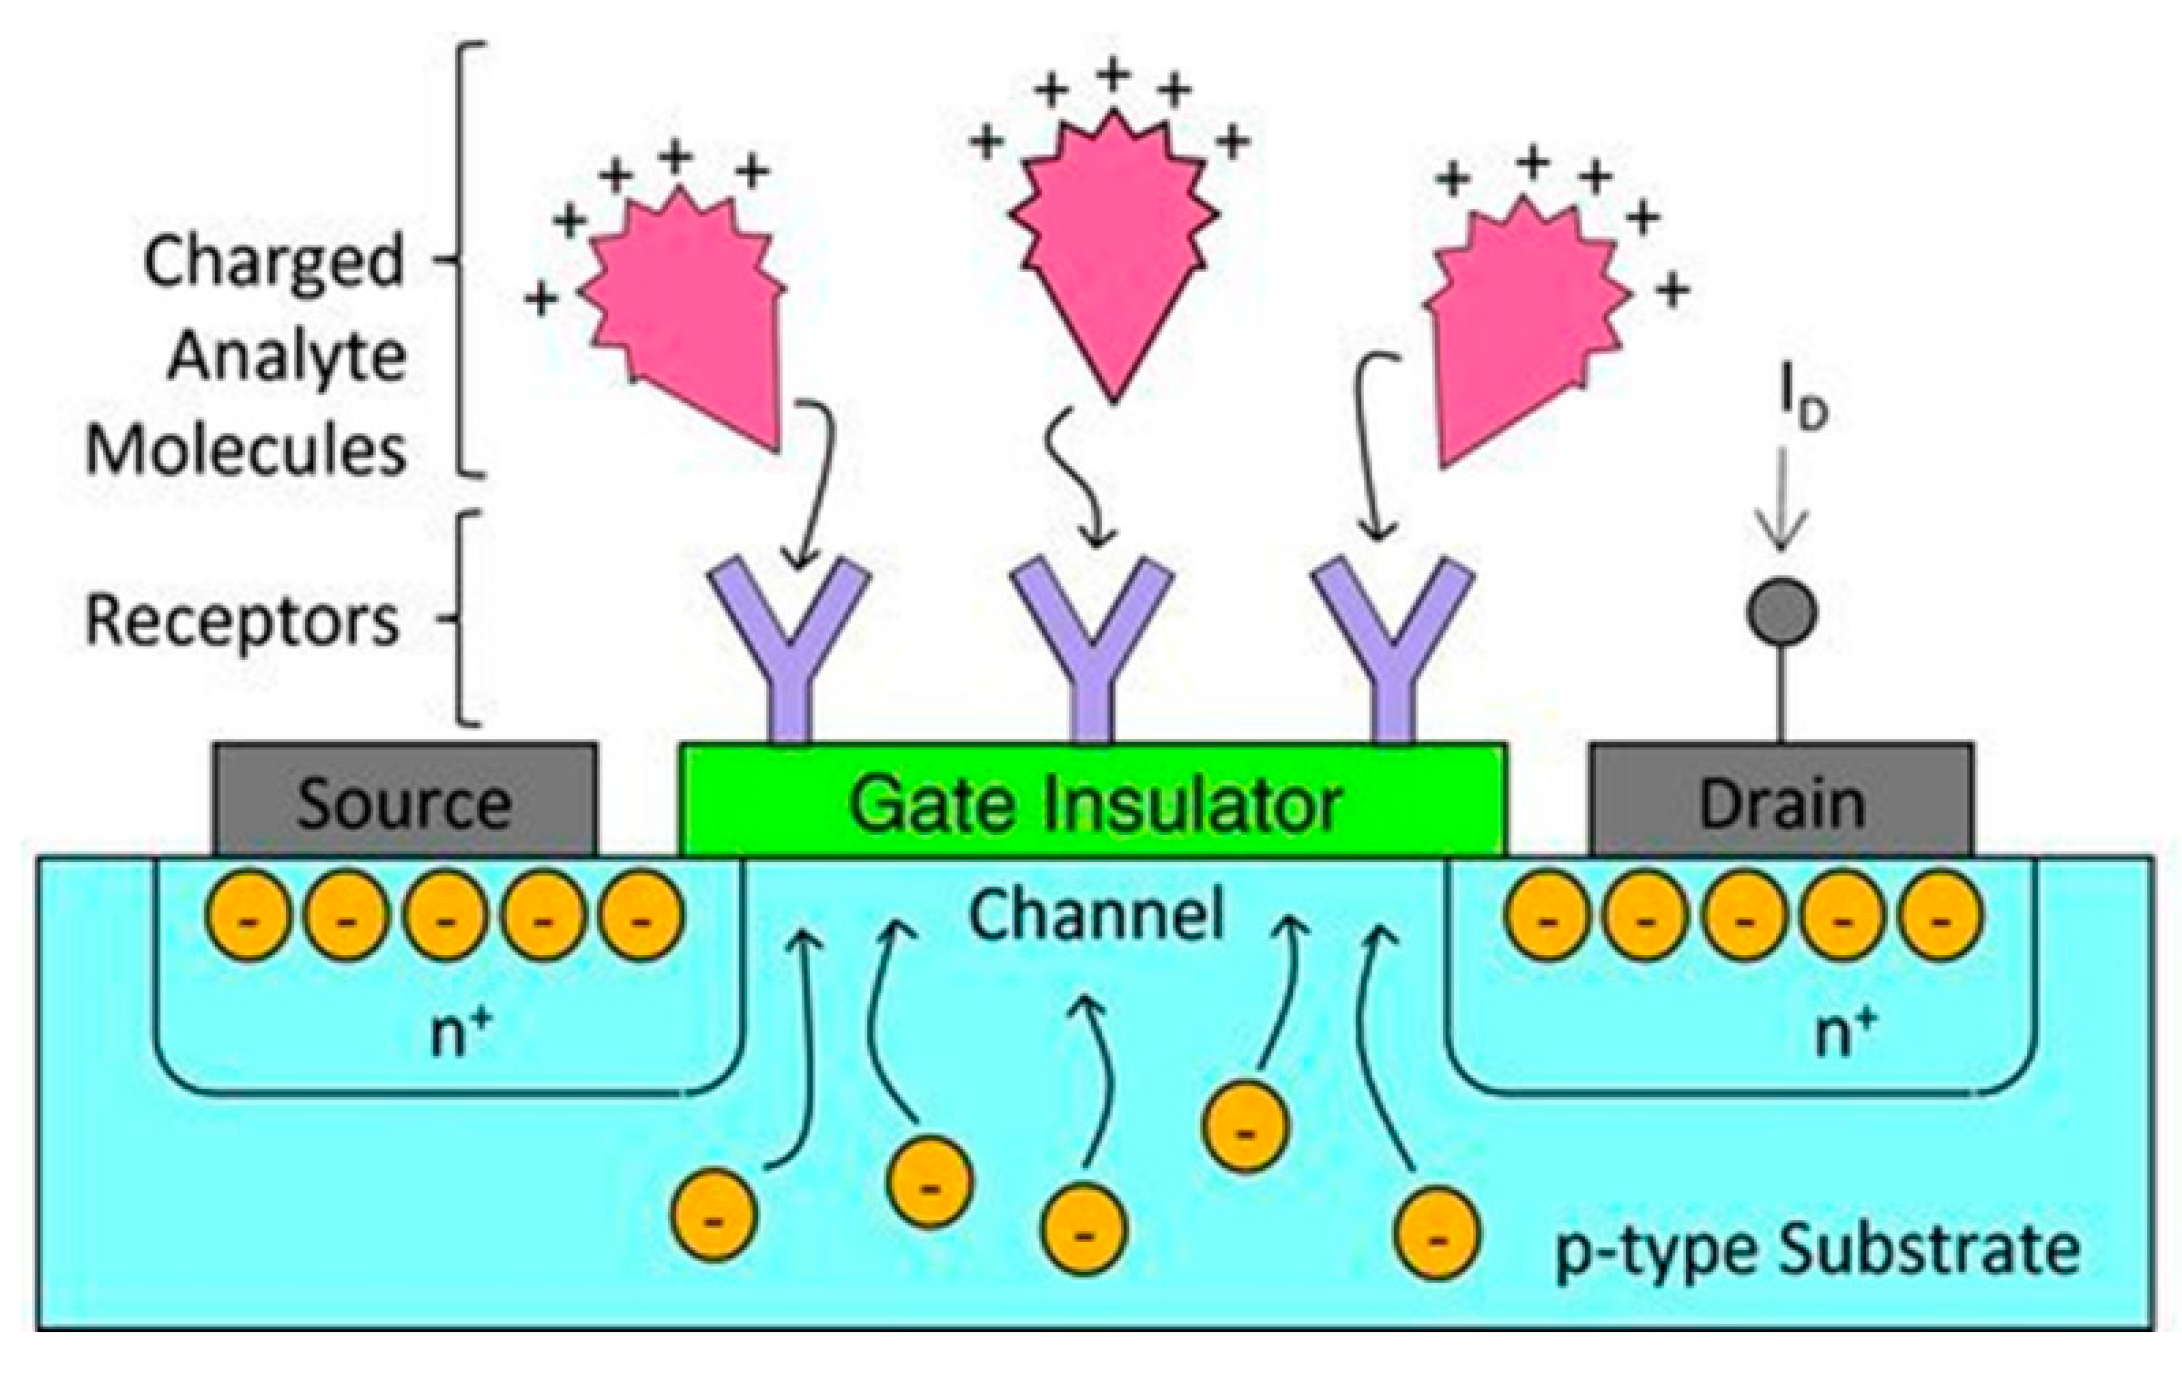
3.3. Field Effect Transistors
4. Conclusions
5. Outlook

| Field | Ref. | Detection Limit/fg mL−1 | Analyte | Bioprobe | Analytical Surface | Notes | Advantages | Disadvantages |
|---|---|---|---|---|---|---|---|---|
| Microcantilever | [30] | 50 | Prostate Specific Antigen | Antibody | Silicon | Trampoline shaped resonator, vacuum required | High sensitivity, label free, commercially available, easy fabrication. | Complex preparation, use of lasers and preference for vacuum conditions. |
| [31] | 4 | Estradiol hormone | Antibody | Silicon | Array of microcantilevers, optical lever type detection | |||
| [53] | 21,000 | Gold Nanoparticle | - | Silicon | Suspended nanochannel resonator, low flow rate (1 pL s−1) | |||
| Photoacoustic | [58] | 775,000,000 | ONOO- marked with CyBA | Small molecule | In vivo | Commercial LED Photoacoustic imaging system at 1 cm depth | Non-invasive imaging and detection, real-time measurements, useful for flow cytometry. | Lasers commonly used, bulky, expensive. |
| [57] | 0.9 | HF | - | Silicon | Microcantilever transducer | |||
| [70] | 150,000 | Malaria infected RBC | - | In vivo | Photoacoustic flow cytometry | |||
| Micropillar | [80] | - | HeLa | Fibronectin | Silicon | Gold disk coated silicon pillars, traction force 1 nN LoD | Effective force sensors, could use cells as proxy, could be developed with electrical measurement. | Currently complex image processing, sensitivity needs improvement, not physiological conditions. |
| [242] | - | Mouse embryonic fibroblasts | Fibronectin | PDMS | Silicon templated PDMS pillars, traction force 0.1 nN LoD | |||
| [99] | - | Water flow | - | Silicon on PZT | Si array embedded in PDMS, water velocity LoD 8.2 µm s−1 | |||
| QCM | [123] | 130,000 | C-reactive protein | Antibody | Gold on Quartz | Indirect competitive reaction | Commercially available, cheap, real time measurements, label free. | Sensitivity limited by size constraints; surface functionalisation remains key issue. |
| [121] | 50,000,000 | DNA | DNA | Gold on Quartz | Complementary DNA immobilised with sulphur on gold | |||
| [243] | 14.3 | Lysozyme | DNA | Gold on Quartz | Biocatalytic precipitation amplified | |||
| SAW | [126] | 3,500,000 | Bacterial endotoxin | DNA | Graphene on Quartz | Single layer graphene | Commercially available, real-time measurements, potential for higher sensitivity than QCM, label free. | Surface functionalisation still issue, relatively long preparation. |
| [108] | 310,000 | Carcinoembryonic antigen | Antibody | Gold on Quartz | Chemically modified gold, stable over 30 days | |||
| [114] | 100,000,000 | E. Coli | Antibody | AlN | Flexible AlN on PEN, for polymer RFID food packaging | |||
| ECIS | [165] | 1000 | C-reactive protein | Antibody | Polypyrrole on PS | Conductive coated polystyrene electrospun mat, low cost | Spatial resolution possible, real time response, label free, simple, cheap. | Challenge processing and interpreting data, difficult to measure single cells. |
| [244] | 3,300,000 | Okadaic acid | HeLa Cells | HeLa cells on Gold | Cells used as proxy for toxin | |||
| [245] | 200 | E. Coli | Antibody | Gold | Functionalised with self-assembled monolayer template | |||
| Dielectrophoresis | [246] | 1000 | Cardiac troponin I | Antibody | Carbon nanotube | Dielectrophoretic enhancement, impedance measurement | Can purify molecules of interest, non-invasive, commercially available, easy fabrication. | By itself not sensitive, can cause cell death, affected by environmental factors. |
| [241] | 3.4 | Prostate Specific Antigen | Antibody | Silicon nanowire | Dielectrophoretic enhancement, impedance measurement | |||
| [247] | 27,000,000 | Trypanosome | - | Gold on Glass | Spiral electrodes concentrates analyte, manual visual count | |||
| FET | [212] | 23 | Prostate Specific Antigen | Antibody | Silicon nanowire | Surface modified with Gold nanoparticles | Extremely sensitive, commercial technology, real time measurements, simple interpretation. | Sensitive to environment. |
| [213] | 1 | Micro RNA | DNA | Silicon nanowire | PNA functionalised surface | |||
| [248] | 3.2 | DNA | DNA | Carbon nanotube | Single strand DNA functionalised surface | |||
| SPR | [23] | 10,000 | Cardiac troponin T | Antibody | Gold | Modified gold with carboxymethyldextran hydrogel | Wide range of analytes, small sample volumes. | Dependent on surface functionalisation, requires knowledge of reaction mechanism, slow. |
| [249] | 1,500,000 | C-reactive protein | E. Coli | Gold | Autodisplaying E. Coli as proxy | |||
| [250] | 68,000 | Cardiac troponin I | Antibody | Gold | Chemically modified gold | |||
| Electrochemical | [251] | 72,000,000 | Glucose | - | ZnO nanorods | CuO nanoparticle modified | Simple interpretation, commercially available, well characterised. | Increasingly small gains, complex fabrication required for high sensitivity. |
| [252] | 55 | DNA | DNA | Gold nanorods | On Graphene Oxide base | |||
| [253] | 5,400,000 | Glucose | - | Nanocomposite | Graphene, Ni and polyvinyl pyroldine nanocomposite |
Author Contributions
Funding
Conflicts of Interest
References
- Clark, L.C.; Lyons, C. Electrode systems for continuous monitoring in cardiovascular surgery. Ann. N. Y. Acad. Sci. 2006, 102, 29–45. [Google Scholar] [CrossRef] [PubMed]
- Reddy, S.M.; Higson, S.P.J.; Vadgama, P.M. Enzyme and Other Biosensors: Evolution of a Technology. Eng. Sci. Educ. J. 1994, 3, 41–48. [Google Scholar] [CrossRef]
- Thévenot, D.R.; Toth, K.; Durst, R.A.; Wilson, G.S. Electrochemical Biosensors: Recommended Definitions and Classification. Biosens. Bioelectron. 2001, 16, 121–131. [Google Scholar] [CrossRef]
- Lowe, C.R. Biosensors. Philos. Trans. R. Soc. Lond. Ser. B Biol. Sci. 1989, 324, 487–496. [Google Scholar]
- Nature. Biosensors—Latest Research and Reviews. Available online: https://www.nature.com/subjects/biosensors (accessed on 17 July 2020).
- Turner, A.P.F. Biosensors: Sense and Sensibility. Chem. Soc. Rev. 2013, 42, 3184. [Google Scholar] [CrossRef]
- Clarke, S.F.; Foster, J.R. A History of Blood Glucose Meters and Their Role in Self-Monitoring of Diabetes Mellitus. Br. J. Biomed. Sci. 2012, 69, 83–93. [Google Scholar] [CrossRef]
- Olczuk, D.; Priefer, R. A History of Continuous Glucose Monitors (CGMs) in Self-Monitoring of Diabetes Mellitus. Diabetes Metab. Syndr. Clin. Res. Rev. 2018, 12, 181–187. [Google Scholar] [CrossRef]
- Gojka, R. Diabetes. Available online: https://www.who.int/health-topics/diabetes#tab=tab_1 (accessed on 10 May 2020).
- Villena Gonzales, W.; Mobashsher, A.; Abbosh, A. The Progress of Glucose Monitoring—A Review of Invasive to Minimally and Non-Invasive Techniques, Devices and Sensors. Sensors 2019, 19, 800. [Google Scholar] [CrossRef]
- Bhalla, N.; Jolly, P.; Formisano, N.; Estrela, P. Introduction to Biosensors. Essays Biochem. 2016, 60, 1–8. [Google Scholar] [CrossRef]
- Akkilic, N.; Geschwindner, S.; Höök, F. Single-Molecule Biosensors: Recent Advances and Applications. Biosens. Bioelectron. 2020, 151, 111944. [Google Scholar] [CrossRef]
- Wang, J. SURVEY AND SUMMARY: From DNA Biosensors to Gene Chips. Nucleic Acids Res. 2000, 28, 3011–3016. [Google Scholar] [CrossRef]
- Sabu, C.; Henna, T.K.; Raphey, V.R.; Nivitha, K.P.; Pramod, K. Advanced Biosensors for Glucose and Insulin. Biosens. Bioelectron. 2019, 141, 111201. [Google Scholar] [CrossRef] [PubMed]
- Wang, J. Electrochemical Glucose Biosensors. Chem. Rev. 2008, 108, 814–825. [Google Scholar] [CrossRef] [PubMed]
- Chung, R.-J.; Wang, A.-N.; Liao, Q.-L.; Chuang, K.-Y. Non-Enzymatic Glucose Sensor Composed of Carbon-Coated Nano-Zinc Oxide. Nanomaterials 2017, 7, 36. [Google Scholar] [CrossRef] [PubMed]
- Sakamoto, S.; Putalun, W.; Vimolmangkang, S.; Phoolcharoen, W.; Shoyama, Y.; Tanaka, H.; Morimoto, S. Enzyme-Linked Immunosorbent Assay for the Quantitative/Qualitative Analysis of Plant Secondary Metabolites. J. Nat. Med. 2018, 72, 32–42. [Google Scholar] [CrossRef] [PubMed]
- Posthuma-Trumpie, G.A.; Korf, J.; van Amerongen, A. Lateral Flow (Immuno)Assay: Its Strengths, Weaknesses, Opportunities and Threats. A Literature Survey. Anal. Bioanal. Chem. 2009, 393, 569–582. [Google Scholar] [CrossRef]
- De La Rica, R.; Stevens, M.M. Plasmonic ELISA for the Ultrasensitive Detection of Disease Biomarkers with the Naked Eye. Nat. Nanotechnol. 2012, 7, 821–824. [Google Scholar] [CrossRef]
- Hoa, X.D.; Kirk, A.G.; Tabrizian, M. Towards Integrated and Sensitive Surface Plasmon Resonance Biosensors: A Review of Recent Progress. Biosens. Bioelectron. 2007, 23, 151–160. [Google Scholar] [CrossRef]
- Homola, J.; Yee, S.S.; Gauglitz, G. Surface Plasmon Resonance Sensors: Review. Sens. Actuators B Chem. 1999, 54, 3–15. [Google Scholar] [CrossRef]
- Tiwari, P.B.; Wang, X.; He, J.; Darici, Y. Analyzing Surface Plasmon Resonance Data: Choosing a Correct Biphasic Model for Interpretation. Rev. Sci. Instrum. 2015, 86, 035001. [Google Scholar] [CrossRef]
- Dutra, R.F.; Kubota, L.T. An SPR Immunosensor for Human Cardiac Troponin T Using Specific Binding Avidin to Biotin at Carboxymethyldextran-Modified Gold Chip. Clin. Chim. Acta 2007, 376, 114–120. [Google Scholar] [CrossRef] [PubMed]
- Guo, X. Surface Plasmon Resonance Based Biosensor Technique: A Review. J. Biophotonics 2012, 5, 483–501. [Google Scholar] [CrossRef] [PubMed]
- Helmerhorst, E.; Chandler, D.J.; Nussio, M.; Mamotte, C.D. Real-Time and Label-Free Bio-Sensing of Molecular Interactions by Surface Plasmon Resonance: A Laboratory Medicine Perspective. Clin. Biochem. Rev. 2012, 33, 161–173. [Google Scholar] [PubMed]
- Weller, J.; Budson, A. Current Understanding of Alzheimer’s Disease Diagnosis and Treatment. F1000Research 2018, 7, 1161. [Google Scholar] [CrossRef]
- Liu, P.-P.; Xie, Y.; Meng, X.-Y.; Kang, J.-S. History and Progress of Hypotheses and Clinical Trials for Alzheimer’s Disease. Signal Transduct. Target. Ther. 2019, 4, 29. [Google Scholar] [CrossRef]
- Xu, J.; Bertke, M.; Wasisto, H.S.; Peiner, E. Piezoresistive Microcantilevers for Humidity Sensing. J. Micromech. Microeng. 2019, 29, 053003. [Google Scholar] [CrossRef]
- Johnson, B.N.; Mutharasan, R. Biosensing Using Dynamic-Mode Cantilever Sensors: A Review. Biosens. Bioelectron. 2012, 32, 1–18. [Google Scholar] [CrossRef]
- Waggoner, P.S.; Varshney, M.; Craighead, H.G. Detection of Prostate Specific Antigen with Nanomechanical Resonators. Lab Chip 2009, 9, 3095–3099. [Google Scholar] [CrossRef]
- Ricciardi, C.; Ferrante, I.; Castagna, R.; Frascella, F.; Marasso, S.L.; Santoro, K.; Gili, M.; Pitardi, D.; Pezzolato, M.; Bozzetta, E. Immunodetection of 17Β-Estradiol in Serum at Ppt Level by Microcantilever Resonators. Biosens. Bioelectron. 2013, 40, 407–411. [Google Scholar] [CrossRef]
- Alvarez, M.; Lechuga, L.M. Microcantilever-Based Platforms as Biosensing Tools. Analyst 2010, 135, 827–836. [Google Scholar] [CrossRef]
- Waggoner, P.S.; Craighead, H.G. The Relationship between Material Properties, Device Design, and the Sensitivity of Resonant Mechanical Sensors. J. Appl. Phys. 2009, 105, 054306. [Google Scholar] [CrossRef]
- Breitsprecher, D.; Fung, P.A.; Tschammer, N. Improving Biosensor Assay Development by Determining Sample Quality with Tycho NT.6. Nat. Methods 2018, 15, 298. [Google Scholar] [CrossRef]
- Boisen, A.; Thundat, T. Design & Fabrication of Cantilever Array Biosensors. Mater. Today 2009, 12, 32–38. [Google Scholar] [CrossRef]
- Shekhawat, G. MOSFET-Embedded Microcantilevers for Measuring Deflection in Biomolecular Sensors. Science 2006, 311, 1592–1595. [Google Scholar] [CrossRef]
- Arlett, J.L.; Myers, E.B.; Roukes, M.L. Comparative Advantages of Mechanical Biosensors. Nat. Nanotechnol. 2011, 6, 203–215. [Google Scholar] [CrossRef]
- Liu, X.; Wang, L.; Zhao, J.; Zhu, Y.; Yang, J.; Yang, F. Enhanced Binding Efficiency of Microcantilever Biosensor for the Detection of Yersinia. Sensors 2019, 19, 3326. [Google Scholar] [CrossRef]
- Pinto, R.M.R.; Chu, V.; Conde, J.P. Label-Free Biosensing of DNA in Microfluidics Using Amorphous Silicon Capacitive Micro-Cantilevers. IEEE Sens. J. 2020, 20, 9018–9028. [Google Scholar] [CrossRef]
- Sato, R.H.; Kosaka, P.M.; Omori, Á.T.; Ferreira, E.A.; Petri, D.F.S.; Malvar, Ó.; Domínguez, C.M.; Pini, V.; Ahumada, Ó.; Tamayo, J.; et al. Development of a Methodology for Reversible Chemical Modification of Silicon Surfaces with Application in Nanomechanical Biosensors. Biosens. Bioelectron. 2019, 137, 287–293. [Google Scholar] [CrossRef]
- Peng, R.-P.; Xing, L.-B.; Wang, X.-J.; Wu, C.-J.; Chen, B.; Ji, H.-F.; Wu, L.-Z.; Tung, C.-H. A Beryllium-Selective Microcantilever Sensor Modified with Benzo-9-Crown-3 Functionalized Polymer Brushes. Anal. Methods 2017, 9, 3356–3360. [Google Scholar] [CrossRef]
- Okan, M.; Sari, E.; Duman, M. Molecularly Imprinted Polymer Based Micromechanical Cantilever Sensor System for the Selective Determination of Ciprofloxacin. Biosens. Bioelectron. 2017, 88, 258–264. [Google Scholar] [CrossRef]
- Backmann, N.; Zahnd, C.; Huber, F.; Bietsch, A.; Pluckthun, A.; Lang, H.-P.; Guntherodt, H.-J.; Hegner, M.; Gerber, C. A Label-Free Immunosensor Array Using Single-Chain Antibody Fragments. Proc. Natl. Acad. Sci. USA 2005, 102, 14587–14592. [Google Scholar] [CrossRef] [PubMed]
- Wang, J.; Wang, L.; Zhu, Y.; Zhang, J.; Liao, J.; Wang, S.; Yang, J.; Yang, F. A High Accuracy Cantilever Array Sensor for Early Liver Cancer Diagnosis. Biomed. Microdevices 2016, 18, 110. [Google Scholar] [CrossRef] [PubMed]
- Shimizu, Y.; Kudo, Y.; Chen, Y.-L.; Ito, S.; Gao, W. An Optical Lever by Using a Mode-Locked Laser for Angle Measurement. Precis. Eng. 2017, 47, 72–80. [Google Scholar] [CrossRef]
- Stanbridge, A.B.; Ewins, D.J. Modal Testing Using A Scanning Laser Doppler Vibrometer. Mech. Syst. Signal Process. 1999, 13, 255–270. [Google Scholar] [CrossRef]
- Gupta, A.; Akin, D.; Bashir, R. Single Virus Particle Mass Detection Using Microresonators with Nanoscale Thickness. Appl. Phys. Lett. 2004, 84, 1976–1978. [Google Scholar] [CrossRef]
- Burg, T.P.; Manalis, S.R. Suspended Microchannel Resonators for Biomolecular Detection. Appl. Phys. Lett. 2003, 83, 2698–2700. [Google Scholar] [CrossRef]
- Burg, T.P.; Godin, M.; Knudsen, S.M.; Shen, W.; Carlson, G.; Foster, J.S.; Babcock, K.; Manalis, S.R. Weighing of Biomolecules, Single Cells and Single Nanoparticles in Fluid. Nature 2007, 446, 1066–1069. [Google Scholar] [CrossRef]
- Bryan, A.K.; Hecht, V.C.; Shen, W.; Payer, K.; Grover, W.H.; Manalis, S.R. Measuring Single Cell Mass, Volume, and Density with Dual Suspended Microchannel Resonators. Lab Chip 2014, 14, 569–576. [Google Scholar] [CrossRef]
- Godin, M.; Bryan, A.K.; Burg, T.P.; Babcock, K.; Manalis, S.R. Measuring the Mass, Density, and Size of Particles and Cells Using a Suspended Microchannel Resonator. Appl. Phys. Lett. 2007, 91, 123121. [Google Scholar] [CrossRef]
- Calmo, R.; Lovera, A.; Stassi, S.; Chiadò, A.; Scaiola, D.; Bosco, F.; Ricciardi, C. Monolithic Glass Suspended Microchannel Resonators for Enhanced Mass Sensing of Liquids. Sens. Actuators B Chem. 2019, 283, 298–303. [Google Scholar] [CrossRef]
- Lee, J.; Shen, W.; Payer, K.; Burg, T.P.; Manalis, S.R. Toward Attogram Mass Measurements in Solution with Suspended Nanochannel Resonators. Nano Lett. 2010, 10, 2537–2542. [Google Scholar] [CrossRef] [PubMed]
- SoltanRezaee, M.; Bodaghi, M. Simulation of an Electrically Actuated Cantilever as a Novel Biosensor. Sci. Rep. 2020, 10, 3385. [Google Scholar] [CrossRef] [PubMed]
- Hajireza, P.; Shi, W.; Bell, K.; Paproski, R.J.; Zemp, R.J. Non-Interferometric Photoacoustic Remote Sensing Microscopy. Light Sci. Appl. 2017, 6, e16278. [Google Scholar] [CrossRef] [PubMed]
- Sim, J.Y.; Ahn, C.G.; Jeong, E.J.; Kim, B.K. In Vivo Microscopic Photoacoustic Spectroscopy for Non-Invasive Glucose Monitoring Invulnerable to Skin Secretion Products. Sci. Rep. 2018, 8, 1059. [Google Scholar] [CrossRef]
- Tomberg, T.; Vainio, M.; Hieta, T.; Halonen, L. Sub-Parts-per-Trillion Level Sensitivity in Trace Gas Detection by Cantilever-Enhanced Photo-Acoustic Spectroscopy. Sci. Rep. 2018, 8, 1848. [Google Scholar] [CrossRef]
- Hariri, A.; Zhao, E.; Jeevarathinam, A.S.; Lemaster, J.; Zhang, J.; Jokerst, J.V. Molecular Imaging of Oxidative Stress Using an LED-Based Photoacoustic Imaging System. Sci. Rep. 2019, 9, 11378. [Google Scholar] [CrossRef]
- Dangi, A.; Agrawal, S.; Lieberknecht, J.; Zhang, J.; Kothapalli, S.-R. Ring Ultrasound Transducer Based Miniaturized Photoacoustic Imaging System. In Proceedings of the 2018 IEEE SENSORS, New Delhi, India, 28–31 October 2018; pp. 1–4. [Google Scholar] [CrossRef]
- Valluru, K.S.; Willmann, J.K. Clinical Photoacoustic Imaging of Cancer. Ultrasonography 2016, 35, 267–280. [Google Scholar] [CrossRef]
- Yue, S.; Lin, F.; Zhang, Q.; Epie, N.; Dong, S.; Shan, X.; Liu, D.; Chu, W.-K.; Wang, Z.; Bao, J. Gold-Implanted Plasmonic Quartz Plate as a Launch Pad for Laser-Driven Photoacoustic Microfluidic Pumps. Proc. Natl. Acad. Sci. USA 2019, 116, 6580–6585. [Google Scholar] [CrossRef]
- Kim, T.; Chang, W.-Y.; Kim, H.; Jiang, X. Narrow Band Photoacoustic Lamb Wave Generation for Nondestructive Testing Using Candle Soot Nanoparticle Patches. Appl. Phys. Lett. 2019, 115, 102902. [Google Scholar] [CrossRef]
- Sun, I.-C.; Ahn, C.-H.; Kim, K.; Emelianov, S. Photoacoustic Imaging of Cancer Cells with Glycol-Chitosan-Coated Gold Nanoparticles as Contrast Agents. J. Biomed. Opt. 2019, 24, 121903. [Google Scholar] [CrossRef]
- Oraevsky, A.A.; Clingman, B.; Zalev, J.; Stavros, A.T.; Yang, W.T.; Parikh, J.R. Clinical Optoacoustic Imaging Combined with Ultrasound for Coregistered Functional and Anatomical Mapping of Breast Tumors. Photoacoustics 2018, 12, 30–45. [Google Scholar] [CrossRef] [PubMed]
- Huang, D.; Swanson, E.; Lin, C.; Schuman, J.; Stinson, W.; Chang, W.; Hee, M.; Flotte, T.; Gregory, K.; Puliafito, C.; et al. Optical Coherence Tomography. Science 1991, 254, 1178–1181. [Google Scholar] [CrossRef] [PubMed]
- Weber, J.; Beard, P.C.; Bohndiek, S.E. Contrast Agents for Molecular Photoacoustic Imaging. Nat. Methods 2016, 13, 639–650. [Google Scholar] [CrossRef]
- Yao, J.; Wang, L.V. Photoacoustic Microscopy. Laser Photonics Rev. 2013, 7, 758–778. [Google Scholar] [CrossRef] [PubMed]
- Kishor, R.; Gao, F.; Sreejith, S.; Feng, X.; Seah, Y.P.; Wang, Z.; Stuparu, M.C.; Lim, T.-T.; Chen, X.; Zheng, Y. Photoacoustic Induced Surface Acoustic Wave Sensor for Concurrent Opto-Mechanical Microfluidic Sensing of Dyes and Plasmonic Nanoparticles. RSC Adv. 2016, 6, 50238–50244. [Google Scholar] [CrossRef]
- Zackrisson, S.; van de Ven, S.M.W.Y.; Gambhir, S.S. Light In and Sound Out: Emerging Translational Strategies for Photoacoustic Imaging. Cancer Res. 2014, 74, 979–1004. [Google Scholar] [CrossRef]
- Gnyawali, V.; Strohm, E.M.; Wang, J.-Z.; Tsai, S.S.H.; Kolios, M.C. Simultaneous Acoustic and Photoacoustic Microfluidic Flow Cytometry for Label-Free Analysis. Sci. Rep. 2019, 9, 1585. [Google Scholar] [CrossRef]
- Cai, C.; Carey, K.A.; Nedosekin, D.A.; Menyaev, Y.A.; Sarimollaoglu, M.; Galanzha, E.I.; Stumhofer, J.S.; Zharov, V.P. In Vivo Photoacoustic Flow Cytometry for Early Malaria Diagnosis. Cytom. Part A 2016, 89, 531–542. [Google Scholar] [CrossRef]
- Zhang, X.; Fincke, J.R.; Wynn, C.M.; Johnson, M.R.; Haupt, R.W.; Anthony, B.W. Full Noncontact Laser Ultrasound: First Human Data. Light Sci. Appl. 2019, 8, 119. [Google Scholar] [CrossRef]
- Ma, Y.; Yu, X.; Yu, G.; Li, X.; Zhang, J.; Chen, D.; Sun, R.; Tittel, F.K. Multi-Quartz-Enhanced Photoacoustic Spectroscopy. Appl. Phys. Lett. 2015, 107, 021106. [Google Scholar] [CrossRef]
- Koskinen, V.; Fonsen, J.; Kauppinen, J.; Kauppinen, I. Extremely Sensitive Trace Gas Analysis with Modern Photoacoustic Spectroscopy. Vib. Spectrosc. 2006, 42, 239–242. [Google Scholar] [CrossRef]
- Yi, H.; Maamary, R.; Gao, X.; Sigrist, M.W.; Fertein, E.; Chen, W. Short-Lived Species Detection of Nitrous Acid by External-Cavity Quantum Cascade Laser Based Quartz-Enhanced Photoacoustic Absorption Spectroscopy. Appl. Phys. Lett. 2015, 106, 101109. [Google Scholar] [CrossRef]
- Wu, H.; Dong, L.; Zheng, H.; Yu, Y.; Ma, W.; Zhang, L.; Yin, W.; Xiao, L.; Jia, S.; Tittel, F.K. Beat Frequency Quartz-Enhanced Photoacoustic Spectroscopy for Fast and Calibration-Free Continuous Trace-Gas Monitoring. Nat. Commun. 2017, 8, 15331. [Google Scholar] [CrossRef] [PubMed]
- Xiong, L.; Bai, W.; Chen, F.; Zhao, X.; Yu, F.; Diebold, G.J. Photoacoustic Trace Detection of Gases at the Parts-per-Quadrillion Level with a Moving Optical Grating. Proc. Natl. Acad. Sci. USA 2017, 114, 7246–7249. [Google Scholar] [CrossRef] [PubMed]
- Lenk, C.; Ekinci, A.; Rangelow, I.W.; Gutschmidt, S. Active, Artificial Hair Cells for Biomimetic Sound Detection Based on Active Cantilever Technology. In Proceedings of the 2018 40th Annual International Conference of the IEEE Engineering in Medicine and Biology Society (EMBC), Honolulu, HI, USA, 18–21 July 2018; pp. 4488–4491. [Google Scholar] [CrossRef]
- Rizzi, F.; Qualtieri, A.; Dattoma, T.; Epifani, G.; De Vittorio, M. Biomimetics of Underwater Hair Cell Sensing. Microelectron. Eng. 2015, 132, 90–97. [Google Scholar] [CrossRef]
- Tan, X.H.M.; Ngyuen, A.V.; Rowat, A.C.; Chiou, P.-Y. Large Area Precision Cell Traction Force Measurements Using Gold Disk Mounted Micro-Pillars. In Proceedings of the 2018 IEEE 12th International Conference on Nano/Molecular Medicine and Engineering (NANOMED), Waikiki Beach, HI, USA, 2–5 December 2018; pp. 100–103. [Google Scholar] [CrossRef]
- Zu, Y.; Huang, S.; Lu, Y.; Liu, X.; Wang, S. Size Specific Transfection to Mammalian Cells by Micropillar Array Electroporation. Sci. Rep. 2016, 6, 38661. [Google Scholar] [CrossRef] [PubMed]
- Shen, Z.; Kottapalli, A.G.P.; Subramaniam, V.; Asadnia, M.; Miao, J.; Triantafyllou, M. Biomimetic Flow Sensors for Biomedical Flow Sensing in Intravenous Tubes. In Proceedings of the 2016 IEEE SENSORS, Orlando, FL, USA, 30 October–3 November 2016; pp. 1–3. [Google Scholar] [CrossRef]
- Sakamiya, M.; Fang, Y.; Mo, X.; Shen, J.; Zhang, T. A Heart-on-a-Chip Platform for Online Monitoring of Contractile Behavior via Digital Image Processing and Piezoelectric Sensing Technique. Med. Eng. Phys. 2020, 75, 36–44. [Google Scholar] [CrossRef] [PubMed]
- Keerthana, K.; Shree Vidhya, S.; Janaki, M.; Kanimozhi, J. A Survey of Systems Used in the Monitoring and Control of Intravenous Infusion. Int. J. Eng. Technol. 2019, 11, 114–119. [Google Scholar] [CrossRef][Green Version]
- Sarles, S.A.; Madden, J.D.W.; Leo, D.J. Hair Cell Inspired Mechanotransduction with a Gel-Supported, Artificial Lipid Membrane. Soft Matter 2011, 7, 4644. [Google Scholar] [CrossRef]
- Davaria, S.; Tarazaga, P.A. MEMS Scale Artificial Hair Cell Sensors Inspired by the Cochlear Amplifier Effect. In Bioinspiration, Biomimetics, and Bioreplication 2017; SPIE: Portland, OR, USA, 2017; Volume 10162, p. 101620G. [Google Scholar] [CrossRef]
- Yang, Y.; Klein, A.; Bleckmann, H.; Liu, C. Artificial Lateral Line Canal for Hydrodynamic Detection. Appl. Phys. Lett. 2011, 99, 023701. [Google Scholar] [CrossRef]
- Zhang, C.; Chen, D.; Niu, S.; Zhang, J.; Meng, X.; Liu, L.; Sun, T.; Wen, S.; Zhou, Y.; Shi, Y.; et al. High-Aspect-Ratio Deflection Transducers Inspired by the Ultra-Sensitive Cantilever Configuration of Scorpion Trichobothria. J. Mater. Chem. C 2020, 8, 6093–6101. [Google Scholar] [CrossRef]
- Diamond, M.E.; von Heimendahl, M.; Knutsen, P.M.; Kleinfeld, D.; Ahissar, E. “Where” and “What” in the Whisker Sensorimotor System. Nat. Rev. Neurosci. 2008, 9, 601–612. [Google Scholar] [CrossRef] [PubMed]
- Zhang, W.; Guan, L.; Zhang, G.; Xue, C.; Zhang, K.; Wang, J. Research of DOA Estimation Based on Single MEMS Vector Hydrophone. Sensors 2009, 9, 6823–6834. [Google Scholar] [CrossRef] [PubMed]
- Bleckmann, H.; Zelick, R. Lateral Line System of Fish. Integr. Zool. 2009, 4, 13–25. [Google Scholar] [CrossRef] [PubMed]
- Faucher, K.; Parmentier, E.; Becco, C.; Vandewalle, N.; Vandewalle, P. Fish Lateral System Is Required for Accurate Control of Shoaling Behaviour. Anim. Behav. 2010, 79, 679–687. [Google Scholar] [CrossRef]
- Hirose, S.; Inoue, S.; Yoneda, K. The Whisker Sensor and the Transmission of Multiple Sensor Signals. Adv. Robot. 1989, 4, 105–117. [Google Scholar] [CrossRef]
- Valdivia y Alvarado, P.; Subramaniam, V.; Triantafyllou, M. Design of a Bio-Inspired Whisker Sensor for Underwater Applications. In Proceedings of the 2012 IEEE Sensors, Taipei, Taiwan, 28–31 October 2012; pp. 1–4. [Google Scholar] [CrossRef]
- Engel, J.M.; Chen, J.; Liu, C.; Bullen, D. Polyurethane Rubber All-Polymer Artificial Hair Cell Sensor. J. Microelectromech. Syst. 2006, 15, 729–736. [Google Scholar] [CrossRef]
- Chen, N.; Tucker, C.; Engel, J.M.; Yang, Y.; Pandya, S.; Liu, C. Design and Characterization of Artificial Haircell Sensor for Flow Sensing with Ultrahigh Velocity and Angular Sensitivity. J. Microelectromech. Syst. 2007, 16, 999–1014. [Google Scholar] [CrossRef]
- Asghari, F.; Samiei, M.; Adibkia, K.; Akbarzadeh, A.; Davaran, S. Biodegradable and Biocompatible Polymers for Tissue Engineering Application: A Review. Artif. Cells Nanomed. Biotechnol. 2017, 45, 185–192. [Google Scholar] [CrossRef]
- Sabir, M.I.; Xu, X.; Li, L. A Review on Biodegradable Polymeric Materials for Bone Tissue Engineering Applications. J. Mater. Sci. 2009, 44, 5713–5724. [Google Scholar] [CrossRef]
- Asadnia, M.; Kottapalli, A.G.P.; Miao, J.; Warkiani, M.E.; Triantafyllou, M.S. Artificial Fish Skin of Self-Powered Micro-Electromechanical Systems Hair Cells for Sensing Hydrodynamic Flow Phenomena. J. R. Soc. Interface 2015, 12, 20150322. [Google Scholar] [CrossRef] [PubMed]
- Takei, K.; Yu, Z.; Zheng, M.; Ota, H.; Takahashi, T.; Javey, A. Highly Sensitive Electronic Whiskers Based on Patterned Carbon Nanotube and Silver Nanoparticle Composite Films. Proc. Natl. Acad. Sci. USA 2014, 111, 1703–1707. [Google Scholar] [CrossRef] [PubMed]
- Moorthy, J.; Karunakaran, K.; Vidhya, S.; Kumar, S. An Automated Locking System to Prevent Backflow of Blood in an Intravenous Setup. Glob. J. Res. Eng. 2020, 20, 27–34. [Google Scholar]
- Polacheck, W.J.; Chen, C.S. Measuring Cell-Generated Forces: A Guide to the Available Tools. Nat. Methods 2016, 13, 415–423. [Google Scholar] [CrossRef]
- Kajzar, A.; Cesa, C.M.; Kirchgeßner, N.; Hoffmann, B.; Merkel, R. Toward Physiological Conditions for Cell Analyses: Forces of Heart Muscle Cells Suspended Between Elastic Micropillars. Biophys. J. 2008, 94, 1854–1866. [Google Scholar] [CrossRef]
- Zhang, F.; Anderson, S.; Zheng, X.; Roberts, E.; Qiu, Y.; Liao, R.; Zhang, X. Cell Force Mapping Using a Double-Sided Micropillar Array Based on the Moiré Fringe Method. Appl. Phys. Lett. 2014, 105, 033702. [Google Scholar] [CrossRef]
- Schoen, I.; Hu, W.; Klotzsch, E.; Vogel, V. Probing Cellular Traction Forces by Micropillar Arrays: Contribution of Substrate Warping to Pillar Deflection. Nano Lett. 2010, 10, 1823–1830. [Google Scholar] [CrossRef]
- Roca-Cusachs, P.; Conte, V.; Trepat, X. Quantifying Forces in Cell Biology. Nat. Cell Biol. 2017, 19, 742–751. [Google Scholar] [CrossRef]
- Smith, M.; Chalklen, T.; Lindackers, C.; Calahorra, Y.; Howe, C.; Tamboli, A.; Bax, D.V.; Barrett, D.J.; Cameron, R.E.; Best, S.M.; et al. Poly- l -Lactic Acid Nanotubes as Soft Piezoelectric Interfaces for Biology: Controlling Cell Attachment via Polymer Crystallinity. ACS Appl. Bio Mater. 2020, 3, 2140–2149. [Google Scholar] [CrossRef]
- Jandas, P.J.; Luo, J.; Quan, A.; Qiu, C.; Cao, W.; Fu, C.; Fu, Y.Q. Highly Selective and Label-Free Love-Mode Surface Acoustic Wave Biosensor for Carcinoembryonic Antigen Detection Using a Self-Assembled Monolayer Bioreceptor. Appl. Surf. Sci. 2020, 518, 146061. [Google Scholar] [CrossRef]
- Länge, K.; Rapp, B.E.; Rapp, M. Surface Acoustic Wave Biosensors: A Review. Anal. Bioanal. Chem. 2008, 391, 1509–1519. [Google Scholar] [CrossRef] [PubMed]
- Wiemann, M.; Walk, C.; Greifendorf, D.; Weidenmueller, J.; Jupe, A.; Seidl, K. Development of a Multi Channel Piezoelectric Flexural Plate Wave Biomems-Sensor for Rapid Point-of-Care Diagnostics. In Proceedings of the 2019 20th International Conference on Solid-State Sensors, Actuators and Microsystems & Eurosensors XXXIII (TRANSDUCERS & EUROSENSORS XXXIII), Berlin, Germany, 23–27 June 2019; pp. 1082–1085. [Google Scholar] [CrossRef]
- Skládal, P. Piezoelectric Biosensors. TrAC Trends Anal. Chem. 2016, 79, 127–133. [Google Scholar] [CrossRef]
- Gronewold, T.M.A. Surface Acoustic Wave Sensors in the Bioanalytical Field: Recent Trends and Challenges. Anal. Chim. Acta 2007, 603, 119–128. [Google Scholar] [CrossRef]
- Marrazza, G. Piezoelectric Biosensors for Organophosphate and Carbamate Pesticides: A Review. Biosensors 2014, 4, 301–317. [Google Scholar] [CrossRef]
- Lamanna, L.; Rizzi, F.; Bhethanabotla, V.R.; De Vittorio, M. Conformable Surface Acoustic Wave Biosensor for E-Coli Fabricated on PEN Plastic Film. Biosens. Bioelectron. 2020, 163, 112164. [Google Scholar] [CrossRef] [PubMed]
- Sauerbrey, G. Verwendung von Schwingquarzen Zur Wägung Dünner Schichten Und Zur Mikrowägung. Zeitschrift Für Physik 1959, 155, 206–222. [Google Scholar] [CrossRef]
- Janshoff, A.; Galla, H.-J.; Steinem, C. Piezoelectric Mass-Sensing Devices as Biosensors—An Alternative to Optical Biosensors? Angew. Chem. 2000, 39, 4004–4032. [Google Scholar] [CrossRef]
- Huang, X.-H.; Pan, W.; Hu, J.-G.; Bai, Q.-S. The Exploration and Confirmation of the Maximum Mass Sensitivity of Quartz Crystal Microbalance. IEEE Trans. Ultrason. Ferroelectr. Freq. Control 2018, 65, 1888–1892. [Google Scholar] [CrossRef]
- Nomura, T.; Okuhara, M. Frequency Shifts of Piezoelectric Quartz Crystals Immersed in Organic Liquids. Anal. Chim. Acta 1982, 142, 281–284. [Google Scholar] [CrossRef]
- Benetti, M.; Cannatà, D.; Di Pietrantonio, F.; Foglietti, V.; Verona, E. Microbalance Chemical Sensor Based on Thin-Film Bulk Acoustic Wave Resonators. Appl. Phys. Lett. 2005, 87, 173504. [Google Scholar] [CrossRef]
- Liu, B.; Chen, X.; Cai, H.; Mohammad Ali, M.; Tian, X.; Tao, L.; Yang, Y.; Ren, T. Surface Acoustic Wave Devices for Sensor Applications. J. Semicond. 2016, 37, 021001. [Google Scholar] [CrossRef]
- García-Martinez, G.; Bustabad, E.A.; Perrot, H.; Gabrielli, C.; Bucur, B.; Lazerges, M.; Rose, D.; Rodriguez-Pardo, L.; Fariña, J.; Compère, C.; et al. Development of a Mass Sensitive Quartz Crystal Microbalance (QCM)-Based DNA Biosensor Using a 50 MHz Electronic Oscillator Circuit. Sensors 2011, 11, 7656–7664. [Google Scholar] [CrossRef] [PubMed]
- Josse, F.; Shana, Z.A.; Radtke, D.E.; Haworth, D.T. Analysis of Piezoelectric Bulk-Acoustic-Wave Resonators as Detectors in Viscous Conductive Liquids. IEEE Trans. Ultrason. Ferroelectr. Freq. Control 1990, 37, 359–368. [Google Scholar] [CrossRef]
- Kim, N.; Kim, D.-K.; Cho, Y.-J. Development of Indirect-Competitive Quartz Crystal Microbalance Immunosensor for C-Reactive Protein. Sens. Actuators B Chem. 2009, 143, 444–448. [Google Scholar] [CrossRef]
- Eidi, A.; Badri Ghavifekr, H.; Shamsi, M. A Novel Biosensor Based on Micromechanical Resonator Array for Lab-On-a-Chip Applications. Sens. Imaging 2019, 20, 39. [Google Scholar] [CrossRef]
- Liu, F.; Li, F.; Nordin, A.; Voiculescu, I. A Novel Cell-Based Hybrid Acoustic Wave Biosensor with Impedimetric Sensing Capabilities. Sensors 2013, 13, 3039–3055. [Google Scholar] [CrossRef] [PubMed]
- Ji, J.; Pang, Y.; Li, D.; Huang, Z.; Zhang, Z.; Xue, N.; Xu, Y.; Mu, X. An Aptamer-Based Shear Horizontal Surface Acoustic Wave Biosensor with a CVD-Grown Single-Layered Graphene Film for High-Sensitivity Detection of a Label-Free Endotoxin. Microsyst. Nanoeng. 2020, 6, 4. [Google Scholar] [CrossRef]
- Lamanna, L.; Rizzi, F.; Guido, F.; Algieri, L.; Marras, S.; Mastronardi, V.M.; Qualtieri, A.; De Vittorio, M. Flexible and Transparent Aluminum-Nitride-Based Surface-Acoustic-Wave Device on Polymeric Polyethylene Naphthalate. Adv. Electron. Mater. 2019, 5, 1900095. [Google Scholar] [CrossRef]
- Liu, F.; Nordin, A.N.; Li, F.; Voiculescu, I. A Lab-on-Chip Cell-Based Biosensor for Label-Free Sensing of Water Toxicants. Lab Chip 2014, 14, 1270–1280. [Google Scholar] [CrossRef]
- Ng, K.; Ryba, T. The Quantified Athlete: Associations of Wearables for High School Athletes. Adv. Hum. Comput. Interact. 2018, 2018, 6317524. [Google Scholar] [CrossRef]
- Daiber, F.; Kosmalla, F. Tutorial on Wearable Computing in Sports. In Proceedings of the 19th International Conference on Human-Computer Interaction with Mobile Devices and Services, Vienna, Austria, 1–4 September 2017; pp. 1–4. [Google Scholar] [CrossRef]
- Allataifeh, A.; Al Ahmad, M. Simultaneous Piezoelectric Noninvasive Detection of Multiple Vital Signs. Sci. Rep. 2020, 10, 416. [Google Scholar] [CrossRef]
- Sharma, P.; Imtiaz, S.A.; Rodriguez-Villegas, E. Acoustic Sensing as a Novel Wearable Approach for Cardiac Monitoring at the Wrist. Sci. Rep. 2019, 9, 20079. [Google Scholar] [CrossRef]
- Kaisti, M.; Panula, T.; Leppänen, J.; Punkkinen, R.; Jafari Tadi, M.; Vasankari, T.; Jaakkola, S.; Kiviniemi, T.; Airaksinen, J.; Kostiainen, P.; et al. Clinical Assessment of a Non-Invasive Wearable MEMS Pressure Sensor Array for Monitoring of Arterial Pulse Waveform, Heart Rate and Detection of Atrial Fibrillation. NPJ Digit. Med. 2019, 2, 39. [Google Scholar] [CrossRef] [PubMed]
- Stahl, S.E.; An, H.-S.; Dinkel, D.M.; Noble, J.M.; Lee, J.-M. How Accurate Are the Wrist-Based Heart Rate Monitors during Walking and Running Activities? Are They Accurate Enough? BMJ Open Sport Exerc. Med. 2016, 2, e000106. [Google Scholar] [CrossRef] [PubMed]
- Ou, C.; Jing, Q.; Busolo, T.; Kar-Narayan, S. Manufacturing Routes toward Flexible and Smart Energy Harvesters and Sensors Based on Functional Nanomaterials. In Advances in Nanostructured Materials and Nanopatterning Technologies; Elsevier: Amsterdam, The Netherlands, 2020; pp. 381–437. [Google Scholar] [CrossRef]
- Choi, Y.S.; Kim, S.K.; Smith, M.; Williams, F.; Vickers, M.E.; Elliott, J.A.; Kar-Narayan, S. Unprecedented Dipole Alignment in α-Phase Nylon-11 Nanowires for High-Performance Energy-Harvesting Applications. Sci. Adv. 2020, 6, eaay5065. [Google Scholar] [CrossRef] [PubMed]
- Bhamla, M.S.; Benson, B.; Chai, C.; Katsikis, G.; Johri, A.; Prakash, M. Hand-Powered Ultralow-Cost Paper Centrifuge. Nat. Biomed. Eng. 2017, 1, 0009. [Google Scholar] [CrossRef]
- Agarwal, R.; Sarkar, A.; Bhowmik, A.; Mukherjee, D.; Chakraborty, S. A Portable Spinning Disc for Complete Blood Count (CBC). Biosens. Bioelectron. 2020, 150, 111935. [Google Scholar] [CrossRef]
- Mukundarajan, H.; Hol, F.J.H.; Castillo, E.A.; Newby, C.; Prakash, M. Using Mobile Phones as Acoustic Sensors for High-Throughput Mosquito Surveillance. Elife 2017, 6, e27854. [Google Scholar] [CrossRef]
- Xu, Y.; Xie, X.; Duan, Y.; Wang, L.; Cheng, Z.; Cheng, J. A Review of Impedance Measurements of Whole Cells. Biosens. Bioelectron. 2016, 77, 824–836. [Google Scholar] [CrossRef]
- Nahid, M.A.; Campbell, C.E.; Fong, K.S.K.; Barnhill, J.C.; Washington, M.A. An Evaluation of the Impact of Clinical Bacterial Isolates on Epithelial Cell Monolayer Integrity by the Electric Cell-Substrate Impedance Sensing (ECIS) Method. J. Microbiol. Methods 2020, 169, 105833. [Google Scholar] [CrossRef]
- Szulcek, R.; Bogaard, H.J.; van Nieuw Amerongen, G.P. Electric Cell-Substrate Impedance Sensing for the Quantification of Endothelial Proliferation, Barrier Function, and Motility. J. Vis. Exp. 2014, 85, e51300. [Google Scholar] [CrossRef] [PubMed]
- Chen, Y.; Wong, C.C.; Pui, T.S.; Nadipalli, R.; Weerasekera, R.; Chandran, J.; Yu, H.; Rahman, A.R.A. CMOS High Density Electrical Impedance Biosensor Array for Tumor Cell Detection. Sens. Actuators B Chem. 2012, 173, 903–907. [Google Scholar] [CrossRef]
- Khoshfetrat Pakazad, S.; Savov, A.; van de Stolpe, A.; Dekker, R. A Novel Stretchable Micro-Electrode Array (SMEA) Design for Directional Stretching of Cells. J. Micromech. Microeng. 2014, 24, 034003. [Google Scholar] [CrossRef]
- Castillo-Fernandez, O.; Rodriguez-Trujillo, R.; Gomila, G.; Samitier, J. High-Speed Counting and Sizing of Cells in an Impedance Flow Microcytometer with Compact Electronic Instrumentation. Microfluid. Nanofluid. 2014, 16, 91–99. [Google Scholar] [CrossRef]
- Shih, S.C.C.; Barbulovic-Nad, I.; Yang, X.; Fobel, R.; Wheeler, A.R. Digital Microfluidics with Impedance Sensing for Integrated Cell Culture and Analysis. Biosens. Bioelectron. 2013, 42, 314–320. [Google Scholar] [CrossRef]
- Höber, R. Eine Methode, Die Elektrische Leitfähigkeit Im Innern von Zellen Zu Messen. Pflüger’s Archiv Für Die Gesamte Physiologie Des Menschen Und Der Tiere 1910, 133, 237–253. [Google Scholar] [CrossRef]
- Bernstein, J. Elektrobiologie; F. Vieweg: Braunschweig, Germany, 1912. [Google Scholar] [CrossRef]
- Schwan, H.P. The Practical Success of Impedance Techniques from an Historical Perspective. Ann. N. Y. Acad. Sci. 1999, 873, 1–12. [Google Scholar] [CrossRef]
- Cole, K.S. Membranes, Ions and Impulses: A Chapter of Classical Biophysics; University of California Press: Berkeley, CA, USA, 1968. [Google Scholar]
- Carlson-Newberry, S.J.; Costello, R.B. Emerging Technologies for Nutrition Research; National Academies Press: Washington, DC, USA, 1997. [Google Scholar] [CrossRef]
- Lukaski, H.C. Evolution of Bioimpedance: A Circuitous Journey from Estimation of Physiological Function to Assessment of Body Composition and a Return to Clinical Research. Eur. J. Clin. Nutr. 2013, 67, S2–S9. [Google Scholar] [CrossRef]
- Li, Y.-C.; Li, C.-I.; Lin, W.-Y.; Liu, C.-S.; Hsu, H.-S.; Lee, C.-C.; Chen, F.-N.; Li, T.-C.; Lin, C.-C. Percentage of Body Fat Assessment Using Bioelectrical Impedance Analysis and Dual-Energy X-Ray Absorptiometry in a Weight Loss Program for Obese or Overweight Chinese Adults. PLoS ONE 2013, 8, e58272. [Google Scholar] [CrossRef]
- Hong, J.; Kandasamy, K.; Marimuthu, M.; Choi, C.S.; Kim, S. Electrical Cell-Substrate Impedance Sensing as a Non-Invasive Tool for Cancer Cell Study. Analyst 2011, 136, 237–245. [Google Scholar] [CrossRef]
- Giaever, I.; Keese, C.R. Monitoring Fibroblast Behavior in Tissue Culture with an Applied Electric Field. Proc. Natl. Acad. Sci. USA 1984, 81, 3761–3764. [Google Scholar] [CrossRef]
- Giaever, I.; Keese, C.R. Micromotion of Mammalian Cells Measured Electrically. Proc. Natl. Acad. Sci. USA 1991, 88, 7896–7900. [Google Scholar] [CrossRef]
- Giaever, I.; Keese, C.R. A Morphological Biosensor for Mammalian Cells. Nature 1993, 366, 591–592. [Google Scholar] [CrossRef]
- Wegener, J.; Keese, C.R.; Giaever, I. Electric Cell–Substrate Impedance Sensing (ECIS) as a Noninvasive Means to Monitor the Kinetics of Cell Spreading to Artificial Surfaces. Exp. Cell Res. 2000, 259, 158–166. [Google Scholar] [CrossRef]
- Saini, M. Implant Biomaterials: A Comprehensive Review. World J. Clin. Cases 2015, 3, 52. [Google Scholar] [CrossRef] [PubMed]
- Li, L.; Mo, C.-K.; Chilkoti, A.; Lopez, G.P.; Carroll, N.J. Creating Cellular Patterns Using Genetically Engineered, Gold- and Cell-Binding Polypeptides. Biointerphases 2016, 11, 021009. [Google Scholar] [CrossRef] [PubMed]
- Turner, N.; Armitage, M.; Butler, R.; Ireland, G. An in Vitro Model to Evaluate Cell Adhesion to Metals Used in Implantation Shows Significant Differences between Palladium and Gold or Platinum. Cell Biol. Int. 2004, 28, 541–547. [Google Scholar] [CrossRef] [PubMed]
- Yoon, S.H.; Mofrad, M.R.K. Cell Adhesion and Detachment on Gold Surfaces Modified with a Thiol-Functionalized RGD Peptide. Biomaterials 2011, 32, 7286–7296. [Google Scholar] [CrossRef] [PubMed]
- Gaio, N.; van Meer, B.; Quirós Solano, W.; Bergers, L.; van de Stolpe, A.; Mummery, C.; Sarro, P.; Dekker, R. Cytostretch, an Organ-on-Chip Platform. Micromachines 2016, 7, 120. [Google Scholar] [CrossRef] [PubMed]
- Bernardeschi, I.; Greco, F.; Ciofani, G.; Marino, A.; Mattoli, V.; Mazzolai, B.; Beccai, L. A Soft, Stretchable and Conductive Biointerface for Cell Mechanobiology. Biomed. Microdevices 2015, 17, 46. [Google Scholar] [CrossRef]
- Kunduru, V.; Bothara, M.; Grosch, J.; Sengupta, S.; Patra, P.K.; Prasad, S. Nanostructured Surfaces for Enhanced Protein Detection toward Clinical Diagnostics. Nanomed. Nanotechnol. Biol. Med. 2010, 6, 642–650. [Google Scholar] [CrossRef] [PubMed]
- Lee, J.; Ishihara, A.; Oxford, G.; Johnson, B.; Jacobson, K. Regulation of Cell Movement Is Mediated by Stretch-Activated Calcium Channels. Nature 1999, 400, 382–386. [Google Scholar] [CrossRef] [PubMed]
- Özkucur, N.; Monsees, T.K.; Perike, S.; Do, H.Q.; Funk, R.H.W. Local Calcium Elevation and Cell Elongation Initiate Guided Motility in Electrically Stimulated Osteoblast-Like Cells. PLoS ONE 2009, 4, e6131. [Google Scholar] [CrossRef] [PubMed]
- Wang, L.; Wang, L.; Yin, H.; Xing, W.; Yu, Z.; Guo, M.; Cheng, J. Real-Time, Label-Free Monitoring of the Cell Cycle with a Cellular Impedance Sensing Chip. Biosens. Bioelectron. 2010, 25, 990–995. [Google Scholar] [CrossRef]
- Wang, L.; Zhu, J.; Deng, C.; Xing, W.; Cheng, J. An Automatic and Quantitative On-Chip Cell Migration Assay Using Self-Assembled Monolayers Combined with Real-Time Cellular Impedance Sensing. Lab Chip 2008, 8, 872. [Google Scholar] [CrossRef]
- Chen, N.-C.; Chen, C.-H.; Chen, M.-K.; Jang, L.-S.; Wang, M.-H. Single-Cell Trapping and Impedance Measurement Utilizing Dielectrophoresis in a Parallel-Plate Microfluidic Device. Sens. Actuators B Chem. 2014, 190, 570–577. [Google Scholar] [CrossRef]
- Bhatt, G.; Mishra, K.; Ramanathan, G.; Bhattacharya, S. Dielectrophoresis Assisted Impedance Spectroscopy for Detection of Gold-Conjugated Amplified DNA Samples. Sens. Actuators B Chem. 2019, 288, 442–453. [Google Scholar] [CrossRef]
- Abdelgawad, M.; Wheeler, A.R. The Digital Revolution: A New Paradigm for Microfluidics. Adv. Mater. 2009, 21, 920–925. [Google Scholar] [CrossRef]
- Liu, Y.; Ren, D.; Ling, X.; Liang, W.; Li, J.; You, Z.; Yalikun, Y.; Tanaka, Y. Time Sequential Single-Cell Patterning with High Efficiency and High Density. Sensors 2018, 18, 3672. [Google Scholar] [CrossRef]
- Han, A.; Yang, L.; Frazier, A.B. Quantification of the Heterogeneity in Breast Cancer Cell Lines Using Whole-Cell Impedance Spectroscopy. Clin. Cancer Res. 2007, 13, 139–143. [Google Scholar] [CrossRef]
- Jalalian, A.; Mashohor, S.B.T.; Mahmud, H.R.; Saripan, M.I.B.; Ramli, A.R.B.; Karasfi, B. Computer-Aided Detection/Diagnosis of Breast Cancer in Mammography and Ultrasound: A Review. Clin. Imaging 2013, 37, 420–426. [Google Scholar] [CrossRef] [PubMed]
- Claudel, J.; Alves De Araujo, A.L.; Nadi, M.; Kourtiche, D. Lab-On-A-Chip Device for Yeast Cell Characterization in Low-Conductivity Media Combining Cytometry and Bio-Impedance. Sensors 2019, 19, 3366. [Google Scholar] [CrossRef] [PubMed]
- Gawad, S.; Schild, L.; Renaud, P. Micromachined Impedance Spectroscopy Flow Cytometer for Cell Analysis and Particle Sizing. Lab Chip 2001, 1, 76–82. [Google Scholar] [CrossRef] [PubMed]
- Wong, C.C.; Drews, C.; Chen, Y.; Pui, T.S.; Arya, S.K.; Weerasekera, R.; Rahman, A.R.A. CMOS Based High Density Micro Array Platform for Electrochemical Detection and Enumeration of Cells. In Proceedings of the 2013 IEEE International Electron Devices Meeting, Washington, DC, USA, 9–11 December 2013; pp. 14.2.1–14.2.4. [Google Scholar] [CrossRef]
- Amin, H.; Maccione, A.; Marinaro, F.; Zordan, S.; Nieus, T.; Berdondini, L. Electrical Responses and Spontaneous Activity of Human IPS-Derived Neuronal Networks Characterized for 3-Month Culture with 4096-Electrode Arrays. Front. Neurosci. 2016, 10, 121. [Google Scholar] [CrossRef] [PubMed]
- Kanade, P.P.; Oyunbaatar, N.-E.; Lee, D.-W. Polymer-Based Functional Cantilevers Integrated with Interdigitated Electrode Arrays—A Novel Platform for Cardiac Sensing. Micromachines 2020, 11, 450. [Google Scholar] [CrossRef]
- Ćatić, N.; Wells, L.; Al Nahas, K.; Smith, M.; Jing, Q.; Keyser, U.F.; Cama, J.; Kar-Narayan, S. Aerosol-Jet Printing Facilitates the Rapid Prototyping of Microfluidic Devices with Versatile Geometries and Precise Channel Functionalization. Appl. Mater. Today 2020, 19, 100618. [Google Scholar] [CrossRef]
- Wu, J.; Wang, R.; Yu, H.; Li, G.; Xu, K.; Tien, N.C.; Roberts, R.C.; Li, D. Inkjet-Printed Microelectrodes on PDMS as Biosensors for Functionalized Microfluidic Systems. Lab Chip 2015, 15, 690–695. [Google Scholar] [CrossRef]
- Dixon, C.; Ng, A.H.C.; Fobel, R.; Miltenburg, M.B.; Wheeler, A.R. An Inkjet Printed, Roll-Coated Digital Microfluidic Device for Inexpensive, Miniaturized Diagnostic Assays. Lab Chip 2016, 16, 4560–4568. [Google Scholar] [CrossRef]
- Esfandyarpour, R.; DiDonato, M.J.; Yang, Y.; Durmus, N.G.; Harris, J.S.; Davis, R.W. Multifunctional, Inexpensive, and Reusable Nanoparticle-Printed Biochip for Cell Manipulation and Diagnosis. Proc. Natl. Acad. Sci. USA 2017, 114, E1306–E1315. [Google Scholar] [CrossRef]
- Qian, C.; Huang, H.; Chen, L.; Li, X.; Ge, Z.; Chen, T.; Yang, Z.; Sun, L. Dielectrophoresis for Bioparticle Manipulation. Int. J. Mol. Sci. 2014, 15, 18281–18309. [Google Scholar] [CrossRef]
- Doh, I.; Cho, Y.-H. A Continuous Cell Separation Chip Using Hydrodynamic Dielectrophoresis (DEP) Process. Sens. Actuators A Phys. 2005, 121, 59–65. [Google Scholar] [CrossRef]
- Li, M.; Anand, R.K. Cellular Dielectrophoresis Coupled with Single-Cell Analysis. Anal. Bioanal. Chem. 2018, 410, 2499–2515. [Google Scholar] [CrossRef] [PubMed]
- Zhao, K.; Larasati; Duncker, B.P.; Li, D. Continuous Cell Characterization and Separation by Microfluidic Alternating Current Dielectrophoresis. Anal. Chem. 2019, 91, 6304–6314. [Google Scholar] [CrossRef] [PubMed]
- Asami, K.; Sekine, K. Dielectric Modelling of Cell Division for Budding and Fission Yeast. J. Phys. D Appl. Phys. 2007, 40, 1128–1133. [Google Scholar] [CrossRef]
- Nerguizian, V.; Stiharu, I.; Al-Azzam, N.; Yassine-Diab, B.; Alazzam, A. The Effect of Dielectrophoresis on Living Cells: Crossover Frequencies and Deregulation in Gene Expression. Analyst 2019, 144, 3853–3860. [Google Scholar] [CrossRef]
- Bolognesi, C.; Forcato, C.; Buson, G.; Fontana, F.; Mangano, C.; Doffini, A.; Sero, V.; Lanzellotto, R.; Signorini, G.; Calanca, A.; et al. Digital Sorting of Pure Cell Populations Enables Unambiguous Genetic Analysis of Heterogeneous Formalin-Fixed Paraffin-Embedded Tumors by Next Generation Sequencing. Sci. Rep. 2016, 6, 20944. [Google Scholar] [CrossRef]
- Wang, Q.; Jones, A.-A.D.; Gralnick, J.A.; Lin, L.; Buie, C.R. Microfluidic Dielectrophoresis Illuminates the Relationship between Microbial Cell Envelope Polarizability and Electrochemical Activity. Sci. Adv. 2019, 5, eaat5664. [Google Scholar] [CrossRef]
- Pohl, H.A.; Hawk, I. Separation of Living and Dead Cells by Dielectrophoresis. Science 1966, 152, 647–649. [Google Scholar] [CrossRef] [PubMed]
- Nikolic-Jaric, M.; Romanuik, S.F.; Ferrier, G.A.; Cabel, T.; Salimi, E.; Levin, D.B.; Bridges, G.E.; Thomson, D.J. Electronic Detection of Dielectrophoretic Forces Exerted on Particles Flowing over Interdigitated Electrodes. Biomicrofluidics 2012, 6, 024117. [Google Scholar] [CrossRef]
- Pamme, N. Continuous Flow Separations in Microfluidic Devices. Lab Chip 2007, 7, 1644. [Google Scholar] [CrossRef]
- Pohl, H.A. The Motion and Precipitation of Suspensoids in Divergent Electric Fields. J. Appl. Phys. 1951, 22, 869–871. [Google Scholar] [CrossRef]
- Pohl, H.A. Some Effects of Nonuniform Fields on Dielectrics. J. Appl. Phys. 1958, 29, 1182–1188. [Google Scholar] [CrossRef]
- Hughes, M.P. Fifty Years of Dielectrophoretic Cell Separation Technology. Biomicrofluidics 2016, 10, 032801. [Google Scholar] [CrossRef] [PubMed]
- Snyder, W.; Han, Y.-S.; Bilbro, G.; Whitaker, R.; Pizer, S. Image Relaxation: Restoration and Feature Extraction. IEEE Trans. Pattern Anal. Mach. Intell. 1995, 17, 620–624. [Google Scholar] [CrossRef]
- Huang, Y.; Wang, X.B.; Tame, J.A.; Pethig, R. Electrokinetic Behaviour of Colloidal Particles in Travelling Electric Fields: Studies Using Yeast Cells. J. Phys. D Appl. Phys. 1993, 26, 1528–1535. [Google Scholar] [CrossRef]
- Lapizco-Encinas, B.H. On the Recent Developments of Insulator-Based Dielectrophoresis: A Review. Electrophoresis 2019, 40, 358–375. [Google Scholar] [CrossRef]
- Pethig, R. Review—Where Is Dielectrophoresis (DEP) Going? J. Electrochem. Soc. 2017, 164, B3049–B3055. [Google Scholar] [CrossRef]
- Hölzel, R.; Calander, N.; Chiragwandi, Z.; Willander, M.; Bier, F.F. Trapping Single Molecules by Dielectrophoresis. Phys. Rev. Lett. 2005, 95, 128102. [Google Scholar] [CrossRef]
- Washizu, M.; Kurosawa, O. Electrostatic Manipulation of DNA in Microfabricated Structures. IEEE Trans. Ind. Appl. 1990, 26, 1165–1172. [Google Scholar] [CrossRef]
- Biosystems, M.S. DEPArray Technology. Available online: http://www.siliconbiosystems.com/deparray-technology (accessed on 21 July 2020).
- Srivastava, S.K.; Gencoglu, A.; Minerick, A.R. DC Insulator Dielectrophoretic Applications in Microdevice Technology: A Review. Anal. Bioanal. Chem. 2011, 399, 301–321. [Google Scholar] [CrossRef]
- Pethig, R. Dielectrophoresis; John Wiley & Sons, Ltd.: Chichester, UK, 2017; Volume 48. [Google Scholar] [CrossRef]
- Rashed, M.Z.; Green, N.G.; Williams, S.J. Scaling Law Analysis of Electrohydrodynamics and Dielectrophoresis for Isomotive Dielectrophoresis Microfluidic Devices. Electrophoresis 2020, 41, 148–155. [Google Scholar] [CrossRef] [PubMed]
- Zhao, T.; Comber, M.G. Calculation of Electric Field and Potential Distribution along Nonceramic Insulators Considering the Effects of Conductors and Transmission Towers. IEEE Trans. Power Deliv. 2000, 15, 313–318. [Google Scholar] [CrossRef]
- Nie, X.; Liang, Z.; Lu, Y.; Cai, Y.; Zhang, C.; Yu, D.; Xing, X. Bidirectional Cell Sliding on Active Tracks for High Throughput Dielectrophoretic Cell Sorting in Continuous-Flow. In Proceedings of the 2020 IEEE 33rd International Conference on Micro Electro Mechanical Systems (MEMS), Vancouver, BC, Canada, 18–22 January 2020; pp. 1018–1021. [Google Scholar] [CrossRef]
- Modarres, P.; Tabrizian, M. Frequency Hopping Dielectrophoresis as a New Approach for Microscale Particle and Cell Enrichment. Sens. Actuators B Chem. 2019, 286, 493–500. [Google Scholar] [CrossRef]
- Presnova, G.; Presnov, D.; Krupenin, V.; Grigorenko, V.; Trifonov, A.; Andreeva, I.; Ignatenko, O.; Egorov, A.; Rubtsova, M. Biosensor Based on a Silicon Nanowire Field-Effect Transistor Functionalized by Gold Nanoparticles for the Highly Sensitive Determination of Prostate Specific Antigen. Biosens. Bioelectron. 2017, 88, 283–289. [Google Scholar] [CrossRef]
- Zhang, G.J.; Zhang, L.; Huang, M.J.; Luo, Z.H.H.; Tay, G.K.I.; Lim, E.J.A.; Kang, T.G.; Chen, Y. Silicon Nanowire Biosensor for Highly Sensitive and Rapid Detection of Dengue Virus. Sens. Actuators B Chem. 2010, 146, 138–144. [Google Scholar] [CrossRef]
- Makowski, M.S.; Ivanisevic, A. Molecular Analysis of Blood with Micro-/Nanoscale Field-Effect-Transistor Biosensors. Small 2011, 7, 1863–1875. [Google Scholar] [CrossRef]
- Estrela, P.; Stewart, A.G.; Yan, F.; Migliorato, P. Field Effect Detection of Biomolecular Interactions. Electrochim. Acta 2005, 50, 4995–5000. [Google Scholar] [CrossRef]
- Lee, W.; Kobayashi, S.; Nagase, M.; Jimbo, Y.; Saito, I.; Inoue, Y.; Yambe, T.; Sekino, M.; Malliaras, G.G.; Yokota, T.; et al. Nonthrombogenic, Stretchable, Active Multielectrode Array for Electroanatomical Mapping. Sci. Adv. 2018, 4, eaau2426. [Google Scholar] [CrossRef]
- Sang, S.; Wang, Y.; Feng, Q.; Wei, Y.; Ji, J.; Zhang, W. Progress of New Label-Free Techniques for Biosensors: A Review. Crit. Rev. Biotechnol. 2015, 36, 465–481. [Google Scholar] [CrossRef]
- Bergveld, P. Development, Operation, and Application of the Ion-Sensitive Field-Effect Transistor as a Tool for Electrophysiology. IEEE Trans. Biomed. Eng. 1972, BME-19, 342–351. [Google Scholar] [CrossRef]
- Bergveld, P. Thirty Years of ISFETOLOGY. Sens. Actuators B Chem. 2003, 88, 1–20. [Google Scholar] [CrossRef]
- Kaisti, M. Detection Principles of Biological and Chemical FET Sensors. Biosens. Bioelectron. 2017, 98, 437–448. [Google Scholar] [CrossRef] [PubMed]
- Matsuo, T.; Wise, K.D. An Integrated Field-Effect Electrode for Biopotential Recording. IEEE Trans. Biomed. Eng. 1974, BME-21, 485–487. [Google Scholar] [CrossRef]
- Lundström, I.; Shivaraman, S.; Svensson, C.; Lundkvist, L. A Hydrogen−sensitive MOS Field−effect Transistor. Appl. Phys. Lett. 1975, 26, 55–57. [Google Scholar] [CrossRef]
- Schepel, S.J.; de Rooij, N.F.; Koning, G.; Oeseburg, B.; Zijlstra, W.G. In Vivo Experiments with a PH-ISFET Electrode. Med. Biol. Eng. Comput. 1984, 22, 6–11. [Google Scholar] [CrossRef]
- Vlasov, Y.G.; Bratov, A.V. Analytical Applications of PH-ISFETs. Sens. Actuators B Chem. 1992, 10, 1–6. [Google Scholar] [CrossRef]
- Salardenne, J.; Morcos, J.; Aït Allal, M.; Portier, J. New ISFET Sensitive Membranes. Sens. Actuators B Chem. 1990, 1, 385–389. [Google Scholar] [CrossRef]
- Janata, J. Historical Review: Twenty Years of Ion-Selective Field-Effect Transistors. Analyst 1994, 119, 2275–2278. [Google Scholar] [CrossRef]
- Bezegh, K.; Bezegh, A.; Janata, J.; Oesch, U.; Xu, A.; Simon, W. Multisensing Ion-Selective Field Effect Transistors Prepared by Ionophore Doping Technique. Anal. Chem. 1987, 59, 2846–2848. [Google Scholar] [CrossRef]
- van der Schoot, B.H.; Bergveld, P. ISFET Based Enzyme Sensors. Biosensors 1987, 3, 161–186. [Google Scholar] [CrossRef]
- Caras, S.; Janata, J. Field Effect Transistor Sensitive to Penicillin. Anal. Chem. 1980, 52, 1935–1937. [Google Scholar] [CrossRef]
- VOLOTOVSKY, V.; KIM, N. Cyanide Determination by an ISFET-Based Peroxidase Biosensor. Biosens. Bioelectron. 1998, 13, 1029–1033. [Google Scholar] [CrossRef]
- Zayats, M.; Kharitonov, A.B.; Katz, E.; Bückmann, A.F.; Willner, I. An Integrated NAD+-Dependent Enzyme-Functionalized Field-Effect Transistor (ENFET) System: Development of a Lactate Biosensor. Biosens. Bioelectron. 2000, 15, 671–680. [Google Scholar] [CrossRef]
- Migita, S.; Ozasa, K.; Tanaka, T.; Haruyama, T. Enzyme-Based Field-Effect Transistor for Adenosine Triphosphate (ATP) Sensing. Anal. Sci. 2007, 23, 45–48. [Google Scholar] [CrossRef]
- Kim, K.H.; Lee, S.H.; Seo, S.E.; Bae, J.; Park, S.J.; Kwon, O.S. Ultrasensitive Stress Biomarker Detection Using Polypyrrole Nanotube Coupled to a Field-Effect Transistor. Micromachines 2020, 11, 439. [Google Scholar] [CrossRef]
- Shen, M.-Y.; Li, B.-R.; Li, Y.-K. Silicon Nanowire Field-Effect-Transistor Based Biosensors: From Sensitive to Ultra-Sensitive. Biosens. Bioelectron. 2014, 60, 101–111. [Google Scholar] [CrossRef]
- Chen, K.-I.; Li, B.-R.; Chen, Y.-T. Silicon Nanowire Field-Effect Transistor-Based Biosensors for Biomedical Diagnosis and Cellular Recording Investigation. Nano Today 2011, 6, 131–154. [Google Scholar] [CrossRef]
- Zhang, G.-J.; Chua, J.H.; Chee, R.-E.; Agarwal, A.; Wong, S.M. Label-Free Direct Detection of MiRNAs with Silicon Nanowire Biosensors. Biosens. Bioelectron. 2009, 24, 2504–2508. [Google Scholar] [CrossRef]
- Becker, B.; Cooper, M.A. A Survey of the 2006-2009 Quartz Crystal Microbalance Biosensor Literature. J. Mol. Recognit. 2011, 24, 754–787. [Google Scholar] [CrossRef]
- Van Neste, C.W.; Senesac, L.R.; Thundat, T. Standoff Photoacoustic Spectroscopy. Appl. Phys. Lett. 2008, 92, 234102. [Google Scholar] [CrossRef]
- Alodhayb, A.; Rahman, S.M.S.; Rahman, S.; Georghiou, P.E.; Beaulieu, L.Y. A 16-Microcantilever Array Sensing System for the Rapid and Simultaneous Detection of Analyte. Sens. Actuators B Chem. 2016, 237, 459–469. [Google Scholar] [CrossRef]
- Giaever, I.; Keese, C.R. Electric Cell-Substrate Impedance Sensing Concept to Commercialization. In Electric Cell-Substrate Impedance Sensing and Cancer Metastasis; Springer: Dordrecht, The Netherlands, 2012; pp. 1–19. [Google Scholar] [CrossRef]
- Gong, J.-R. Label-Free Attomolar Detection of Proteins Using Integrated Nanoelectronic and Electrokinetic Devices. Small 2010, 6, 967–973. [Google Scholar] [CrossRef] [PubMed]
- Ghassemi, S.; Meacci, G.; Liu, S.; Gondarenko, A.A.; Mathur, A.; Roca-Cusachs, P.; Sheetz, M.P.; Hone, J. Cells Test Substrate Rigidity by Local Contractions on Submicrometer Pillars. Proc. Natl. Acad. Sci. USA 2012, 109, 5328–5333. [Google Scholar] [CrossRef] [PubMed]
- Zhang, X.; Chen, J.; Liu, H.; Zhang, S. Quartz Crystal Microbalance Detection of Protein Amplified by Nicked Circling, Rolling Circle Amplification and Biocatalytic Precipitation. Biosens. Bioelectron. 2015, 65, 341–345. [Google Scholar] [CrossRef] [PubMed]
- Zou, L.; Wang, Q.; Tong, M.; Li, H.; Wang, J.; Hu, N.; Wang, P. Detection of Diarrhetic Shellfish Poisoning Toxins Using High-Sensitivity Human Cancer Cell-Based Impedance Biosensor. Sens. Actuators B Chem. 2016, 222, 205–212. [Google Scholar] [CrossRef]
- dos Santos, M.B.; Agusil, J.P.; Prieto-Simón, B.; Sporer, C.; Teixeira, V.; Samitier, J. Highly Sensitive Detection of Pathogen Escherichia Coli O157:H7 by Electrochemical Impedance Spectroscopy. Biosens. Bioelectron. 2013, 45, 174–180. [Google Scholar] [CrossRef]
- Sharma, A.; Han, C.-H.; Jang, J. Rapid Electrical Immunoassay of the Cardiac Biomarker Troponin I through Dielectrophoretic Concentration Using Imbedded Electrodes. Biosens. Bioelectron. 2016, 82, 78–84. [Google Scholar] [CrossRef]
- Menachery, A.; Kremer, C.; Wong, P.E.; Carlsson, A.; Neale, S.L.; Barrett, M.P.; Cooper, J.M. Counterflow Dielectrophoresis for Trypanosome Enrichment and Detection in Blood. Sci. Rep. 2012, 2, 775. [Google Scholar] [CrossRef]
- Kurkina, T.; Vlandas, A.; Ahmad, A.; Kern, K.; Balasubramanian, K. Label-Free Detection of Few Copies of DNA with Carbon Nanotube Impedance Biosensors. Angew. Chem. Int. Ed. 2011, 50, 3710–3714. [Google Scholar] [CrossRef]
- Jose, J.; Park, M.; Pyun, J.-C.E. Coli Outer Membrane with Autodisplayed Z-Domain as a Molecular Recognition Layer of SPR Biosensor. Biosens. Bioelectron. 2010, 25, 1225–1228. [Google Scholar] [CrossRef]
- Kwon, Y.-C.; Kim, M.-G.; Kim, E.-M.; Shin, Y.-B.; Lee, S.-K.; Lee, S.D.; Cho, M.-J.; Ro, H.-S. Development of a Surface Plasmon Resonance-Based Immunosensor for the Rapid Detection of Cardiac Troponin I. Biotechnol. Lett. 2011, 33, 921–927. [Google Scholar] [CrossRef]
- Ahmad, R.; Tripathy, N.; Ahn, M.-S.; Bhat, K.S.; Mahmoudi, T.; Wang, Y.; Yoo, J.-Y.; Kwon, D.-W.; Yang, H.-Y.; Hahn, Y.-B. Highly Efficient Non-Enzymatic Glucose Sensor Based on CuO Modified Vertically-Grown ZnO Nanorods on Electrode. Sci. Rep. 2017, 7, 5715. [Google Scholar] [CrossRef] [PubMed]
- Han, X.; Fang, X.; Shi, A.; Wang, J.; Zhang, Y. An Electrochemical DNA Biosensor Based on Gold Nanorods Decorated Graphene Oxide Sheets for Sensing Platform. Anal. Biochem. 2013, 443, 117–123. [Google Scholar] [CrossRef] [PubMed]
- Liu, Z.; Guo, Y.; Dong, C. A High Performance Nonenzymatic Electrochemical Glucose Sensor Based on Polyvinylpyrrolidone–Graphene Nanosheets–Nickel Nanoparticles–Chitosan Nanocomposite. Talanta 2015, 137, 87–93. [Google Scholar] [CrossRef] [PubMed]


© 2020 by the authors. Licensee MDPI, Basel, Switzerland. This article is an open access article distributed under the terms and conditions of the Creative Commons Attribution (CC BY) license (http://creativecommons.org/licenses/by/4.0/).
Share and Cite
Chalklen, T.; Jing, Q.; Kar-Narayan, S. Biosensors Based on Mechanical and Electrical Detection Techniques. Sensors 2020, 20, 5605. https://doi.org/10.3390/s20195605
Chalklen T, Jing Q, Kar-Narayan S. Biosensors Based on Mechanical and Electrical Detection Techniques. Sensors. 2020; 20(19):5605. https://doi.org/10.3390/s20195605
Chicago/Turabian StyleChalklen, Thomas, Qingshen Jing, and Sohini Kar-Narayan. 2020. "Biosensors Based on Mechanical and Electrical Detection Techniques" Sensors 20, no. 19: 5605. https://doi.org/10.3390/s20195605
APA StyleChalklen, T., Jing, Q., & Kar-Narayan, S. (2020). Biosensors Based on Mechanical and Electrical Detection Techniques. Sensors, 20(19), 5605. https://doi.org/10.3390/s20195605